21st fiscal period
TRANSCRIPT

21-1 Dogenzaka 1-chome, Shibuya-ku, Tokyo https://www.comforia-reit.co.jp/en/
Semi-Annual Repor t for the
21st Fiscal Per iodFrom August 1, 2020 to January 31, 2021
For a Superior Level of Living Comfort
CRR 3282

For a Superior Level of Living ComfortCOMFORIA is the name we have given to the urban rental residences
produced by the Tokyu Land Corporation. The word COMFORIA is a compound that we coined from "comfort," and "ia," a Latin suffix meaning "place."
The idea that residences are not just containers has given birth to our COMFORIA series of rental residences made specifically for people
who wish to live freely and affluently in urban communities.
We invest in and manage the urban exclusive rental residence COMFORIA series, which Tokyu Land Corporation has produced, to maximize our unitholders’ value. Operating revenue ¥ 9, 565 million Number of properties 137 properties
Operating profit ¥ 4, 484 million Acquisition price ¥ 252. 1 billion
Profit ¥ 3, 889 million Appraisal value ¥ 312. 7 billion
Distribution per unit (DPU) ¥5,410 Occupancy rate at the 21st Fiscal Period-end 95.9 %
Total loan to value (LTV) 51.4 % Average occupancy rate 95.1 %
Contents
We would like to express our deepest sympathies to those affected by COVID-19 infections, as well as our sincere hope for their earliest possible recovery.
We are pleased to inform you that Comforia Residential REIT, Inc (the “Investment Corporation”) successfully closed all accounts for the 21st Fiscal Period (from August 1, 2020 to January 31, 2021). We would like to thank all of our unitholders and stake-holders for their continued support and cooperation.
We hereby report on the asset management overview and results for the 21st Fiscal Period.
During the 21st Fiscal Period, we acquired COMFORIA TOYOCHO and three other properties, all located in the Tokyo 23 wards, through borrowings. Furthermore, we sold COMFORIA NISHIMAGOME and one other property in December 2020 in an ef-fort to improve the quality of our portfolio.
As a result, our portfolio as of the end of the 21st Fiscal Period stood at 137 proper-ties, with a total acquisition price of ¥ 252. 1 billion. The average occupancy rate for the 21st Fiscal Period remained generally stable at 95. 1%. The Investment Corpora-tion had ¥ 9, 565 million in operating revenue, ¥ 4, 484 million in operating profit, and ¥ 3, 889 million in profit, all of which exceeded our forecasts, resulting in a distribu-tion per unit (DPU) of ¥ 5, 410.
Furthermore, after the end of the 21st Fiscal Period, we also acquired COMFORIA TAITONEGISHI and two other properties in February 2021 through a public offering, conducted for the eighth consecutive year since listing, as well as cash on hand. Fur-thermore, we acquired COMFORIA OMIYA through cash on hand and sold COMFORIA SHIN-OSAKA in March 2021, resulting in an asset size of 140 properties with a total acquisition price of ¥ 261. 5 billion (as of March 31, 2021). We intend to continue to make selective investments in high-quality properties mainly in the Tokyo 23 wards.
Under our basic policies of “investments in residential properties with stable earnings and high growth potential” and “utilization of the Tokyu Fudosan Holdings Group,” we are carrying out investment in and management of rental residences, mainly in the Tokyo metropolitan area, targeting singles and small families, based on the concept and know-how of the urban rental resi-dence Comforia series, which Tokyu Land Corporation has produced. In the next fiscal period onward, we will continue to aim to achieve stable earnings and ensure the steady growth of our managed assets based on medium- and long-term perspec-tives to maximize unitholders’ value. Your continued support and cooperation are highly appreciated.
Comforia Residential REIT, Inc
Greetings
Financial Highlights
Takehiro IzawaExecutive Director (center)
Koji YamamotoSupervisory Director (left)
Masamichi OhshimaSupervisory Director (right)
1
I.
I. Overview of the Investment Corporation Greetings/Financial Highlights ...................................................................................... 1 Sustainable Growth in Asset Size and DPU .......................................................... 2External Growth Results ..................................................................................................... 4Selective Investment with Portfolio Quality in Mind ....................................... 6Internal Growth Strategy ................................................................................................... 8Feature: Post COVID- 19 Rental Residence Market Forecast ....................... 10Financial Strategy ................................................................................................................. 12Sustainability Initiatives .................................................................................................... 14Portfolio Map .......................................................................................................................... 16Basic Policies ........................................................................................................................... 18
Overview of the Investment Corporation and Asset Management Company ..................................................................................... 19
II. Asset Management Report ........................................................................................ 21III. Financial Section ................................................................................................................ 52
Balance Sheets ....................................................................................................................... 52Statements of Income ....................................................................................................... 54Statements of Changes in Unitholders’ Equity .................................................. 55Statements of Cash Distributions .............................................................................. 56Statements of Cash Flows .............................................................................................. 57
Notes ............................................................................................................................................ 58Supplementary Schedules ............................................................................................. 68Independent Auditor’s Report ..................................................................................... 75
Overview of the Investment Corporation

Future StrategyAim for an asset size
of ¥300 billion while maintaining a
portfolio with properties mainly
in the Tokyo 23 wards
Aim to improve stabilized DPU
Consistently stable occupancy rate
¥4,051
95.9%
¥4,203
96.2%
¥4,268
94.8%
¥4,296
95.2%
¥4,403
95.5%
Distribution per Unit (DPU) (Note 1)
Inclusion in Indices
Occupancy Rate at End of Period
Credit Rating
May 2019 MSCI Japan ESG Select Leaders Index
June 2020 Tokyo Stock Exchange REIT Core Index
AA– (Stable)A+ (Positive)A+ (Stable)
June 2018 FTSE EPRA/NAREITGlobal Real EstateIndex Series - Asia
¥4,339
96.2%
¥4,487
96.3%
¥4,549
96.5%
¥4,681
96.1%
¥4,788
96.7%
¥4,985
96.6%
¥5,180
96.4%
¥5,180
97.0%
¥5,295
96.7%
¥5,309
95.0%
¥5,410
95.9%
71.2 71.2 74.5
122.8
164.4 168.0
187.4 188.5
202.1 206.0
225.9 226.6
245.9252.1
261.5
146.7
116.2
146.5
250
0
200
100
150
achieved approximately 3.7-fold growth
Over around 8 years since listing,
21st Fiscal Period
Acquired COMFORIA TOYOCHO and three other properties and sold two properties
Acquired COMFORIA TAITONEGISHI and three other properties and sold one property
22nd Fiscal Period
Tokyo 23 wards Tokyo metropolitan area/ Other major cities
Tokyo 23 wards
92.2%
Tokyo 23 wards
91.7%Tokyo 23 wards
91.8%
Tokyo 23 wards96.3%
Tokyo 23 wards96.3%
Tokyo 23 wards93.3%
Tokyo 23 wards
92.5%
Tokyo 23 wards
92.9%
Tokyo 23 wards
94.0%
Tokyo 23 wards
93.6%
Tokyo 23 wards
94.3%
Tokyo 23 wards
92.8%
Tokyo 23 wards
90.4%
Tokyo 23 wards
90.4%
Tokyo 23 wards
90.9%
Tokyo 23 ward
90.9%
Tokyo 23 wards
91.0%
Tokyo 23 wards
91.8%
“End of 19th Fiscal Period”
(Ended Jan. 2020)
Listed (Feb. 6, 2013)
“End of 6th Fiscal Period”
(Ended Jul. 2013)
“End of 7th Fiscal Period”
(Ended Jan. 2014)
“End of 8th Fiscal Period”
(Ended Jul. 2014)
“End of 9th Fiscal Period”
(Ended Jan. 2015)
“End of 10th Fiscal Period”
(Ended Jul. 2015)
“End of 11th Fiscal Period”
(Ended Jan. 2016)
“End of 12th Fiscal Period”
(Ended Jul. 2016)
“End of 13th Fiscal Period”
(Ended Jan. 2017)
“End of 14th Fiscal Period”
(Ended Jul. 2017)
“End of 15th Fiscal Period”
(Ended Jan. 2018)
“End of 16th Fiscal Period”
(Ended Jul. 2018)
“End of 17th Fiscal Period”
(Ended Jan. 2019)
“End of 18th Fiscal Period”
(Ended Jul. 2019)
“End of 20th Fiscal Period”
(Ended Jul. 2020)
“End of 21stFiscal Period”
(Ended Jan. 2021)
Future strategy
As of March 31,
2021
(Billions of yen)
During the 21st Fiscal Period, the Investment Corporation acquired four properties in September 2020 and sold two properties in December 2020. Furthermore, after entering the 22nd Fiscal Period, a public offering was implemented in February 2021 and three properties were acquired with funds procured through the public offering as well as cash on hand. In addition, it acquired one property through cash on hand and sold one property in March 2021.
The Investment Corporation will keep promoting external growth by continuing to invest selectively in high-quality properties mainly in Tokyo 23 wards, focusing on the collaboration with our sponsor group, as well as original sourcing by TLC REIT Management Inc., while seeking expansion of the asset size and stable distribution levels.
Selective Investments Mainly in Tokyo 23 Wards (As of March 31, 2021)
Historical Asset Size
(Note 1) Since a four-for-one split of investment units was carried out effective August 1, 2014, the figures for DPU prior to the split are divided by four and rounded off to the nearest whole number.(Note 2) Ratio of Tokyo 23 wards denotes ratio among rental residences.
2 3
Sustainable Growth in Asset Size and DPU

During the 21st Fiscal Period, the Investment Corporation acquired COMFORIA TOYOCHO and three other properties, all located in the Tokyo 23 wards, in September 2020 and sold two properties in December 2020. During the 22nd Fiscal Period, the Investment Corporation acquired three properties at the time of the public offering, and acquired one prop-erty and sold one property in March.
Along with these efforts, the Investment Corporation aimed to improve the quality of its portfolio such as making it younger through acquisition of sponsor-developed properties.
Properties Acquired in 21st Fiscal Period
Properties Acquired in 22nd Fiscal Period (Through public offering)
Acquisition through original route of the Asset Management Company
Original Route
Sponsor-developed properties
Sponsor developed
Address 2-18-8 Misuji, Taito-ku, Tokyo
Nearest station/Distance (on foot)
4-minute walk from Shin-Okachimachi Station on the Toei-Oedo Line, etc.
Ownership Ownership
Completion date August 2019
Rentable units 27 units
Acquisition date September 29, 2020
Acquisition price ¥1,237 million
143 COMFORIA SHIN-OKACHIMACHI
Sponsor developed
Sub-central Tokyo
Address 3-18-15 Negishi, Taito-ku, Tokyo
Nearest station/Distance (on foot)
6-minute walk from Iriya Station on the Tokyo Metro Hibiya Line
Ownership Ownership
Completion date October 2019
Rentable units 90 units
Acquisition date February 1, 2021
Acquisition price ¥3,031 million
147 COMFORIA TAITONEGISHI Sub-central Tokyo
Property Sold in 22nd Fiscal Period
Address 1-21-24 Higashinakajima, Higashiyodogawa-ku, Osaka-shi, Osaka
Sale price ¥3,600 million
Appraisal value ¥3,030 million
Gain on sale (note) ¥1,383 million
Rentable units 133 units
Completion date October 2006
(Note) Difference between sale price and book value (as of the end of 21st FP) is indicated.
54 COMFORIA SHIN-OSAKA Other major cities
Address 2-26-11 Minamisuna, Koto-ku, Tokyo
Nearest station/Distance (on foot)
13-minute walk from Minami Sunamachi station on the Tokyo Metro Tozai Line
Ownership Ownership
Completion date February 2020
Rentable units 140 units
Acquisition date September 29, 2020
Acquisition price ¥3,674 million
145 COMFORIA TOYOCHO
Sponsor developed
Sub-central Tokyo
Sponsor developed
Sponsor developed
Address 1-3-5 Shin-Ohashi, Koto-ku, Tokyo
Nearest station/Distance (on foot)
3-minute walk from Morishita Station on the Toei-Shinjuku Line, etc.
Ownership Ownership
Completion date December 2017
Rentable units 46 units
Acquisition date September 29, 2020
Acquisition price ¥1,222 million
Address 5-1-12 Nishigotanda, Shinagawa-ku, Tokyo
Nearest station/Distance (on foot)
2-minute walk from Fudomae Station on the Tokyu Meguro Line
Ownership Ownership
Completion date February 2020
Rentable units 46 units
Acquisition date September 29, 2020
Acquisition price ¥1,622 million
144 COMFORIA MORISHITA WEST
146 COMFORIA FUDOMAE
Sub-central Tokyo
Sub-central Tokyo
Investment Ratio by Area
End of 20th FP End of 21st FPAfter asset replacement in
22nd FP (March 2021)
Central Tokyo 39. 9 % 38. 9 % 37. 5 %
Sub-central Tokyo 50. 5 % 51. 9 % 52. 9 %
Tokyo metropolitan area 3. 9 % 3. 6 % 5. 2 %
Other major cities 5. 7 % 5. 6 % 4. 4 %
Ratio of Tokyo 23 wards (Rental Residence) 91. 8 % 92. 2 % 91. 7 %
Properties Sold in 21st Fiscal Period
Address 1-9-10 Shioyaki, Ichikawa-shi, Chiba
Sale price ¥805 million
Appraisal value ¥766 million
Gain on sale ¥208 million
Rentable units 48 units
Completion date April 2007
Address 2-35-8 Nishimagome, Ota-ku, Tokyo
Sale price ¥1,261 million
Appraisal value ¥1,110 million
Gain on sale ¥293 million
Rentable units 52 units
Completion date August 2005
46 COMFORIA ICHIKAWAMYODEN 68 COMFORIA NISHIMAGOMETokyo metropolitan area Sub-central Tokyo
As of March 31, 2021
140 properties/¥261.5 billion
End of 20th FP
135 properties¥245.9 billion
End of 21st FP
137 properties¥252.1 billion
Asset replacement
Asset replacement
Sponsor developed
Address 1-13-6 Botan, Koto-ku, Tokyo
Nearest station/Distance (on foot)
3-minute walk from Monzen-nakacho Station on the Tokyo Metro Tozai Line, etc.
Ownership Ownership
Completion date July 2019
Rentable units 47 units
Acquisition date February 1, 2021
Acquisition price ¥1,428 million
148 COMFORIA MONZENNAKACHO SOUTH Sub-central Tokyo
Sponsor developed Address 1-1-4 Nishimagome,
Ota-ku, Tokyo
Nearest station/Distance (on foot)
6-minute walk from Magome Station on the Toei Asakusa Line
Ownership Ownership
Completion date July 2016
Rentable units 111 units
Acquisition date February 1, 2021
Acquisition price ¥2,905 million
149 COMFORIA MAGOME Sub-central Tokyo
Sponsor developed
Property Acquired in 22nd Fiscal Period
Address 3-36-1 Nakacho, Omiya-ku, Saitama-shi, Saitama
Nearest station/Distance (on foot)
7-minute walk from Omiya Station on the JR Keihin-Tohoku Line, etc.
Ownership Ownership
Completion date February 2010
Rentable units 103 units
Acquisition date March 18, 2021
Acquisition price ¥4,420 million
150 COMFORIA OMIYA Tokyo metropolitan area
Original Route
4 5
External Growth Results
15th FP end (Ended Jan. 2018)
(1)5th - 7th
Public Offering
Acquisitions in 16th FP
(Ended Jul. 2018) and after
Dispositions in 16th FP
(Ended Jul. 2018) and after
21st FP end (Ended Jan. 2021)
(2)Differential
(2) - (1)
No. of Properties 111 19 14 7 137 26
Asset Size (millions of yen)
188, 536 40, 986 28, 506 5, 878 252, 150 63, 613
Tokyo 23 Wards Ratio (Rental Residence)
90. 4% 91. 1% 90. 5% 21. 1% 92. 2% 1. 8%
Avg. Walking Distance (Rental Residence)
4. 9 min. 4. 9 min. 5. 6 min. 5. 9 min. 4. 9 min. –
¥1,507million
Total Capital Gains Resulting
from Asset Replacement
¥947million
Unitholder Return
Accumulated Internal Reserve
A
B
A B
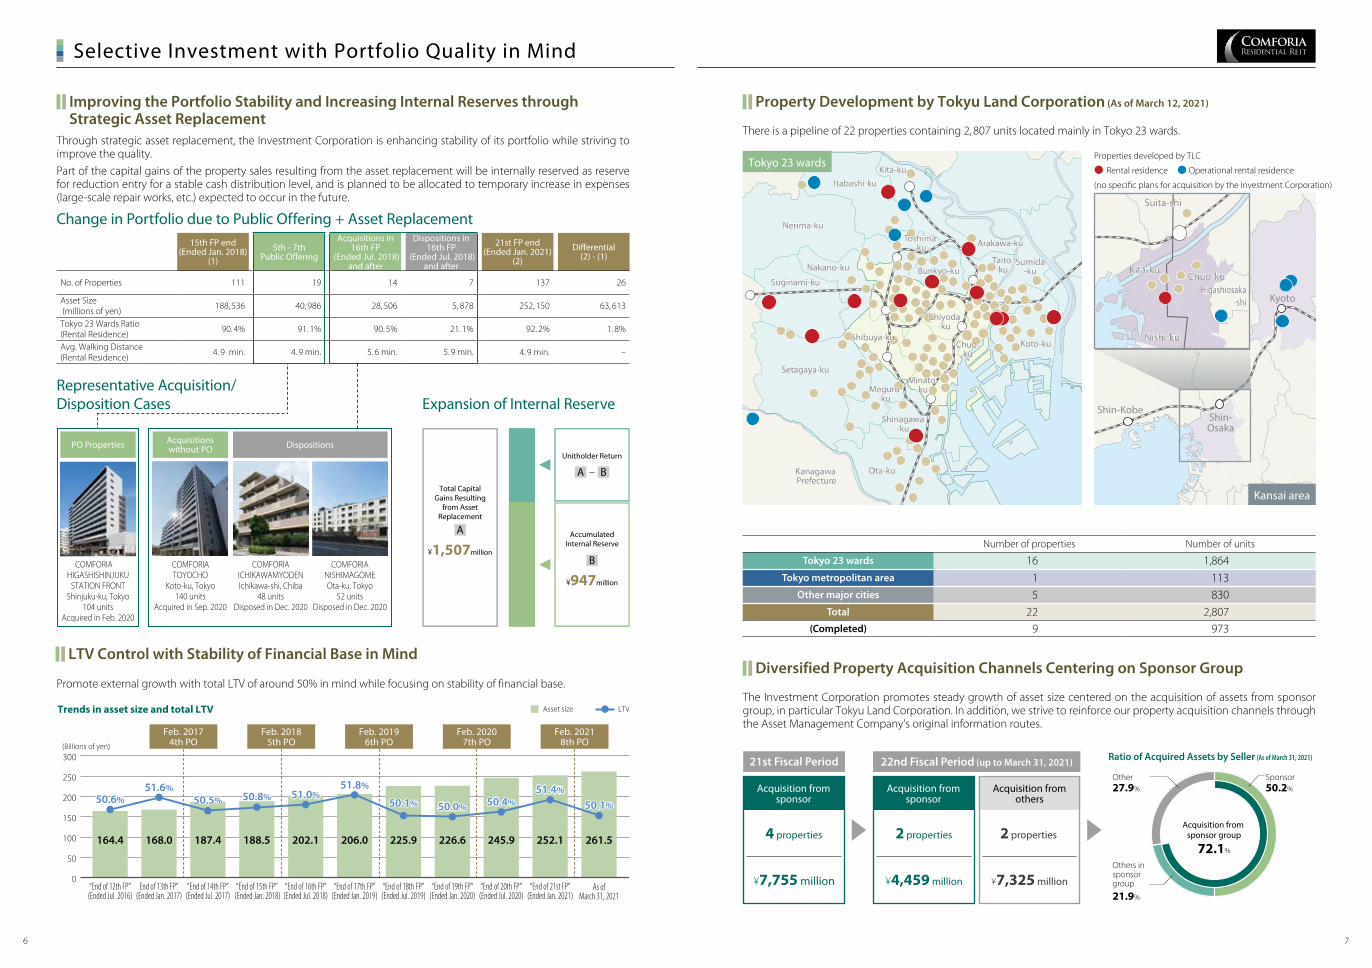
Through strategic asset replacement, the Investment Corporation is enhancing stability of its portfolio while striving to improve the quality.
Part of the capital gains of the property sales resulting from the asset replacement will be internally reserved as reserve for reduction entry for a stable cash distribution level, and is planned to be allocated to temporary increase in expenses (large-scale repair works, etc.) expected to occur in the future.
There is a pipeline of 22 properties containing 2, 807 units located mainly in Tokyo 23 wards.
The Investment Corporation promotes steady growth of asset size centered on the acquisition of assets from sponsor group, in particular Tokyu Land Corporation. In addition, we strive to reinforce our property acquisition channels through the Asset Management Company’s original information routes.
Number of properties Number of units
Tokyo 23 wards 16 1,864Tokyo metropolitan area 1 113
Other major cities 5 830Total 22 2,807
(Completed) 9 973
Promote external growth with total LTV of around 50% in mind while focusing on stability of financial base.
COMFORIA HIGASHISHINJUKU
STATION FRONTShinjuku-ku, Tokyo
104 unitsAcquired in Feb. 2020
COMFORIA TOYOCHO
Koto-ku, Tokyo140 units
Acquired in Sep. 2020
COMFORIA ICHIKAWAMYODEN Ichikawa-shi, Chiba
48 unitsDisposed in Dec. 2020
COMFORIA NISHIMAGOMEOta-ku, Tokyo
52 unitsDisposed in Dec. 2020
PO Properties Acquisitions without PO Dispositions
Improving the Portfolio Stability and Increasing Internal Reserves through Strategic Asset Replacement
Property Development by Tokyu Land Corporation (As of March 12, 2021)
Diversified Property Acquisition Channels Centering on Sponsor Group LTV Control with Stability of Financial Base in Mind
Change in Portfolio due to Public Offering + Asset Replacement
Representative Acquisition/ Disposition Cases Expansion of Internal Reserve
�����������������
�������������
�
�
��
�
Trends in asset size and total LTV
�������������������������� ������
��������������������������������
�������������������������� ������
���������������������������������
������������������������� ������
���������������������������������
�������������������������� ������
���������������������������������
�������������������������� ������
���������������������������������
��������������������
164.4 168.0 187.4 188.5 202.1 206.0 225.9 226.6 245.9 252.1 261.5
Feb. 20174th PO
Feb. 20185th PO
Feb. 20196th PO
Feb. 20207th PO
Feb. 20218th PO
51.4%
50.1%50.6% 50.5% 50.8% 51.0%
50.1% 50.0% 50.4%51.4%
50.1%50.6%
51.6%50.5% 50.8% 51.0%
51.8%
50.1% 50.0% 50.4%
������������������������������ �������������������������
������������������������������
�������
72.1�
50.2�
�����������������������
21.9�
������27.9�
21st Fiscal Period
Acquisition from sponsor
4 properties
¥7,755 million
22nd Fiscal Period (up to March 31, 2021)
Acquisition from sponsor
2 properties
¥4,459 million
Acquisition from others
2 properties
¥7,325 million
��������������
����������������
��������������
������������������
����������������
���������������� �����
����������
������� �
Bunkyo-kuBunkyo-kuBunkyo-kuTaito-ku
Taito-ku
Taito-ku
Sumida-ku
Sumida-ku
Sumida-ku
Koto-kuKoto-kuKoto-ku
Shinagawa-ku
Shinagawa-ku
Shinagawa-ku
Meguro-ku
Meguro-ku
Meguro-ku
Ota-kuOta-kuOta-ku
Setagaya-kuSetagaya-kuSetagaya-ku
Kanagawa PrefectureKanagawa PrefectureKanagawa Prefecture
Nakano-kuNakano-kuNakano-ku
Toshima-ku
Toshima-ku
Toshima-ku
Itabashi-kuItabashi-kuItabashi-ku
Arakawa-kuArakawa-kuArakawa-ku
Kita-kuKita-kuKita-ku
Nerima-kuNerima-kuNerima-ku
Suginami-kuSuginami-kuSuginami-ku
Chiyoda-ku
Chiyoda-ku
Chiyoda-ku
Chuo-ku
Chuo-ku
Chuo-ku
Minato-ku
Minato-ku
Minato-ku
Shibuya-kuShibuya-kuShibuya-ku
Properties developed by TLC
● Rental residence ● Operational rental residence
(no specific plans for acquisition by the Investment Corporation)
Kansai area
Tokyo 23 wards
6 7
Selective Investment with Portfolio Quality in Mind
���������������������� �������������
��������������������� �������������
�����������������������������
��������� ����������������������������� ��������������� ������
���������������������������
�������������������������� ������
���������������������������
(�)��� ���� ��������� ��� ���� ��� ���� ��������� ��� ����
���������������������
����������
���������������������
����������
(�)
������������� ����������������� ������ ���������������� ���� �����������
�����
13,230
��������������
92.2%���� ���������40.4�
������ ���51.9�
��������� ���������� ��2.0�
���� ����� �������5.8�
��������� �������������
4.9�����
������������60.6�
����������34.7�
��� ������4.7�
������������ �� �� ��� ������� ����������������� ������� �� ��
������ ������
13,226
������
13,205
������
13,192
�����
�����������������������
�����������������������
�����������������������
(�)
4.6%5.7%
3.0%
�����������������������
�����������������������
�����������������������
����������������������
�����������������������
��������������������
����������������������
�����������������������
��������������������
����������������������
�����������������������
��������������������
8.3%
1.5%
3.7%
7.9%
��������������������� ��������������������������������� ��
�
�
�
�
�
��
6.8%
3.4%
(�)
��
��
���
��
��
���
Total portfolio
96.7% 97.1%95.9% 95.2% 94.9% 95.0% 94.6% 94.5% 94.8% 95.2% 95.6% 95.9%
97.0%
�����������������������
1.0%
������
������
������
������
13,181 13,163 13,175
�
��
��
�
���
�
��
��
�
�����������
0.0%
���������98.5%
��������1.5%
27.6%
72.4%
0.0%
79.6%
0.0%
18.6%
81.4%
0.0%
��������27.0%
��������13.8%
��������59.3%
90.1%
4.1%5.8%
92.7%
4.8%2.5%
62.5%
7.3%
30.2%
20.4%
Mar. Apr. MayJan. 2020 Feb. Jun. Jul. Jan.
2021Aug. Sep. Oct. Nov. Dec.
������� 20th FP 21st FP
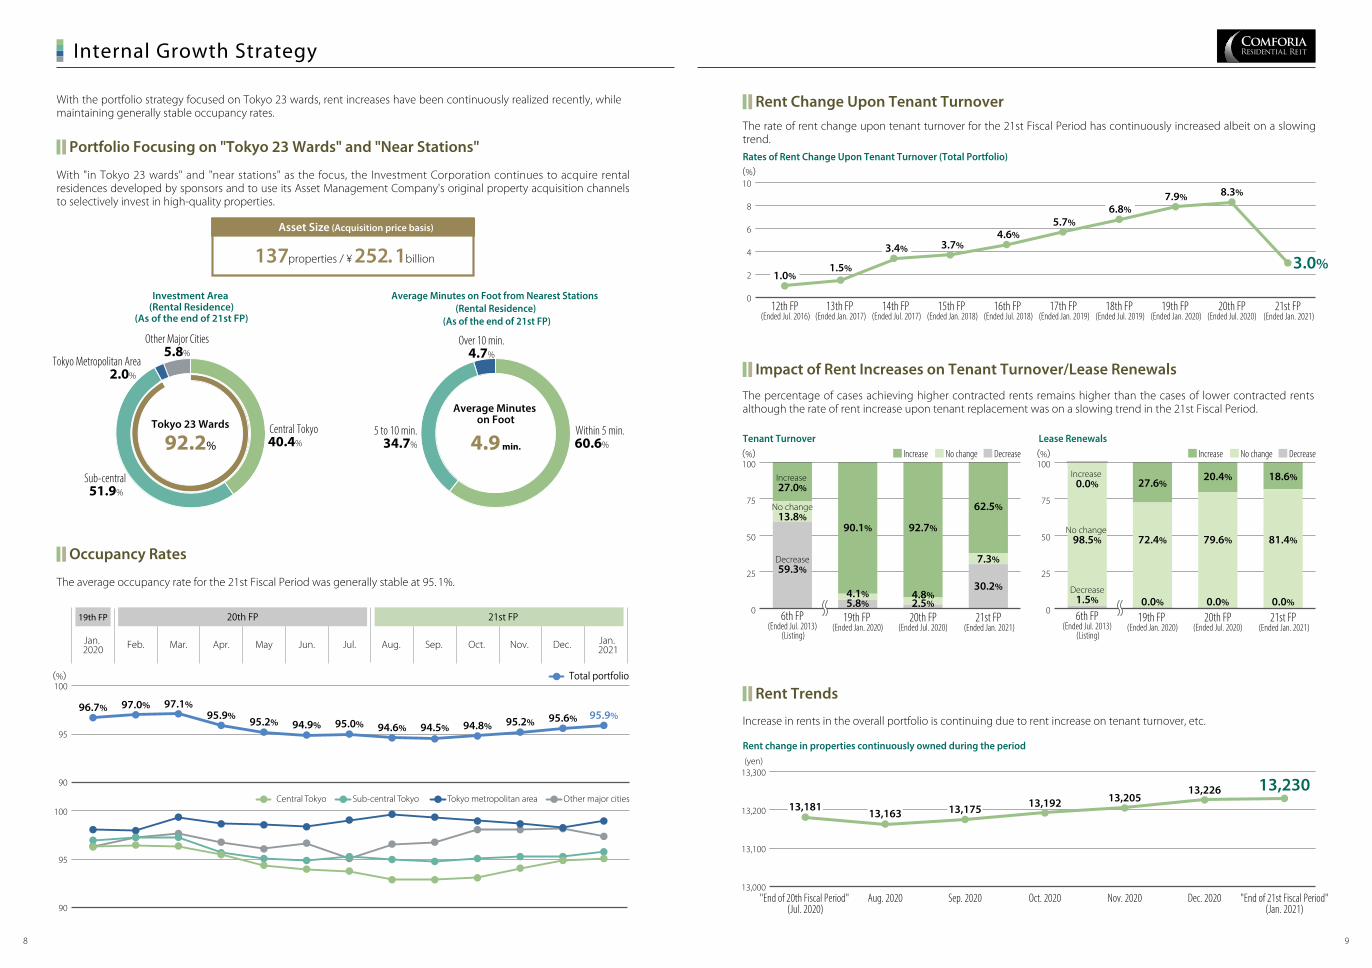
With the portfolio strategy focused on Tokyo 23 wards, rent increases have been continuously realized recently, while maintaining generally stable occupancy rates.
Portfolio Focusing on "Tokyo 23 Wards" and "Near Stations"
With "in Tokyo 23 wards" and "near stations" as the focus, the Investment Corporation continues to acquire rental residences developed by sponsors and to use its Asset Management Company's original property acquisition channels to selectively invest in high-quality properties.
Rent Change Upon Tenant Turnover
Impact of Rent Increases on Tenant Turnover/Lease Renewals
The percentage of cases achieving higher contracted rents remains higher than the cases of lower contracted rents although the rate of rent increase upon tenant replacement was on a slowing trend in the 21st Fiscal Period.
The rate of rent change upon tenant turnover for the 21st Fiscal Period has continuously increased albeit on a slowing trend.
Rent Trends
Increase in rents in the overall portfolio is continuing due to rent increase on tenant turnover, etc.
Occupancy Rates
The average occupancy rate for the 21st Fiscal Period was generally stable at 95. 1%.
Asset Size (Acquisition price basis)
137properties / ¥ 252.1billion
8 9
Internal Growth Strategy
��������������������������������������������
���������������� ��������
�������������������������������������� ��
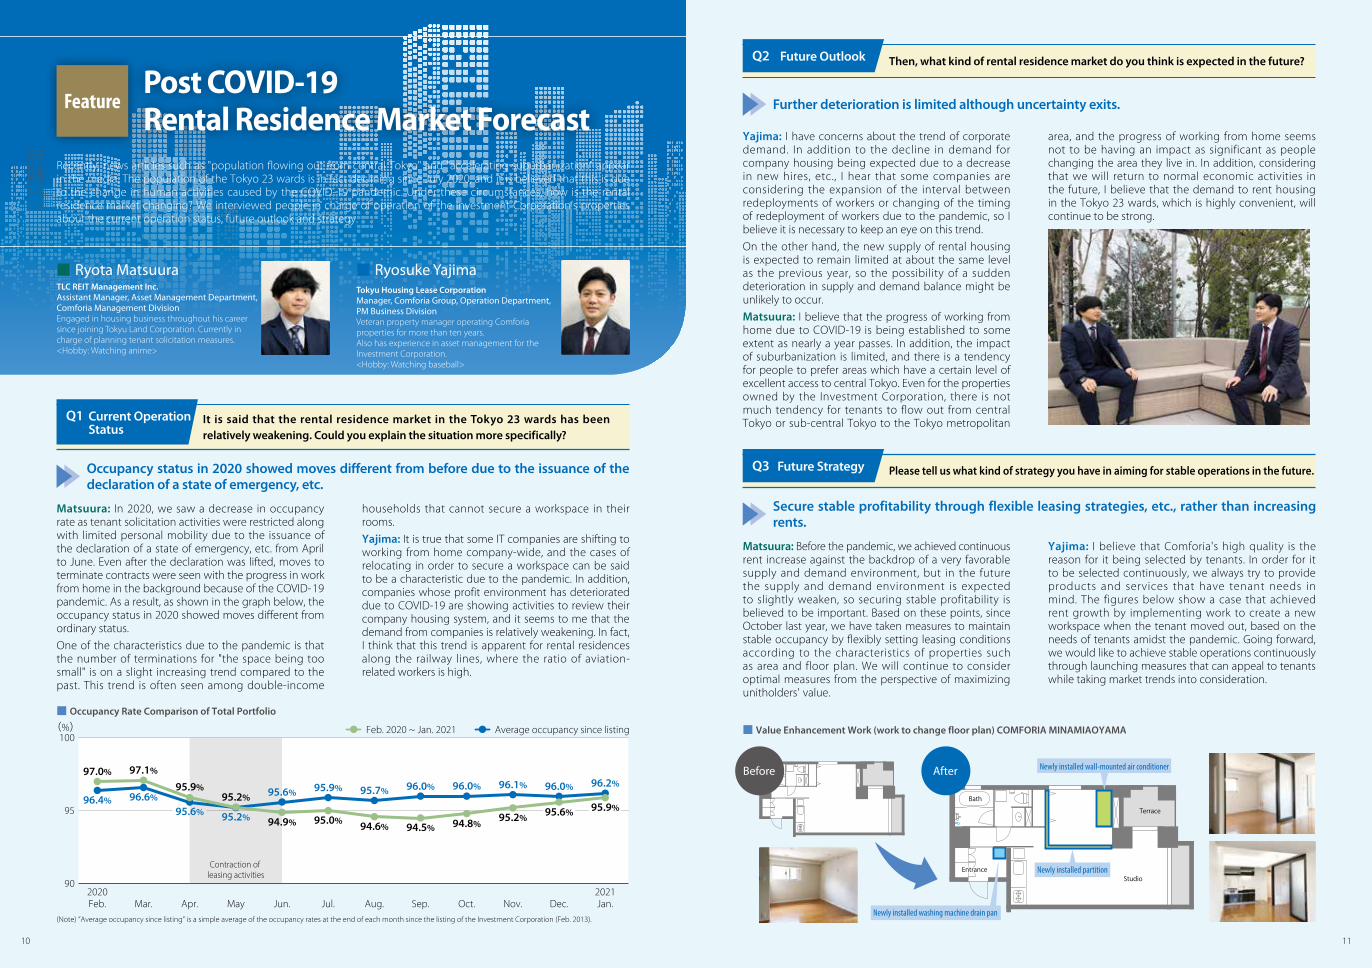
Matsuura: In 2020, we saw a decrease in occupancy rate as tenant solicitation activities were restricted along with limited personal mobility due to the issuance of the declaration of a state of emergency, etc. from April to June. Even after the declaration was lifted, moves to terminate contracts were seen with the progress in work from home in the background because of the COVID-19 pandemic. As a result, as shown in the graph below, the occupancy status in 2020 showed moves different from ordinary status.
One of the characteristics due to the pandemic is that the number of terminations for "the space being too small" is on a slight increasing trend compared to the past. This trend is often seen among double-income
Yajima: I have concerns about the trend of corporate demand. In addition to the decline in demand for company housing being expected due to a decrease in new hires, etc., I hear that some companies are considering the expansion of the interval between redeployments of workers or changing of the timing of redeployment of workers due to the pandemic, so I believe it is necessary to keep an eye on this trend.
On the other hand, the new supply of rental housing is expected to remain limited at about the same level as the previous year, so the possibility of a sudden deterioration in supply and demand balance might be unlikely to occur.
Matsuura: I believe that the progress of working from home due to COVID-19 is being established to some extent as nearly a year passes. In addition, the impact of suburbanization is limited, and there is a tendency for people to prefer areas which have a certain level of excellent access to central Tokyo. Even for the properties owned by the Investment Corporation, there is not much tendency for tenants to flow out from central Tokyo or sub-central Tokyo to the Tokyo metropolitan
Matsuura: Before the pandemic, we achieved continuous rent increase against the backdrop of a very favorable supply and demand environment, but in the future the supply and demand environment is expected to slightly weaken, so securing stable profitability is believed to be important. Based on these points, since October last year, we have taken measures to maintain stable occupancy by flexibly setting leasing conditions according to the characteristics of properties such as area and floor plan. We will continue to consider optimal measures from the perspective of maximizing unitholders' value.
■ Ryota MatsuuraTLC REIT Management Inc.Assistant Manager, Asset Management Department, Comforia Management DivisionEngaged in housing business throughout his career since joining Tokyu Land Corporation. Currently in charge of planning tenant solicitation measures.<Hobby: Watching anime>
■ Ryosuke YajimaTokyu Housing Lease CorporationManager, Comforia Group, Operation Department, PM Business DivisionVeteran property manager operating Comforia properties for more than ten years.Also has experience in asset management for the Investment Corporation.<Hobby: Watching baseball>
households that cannot secure a workspace in their rooms.
Yajima: It is true that some IT companies are shifting to working from home company-wide, and the cases of relocating in order to secure a workspace can be said to be a characteristic due to the pandemic. In addition, companies whose profit environment has deteriorated due to COVID-19 are showing activities to review their company housing system, and it seems to me that the demand from companies is relatively weakening. In fact, I think that this trend is apparent for rental residences along the railway lines, where the ratio of aviation-related workers is high.
area, and the progress of working from home seems not to be having an impact as significant as people changing the area they live in. In addition, considering that we will return to normal economic activities in the future, I believe that the demand to rent housing in the Tokyo 23 wards, which is highly convenient, will continue to be strong.
Yajima: I believe that Comforia's high quality is the reason for it being selected by tenants. In order for it to be selected continuously, we always try to provide products and services that have tenant needs in mind. The figures below show a case that achieved rent growth by implementing work to create a new workspace when the tenant moved out, based on the needs of tenants amidst the pandemic. Going forward, we would like to achieve stable operations continuously through launching measures that can appeal to tenants while taking market trends into consideration.
It is said that the rental residence market in the Tokyo 23 wards has been relatively weakening. Could you explain the situation more specifically?
Then, what kind of rental residence market do you think is expected in the future?
Further deterioration is limited although uncertainty exits.
After
■ Value Enhancement Work (work to change floor plan) COMFORIA MINAMIAOYAMA
Current Operation Status
Q1
Future OutlookQ2
Please tell us what kind of strategy you have in aiming for stable operations in the future.Future StrategyQ3
Secure stable profitability through flexible leasing strategies, etc., rather than increasing rents.
Occupancy status in 2020 showed moves different from before due to the issuance of the declaration of a state of emergency, etc.
Recently, news articles such as "population flowing out from central Tokyo" and "accelerating suburbanization" appear in the media. The population of the Tokyo 23 wards is in fact declining since July 2020, and it is believed that this is due to the change in human activities caused by the COVID-19 pandemic. Under these circumstances, how is the rental residence market changing? We interviewed people in charge of operation of the Investment Corporation’s properties about the current operation status, future outlook and strategy.
Post COVID-19 Rental Residence Market Forecast
Feature
90
95
100
���������������������������������
Feb. Jan.2020 2021
Aug. Sep. Oct. Nov. Dec.Mar. Jul.Jun.MayApr.
97.0% 97.1%
95.9%95.2%
94.9% 95.0% 94.6% 94.5% 94.8%95.2%
95.9%96.4% 96.6%
95.2%
95.6% 95.9% 95.7% 96.0% 96.0% 96.1% 96.0% 96.2%
Feb. 2020 ~ Jan. 2021 Average occupancy since listing
95.6%95.6%
(%)■ Occupancy Rate Comparison of Total Portfolio
Before
(Note) “Average occupancy since listing” is a simple average of the occupancy rates at the end of each month since the listing of the Investment Corporation (Feb. 2013).
10 11

The Investment Corporation will carry out equity financing (additional issuance of investment units) and debt financing (borrowings of funds and issuance of investment corporation bonds) while paying attention to financial soundness and earnings stability. Furthermore, the Investment Corporation will control its balance sheets by maintaining an LTV (interest-bearing debt) (%) level to secure funds.
Interest-Bearing Debt
Loan Balances
Diversification of Repayment Dates
The expected repayment of debts and investment corporation bonds as of January 31, 2021 are as follows:
MUFG Bank, Ltd. Sumitomo Mitsui Trust Bank, Limited Mizuho Bank, Ltd.Development Bank of Japan Inc. Sumitomo Mitsui Banking Corporation Mizuho Trust & Banking Co., Ltd. The Norinchukin Bank The Bank of Fukuoka, Ltd. Shinkin Central Bank Kiraboshi Bank, Ltd. Resona Bank, Ltd. The 77 Bank, Ltd. Daishi Hokuetsu Bank, LtdTaiyo Life Insurance Company Nippon Life Insurance Company
■■■■■■■■■■■■■■■
34,92023,51523,08019,83010,005
3,9853,7853,2852,2851,0001,000
960500500500
129,150Total
Loan balance (millions of yen)Lender
27.0%
18.2%
17.9%
15.4%
7.7%
0.7% 0.4%0.4%
0.4%
0.8%0.8%
1.8%
3.1%2.9%2.5%
The Investment Corporation’s loan balances as of January 31, 2021 are as follows:
Credit Rating (As of January 31, 2021)
Rating agency Rating category Rating Outlook
Japan Credit Rating Agency, Ltd. Long-term issuer rating AA- Stable
End of 19th Fiscal Period (ended January 31, 2020)
End of 20th Fiscal Period (ended July 31, 2020)
End of 21st Fiscal Period (ended January 31, 2021)
LTV (Note) 50.0% 50.4% 51.4%
Long-term debt ratio 92.9% 82.6% 81.4%
Fixed-interest debt ratio 93.6% 90.4% 91.2%
Average maturity 4.2 years 4.0 years 4.2 years
Weighted avg. interest rate 0.60% 0.58% 0.58%
(Note) Interest-bearing debt balance/total assets
0
5,000
10,000
15,000(Millions of yen)
Amount of credit limit in commitment line: ¥13.5 billion3,000
10,5457,800 6,520 5,860 2,000
2,200
3,000
10,54512,800
6,5609,400 9,270 9,650
8,500 7,0509,250
3,395
12,800
1,000
7,800 6,5609,400
1,000 1,000
6,520 5,8609,270 9,650
8,500 7,0509,250
2,000
2,200 3,395 1,350 3,000 3,7003,000 3,7006,800 5,5006,800
1,500 5,500 1,500 1,500
Existing loans Borrowings in the 21st period 1st ~ 8th unsecured bonds
22ndFP
23rdFP
24thFP
25thFP
26thFP
27thFP
28thFP
29thFP
30thFP
31stFP
41stFP
32ndFP
33rdFP
34thFP
35thFP
37thFP
39thFP
36thFP
40thFP
38thFP
46thFP
47thFP
48thFP
12
Financial Strategy

Environmental Certification
■ Participation in GRESB Real Estate Assessment The Investment Corporation has participated in the GRESB Real Estate
Assessment since 2018. We will continue to promote sustainability
initiatives through the participation, and aim to further improve its rating in the assessment.
The Index is designed to target companies with high Environment, Social and Governance performance selected from the MSCI Japan
Investable Market Index (IMI) Top 700 Index.
Environment
Social
Governance
Relevant SDG Goals
Relevant SDG Goals
Relevant SDG Goals
Status/Initiatives
Status/Initiatives
Status/Initiatives
7 Affordable and Clean Energy
11 12Responsible Consumption and Production
12Responsible Consumption and Production
12Responsible Consumption and Production
16Peace, Justice and Strong Institutions
Selected by the Government Pension Investment Fund (GPIF) as one of their indices for their passive investment.
Continuously Adopted in MSCI Japan ESG Select Leaders Index
E
S
G
Establishment of the Environment Management System (EMS)
The Asset Management Company has established its own environment management system (EMS) in order to set environmental target, perceive its results, control budgets and make improvements concerning energy consumption, CO2 emissions, water consumption and waste generation. We will promote the reduction of the environmental load with implementing of the PDCA cycle.
Initiatives in Local Communities
■Installation of Donation-Type Vending Machines
We have installed disaster response vending machines at some of the properties owned by the Investment Corporation. These machines can provide drinks to victims of large-scale disasters.
Initiatives to Improve Tenant Satisfaction
■Conduct Tenant Satisfaction Survey Every year we carry out a questionnaire survey of the residents of the
Comforia series, on the residents’ satisfaction and requests. Based on the opinions and requests of residents, we take action with the aim of providing better services.
Initiatives in Improving Waste Management
The Investment Corporation reduces environmental impact at properties through separate disposal of waste in cooperation with the management company. It is also making every effort to improve resident satisfaction by taking measures to reduce odor at garbage collection points.
■ DBJ Green Building Certification
Initiatives for Improving Energy Efficiency
In conformity to the Act on the Rational Use of Energy (Energy Conservation Law), we set an annual average cutting target of 1% in energy use intensity for the entire portfolio and also for each property in the medium- to long-term.
■ Green-lease Provisions From the perspective of environmental friendliness, to reduce
environmental load in collaboration with residents, we insert green-lease provisions in lease agreements, which are related to energy use and appropriate disposal of waste.
■ Green Procurement Standards The Investment Corporation will promote the reduction of the
environmental load in cooperation with suppliers, etc. by establishing the Green Procurement Standards which are related to the procurement of environment-friendly materials, etc.
■ Switching to LED Lights in Common Areas/Replacing Air Conditioners in Exclusive Areas
The Investment Corporation is making progress in reduction of power consumption and environmental impact.
Implementation of LED lighting
Initiatives for Renewable Energy
The Investment Corporation utilizes renewable energy from solar power (introduced in COMFORIA NAKAOCHIAI).
COMFORIA TOYOCHO COMFORIA HIGASHISHINJUKU STATION FRONT
COMFORIA SHIBUYA WEST COMFORIA KAMATA
Properties with exceptionally high environmental & social awareness
Properties with the best class environmental & social awareness
COMFORIA SHINJUKU EASTSIDE TOWER
■Disaster Provision Warehouse and Manhole Toilets
Established a disaster provision warehouse and manhole toilets for neighboring residents and workers in preparation for a disaster.
■Open Space Used as a walkway for neighboring residents and commuters.
■Security of the Local Community There is a police box
contributing to the security of the local community.
Change in Asset Management Fee SystemIntroduce incentives for further improvement of unitholders' value and enhance linkage with the interests of unitholders.
Decision-Making Flow in Acquisition of Assets
The asset management company of the Investment Corporation has built a governance framework that gives priority to compliance and is pouring its efforts in prevention of conflict of interest, risk management and legal compliance.
Aligning Interests Between Unitholders and the Sponsor
In the public offering held in Feb. 2021, the sponsor acquired 2,137 units, which was 10% of the number of issuing units.
Even in terms of capital relationship, the Investment Corporation aims to make a strong relationship with the
sponsor and to achieve the improvement of mutual interests by aligning the
interests of the unitholders to that of the sponsor.
Sponsor’s investment ratio
9.0%(as of March 12, 2021)
(Note 1) Deliberation and resolution by the Compliance Committee as well as prior approval by the Investment Corporation’s board of directors will be required for acquiring assets, etc. in case of related-party transactions and other necessary cases.
(Note 2) If the candidate acquisition asset is a healthcare facility, advisory from external experts related to healthcare facilities shall be sought. Furthermore, discussions shall be held upon receiving a report on the content of reports, etc. created by external experts related to healthcare facilities and, if necessary, the Investment Committee shall be at-tended by the concerned external experts as observers and their opinions shall be heard.
●���������������������������� ���������������� ����� ����������� �
● ��������������������������� ����������� ���� ● ����������������������������� �������������������� ���� ● �������������� ● ����������������������� �����������������
● � ����� ���������������� ������������� �● � ����� ���������������� �������������
●������������ ��� ●���������������������� ●�����������������
����������������
Act����������Plan
��� ��������������������
Check���������
Do
Sustainable Cities and Communities
Proposal by responsible department▼
Approval by compliance officer▼ ▼
▼ ▼
Compliance Committee deliberation and resolution (Note 1)
▼Investment Committee deliberation and resolution (Note 2)
▼Approval by each Chief Division Officer
▼ ▼Prior approval by the Investment
Corporation’s board of directors (Note 1)Report to Investment
Corporation▼ ▼
Report to the Board of Directors
In case of related-party transactions and other necessary cases
In case of related-party transactions and other necessary cases
Before change Current
Management feeⅠ(fee linked to total assets)
Total assets at the end of previous fiscal period × 0. 3% (annual rate)
Total assets at the end of previous fiscal period × 0. 2% (annual rate)
Management feeⅡ(fee linked to profit)
Ordinary CF × 3. 0% Ordinary CF × 5. 4%
Management fee Ⅲ(acquisition and disposition fee)
Property acquisition/disposition price× 1. 0%( 0. 5% in the case of transactions
with related parties)
Property acquisition/disposition price× 1. 0%( 0. 5% in the case of transactions with
related parties (excluding warehousing))
Newly established
Management feeⅤ(incentive)
– Ordinary CF × growth rate of ordinary CF per unit × 10%However, no fee will occur when the value is negative
Enhancing the linkage between the interests of unitholders and
asset management fees through rebalancing
Strengthening incentives for growth of AUM and
distributions
14 15
Sustainability Initiatives

COMFORIA SHIN-OKACHIMACHI143 COMFORIA
MORISHITA WEST144
COMFORIA TOYOCHO145 COMFORIA
FUDOMAE146
COMFORIAMONZENNAKACHO SOUTH148COMFORIA
TAITONEGISHI147 COMFORIAMAGOME149 COMFORIA
OMIYA150
Acquired in the 21st Fiscal Period
Acquired in the 22nd Fiscal Period
Central Tokyo
Sub-central Tokyo
Tokyo metropolitan area
Other major cities
1194
118
114
108121
116
115
100
107
106
81
82
27
4176
840 4
203
971
70
3823
67 31
6160
48
30 165015
1786
97
99
1826
6972
73
274
56 57491
5814
80
59
37
10
77
44
7
391391
9089
83
85
92
88
93 87
75 2264
21
635 62
3251
43
65 35
36 12
66
53
52
29 34 3355
112
6
45
47
8498120 103
135
138
139
105113
104
126
133
96
119
123 124
125
127
128
129
130
131
134
137145
140
141
142
143
144
146
147
148
149
TokyoTokyo
ChibaChiba
KanagawaKanagawa
SaitamaSaitama
95 101
102
150
109 110 111 117 136
122
132
Tokyo
Ueno
Nishifunabashi
Shinagawa
Shibuya
Shinjuku
Yokohama
Kichijoji
Ikebukuro
Akabane
Bunkyo-kuBunkyo-ku
Taito-ku
Taito-ku Sumida-kuSumida-ku
Koto-kuKoto-ku
Shinagawa-kuShinagawa-kuMeguro-kuMeguro-ku
Ota-kuOta-ku
Setagaya-kuSetagaya-ku
Nakano-kuNakano-ku
Toshima-ku
Toshima-ku
Itabashi-kuItabashi-ku
Arakawa-kuArakawa-ku
Kita-kuKita-ku
Nerima-kuNerima-ku
Adachi-kuAdachi-ku
Katsushika-kuKatsushika-ku
Edogawa-kuEdogawa-ku
Suginami-kuSuginami-ku
Chiyoda-kuChiyoda-kuChiyoda-ku
Chuo-kuChuo-kuChuo-ku
Minato-ku
Minato-ku
Minato-ku
Shinjuku-ku
Shinjuku-ku
Shinjuku-ku
Shibuya-kuShibuya-kuShibuya-ku
The Investment Corporation manages assets with superb accessibility located mainly in the Tokyo 23 wards.
Central Tokyo 48 properties
Tokyo metropolitan area 6 properties
Other major cities 8 properties
Total
140 properties
Sub-central Tokyo 78 properties
5 COMFORIA BUNKYOKASUGA
6 COMFORIA ASAKUSAMATSUGAYA
7 COMFORIA NISHIOI
8 COMFORIA NAKANO
9 COMFORIA SHIMOKITAZAWA
10 COMFORIA NISHIKAMATA
11 COMFORIA OYAMA
12 COMFORIA KIYOSUMISHIRAKAWA SOUTH
13 COMFORIA KOMAZAWA
21 COMFORIA KOISHIKAWA
22 COMFORIA SENGOKU
23 COMFORIA DAIKANYAMAAOBADAI
27 COMFORIA IKEBUKURO
29 COMFORIA RYOGOKUISHIWARA
32 COMFORIA ASAKUSABASHI DEUX
33 COMFORIA OSHIAGE
34 COMFORIA HONJOAZUMABASHI
35 COMFORIA KIYOSUMISHIRAKAWA TROIS
36 COMFORIA MONZENNAKACHO
37 COMFORIA HIMONYA
38 COMFORIA MISYUKU
39 COMFORIA GAKUGEIDAIGAKU
40 COMFORIA HIGASHINAKANO DEUX
41 COMFORIA HIGASHIIKEBUKURO WEST
43 COMFORIA RYOGOKU DEUX
44 COMFORIA OMORI DEUX
45 COMFORIA MACHIYA
51 COMFORIA ASAKUSABASHI
52 COMFORIA RYOGOKU SOUTH
53 COMFORIA TOYOSU
55 COMFORIA SUMIDA-TACHIBANA
62 COMFORIA UENOHIROKOJI
63 COMFORIA KASUGATOMISAKA
64 COMFORIA HONKOMAGOME
65 COMFORIA MORISHITA
66 COMFORIA KIBAKOEN
67 COMFORIA MEGURO CHOJAMARU
75 COMFORIA HIGASHIIKEBUKURO EAST
76 COMFORIA HIGASHIIKEBUKURO
82 COMFORIA KOMABA
87 COMFORIA KINSHICHO
88 COMFORIA MINAMISUNAMACHI
89 COMFORIA HIGASHISHINAGAWA
90 COMFORIA MEGUROYAKUMO
91 COMFORIA YOGA
94 COMFORIA ITABASHINAKAJUKU
97 COMFORIA SHINAGAWA EAST
99 COMFORIA OJIMA
100 COMFORIA OMORI TROIS
106 COMFORIA BUNKYOHAKUSAN
107 COMFORIA KAMATA
108 COLLEGE COURT HACHIMANYAMA
114 COMFORIA UENOIRIYA
115 COMFORIA IKEJIRI
116 COMFORIA SETAGAYAKAMIUMA
118 COMFORIA AKABANEIWABUCHI
119 COMFORIA RYOGOKU TROIS
121 COLLEGE SQUARE HACHIMANYAMA
123 COMFORIA KINSHICHO DEUX
124 COMFORIA KAMEIDO SOUTH
125 COMFORIA SHIBUYA WEST
127 COMFORIA ASAKUSAKOMAGATA
128 COMFORIA OMORIKASHIMA
129 COMFORIA OMORIMACHI
130 COMFORIA KAMIIKEDAI
131 CAMPUS VILLAGE SHIINAMACHI
134 COMFORIA TAKINOGAWA
137 COMFORIA KIBASHINSUIKOEN
140 COMFORIA NISHIMAGOME HILLSIDE
141 COMFORIA IKEBUKURO DEUX
142 COMFORIA NARIMASU
143 COMFORIA SHIN-OKACHIMACHI
144 COMFORIA MORISHITA WEST
145 COMFORIA TOYOCHO
146 COMFORIA FUDOMAE
147 COMFORIA TAITONEGISHI
148 COMFORIA MONZENNAKACHO SOUTH
149 COMFORIA MAGOME
1 COMFORIA NIHONBASHI NINGYOCHO
2 COMFORIA WASEDA
3 COMFORIA SHIMOOCHIAI
4 COMFORIA HIGASHINAKANO
14 COMFORIA GINZA EAST
15 COMFORIA AZABUDAI
16 COMFORIA SHIBAKOEN
17 COMFORIA NISHIAZABU
18 COMFORIA MINAMIAOYAMA
20 COMFORIA NISHIWASEDA
26 COMFORIA HARAJYUKU
30 COMFORIA MITA NORTH
31 COMFORIA SHIBAURA BOWHOUSE
48 COMFORIA SHIROKANETAKANAWA
49 COMFORIA NIHONBASHI NINGYOCHO EAST
50 COMFORIA ATAGO
56 COMFORIA KUDAN
57 COMFORIA NIHONBASHI NINGYOCHO NORTH
58 COMFORIA SHINKAWA
59 COMFORIA AKASAKA
60 COMFORIA MITA EAST
61 COMFORIA SHIBAURA CANAL
69 COMFORIA KITASANDO
70 COMFORIA YOYOGIUEHARA
71 COMFORIA SASAZUKA
72 COMFORIA SHINJUKUGYOENⅡ73 COMFORIA ICHIGAYAYANAGICHO
74 COMFORIA KAGURAZAKA
80 COMFORIA NIBANCHO
81 COMFORIA NISHISHINJUKU
83 COMFORIA KANDAJINBOCHO
84 COMFORIA NIHONBASHI
85 COMFORIA TAMACHI
86 COMFORIA AZABUJUBAN
92 COMFORIA SHINJUKUGYOENⅠ93 COMFORIA KAGURAZAKA DEUX
96 COMFORIA AZABU EAST
98 COMFORIA SHINJUKU EASTSIDE TOWER
103 COMFORIA ICHIGAYAYAKUOJI
104 COMFORIA AKIHABARA EAST
105 COMFORIA MITA TROIS
113 COMFORIA SHIBAURA
120 COMFORIA SHINJUKU
126 COMFORIA HIGASHINIHONBASHI
133 COMFORIA GINZA EAST NIBANKAN
135 COMFORIA HIGASHISHINJUKU STATION FRONT
138 COMFORIA NAKAOCHIAI
139 COMFORIA WASEDA DEUX
47 COMFORIA YATSUKA
77 COMFORIA SHINKOYASU
112 COMFORIA GYOTOKU
122 GRANCREER CENTER-MINAMI
132 COMFORIA TAMA-PLAZA
150 COMFORIA OMIYA
95 COMFORIA KITASANJO
101 COMFORIA SAPPORO SHOKUBUTSUEN
102 COMFORIA OGIMACHI
109 COMFORIA SHINSAIBASHI EAST
110 COMFORIA KYOMACHIBORI
111 COMFORIA AWAZA
117 COMFORIA KITAHAMA
136 COMFORIA ESAKAHIROSHIBACHO
16 17
Portfolio Map (As of March 31, 2021)
�������������������������
Shareholders’ Meeting
Board of Directors
President & CEO
Corporate Auditor
Compliance Committee
Acquisition Priority Review Meeting
Compliance Dept.
Investment Committee
�������������������������� �������������������������������������������
Strategy Dept.
Asset Mgt. Dept.
Strategy Dept.
Asset Mgt. Dept.
Strategy Dept.
Environmental Engineering
Dept.
Asset Investment
Dept.
Finance & Accounting
Dept.
Human Resources
Dept.
Corporate Planning
Dept.Asset Mgt.
Dept.
Internal Audit Dept.
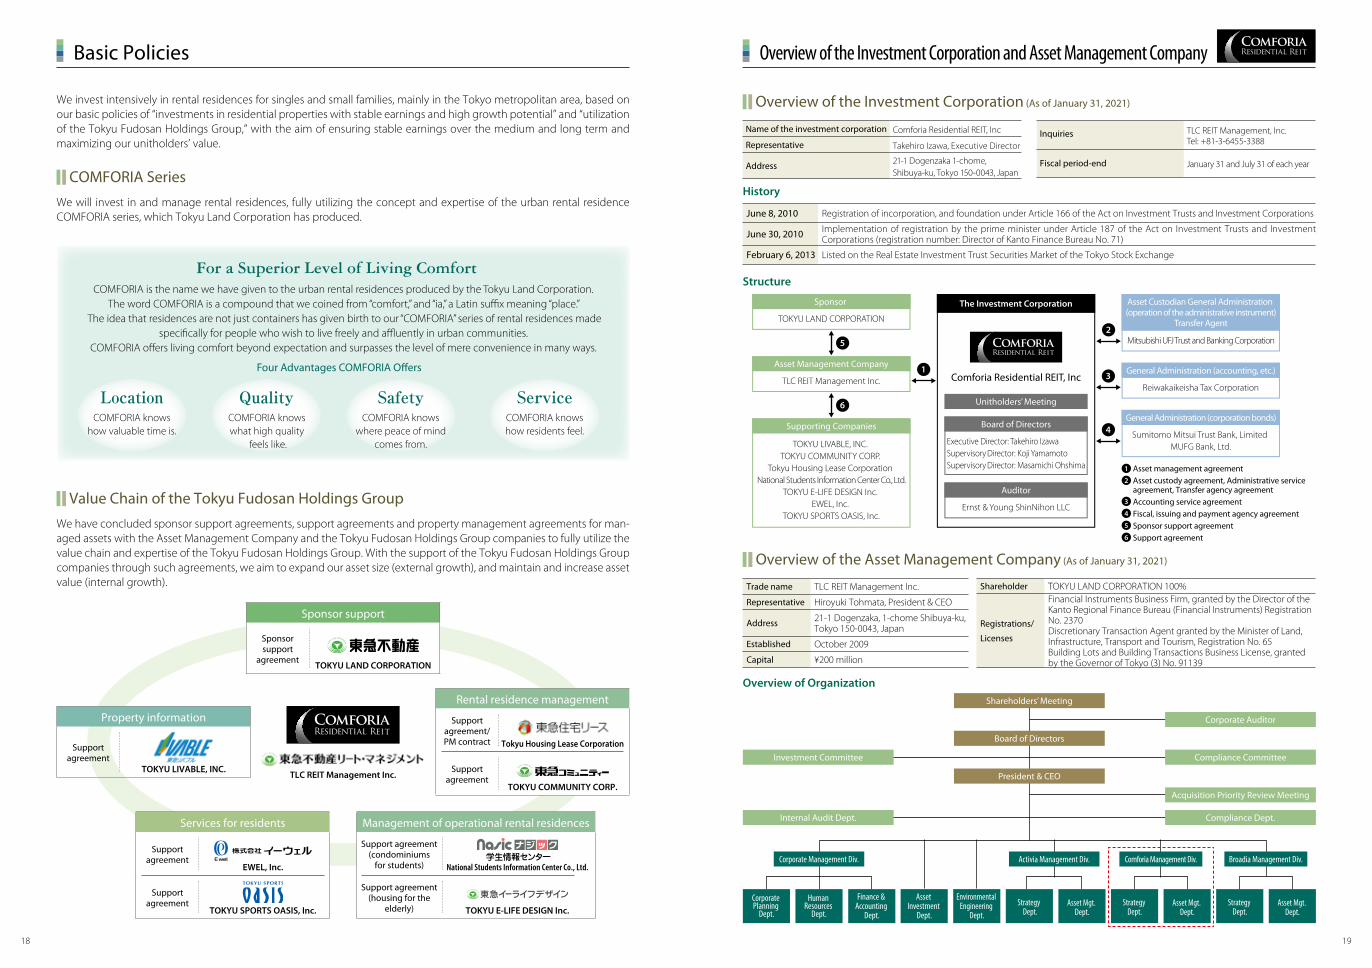
We invest intensively in rental residences for singles and small families, mainly in the Tokyo metropolitan area, based on our basic policies of “investments in residential properties with stable earnings and high growth potential” and “utilization of the Tokyu Fudosan Holdings Group,” with the aim of ensuring stable earnings over the medium and long term and maximizing our unitholders’ value.
Structure
June 8, 2010 Registration of incorporation, and foundation under Article 166 of the Act on Investment Trusts and Investment Corporations
June 30, 2010 Implementation of registration by the prime minister under Article 187 of the Act on Investment Trusts and Investment Corporations (registration number: Director of Kanto Finance Bureau No. 71)
February 6, 2013 Listed on the Real Estate Investment Trust Securities Market of the Tokyo Stock Exchange
HistoryWe will invest in and manage rental residences, fully utilizing the concept and expertise of the urban rental residence COMFORIA series, which Tokyu Land Corporation has produced.
COMFORIA Series
We have concluded sponsor support agreements, support agreements and property management agreements for man-aged assets with the Asset Management Company and the Tokyu Fudosan Holdings Group companies to fully utilize the value chain and expertise of the Tokyu Fudosan Holdings Group. With the support of the Tokyu Fudosan Holdings Group companies through such agreements, we aim to expand our asset size (external growth), and maintain and increase asset value (internal growth).
Value Chain of the Tokyu Fudosan Holdings Group
Overview of the Investment Corporation (As of January 31, 2021)
Trade name TLC REIT Management Inc.
Representative Hiroyuki Tohmata, President & CEO
Address 21-1 Dogenzaka, 1-chome Shibuya-ku, Tokyo 150-0043, Japan
Established October 2009
Capital ¥200 million
Overview of the Asset Management Company (As of January 31, 2021)
Overview of Organization
Name of the investment corporation Comforia Residential REIT, Inc
Representative Takehiro Izawa, Executive Director
Address 21-1 Dogenzaka 1-chome, Shibuya-ku, Tokyo 150-0043, Japan
Inquiries TLC REIT Management, Inc. Tel: +81-3-6455-3388
Fiscal period-end January 31 and July 31 of each year
Shareholder TOKYU LAND CORPORATION 100%
Registrations/
Licenses
Financial Instruments Business Firm, granted by the Director of the Kanto Regional Finance Bureau (Financial Instruments) Registration No. 2370Discretionary Transaction Agent granted by the Minister of Land, Infrastructure, Transport and Tourism, Registration No. 65Building Lots and Building Transactions Business License, granted by the Governor of Tokyo (3) No. 91139
For a Superior Level of Living ComfortCOMFORIA is the name we have given to the urban rental residences produced by the Tokyu Land Corporation.
The word COMFORIA is a compound that we coined from “comfort,” and “ia,” a Latin suffix meaning “place.” The idea that residences are not just containers has given birth to our “COMFORIA” series of rental residences made
specifically for people who wish to live freely and affluently in urban communities. COMFORIA offers living comfort beyond expectation and surpasses the level of mere convenience in many ways.
Four Advantages COMFORIA Offers
COMFORIA knows how valuable time is.
COMFORIA knowswhat high quality
feels like.
COMFORIA knows where peace of mind
comes from.
COMFORIA knows how residents feel.
Sponsor support
Sponsor support
agreement
Services for residents
Support agreement
Support agreement
Management of operational rental residences
Support agreement (condominiums
for students)
Support agreement (housing for the
elderly)
Rental residence management
Support agreement/ PM contract
Support agreement
Property information
Support agreement
TOKYU LAND CORPORATION
Tokyu Housing Lease Corporation
TOKYU COMMUNITY CORP.
TOKYU E-LIFE DESIGN Inc.
National Students Information Center Co., Ltd.
TOKYU LIVABLE, INC.
EWEL, Inc.
TOKYU SPORTS OASIS, Inc.
TLC REIT Management Inc.
TOKYU LIVABLE, INC. TOKYU COMMUNITY CORP.
Tokyu Housing Lease Corporation National Students Information Center Co., Ltd.
TOKYU E-LIFE DESIGN Inc. EWEL, Inc.
TOKYU SPORTS OASIS, Inc.
Supporting Companies
Asset management agreementAsset custody agreement, Administrative service agreement, Transfer agency agreementAccounting service agreementFiscal, issuing and payment agency agreementSponsor support agreement Support agreement
Sponsor
TOKYU LAND CORPORATION
Asset Management Company
TLC REIT Management Inc.
6
5
1
Auditor
Ernst & Young ShinNihon LLC
Board of Directors
Executive Director: Takehiro Izawa Supervisory Director: Koji Yamamoto Supervisory Director: Masamichi Ohshima
Unitholders’ Meeting
Asset Custodian General Administration (operation of the administrative instrument)
Transfer Agent
Mitsubishi UFJ Trust and Banking Corporation
General Administration (accounting, etc.)
Reiwakaikeisha Tax Corporation
General Administration (corporation bonds)
Sumitomo Mitsui Trust Bank, Limited MUFG Bank, Ltd.
2
3
4
Comforia Residential REIT, Inc
The Investment Corporation
1
2
3
4
5
6
18 19
Overview of the Investment Corporation and Asset Management CompanyBasic Policies
Asset Management Report for the 21st Fiscal Period (Semi-Annual Report) From August 1, 2020 to January 31, 2021
Comforia Residential REIT, Inc 21-1 Dogenzaka 1-chome, Shibuya-ku,
Tokyo 150-0043, Japan
II. Asset Management Report III. Financial Section
Balance Sheets Statements of Income Statements of Changes in Unitholders’ Equity Statements of Cash Distributions Statements of Cash Flows Notes Supplementary Schedules Independent Auditor’s Report
- 1 -
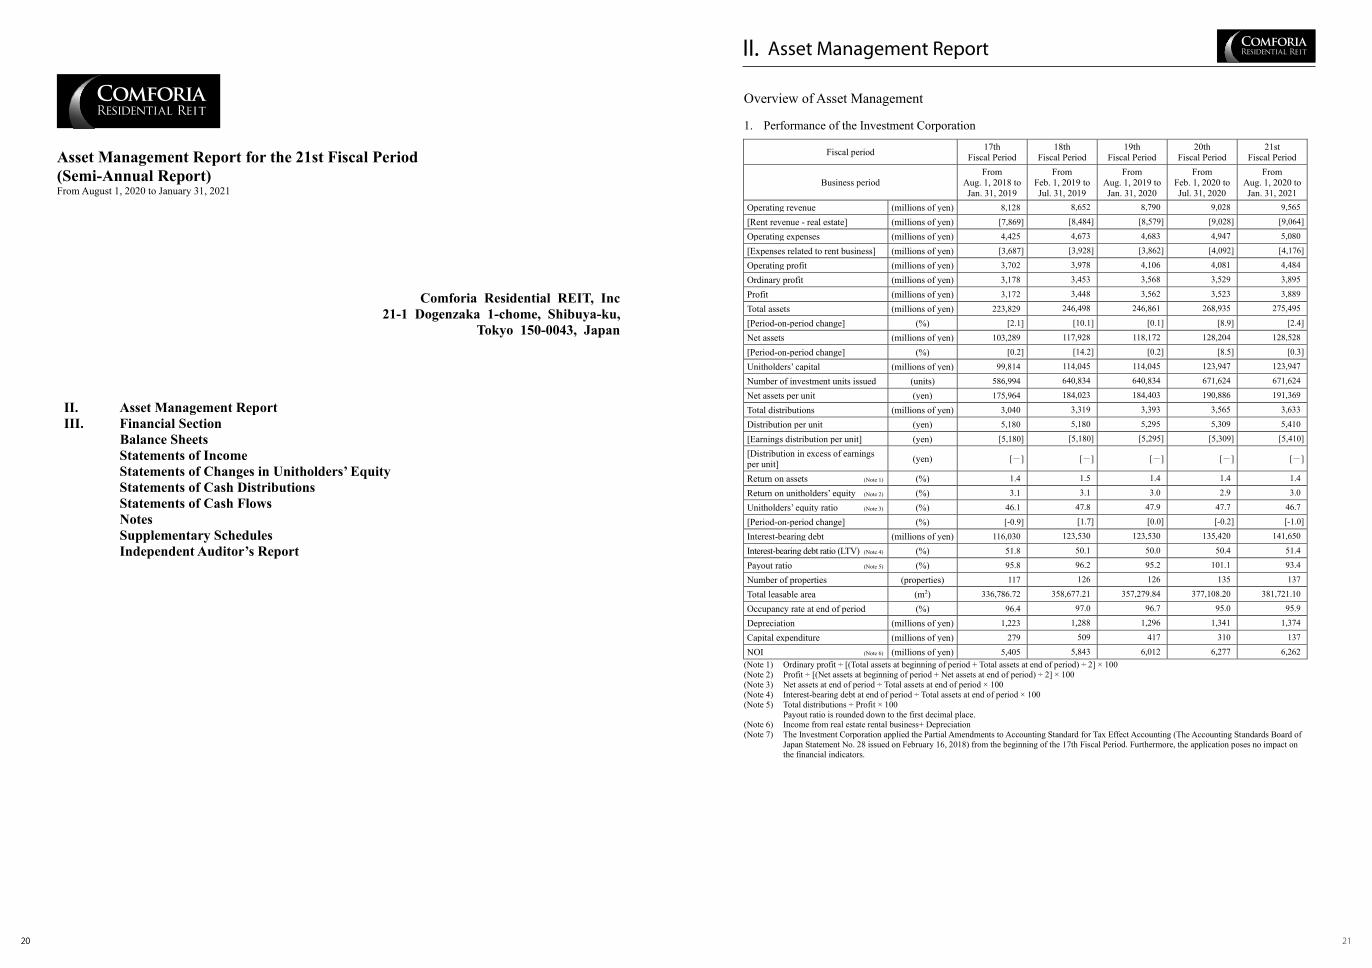
II. Asset Management Report Overview of Asset Management 1. Performance of the Investment Corporation
Fiscal period 17th Fiscal Period
18th Fiscal Period
19th Fiscal Period
20th Fiscal Period
21st Fiscal Period
Business period From
Aug. 1, 2018 to Jan. 31, 2019
From Feb. 1, 2019 to Jul. 31, 2019
From Aug. 1, 2019 to Jan. 31, 2020
From Feb. 1, 2020 to Jul. 31, 2020
From Aug. 1, 2020 to Jan. 31, 2021
Operating revenue (millions of yen) 8,128 8,652 8,790 9,028 9,565
[Rent revenue - real estate] (millions of yen) [7,869] [8,484] [8,579] [9,028] [9,064]
Operating expenses (millions of yen) 4,425 4,673 4,683 4,947 5,080
[Expenses related to rent business] (millions of yen) [3,687] [3,928] [3,862] [4,092] [4,176]
Operating profit (millions of yen) 3,702 3,978 4,106 4,081 4,484
Ordinary profit (millions of yen) 3,178 3,453 3,568 3,529 3,895
Profit (millions of yen) 3,172 3,448 3,562 3,523 3,889
Total assets (millions of yen) 223,829 246,498 246,861 268,935 275,495
[Period-on-period change] (%) [2.1] [10.1] [0.1] [8.9] [2.4]
Net assets (millions of yen) 103,289 117,928 118,172 128,204 128,528
[Period-on-period change] (%) [0.2] [14.2] [0.2] [8.5] [0.3]
Unitholders’ capital (millions of yen) 99,814 114,045 114,045 123,947 123,947
Number of investment units issued (units) 586,994 640,834 640,834 671,624 671,624
Net assets per unit (yen) 175,964 184,023 184,403 190,886 191,369
Total distributions (millions of yen) 3,040 3,319 3,393 3,565 3,633
Distribution per unit (yen) 5,180 5,180 5,295 5,309 5,410
[Earnings distribution per unit] (yen) [5,180] [5,180] [5,295] [5,309] [5,410]
[Distribution in excess of earnings per unit] (yen) [-] [-] [-] [-] [-]
Return on assets (Note 1) (%) 1.4 1.5 1.4 1.4 1.4
Return on unitholders’ equity (Note 2) (%) 3.1 3.1 3.0 2.9 3.0
Unitholders’ equity ratio (Note 3) (%) 46.1 47.8 47.9 47.7 46.7
[Period-on-period change] (%) [-0.9] [1.7] [0.0] [-0.2] [-1.0]
Interest-bearing debt (millions of yen) 116,030 123,530 123,530 135,420 141,650
Interest-bearing debt ratio (LTV) (Note 4) (%) 51.8 50.1 50.0 50.4 51.4
Payout ratio (Note 5) (%) 95.8 96.2 95.2 101.1 93.4
Number of properties (properties) 117 126 126 135 137
Total leasable area (m2) 336,786.72 358,677.21 357,279.84 377,108.20 381,721.10
Occupancy rate at end of period (%) 96.4 97.0 96.7 95.0 95.9
Depreciation (millions of yen) 1,223 1,288 1,296 1,341 1,374
Capital expenditure (millions of yen) 279 509 417 310 137
NOI (Note 6) (millions of yen) 5,405 5,843 6,012 6,277 6,262 (Note 1) Ordinary profit ÷ [(Total assets at beginning of period + Total assets at end of period) ÷ 2] × 100 (Note 2) Profit ÷ [(Net assets at beginning of period + Net assets at end of period) ÷ 2] × 100 (Note 3) Net assets at end of period ÷ Total assets at end of period × 100 (Note 4) Interest-bearing debt at end of period ÷ Total assets at end of period × 100 (Note 5) Total distributions ÷ Profit × 100 Payout ratio is rounded down to the first decimal place. (Note 6) Income from real estate rental business+ Depreciation (Note 7) The Investment Corporation applied the Partial Amendments to Accounting Standard for Tax Effect Accounting (The Accounting Standards Board of
Japan Statement No. 28 issued on February 16, 2018) from the beginning of the 17th Fiscal Period. Furthermore, the application poses no impact on the financial indicators.
20 2120 2120
Asset Management ReportII.

- 2 -
2. Asset Management Status for the 21st Fiscal Period (1) History of the Investment Corporation
Comforia Residential REIT, Inc (the “Investment Corporation”) was established on June 8, 2010 as an investment corporation that invests mainly in residential properties in accordance with the “Act on Investment Trusts and Investment Corporations” of Japan (Act No. 198 of 1951, as revised; hereinafter referred to as the “Investment Trusts Act”), with registration by the Prime Minister completed as of June 30, 2010 under Article 187 of the Investment Trusts Act (registration number: Director of Kanto Finance Bureau No. 71). Investments by the Investment Corporation commenced in August 2010. The Investment Corporation issued new investment units through a public offering on February 6, 2013 and was listed on the real estate investment trust market of the Tokyo Stock Exchange, Inc. (securities code: 3282). Managed assets of the Investment Corporation at the commencement of operations totaled 11 properties, acquired for a total of ¥15,508 million. As a result of additional acquisition and sale of properties under the basic policy of asset management (to manage assets with the aim of achieving stable earnings and ensuring the steady growth of our managed assets based on medium- to long-term perspectives to maximize our unitholders’ value) stipulated in the Articles of Incorporation of the Investment Corporation, the portfolio (the “Acquired Assets”) owned as of the end of the 21st Fiscal Period includes 137 properties, acquired for a total of ¥252,150 million.
(2) Investment performance
(i) Investment environment During the 21st Fiscal Period, the Japanese economy still remained in a harsh situation under the influence of the novel coronavirus infection (COVID-19), but has started to show signs of a pickup. Under such circumstances, the residential rental market saw the occupancy rate temporarily drift on a somewhat weak note, but the figure is showing a recovery trend for the moment. In the real estate investment market, on the other hand, the level of transaction prices continues to stay at a high price range amid an ongoing low interest rate environment resulting from the fiscal policies of the government and monetary policies of the Bank of Japan (BOJ).
(ii) Acquisition and sale of assets
During the 21st Fiscal Period, the Investment Corporation acquired COMFORIA TOYOCHO and three other properties in September 2020, followed by the sale of COMFORIA ICHIKAWAMYODEN and another property in December 2020. As a result, assets owned by the Investment Corporation as of the end of the 21st Fiscal Period totaled 137 properties with a total acquisition price of ¥252,150 million.
(iii) Operation management of assets owned by the Investment Corporation
The Investment Corporation consigns property management operations mainly to Tokyu Housing Lease Corporation, which has an extensive track record in managing the Comforia series of properties. Under the Comforia series, the Investment Corporation promotes unified management and strives to improve operational efficiency and shorten periods of vacancy.
(3) Overview of funding
During the 21st Fiscal Period, the Investment Corporation borrowed funds (¥10,800 million) for the acquisition of COMFORIA TOYOCHO and three other properties in September 2020 and to be appropriated for the repayment funds (¥2,800 million) for borrowings made in March 2019. Subsequently, the Investment Corporation borrowed funds (¥5,500 million) in January 2021 to be appropriated for the repayment funds (¥5,500 million) for borrowings made in February 2014. Consequently, as of the end of the 21st Fiscal Period (January 31, 2021), unitholders’ capital was ¥123,947 million, interest-bearing debt was ¥141,650 million, the ratio of interest-bearing debt to total assets (LTV) was 51.4%, the average maturity of interest-bearing debt was 4.2 years, the ratio of long-term debt was 81.4%, and the fixed rate ratio was 91.2%. The Investment Corporation also established a commitment line with a credit limit of ¥13.5 billion with Mizuho Bank, Ltd., Sumitomo Mitsui Trust Bank, Limited and MUFG Bank, Ltd. on September 25, 2020, in order to secure flexible and stable funding methods. Moreover, the Investment Corporation executed a Line of Credit Loan Master Agreement (on an uncommitted basis) as of February 5, 2021, in case the need for funding arises to purchase assets for future investments or other purposes.
The Investment Corporation obtained the following rating as of the end of the 21st Fiscal Period.
Name of credit rating agency Rating Outlook Japan Credit Rating Agency, Ltd. (JCR) AA– Stable
(4) Overview of performance and distributions
As a result of investment during the 21st Fiscal Period, the Investment Corporation posted operating revenue of ¥9,565 million, operating profit of ¥4,484 million, ordinary profit of ¥3,895 million, and profit of ¥3,889 million. The Investment Corporation carries out distributions so that the Special Provisions for Taxation on Investment Corporations (Article 67-15 of the Act on Special Measures Concerning Taxation [Act No. 26 of 1957, as revised; hereinafter referred to as the “Act on Special Measures Concerning Taxation”]) would be applied. For the 21st Fiscal Period, the Investment Corporation retained part (¥256 million) of gain on sales by applying the Special Provisions on Taxation in the case of advance acquisition of land and such in 2009 and 2010 (Article 66-2 of the Act on Special Measures Concerning Taxation). As a result, the distribution per unit (DPU) was ¥5,410 for the period.
- 3 -
3. Capital Increases
Date Type Number of investment units
issued (units) Unitholders’ capital
(millions of yen) Remarks Change Balance Change Balance
June 8, 2010 Establishment through private placement 200 200 100 100 (Note 1)
August 30, 2010 Capital increase through private placement 7,800 8,000 3,900 4,000 (Note 2)
March 18, 2011 Capital increase through private placement 24,270 32,270 11,840 15,840 (Note 3)
February 2, 2012 Capital increase through private placement 16,400 48,670 8,200 24,040 (Note 4)
February 5, 2013 Capital increase through public offering 18,691 67,361 9,935 33,975 (Note 5)
February 3, 2014 Capital increase through public offering 31,900 99,261 21,960 55,936 (Note 6)
February 26, 2014 Capital increase through third-party allotment 1,401 100,662 964 56,900 (Note 7)
August 1, 2014 Investment unit split 301,986 402,648 – 56,900 (Note 8)
February 2, 2015 Capital increase through public offering 70,000 472,648 18,025 74,926 (Note 9)
February 27, 2015 Capital increase through third-party allotment 1,156 473,804 297 75,224 (Note 10)
February 1, 2016 Capital increase through public offering 37,800 511,604 7,159 82,383 (Note 11)
February 26, 2016 Capital increase through third-party allotment 1,900 513,504 359 82,743 (Note 12)
February 1, 2017 Capital increase through public offering 47,800 561,304 11,251 93,995 (Note 13)
February 22, 2017 Capital increase through third-party allotment 2,390 563,694 562 94,557 (Note 14)
February 1, 2018 Capital increase through public offering 22,190 585,884 5,006 99,563 (Note 15)
February 15, 2018 Capital increase through third-party allotment 1,110 586,994 250 99,814 (Note 16)
February 1, 2019 Capital increase through public offering 51,270 638,264 13,551 113,366 (Note 17)
February 20, 2019 Capital increase through third-party allotment 2,570 640,834 679 114,045 (Note 18)
February 3, 2020 Capital increase through public offering 29,330 670,164 9,432 123,477 (Note 19)
February 19, 2020 Capital increase through third-party allotment 1,460 671,624 469 123,947 (Note 20)
(Note 1) Established at an issue price of ¥500,000 per investment unit. (Note 2) Issued privately placed investment units at an issue price of ¥500,000 per investment unit to fund the acquisition of new properties. (Note 3) Issued privately placed investment units at an issue price of ¥500,000 (subscription price of ¥487,852) per investment unit to fund the acquisition of
new properties and repay loans. (Note 4) Issued privately placed investment units at an issue price of ¥500,000 per investment unit to fund the acquisition of new properties and repay loans. (Note 5) Issued investment units at an issue price of ¥550,000 (subscription price of ¥531,575) per investment unit to fund the acquisition of new properties
and repay loans. (Note 6) Issued investment units at an issue price of ¥712,530 (subscription price of ¥688,413) per investment unit to fund the acquisition of new properties
and repay loans. (Note 7) Issued investment units with Mizuho Securities Co., Ltd. as alottee at an issue value of ¥688,413 per investment unit. (Note 8) Carried out a four-for-one-split of investment units effective as of August 1, 2014, with July 31, 2014 as the record date. (Note 9) Issued investment units at an issue price of ¥266,253 (subscription price of ¥257,514) per investment unit to fund the acquisition of new properties
and repay loans. (Note 10) Issued investment units with Mizuho Securities Co., Ltd. as alottee at an issue value of ¥257,514 per investment unit. (Note 11) Issued investment units at an issue price of ¥195,828 (subscription price of ¥189,400) per investment unit to fund the acquisition of new properties
and repay loans. (Note 12) Issued investment units with Mizuho Securities Co., Ltd. as alottee at an issue value of ¥189,400 per investment unit. (Note 13) Issued investment units at an issue price of ¥243,252 (subscription price of ¥235,393) per investment unit to fund the acquisition of new properties
and repay loans. (Note 14) Issued investment units with Mizuho Securities Co., Ltd. as alottee at an issue value of ¥235,393 per investment unit. (Note 15) Issued investment units at an issue price of ¥233,132 (subscription price of ¥225,600) per investment unit to fund the acquisition of new properties
and to repay loans. (Note 16) Issued investment units with Mizuho Securities Co., Ltd. as alottee at an issue value of ¥225,600 per investment unit.
22 2322 23

- 4 -
(Note 17) Issued investment units at an issue price of ¥273,146 (subscription price of ¥264,321) per investment unit to fund the acquisition of new properties and repay loans.
(Note 18) Issued investment units with Mizuho Securities Co., Ltd. as alottee at an issue value of ¥264,321 per investment unit. (Note 19) Issued investment units at an issue price of ¥332,328 (subscription price of ¥321,591) per investment unit to fund the acquisition of new properties
and repay loans. (Note 20) Issued investment units with Mizuho Securities Co., Ltd. as alottee at an issue value of ¥321,591 per investment unit. [Fluctuation in market price of the investment securities] The highest and lowest prices (closing price) in the real estate investment trust market of the Tokyo Stock Exchange, Inc., where the Investment Corporation is listed, by fiscal period are as follows.
Fiscal period 17th Fiscal Period 18th Fiscal Period 19th Fiscal Period 20th Fiscal Period 21st Fiscal Period Closing month/year Jan. 2019 Jul. 2019 Jan. 2020 Jul. 2020 Jan. 2021
Highest ¥298,000 ¥332,500 ¥360,500 ¥355,500 ¥341,000 Lowest ¥258,000 ¥280,100 ¥322,500 ¥198,100 ¥278,400
4. Performance of Distributions The Investment Corporation pays out distributions per unit (DPUs) with the intent of including the maximum amount of earnings distributions in deductible expenses by applying special measures concerning taxation (Article 67-15 of the Act on Special Measures Concerning Taxation). For the 21st Fiscal Period, the Investment Corporation retained part of gain on sales by applying the Special Provisions on Taxation in the case of advance acquisition of land and such in 2009 and 2010 (Article 66-2 of the Act on Special Measures Concerning Taxation). Based on this policy, the Investment Corporation decided to distribute the entire amount of unappropriated retained earnings after deducting ¥256 million, which is within the scope where the provisions of Article 67-15 of the Act on Special Measures Concerning Taxation are applied, as well as within the limit of reserve for reduction entry stipulated in Article 66-2 of the Act on Special Measures Concerning Taxation, as provision of reserve for reduction entry. As a result, the DPU for the 21st Fiscal Period was ¥5,410.
Fiscal period 17th Fiscal Period 18th Fiscal Period 19th Fiscal Period 20th Fiscal Period 21st Fiscal Period
Business period From Aug. 1, 2018 to Jan. 31, 2019
From Feb. 1, 2019 to Jul. 31, 2019
From Aug. 1, 2019 to Jan. 31, 2020
From Feb. 1, 2020 to Jul. 31, 2020
From Aug. 1, 2020 to Jan. 31, 2021
Unappropriated retained earnings ¥3,172,709 thousand ¥3,448,336 thousand ¥3,562,889 thousand ¥3,523,532 thousand ¥3,889,688 thousand Retained earnings ¥149,557 thousand ¥149,456 thousand ¥172,904 thousand ¥– thousand ¥256,202 thousand Total distributions ¥3,040,628 thousand ¥3,319,520 thousand ¥3,393,216 thousand ¥3,565,651 thousand ¥3,633,485 thousand [Distribution per unit (DPU)] [¥5,180] [¥5,180] [¥5,295] [¥5,309] [¥5,410] Of which, total earnings distributions ¥3,040,628 thousand ¥3,319,520 thousand ¥3,393,216 thousand ¥3,565,651 thousand ¥3,633,485 thousand
[Earnings distribution per unit] [¥5,180] [¥5,180] [¥5,295] [¥5,309] [¥5,410] Of which, total return on unitholders’ capital ¥– thousand ¥– thousand ¥– thousand ¥– thousand ¥– thousand
[Return on unitholders’ capital per unit] [¥–] [¥–] [¥–] [¥–] [¥–]
Of the total return on unitholders’ capital, the total distribution payments from the allowance for temporary difference adjustment
¥– thousand ¥– thousand ¥– thousand ¥– thousand ¥– thousand
[Of the return on unitholders’ capital per unit, the distribution payment from the allowance for temporary difference adjustment per unit]
[¥–] [¥–] [¥–] [¥–] [¥–]
Of the total return on unitholders’ capital, the total distribution payments from investments and other decreased distribution under tax laws
¥– thousand ¥– thousand ¥– thousand ¥– thousand ¥– thousand
[Of the total return on unitholders’ capital per unit, the distribution payments from investments and other decreased distribution under tax laws]
[¥–] [¥–] [¥–] [¥–] [¥–]
(Note) Figures above are rounded down to the nearest unit.
- 5 -
5. Future Investment Policy and Issues to Address Founded on our basic policies of investment management, the Investment Corporation acquired 4 properties and sold 2 properties during the 21st Fiscal Period, and has carried out investment and management based on the concept and expertise incorporated into the urban rental residence Comforia series, which Tokyu Land Corporation (hereinafter referred to as “Tokyu Land”) has been producing. Going forward, we aim to achieve medium- to long-term growth by continuing to carry out investment and management based on our basic policies.
(1) External growth strategy The Investment Corporation aims to acquire higher quality assets and expand the asset size, fully utilizing the support of the Tokyu Fudosan Holdings Group, primarily the sponsor support of Tokyu Land, and original information from TLC REIT Management Inc., its asset management company (hereinafter referred to as the “Asset Management Company”). Specifically, we will acquire properties developed by our sponsor, Tokyu Land, using the sponsor support agreement the Asset Management Company entered into with Tokyu Land, and continually and steadily acquire quality residential properties that are under stable operation. In addition, we intend to utilize real estate brokerage capabilities through the vast information network of Tokyu Fudosan Holdings Group companies other than the sponsor, to acquire quality residential properties, achieve stable operation and enhance profitability. Based on this perspective, the Asset Management Company has entered into a support agreement with each of the seven support companies of the Tokyu Fudosan Holdings Group companies (Tokyu Livable, Inc., Tokyu Community Corp., Tokyu Housing Lease Corporation, National Students Information Center Co., Ltd., Tokyu E-Life Design Inc., Ewel Inc. and Tokyu SportsOasis, Inc.,) for managed assets of the Investment Corporation.
(2) Internal growth strategy
With the aim of maximizing portfolio value and cash flows from individual properties from a medium- to long-term perspective and to make the most of the experience and comprehensive strength of the Tokyu Fudosan Holdings Group in property management, we will consign property management operations mainly to Tokyu Fudosan Holdings Group companies, which have extensive experience in the management of J-REITs and the Comforia series. In addition, we will strive for efficient management by examining the adequacy of building management specifications and costs. Furthermore, we will actively utilize the expertise of Tokyu Fudosan Holdings Group in asset and fund management to achieve higher-quality overall management of the Investment Corporation. Moreover, as we believe that endeavors on the issues of environmental and social considerations and reinforced governance, among other matters, should contribute to the progress of a sustainable society, we will aim to achieve growth over a medium to long term by conducting asset management based on such thinking. In the 22nd Fiscal Period and onwards, we will continue to aim to maintain and improve occupancy rates by closely monitoring the property management situation, as we did in the 21st Fiscal Period.
(3) Financial strategy
In consideration of addressing future interest rate risk and refinance risk, we will carry out funding activities by paying attention to financial soundness and earnings stability. With regard to debt, we will efficiently combine short-term funding that focuses on agility with long-term stable funding. Furthermore, we will consider the issuance of new investment units in accordance with financing needs for property acquisition and the financial situation of the Investment Corporation, while paying attention to the market development and distribution level, with the upper limit of the ratio of interest-bearing debt to total assets (LTV) at around 60%.
6. Significant Subsequent Events
Issuance of New Investment Units The Investment Corporation resolved at the Board of Directors’ meetings held on January 5, 2021 and January 13, 2021 concerning the issuances of new investment units as described below. Based on the resolution, capital contributions have been completed on February 1, 2021 for the new investment units issued through public offering and on February 17, 2021 for the new investment units offered by way of third-party allotment, respectively. As a result, unitholders’ capital increased to ¥129,791,732,102, with the number of investment units issued and outstanding being 692,994 units. Issuance of New Investment Units through Public Offering (Primary Offering)
Number of investment units issued: 20,360 units Issue price: ¥282,623 per unit Total issue amount: ¥5,754,204,280 Paid-in amount (issue value): ¥273,492 per unit Total paid-in amount (issue value): ¥5,568,297,120 Payment date: February 1, 2021
Issuance of New Investment Units Offered by Way of Third-Party Allotment
Number of investment units offered: 1,010 units Paid-in amount (issue value): ¥273,492 per unit Total paid-in amount (issue value): ¥276,226,920 Payment date: February 17, 2021 Allottee: Mizuho Securities Co., Ltd.
24 2524 25
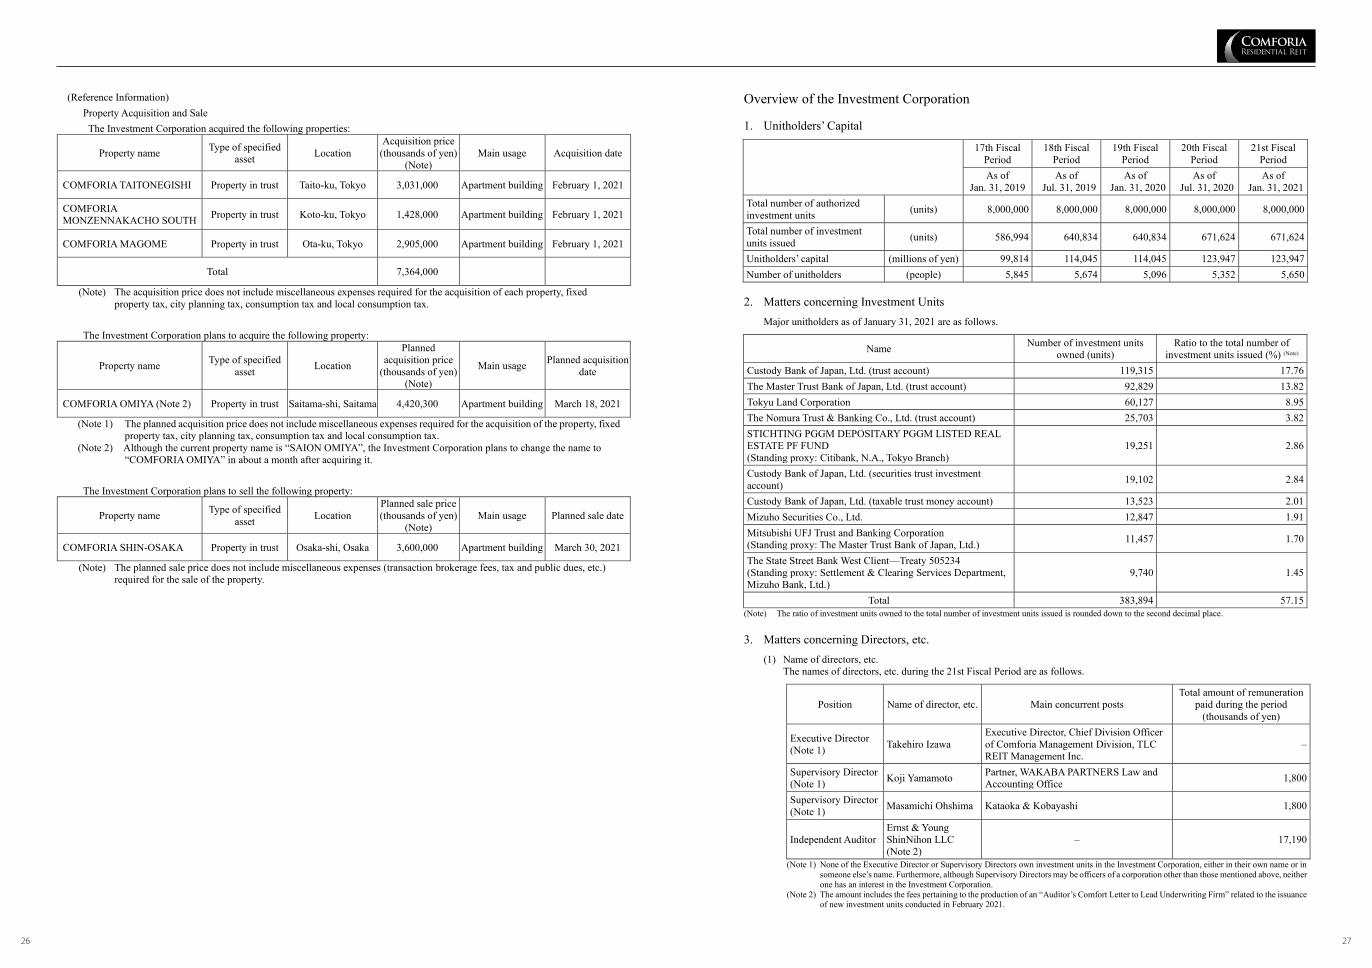
- 6 -
(Reference Information) Property Acquisition and Sale The Investment Corporation acquired the following properties:
Property name Type of specified asset Location
Acquisition price (thousands of yen)
(Note) Main usage Acquisition date
COMFORIA TAITONEGISHI Property in trust Taito-ku, Tokyo 3,031,000 Apartment building February 1, 2021
COMFORIA MONZENNAKACHO SOUTH Property in trust Koto-ku, Tokyo 1,428,000 Apartment building February 1, 2021
COMFORIA MAGOME Property in trust Ota-ku, Tokyo 2,905,000 Apartment building February 1, 2021
Total 7,364,000
(Note) The acquisition price does not include miscellaneous expenses required for the acquisition of each property, fixed property tax, city planning tax, consumption tax and local consumption tax.
The Investment Corporation plans to acquire the following property:
Property name Type of specified asset Location
Planned acquisition price
(thousands of yen) (Note)
Main usage Planned acquisition date
COMFORIA OMIYA (Note 2) Property in trust Saitama-shi, Saitama 4,420,300 Apartment building March 18, 2021
(Note 1) The planned acquisition price does not include miscellaneous expenses required for the acquisition of the property, fixed property tax, city planning tax, consumption tax and local consumption tax.
(Note 2) Although the current property name is “SAION OMIYA”, the Investment Corporation plans to change the name to “COMFORIA OMIYA” in about a month after acquiring it.
The Investment Corporation plans to sell the following property:
Property name Type of specified asset Location
Planned sale price (thousands of yen)
(Note) Main usage Planned sale date
COMFORIA SHIN-OSAKA Property in trust Osaka-shi, Osaka 3,600,000 Apartment building March 30, 2021
(Note) The planned sale price does not include miscellaneous expenses (transaction brokerage fees, tax and public dues, etc.) required for the sale of the property.
- 7 -
Overview of the Investment Corporation 1. Unitholders’ Capital
17th Fiscal Period
18th Fiscal Period
19th Fiscal Period
20th Fiscal Period
21st Fiscal Period
As of Jan. 31, 2019
As of Jul. 31, 2019
As of Jan. 31, 2020
As of Jul. 31, 2020
As of Jan. 31, 2021
Total number of authorized investment units (units) 8,000,000 8,000,000 8,000,000 8,000,000 8,000,000
Total number of investment units issued (units) 586,994 640,834 640,834 671,624 671,624
Unitholders’ capital (millions of yen) 99,814 114,045 114,045 123,947 123,947 Number of unitholders (people) 5,845 5,674 5,096 5,352 5,650
2. Matters concerning Investment Units
Major unitholders as of January 31, 2021 are as follows.
Name Number of investment units owned (units)
Ratio to the total number of investment units issued (%) (Note)
Custody Bank of Japan, Ltd. (trust account) 119,315 17.76 The Master Trust Bank of Japan, Ltd. (trust account) 92,829 13.82 Tokyu Land Corporation 60,127 8.95 The Nomura Trust & Banking Co., Ltd. (trust account) 25,703 3.82 STICHTING PGGM DEPOSITARY PGGM LISTED REAL ESTATE PF FUND (Standing proxy: Citibank, N.A., Tokyo Branch)
19,251 2.86
Custody Bank of Japan, Ltd. (securities trust investment account) 19,102 2.84
Custody Bank of Japan, Ltd. (taxable trust money account) 13,523 2.01 Mizuho Securities Co., Ltd. 12,847 1.91 Mitsubishi UFJ Trust and Banking Corporation (Standing proxy: The Master Trust Bank of Japan, Ltd.) 11,457 1.70
The State Street Bank West Client—Treaty 505234 (Standing proxy: Settlement & Clearing Services Department, Mizuho Bank, Ltd.)
9,740 1.45
Total 383,894 57.15 (Note) The ratio of investment units owned to the total number of investment units issued is rounded down to the second decimal place. 3. Matters concerning Directors, etc.
(1) Name of directors, etc. The names of directors, etc. during the 21st Fiscal Period are as follows.
Position Name of director, etc. Main concurrent posts Total amount of remuneration
paid during the period (thousands of yen)
Executive Director (Note 1) Takehiro Izawa
Executive Director, Chief Division Officer of Comforia Management Division, TLC REIT Management Inc.
–
Supervisory Director (Note 1) Koji Yamamoto Partner, WAKABA PARTNERS Law and
Accounting Office 1,800
Supervisory Director (Note 1) Masamichi Ohshima Kataoka & Kobayashi 1,800
Independent Auditor Ernst & Young ShinNihon LLC (Note 2)
– 17,190
(Note 1) None of the Executive Director or Supervisory Directors own investment units in the Investment Corporation, either in their own name or in someone else’s name. Furthermore, although Supervisory Directors may be officers of a corporation other than those mentioned above, neither one has an interest in the Investment Corporation.
(Note 2) The amount includes the fees pertaining to the production of an “Auditor’s Comfort Letter to Lead Underwriting Firm” related to the issuance of new investment units conducted in February 2021.
26 2726 27

- 8 -
(2) Policy for decisions on dismissal or non-reappointment of Independent Auditor The Board of Directors shall, with the consent of all its members, dismiss the Independent Auditor if it is deemed that it falls under any of the grounds set forth in each item of Paragraph 1 of Article 105 of the Investment Trusts Act, and when it is determined that there is no hope for improvement. In addition, when it is determined that an Independent Auditor is not fit for his or her role, upon comprehensive examination of their execution of duties as the Independent Auditor and other various circumstances, the Board of Directors shall dismiss or not reappoint said Independent Auditor with the consent of all of its members, and forward a proposal for the appointment of a new Independent Auditor to the unitholders’ meeting.
4. Asset Management Company, Asset Custodian and General Administration
The asset management company, asset custodian and general administration as of January 31, 2021 are as follows.
Consignment segment Name Asset management company TLC REIT Management Inc. Asset custodian Mitsubishi UFJ Trust and Banking Corporation General administration (unitholder registry administration) Mitsubishi UFJ Trust and Banking Corporation General administration (accounting service) Reiwakaikeisha Tax Corporation General administration (administrative service) Mitsubishi UFJ Trust and Banking Corporation General administration (corporation bond service) Sumitomo Mitsui Trust Bank, Limited, MUFG Bank, Ltd.
- 9 -
Status of Managed Assets of the Investment Corporation 1. Composition of Assets of the Investment Corporation
Type of asset Area
20th Fiscal Period (as of July 31, 2020)
21st Fiscal Period (as of January 31, 2021)
Total amount owned (millions of yen) (Note 1)
Percentage of total assets (%) (Note 2)
Total amount owned (millions of yen) (Note 1)
Percentage of total assets (%) (Note 2)
Real estate
Central Tokyo 1,127 0.4 1,125 0.4 Sub-central Tokyo 7,999 3.0 7,970 2.9
Properties in trust
Central Tokyo 96,225 35.8 95,718 34.7 Sub-central Tokyo 115,794 43.1 122,274 44.4 Tokyo metropolitan area 9,901 3.7 9,297 3.4 Other major cities 14,073 5.2 13,983 5.1
Subtotal 245,122 91.1 250,370 90.9 Deposits and other assets 23,812 8.9 25,125 9.1 Total assets 268,935 100.0 275,495 100.0
(Note 1) “Total amount owned” indicates the amount posted on the balance sheets as of the closing of accounts (the book value after depreciation for real estate and properties in trust).
(Note 2) The sum may not total 100.0% since figures are rounded to the first decimal place. 2. Major Assets Owned
The overview of major assets owned by the Investment Corporation (top 10 properties in terms of period-end book value) is as follows.
Property name Book value (millions of yen)
Rentable area (m2)
Rented area (m2)
Occupancy rate (%)
Ratio to total rental revenues
(%) Main usage
COMFORIA SHINJUKU EASTSIDE TOWER 12,721 48,267.61 45,541.23 94.4 16.6 Apartment
building
COMFORIA KAMATA 5,742 6,027.98 5,403.56 89.6 1.7 Apartment building
COMFORIA HIGASHISHINJUKU STATION FRONT
5,681 4,080.10 3,916.63 96.0 1.5 Apartment building
COMFORIA SHIBUYA WEST 5,469 4,278.52 4,153.35 97.1 1.4 Apartment building
COMFORIA KOMABA 5,111 5,342.38 5,184.07 97.0 1.5 Apartment building
COMFORIA MINAMISUNAMACHI 4,607 6,141.98 5,896.41 96.0 1.5 Apartment
building COMFORIA AKIHABARA EAST 4,437 4,582.07 4,339.30 94.7 1.4 Apartment
building GRANCREER CENTER-MINAMI 4,211 18,235.67 18,235.67 100.0 1.3 Homes for
the elderly COMFORIA KITASANDO 4,143 4,962.65 4,674.64 94.2 1.4 Residence COMFORIA ITABASHINAKAJUKU 3,869 6,965.57 6,629.63 95.2 1.4 Apartment
building Total 55,995 108,884.53 103,974.49 95.5 29.8
28 2928 29

- 10 -
3. Statement of Properties Incorporated in the Portfolio The overview of assets under management of the Investment Corporation as of January 31, 2021 is as follows.
Area Property name Address Ownership form Appraisal value at end of period (millions of yen)
(Note 1)
Book value (millions of yen)
(Note 2)
Cent
ral T
okyo
COMFORIA NIHONBASHI NINGYOCHO 3-5-10 Nihonbashi Ningyocho, Chuo-ku, Tokyo
Beneficial interest in real
estate trust 2,370 1,486
COMFORIA WASEDA 147 Bentencho, Shinjuku-ku, Tokyo Beneficial
interest in real estate trust
2,650 1,832
COMFORIA SHIMOOCHIAI 2-7-10 Nakaochiai, Shinjuku-ku, Tokyo Beneficial
interest in real estate trust
1,750 1,121
COMFORIA HIGASHINAKANO 4-34-2 Kita-Shinjuku, Shinjuku-ku, Tokyo Beneficial
interest in real estate trust
751 534
COMFORIA GINZA EAST 1-3-1 Irifune, Chuo-ku, Tokyo Beneficial
interest in real estate trust
4,600 2,903
COMFORIA AZABUDAI 3-4-4 Azabudai, Minato-ku, Tokyo Beneficial
interest in real estate trust
893 544
COMFORIA SHIBAKOEN 2-2-15 Shibakoen, Minato-ku, Tokyo Beneficial
interest in real estate trust
2,000 1,351
COMFORIA NISHIAZABU 4-1-10 Nishiazabu, Minato-ku, Tokyo Beneficial
interest in real estate trust
1,100 715
COMFORIA MINAMIAOYAMA 4-1-12 Minami-Aoyama, Minato-ku, Tokyo Beneficial
interest in real estate trust
1,740 1,089
COMFORIA NISHIWASEDA 1-5-19 Takadanobaba, Shinjuku-ku, Tokyo Beneficial
interest in real estate trust
2,380 1,562
COMFORIA HARAJYUKU 3-61-3 Sendagaya, Shibuya-ku, Tokyo Beneficial
interest in real estate trust
5,620 3,513
COMFORIA MITA NORTH 2-7-16 Mita, Minato-ku, Tokyo Beneficial
interest in real estate trust
1,160 846
COMFORIA SHIBAURA BOWHOUSE 3-13-12 Kaigan, Minato-ku, Tokyo
Beneficial interest in real
estate trust 3,750 2,505
COMFORIA SHIROKANETAKANAWA 5-1-21 Mita, Minato-ku, Tokyo
Beneficial interest in real
estate trust 1,880 1,283
COMFORIA NIHONBASHI NINGYOCHO EAST 3-6-3 Nihonbashi Ningyocho, Chuo-ku, Tokyo
Beneficial interest in real
estate trust 2,770 2,029
COMFORIA ATAGO 3-23-7 Toranomon, Minato-ku, Tokyo Beneficial
interest in real estate trust
1,070 829
COMFORIA KUDAN 2-6-12 Kudan Minami, Chiyoda-ku, Tokyo Beneficial
interest in real estate trust
1,710 1,295
COMFORIA NIHONBASHI NINGYOCHO NORTH 1-1-6 Nihonbashi Horidomecho, Chuo-ku, Tokyo
Beneficial interest in real
estate trust 1,440 1,050
COMFORIA SHINKAWA 2-15-5 Shinkawa, Chuo-ku, Tokyo Beneficial
interest in real estate trust
2,370 1,759
COMFORIA AKASAKA 2-17-63 Akasaka, Minato-ku, Tokyo Beneficial
interest in real estate trust
2,970 1,889
COMFORIA MITA EAST 4-18-1 Shiba, Minato-ku, Tokyo Beneficial
interest in real estate trust
4,250 3,026
COMFORIA SHIBAURA CANAL 3-1-9 Kaigan, Minato-ku, Tokyo Beneficial
interest in real estate trust
2,000 1,529
COMFORIA KITASANDO 4-5-10 Sendagaya, Shibuya-ku, Tokyo Beneficial
interest in real estate trust
5,350 4,143
- 11 -
Area Property name Address Ownership form Appraisal value at end of period (millions of yen)
(Note 1)
Book value (millions of yen)
(Note 2)
Cent
ral T
okyo
COMFORIA YOYOGIUEHARA 2-31-5 Uehara, Shibuya-ku, Tokyo Beneficial
interest in real estate trust
2,010 1,579
COMFORIA SASAZUKA 1-59-10 Sasazuka, Shibuya-ku, Tokyo Beneficial
interest in real estate trust
2,390 1,724
COMFORIA SHINJUKUGYOEN II 1-13-3 Shinjuku, Shinjuku-ku, Tokyo
Beneficial interest in real
estate trust 2,300 1,733
COMFORIA ICHIGAYAYANAGICHO 18-2 Ichigaya Yanagicho, Shinjuku-ku, Tokyo
Beneficial interest in real
estate trust 2,100 1,596
COMFORIA KAGURAZAKA 26-1 Iwatocho, Shinjuku-ku, Tokyo Beneficial
interest in real estate trust
965 705
COMFORIA NIBANCHO 4-8 Nibancho, Chiyoda-ku, Tokyo Beneficial
interest in real estate trust
2,200 1,624
COMFORIA NISHISHINJUKU 1-20-12 Kita-Shinjuku, Shinjuku-ku, Tokyo Beneficial
interest in real estate trust
1,920 1,671
COMFORIA KANDAJINBOCHO 1-42-2 Kanda Jinbocho, Chiyoda-ku, Tokyo Beneficial
interest in real estate trust
1,860 1,469
COMFORIA NIHONBASHI 1-2-2 Nihonbashi Bakurocho, Chuo-ku, Tokyo Beneficial
interest in real estate trust
2,350 1,998
COMFORIA TAMACHI 4-5-13 Shibaura, Minato-ku, Tokyo Beneficial
interest in real estate trust
4,110 3,335
COMFORIA AZABUJUBAN 1-2-15 Mita, Minato-ku, Tokyo Beneficial
interest in real estate trust
1,680 1,448
COMFORIA SHINJUKUGYOEN I 1-10-4 Shinjuku, Shinjuku-ku, Tokyo Beneficial
interest in real estate trust
1,560 1,392
COMFORIA KAGURAZAKA DEUX 7-3 Iwatocho, Shinjuku-ku, Tokyo
Beneficial interest in real
estate trust 1,510 1,230
COMFORIA AZABU EAST 2-29-1 Higashi-Azabu, Minato-ku, Tokyo Beneficial
interest in real estate trust
3,430 1,894
COMFORIA SHINJUKU EASTSIDE TOWER
(Tower Building) 6-27-29 Shinjuku, Shinjuku-ku, Tokyo (Annex Building) 6-27-28 Shinjuku, Shinjuku-ku, Tokyo (Gate Building) 6-27-14 Shinjuku, Shinjuku-ku, Tokyo
Beneficial interest in real
estate trust 17,200 12,721
COMFORIA ICHIGAYAYAKUOJI 74-23 Ichigayayakuojimachi, Shinjuku-ku, Tokyo Beneficial
interest in real estate trust
997 974
COMFORIA AKIHABARA EAST 2-9-19 Higashikanda, Chiyoda-ku, Tokyo Beneficial
interest in real estate trust
5,300 4,437
COMFORIA MITA TROIS 3-43-6 Shiba, Minato-ku, Tokyo Beneficial
interest in real estate trust
979 924
COMFORIA SHIBAURA 2-3-33 Shibaura, Minato-ku, Tokyo Real estate 1,190 1,125
COMFORIA SHINJUKU 5-8-20 Shinjuku, Shinjuku-ku, Tokyo Beneficial
interest in real estate trust
2,370 2,261
COMFORIA HIGASHINIHONBASHI 3-6-4 Higashi-Nihonbashi, Chuo-ku, Tokyo
Beneficial interest in real
estate trust 1,340 1,255
COMFORIA GINZA EAST NIBANKAN 2-1-8 Minato, Chuo-ku, Tokyo
Beneficial interest in real
estate trust 2,570 2,523
COMFORIA HIGASHISHINJUKU STATION FRONT 7-27-12 Shinjuku, Shinjuku-ku, Tokyo
Beneficial interest in real
estate trust 5,700 5,681
COMFORIA NAKAOCHIAI 2-16-29 Nakaochiai, Shinjuku-ku, Tokyo Beneficial
interest in real estate trust
1,510 1,574
COMFORIA WASEDA DEUX 173 Bentencho, Shinjuku-ku, Tokyo Beneficial
interest in real estate trust
1,110 1,113
Subtotal 127,225 96,843 30 3130 31

- 12 -
Area Property name Address Ownership form Appraisal value at end of period (millions of yen)
(Note 1)
Book value (millions of yen)
(Note 2)
Sub-
cent
ral T
okyo
COMFORIA BUNKYOKASUGA 1-15-12 Nishikata, Bunkyo-ku, Tokyo Beneficial
interest in real estate trust
2,120 1,344
COMFORIA ASAKUSAMATSUGAYA 1-11-5 Matsugaya, Taito-ku, Tokyo
Beneficial interest in real
estate trust 1,260 807
COMFORIA NISHIOI 6-6-1 Nishi-Oi, Shinagawa-ku, Tokyo Beneficial
interest in real estate trust
1,120 850
COMFORIA NAKANO 2-40-12 Kamitakada, Nakano-ku, Tokyo Beneficial
interest in real estate trust
1,160 880
COMFORIA SHIMOKITAZAWA 1-9-14 Hanegi, Setagaya-ku, Tokyo Beneficial
interest in real estate trust
3,650 2,336
COMFORIA NISHIKAMATA 6-37-3 Nishi-Kamata, Ota-ku, Tokyo Beneficial
interest in real estate trust
2,210 1,409
COMFORIA OYAMA 4-4 Oyamacho, Itabashi-ku, Tokyo Beneficial
interest in real estate trust
2,430 1,896
COMFORIA KIYOSUMISHIRAKAWA SOUTH 3-2-13 Miyoshi, Koto-ku, Tokyo
Beneficial interest in real
estate trust 1,040 666
COMFORIA KOMAZAWA 2-1-5 Komazawa, Setagaya-ku, Tokyo Beneficial
interest in real estate trust
1,880 1,245
COMFORIA KOISHIKAWA 2-17-27 Koishikawa, Bunkyo-ku, Tokyo Beneficial
interest in real estate trust
712 541
COMFORIA SENGOKU 4-3-20 Sengoku, Bunkyo-ku, Tokyo Beneficial
interest in real estate trust
1,860 1,237
COMFORIA DAIKANYAMAAOBADAI 2-1-7 Aobadai, Meguro-ku, Tokyo
Beneficial interest in real
estate trust 1,510 903
COMFORIA IKEBUKURO 2-57-1 Ikebukuro, Toshima-ku, Tokyo Beneficial
interest in real estate trust
724 549
COMFORIA RYOGOKUISHIWARA 1-36-1 Ishiwara, Sumida-ku, Tokyo
Beneficial interest in real
estate trust 888 597
COMFORIA ASAKUSABASHI DEUX 5-24-10 Asakusabashi, Taito-ku, Tokyo
Beneficial interest in real
estate trust 1,130 819
COMFORIA OSHIAGE 4-7-2 Narihira, Sumida-ku, Tokyo Beneficial
interest in real estate trust
922 672
COMFORIA HONJOAZUMABASHI 2-11-12 Honjo, Sumida-ku, Tokyo
Beneficial interest in real
estate trust 1,050 721
COMFORIA KIYOSUMISHIRAKAWA TROIS 3-5-14 Shirakawa, Koto-ku, Tokyo
Beneficial interest in real
estate trust 1,140 813
COMFORIA MONZENNAKACHO 16-8 Fuyuki, Koto-ku, Tokyo Beneficial
interest in real estate trust
3,430 2,461
COMFORIA HIMONYA 2-3-3 Himonya, Meguro-ku, Tokyo Beneficial
interest in real estate trust
1,680 1,152
COMFORIA MISYUKU 3-23-2 Ikejiri, Setagaya-ku, Tokyo Beneficial
interest in real estate trust
2,590 1,762
COMFORIA GAKUGEIDAIGAKU 6-46-6 Shimouma, Setagaya-ku, Tokyo Beneficial
interest in real estate trust
1,740 1,096
COMFORIA HIGASHINAKANO DEUX 4-2-19 Higashi-Nakano, Nakano-ku, Tokyo
Beneficial interest in real
estate trust 1,220 784
COMFORIA HIGASHIIKEBUKURO WEST 3-22-21 Higashi-Ikebukuro, Toshima-ku, Tokyo
Beneficial interest in real
estate trust 5,580 3,647
COMFORIA RYOGOKU DEUX 1-2-10 Chitose, Sumida-ku, Tokyo Beneficial
interest in real estate trust
1,470 985
- 13 -
Area Property name Address Ownership form Appraisal value at end of period (millions of yen)
(Note 1)
Book value (millions of yen)
(Note 2)
Sub-
cent
ral T
okyo
COMFORIA OMORI DEUX 3-4-2 Omorikita, Ota-ku, Tokyo Beneficial
interest in real estate trust
1,530 1,191
COMFORIA MACHIYA 5-51-7 Arakawa, Arakawa-ku, Tokyo Beneficial
interest in real estate trust
982 612
COMFORIA ASAKUSABASHI 2-20-10 Yanagibashi, Taito-ku, Tokyo Beneficial
interest in real estate trust
3,660 2,499
COMFORIA RYOGOKU SOUTH 2-14-8 Chitose, Sumida-ku, Tokyo Beneficial
interest in real estate trust
1,700 1,161
COMFORIA TOYOSU 1-4-12 Edagawa, Koto-ku, Tokyo Beneficial
interest in real estate trust
3,980 2,893
COMFORIA SUMIDA-TACHIBANA 5-18-5 Tachibana, Sumida-ku, Tokyo
Beneficial interest in real
estate trust 1,040 913
COMFORIA UENOHIROKOJI 3-17-4 Ueno, Taito-ku, Tokyo Beneficial
interest in real estate trust
1,370 1,060
COMFORIA KASUGATOMISAKA 1-11-18 Kasuga, Bunkyo-ku, Tokyo
Beneficial interest in real
estate trust 3,930 2,781
COMFORIA HONKOMAGOME 2-29-24 Honkomagome, Bunkyo-ku, Tokyo Beneficial
interest in real estate trust
1,860 1,331
COMFORIA MORISHITA 3-6-8 Shin-Ohashi, Koto-ku, Tokyo Beneficial
interest in real estate trust
1,860 1,432
COMFORIA KIBAKOEN 2-17-7 Kiba, Koto-ku, Tokyo Beneficial
interest in real estate trust
1,230 898
COMFORIA MEGURO CHOJAMARU 2-6-25 Kami-Osaki, Shinagawa-ku, Tokyo
Beneficial interest in real
estate trust 2,580 1,936
COMFORIA HIGASHIIKEBUKURO EAST 2-8-1 Higashi-Ikebukuro, Toshima-ku, Tokyo
Beneficial interest in real
estate trust 2,660 1,617
COMFORIA HIGASHIIKEBUKURO 4-3-5 Higashi-Ikebukuro, Toshima-ku, Tokyo
Beneficial interest in real
estate trust 1,550 1,113
COMFORIA KOMABA 4-8-25 Ikejiri, Setagaya-ku, Tokyo Beneficial
interest in real estate trust
5,990 5,111
COMFORIA KINSHICHO 3-8-6 Taihei, Sumida-ku, Tokyo Beneficial
interest in real estate trust
1,320 1,024
COMFORIA MINAMISUNAMACHI 4-4-20 Minamisuna, Koto-ku, Tokyo
Beneficial interest in real
estate trust 4,980 4,607
COMFORIA HIGASHISHINAGAWA
3-22-11 Higashi-Shinagawa, Shinagawa-ku, Tokyo
Beneficial interest in real
estate trust 1,900 1,516
COMFORIA MEGUROYAKUMO 1-12-10 Yakumo, Meguro-ku, Tokyo Beneficial
interest in real estate trust
970 839
COMFORIA YOGA 3-24-3 Yoga, Setagaya-ku, Tokyo Beneficial
interest in real estate trust
1,150 1,072
COMFORIA ITABASHINAKAJUKU 62-2 Nakajuku, Itabashi-ku, Tokyo
Beneficial interest in real
estate trust 4,560 3,869
COMFORIA SHINAGAWA EAST 1-20-8 Kitashinagawa, Shinagawa-ku, Tokyo Beneficial
interest in real estate trust
1,660 1,434
COMFORIA OJIMA 4-8-10 Ojima, Koto-ku, Tokyo Real estate 2,320 2,202 COMFORIA OMORI TROIS 3-36-7 Omorikita, Ota-ku, Tokyo Real estate 1,030 902
COMFORIA BUNKYO HAKUSAN 1-3-2 Honkomagome, Bunkyo-ku, Tokyo
Beneficial interest in real
estate trust 1,480 1,424
COMFORIA KAMATA 4-21-2 Kamata, Ota-ku, Tokyo Beneficial
interest in real estate trust
7,040 5,742
32 3332 33

- 14 -
Area Property name Address Ownership form Appraisal value at end of period (millions of yen)
(Note 1)
Book value (millions of yen)
(Note 2)
Sub-
cent
ral T
okyo
COLLEGE COURT HACHIMANYAMA 1-15-1 Kamitakaido, Suginami-ku, Tokyo
Beneficial interest in real
estate trust 1,270 1,251
COMFORIA UENOIRIYA 2-6-8 Ryusen, Taito-ku, Tokyo Beneficial
interest in real estate trust
2,380 2,196
COMFORIA IKEJIRI 2-31-18 Ikejiri, Setagaya-ku, Tokyo Beneficial
interest in real estate trust
1,480 1,385
COMFORIA SETAGAYAKAMIUMA 3-6-11 Kamiuma, Setagaya-ku, Tokyo
Beneficial interest in real
estate trust 2,870 2,649
COMFORIA AKABANEIWABUCHI 26-11 Iwabuchimachi, Kita-ku, Tokyo
Beneficial interest in real
estate trust 2,720 2,749
COMFORIA RYOGOKU TROIS 1-5-15 Kamezawa, Sumida-ku, Tokyo Real estate 1,730 1,753
COLLEGE SQUARE HACHIMANYAMA 1-15-2 Kamitakaido, Suginami-ku, Tokyo
Beneficial interest in real
estate trust 930 897
COMFORIA KINSHICHO DEUX 2-10-20 Mori, Koto-ku, Tokyo Beneficial
interest in real estate trust
2,330 2,254
COMFORIA KAMEIDO SOUTH 6-25-5 Kameido, Koto-ku, Tokyo Beneficial
interest in real estate trust
2,230 2,091
COMFORIA SHIBUYA WEST 4-4-5 Aobadai, Meguro-ku, Tokyo Beneficial
interest in real estate trust
6,250 5,469
COMFORIA ASAKUSAKOMAGATA 2-4-7 Komagata, Taito-ku, Tokyo
Beneficial interest in real
estate trust 1,380 1,315
COMFORIA OMORIKASHIMA 6-20-10 Oi, Shinagawa-ku, Tokyo Beneficial
interest in real estate trust
895 909
COMFORIA OMORIMACHI 4-11-5 Omori-nishi, Ota-ku, Tokyo Beneficial
interest in real estate trust
1,210 1,182
COMFORIA KAMIIKEDAI 5-7-22 Kamiikedai, Ota-ku, Tokyo Beneficial
interest in real estate trust
2,060 1,981
CAMPUS VILLAGE SHIINAMACHI 3-2-19 Nagasaki, Toshima-ku, Tokyo
Beneficial interest in real
estate trust 2,920 2,783
COMFORIA TAKINOGAWA 7-48-2 Takinogawa, Kita-ku, Tokyo Beneficial
interest in real estate trust
3,690 3,534
COMFORIA KIBASHINSUIKOEN 3-11-13 Kiba, Koto-ku, Tokyo Beneficial
interest in real estate trust
1,370 1,377
COMFORIA NISHIMAGOME HILLSIDE 1-30-8 Nishimagome, Ota-ku, Tokyo Real estate 1,440 1,438
COMFORIA IKEBUKURO DEUX 2-19-14 Minami-Ikebukuro, Toshima-ku, Tokyo Beneficial
interest in real estate trust
1,980 1,970
COMFORIA NARIMASU 3-18-13 Asahi-cho, Nerima-ku, Tokyo Real estate 1,550 1,673
COMFORIA SHIN-OKACHIMACHI 2-18-8 Misuji, Taito-ku, Tokyo
Beneficial interest in real
estate trust 1,330 1,277
COMFORIA MORISHITA WEST 1-3-5 Shin-Ohashi, Koto-ku, Tokyo Beneficial
interest in real estate trust
1,310 1,263
COMFORIA TOYOCHO 2-26-11 Minamisuna, Koto-ku, Tokyo Beneficial
interest in real estate trust
3,850 3,796
COMFORIA FUDOMAE 5-1-12 Nishigotanda, Shinagawa-ku, Tokyo Beneficial
interest in real estate trust
1,780 1,664
Subtotal 159,803 130,245
Toky
o
met
ropo
litan
are
a COMFORIA YATSUKA 3-38-3 Sezaki, Soka-shi, Saitama Beneficial
interest in real estate trust
753 634
COMFORIA SHINKOYASU 2-216-2 Koyasudori, Kanagawa-ku, Yokohama-shi, Kanagawa
Beneficial interest in real
estate trust 1,320 1,007
COMFORIA GYOTOKU 2-1-13 Gyotokuekimae, Ichikawa-shi, Chiba Beneficial
interest in real estate trust
1,110 1,023
- 15 -
Area Property name Address Ownership form Appraisal value at end of period (millions of yen)
(Note 1)
Book value (millions of yen)
(Note 2)
Toky
o m
etro
polit
an ar
ea
GRANCREER CENTER-MINAMI 40-3 Chigasaki Chuo, Tsuzuki-ku, Yokohama-shi, Kanagawa
Beneficial interest in real
estate trust 4,210 4,211
COMFORIA TAMA-PLAZA 2-12-1 Utsukushigaoka, Aoba-ku, Yokohama-shi, Kanagawa
Beneficial interest in real
estate trust 2,260 2,420
Subtotal 9,653 9,297
Oth
er m
ajor
citi
es
COMFORIA SHIN-OSAKA 1-21-24 Higashi-Nakajima, Higashi-Yodogawa-ku, Osaka-shi, Osaka
Beneficial interest in real
estate trust 3,030 2,216
COMFORIA KITASANJO 2-2-51 Kita-Sanjo Higashi, Chuo-ku, Sapporo-shi, Hokkaido
Beneficial interest in real
estate trust 1,020 643
COMFORIA SAPPORO SHOKUBUTSUEN
10-1-6 Kitanijo-Nishi, Chuo-ku, Sapporo-shi, Hokkaido
Beneficial interest in real
estate trust 1,400 1,271
COMFORIA OGIMACHI 3-7-15 Tenjinbashi, Kita-ku, Osaka-shi, Osaka Beneficial
interest in real estate trust
1,570 1,482
COMFORIA SHINSAIBASHI EAST 2-6-8 Bakuromachi, Chuo-ku, Osaka-shi, Osaka
Beneficial interest in real
estate trust 2,100 1,992
COMFORIA KYOMACHIBORI 1-16-14 Kyomachibori, Nishi-ku, Osaka-shi, Osaka
Beneficial interest in real
estate trust 1,820 1,571
COMFORIA AWAZA 1-5-5 Enokojima, Nishi-ku, Osaka-shi, Osaka Beneficial
interest in real estate trust
1,450 1,293
COMFORIA KITAHAMA 2-1-14 Imabashi, Chuo-ku, Osaka-shi, Osaka Beneficial
interest in real estate trust
1,920 1,738
COMFORIA ESAKAHIROSHIBACHO 19-13 Hiroshibacho, Suita-shi, Osaka
Beneficial interest in real
estate trust 1,730 1,773
Subtotal 16,040 13,983 Total 312,721 250,370
(Note 1) “Appraisal value at end of period” indicates the appraisal value by a real estate appraiser (based on real estate appraisal reports or research reports prepared by the Japan Real Estate Institute, Daiwa Real Estate Appraisal Co., Ltd., The Tanizawa Sōgō Appraisal Co., Ltd., JLL Morii Valuation & Advisory K.K. and Japan Valuers Co., Ltd., with the account closing date as the date of value estimate), pursuant to the method of asset appraisal stipulated in the Articles of Incorporation of the Investment Corporation as well as the “Ordinance on Accountings of Investment Corporations” (Cabinet Office Ordinance No. 47 of 2006).
(Note 2) “Book value” indicates the acquisition price (including miscellaneous expenses related to the acquisition) as of the end of the 21st Fiscal Period (January 31, 2021) minus accumulated depreciation.
34 3534 35

- 16 -
The overview of the rental business by assets under management of the Investment Corporation is as follows.
Area Property name
20th Fiscal Period (From February 1, 2020 to July 31, 2020)
21st Fiscal Period (From August 1, 2020 to January 31, 2021)
Total number of tenants
(at end of period) (Note 1)
Occupancy rate (at end of period)
(%) (Note 2)
Rental revenue (during period) (thousands of yen)
Ratio to total rental
revenues (%)
Total number of tenants
(at end of period) (Note 1)
Occupancy rate (at end of period)
(%) (Note 2)
Rental revenue (during period) (thousands of yen)
Ratio to total rental
revenues (%)
Cent
ral T
okyo
COMFORIA NIHONBASHI NINGYOCHO 1 100.0 60,534 0.7 1 93.4 60,726 0.7
COMFORIA WASEDA 1 97.9 68,091 0.8 1 96.9 64,472 0.7 COMFORIA SHIMOOCHIAI 1 95.5 47,530 0.5 1 98.3 48,593 0.5 COMFORIA HIGASHINAKANO 1 94.5 21,700 0.2 1 94.5 21,380 0.2 COMFORIA GINZA EAST 1 96.7 119,982 1.3 1 97.1 118,552 1.3 COMFORIA AZABUDAI 1 100.0 22,778 0.3 1 97.1 22,489 0.2 COMFORIA SHIBAKOEN 1 98.3 51,276 0.6 1 98.4 51,140 0.6 COMFORIA NISHIAZABU 1 100.0 27,152 0.3 1 80.3 25,881 0.3 COMFORIA MINAMIAOYAMA 1 93.8 44,932 0.5 1 90.7 39,212 0.4 COMFORIA NISHIWASEDA 1 87.9 62,270 0.7 1 94.9 56,619 0.6 COMFORIA HARAJYUKU 1 87.4 124,561 1.4 1 98.1 122,542 1.4 COMFORIA MITA NORTH 1 93.4 29,543 0.3 1 90.0 28,359 0.3 COMFORIA SHIBAURA BOWHOUSE 1 92.0 100,639 1.1 1 96.0 100,542 1.1
COMFORIA SHIROKANETAKANAWA 1 97.4 48,415 0.5 1 95.0 46,283 0.5
COMFORIA NIHONBASHI NINGYOCHO EAST 1 93.8 68,727 0.8 1 96.4 67,812 0.7
COMFORIA ATAGO 1 95.0 30,109 0.3 1 92.5 28,803 0.3 COMFORIA KUDAN 1 96.7 41,679 0.5 1 97.2 43,703 0.5 COMFORIA NIHONBASHI NINGYOCHO NORTH 1 97.2 38,993 0.4 1 97.2 36,940 0.4
COMFORIA SHINKAWA 1 93.3 61,196 0.7 1 98.3 58,369 0.6 COMFORIA AKASAKA 1 97.5 68,315 0.8 1 89.9 68,474 0.8 COMFORIA MITA EAST 1 94.1 104,435 1.2 1 92.6 99,386 1.1 COMFORIA SHIBAURA CANAL 1 98.9 56,475 0.6 1 93.7 54,402 0.6 COMFORIA KITASANDO 1 92.8 136,027 1.5 1 94.2 130,674 1.4 COMFORIA YOYOGIUEHARA 1 90.4 49,771 0.6 1 97.2 50,055 0.6 COMFORIA SASAZUKA 1 99.0 68,168 0.8 1 97.0 66,411 0.7 COMFORIA SHINJUKUGYOEN II 1 93.7 58,679 0.6 1 95.8 53,759 0.6 COMFORIA ICHIGAYAYANAGICHO 1 92.5 51,967 0.6 1 93.0 50,760 0.6
COMFORIA KAGURAZAKA 1 91.4 23,539 0.3 1 100.0 25,277 0.3 COMFORIA NIBANCHO 1 91.2 51,396 0.6 1 100.0 49,369 0.5 COMFORIA NISHISHINJUKU 1 94.4 45,651 0.5 1 98.5 48,219 0.5 COMFORIA KANDAJINBOCHO 1 97.7 44,721 0.5 1 97.6 44,609 0.5 COMFORIA NIHONBASHI 1 97.0 65,429 0.7 1 93.1 71,850 0.8 COMFORIA TAMACHI 1 93.1 99,803 1.1 1 95.8 99,894 1.1 COMFORIA AZABUJUBAN 1 90.9 45,732 0.5 1 94.5 44,719 0.5 COMFORIA SHINJUKUGYOEN I 1 91.5 46,184 0.5 1 94.8 41,074 0.5 COMFORIA KAGURAZAKA DEUX 1 94.0 41,296 0.5 1 97.0 40,729 0.4 COMFORIA AZABU EAST 1 100.0 77,766 0.9 1 95.9 77,465 0.9 COMFORIA SHINJUKU EASTSIDE TOWER 1 92.2 1,551,528 17.2 1 94.4 1,508,507 16.6
COMFORIA ICHIGAYAYAKUOJI 1 100.0 27,139 0.3 1 96.2 25,208 0.3 COMFORIA AKIHABARA EAST 1 95.6 129,605 1.4 1 94.7 125,301 1.4 COMFORIA MITA TROIS 1 96.9 24,948 0.3 1 94.0 24,560 0.3 COMFORIA SHIBAURA 1 93.1 27,265 0.3 1 83.9 27,629 0.3 COMFORIA SHINJUKU 1 90.2 59,449 0.7 1 97.2 48,441 0.5 COMFORIA HIGASHINIHONBASHI 1 94.1 35,624 0.4 1 98.2 35,354 0.4
COMFORIA GINZA EAST NIBANKAN 1 91.2 50,796 0.6 1 94.2 49,829 0.5
COMFORIA HIGASHISHINJUKU STATION FRONT 1 98.7 130,765 1.4 1 96.0 134,150 1.5
COMFORIA NAKAOCHIAI 1 87.3 30,180 0.3 1 97.0 34,773 0.4 COMFORIA WASEDA DEUX 1 94.5 21,205 0.2 1 96.4 24,829 0.3
Subtotal 1 93.8 4,293,989 47.6 1 95.1 4,198,147 46.3
- 17 -
Area Property name
20th Fiscal Period (From February 1, 2020 to July 31, 2020)
21st Fiscal Period (From August 1, 2020 to January 31, 2021)
Total number of tenants
(at end of period) (Note 1)
Occupancy rate (at end of period)
(%) (Note 2)
Rental revenue (during period) (thousands of yen)
Ratio to total rental
revenues (%)
Total number of tenants
(at end of period) (Note 1)
Occupancy rate (at end of period)
(%) (Note 2)
Rental revenue (during period) (thousands of yen)
Ratio to total rental
revenues (%)
Sub-
cent
ral T
okyo
COMFORIA BUNKYOKASUGA 1 94.5 64,030 0.7 1 90.3 60,774 0.7 COMFORIA ASAKUSAMATSUGAYA 1 95.0 46,629 0.5 1 95.7 46,252 0.5
COMFORIA NISHIOI 1 98.3 32,760 0.4 1 94.9 31,658 0.3 COMFORIA NAKANO 1 92.3 32,307 0.4 1 100.0 30,098 0.3 COMFORIA SHIMOKITAZAWA 1 97.4 95,059 1.1 1 96.1 95,666 1.1 COMFORIA NISHIKAMATA 1 99.1 68,576 0.8 1 93.9 66,939 0.7 COMFORIA OYAMA 1 94.6 79,789 0.9 1 97.5 79,112 0.9 COMFORIA KIYOSUMISHIRAKAWA SOUTH 1 97.8 28,421 0.3 1 100.0 28,732 0.3
COMFORIA KOMAZAWA 1 97.6 43,888 0.5 1 96.0 43,810 0.5 COMFORIA KOISHIKAWA 1 97.4 22,812 0.3 1 95.0 21,801 0.2 COMFORIA SENGOKU 1 100.0 57,356 0.6 1 100.0 56,849 0.6 COMFORIA DAIKANYAMAAOBADAI 1 96.0 37,947 0.4 1 95.4 38,436 0.4
COMFORIA IKEBUKURO 1 89.2 22,826 0.3 1 96.2 21,279 0.2 COMFORIA RYOGOKUISHIWARA 1 100.0 25,597 0.3 1 100.0 25,590 0.3
COMFORIA ASAKUSABASHI DEUX 1 91.1 30,087 0.3 1 95.3 31,135 0.3
COMFORIA OSHIAGE 1 94.3 27,314 0.3 1 97.4 25,095 0.3 COMFORIA HONJOAZUMABASHI 1 98.2 28,493 0.3 1 94.7 29,375 0.3
COMFORIA KIYOSUMISHIRAKAWA TROIS 1 100.0 32,557 0.4 1 94.1 31,752 0.4
COMFORIA MONZENNAKACHO 1 97.2 95,390 1.1 1 97.9 89,870 1.0 COMFORIA HIMONYA 1 95.6 42,764 0.5 1 97.3 44,001 0.5 COMFORIA MISYUKU 1 98.4 67,667 0.7 1 98.3 69,677 0.8 COMFORIA GAKUGEIDAIGAKU 1 90.9 41,708 0.5 1 92.7 39,793 0.4 COMFORIA HIGASHINAKANO DEUX 1 87.9 29,796 0.3 1 94.1 30,444 0.3
COMFORIA HIGASHIIKEBUKURO WEST 1 92.7 170,487 1.9 1 95.0 160,171 1.8
COMFORIA RYOGOKU DEUX 1 94.0 38,567 0.4 1 96.1 38,005 0.4 COMFORIA OMORI DEUX 1 100.0 42,391 0.5 1 95.4 39,657 0.4 COMFORIA MACHIYA 1 87.8 26,430 0.3 1 97.0 26,992 0.3 COMFORIA ASAKUSABASHI 1 94.8 103,752 1.1 1 94.5 102,915 1.1 COMFORIA RYOGOKU SOUTH 1 95.7 49,750 0.6 1 100.0 48,744 0.5 COMFORIA TOYOSU 1 96.9 105,491 1.2 1 91.9 100,745 1.1 COMFORIA SUMIDA-TACHIBANA 1 93.9 32,025 0.4 1 100.0 32,297 0.4
COMFORIA UENOHIROKOJI 1 88.3 34,695 0.4 1 94.8 33,031 0.4 COMFORIA KASUGATOMISAKA 1 99.4 96,524 1.1 1 97.6 93,672 1.0 COMFORIA HONKOMAGOME 1 100.0 46,521 0.5 1 94.5 48,031 0.5 COMFORIA MORISHITA 1 98.7 50,727 0.6 1 93.8 48,580 0.5 COMFORIA KIBAKOEN 1 96.7 34,268 0.4 1 96.7 31,751 0.4 COMFORIA MEGURO CHOJAMARU 1 93.7 71,380 0.8 1 93.6 69,819 0.8
COMFORIA NISHIMAGOME (Note 3) 1 100.0 34,225 0.4 - - 26,136 0.3
COMFORIA HIGASHIIKEBUKURO EAST 1 95.5 70,510 0.8 1 94.4 70,199 0.8
COMFORIA HIGASHIIKEBUKURO 1 95.3 37,870 0.4 1 97.8 37,458 0.4
COMFORIA KOMABA 1 90.8 132,374 1.5 1 97.0 134,489 1.5 COMFORIA KINSHICHO 1 96.3 36,583 0.4 1 98.2 33,693 0.4 COMFORIA MINAMISUNAMACHI 1 96.5 137,388 1.5 1 96.0 137,067 1.5
COMFORIA HIGASHISHINAGAWA 1 98.2 52,286 0.6 1 98.2 54,116 0.6
COMFORIA MEGUROYAKUMO 1 94.7 26,254 0.3 1 94.9 27,085 0.3 COMFORIA YOGA 1 97.8 32,613 0.4 1 95.6 31,961 0.4 COMFORIA ITABASHINAKAJUKU 1 94.4 126,555 1.4 1 95.2 123,997 1.4
36 3736 37
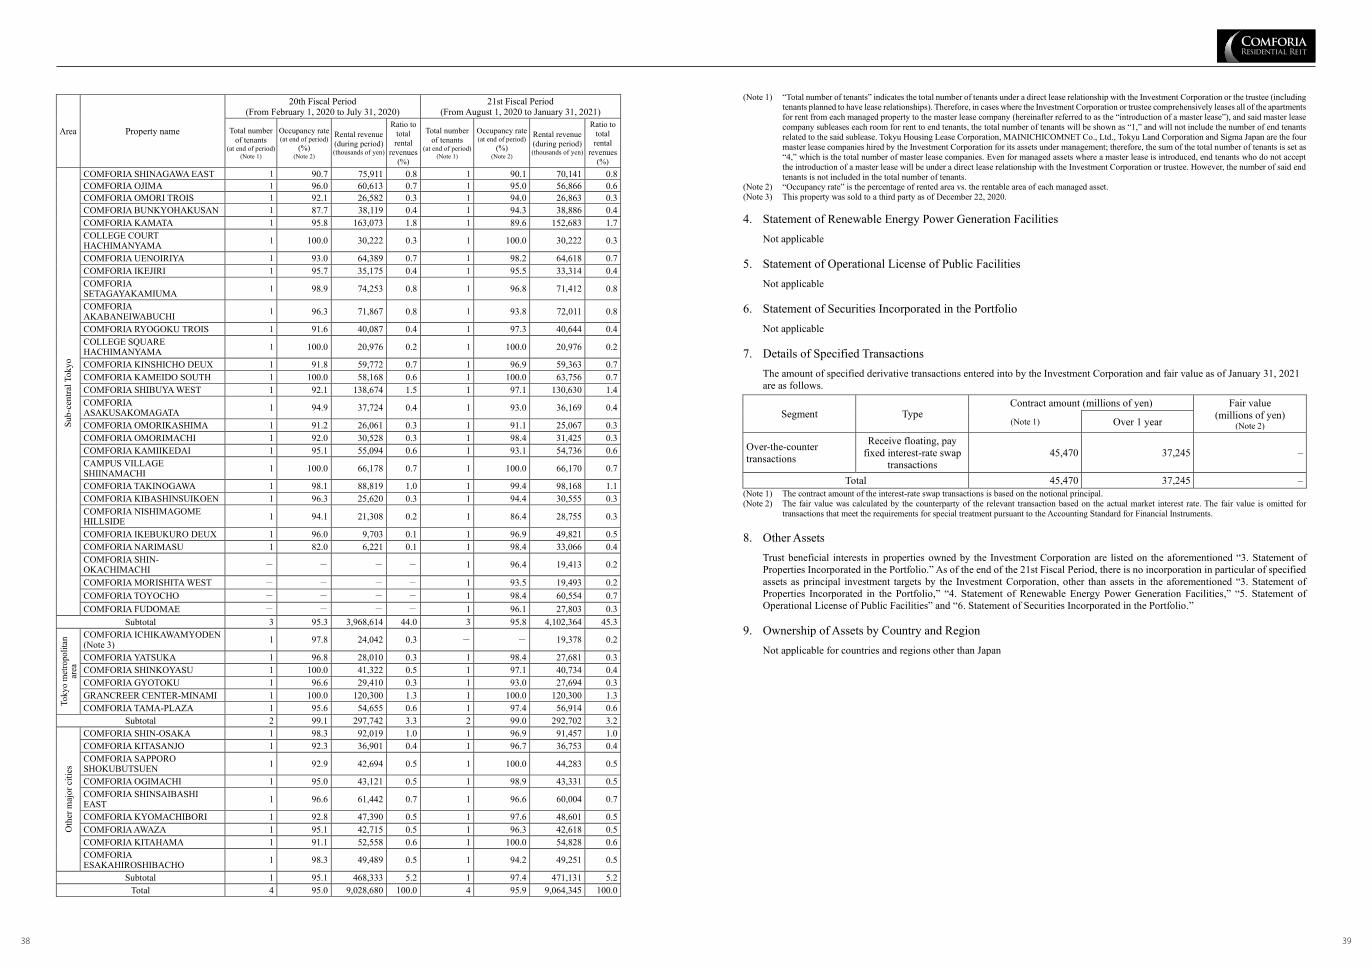
- 18 -
Area Property name
20th Fiscal Period (From February 1, 2020 to July 31, 2020)
21st Fiscal Period (From August 1, 2020 to January 31, 2021)
Total number of tenants
(at end of period) (Note 1)
Occupancy rate (at end of period)
(%) (Note 2)
Rental revenue (during period) (thousands of yen)
Ratio to total rental
revenues (%)
Total number of tenants
(at end of period) (Note 1)
Occupancy rate (at end of period)
(%) (Note 2)
Rental revenue (during period) (thousands of yen)
Ratio to total rental
revenues (%)
Sub-
cent
ral T
okyo
COMFORIA SHINAGAWA EAST 1 90.7 75,911 0.8 1 90.1 70,141 0.8 COMFORIA OJIMA 1 96.0 60,613 0.7 1 95.0 56,866 0.6 COMFORIA OMORI TROIS 1 92.1 26,582 0.3 1 94.0 26,863 0.3 COMFORIA BUNKYOHAKUSAN 1 87.7 38,119 0.4 1 94.3 38,886 0.4 COMFORIA KAMATA 1 95.8 163,073 1.8 1 89.6 152,683 1.7 COLLEGE COURT HACHIMANYAMA 1 100.0 30,222 0.3 1 100.0 30,222 0.3
COMFORIA UENOIRIYA 1 93.0 64,389 0.7 1 98.2 64,618 0.7 COMFORIA IKEJIRI 1 95.7 35,175 0.4 1 95.5 33,314 0.4 COMFORIA SETAGAYAKAMIUMA 1 98.9 74,253 0.8 1 96.8 71,412 0.8
COMFORIA AKABANEIWABUCHI 1 96.3 71,867 0.8 1 93.8 72,011 0.8
COMFORIA RYOGOKU TROIS 1 91.6 40,087 0.4 1 97.3 40,644 0.4 COLLEGE SQUARE HACHIMANYAMA 1 100.0 20,976 0.2 1 100.0 20,976 0.2
COMFORIA KINSHICHO DEUX 1 91.8 59,772 0.7 1 96.9 59,363 0.7 COMFORIA KAMEIDO SOUTH 1 100.0 58,168 0.6 1 100.0 63,756 0.7 COMFORIA SHIBUYA WEST 1 92.1 138,674 1.5 1 97.1 130,630 1.4 COMFORIA ASAKUSAKOMAGATA 1 94.9 37,724 0.4 1 93.0 36,169 0.4
COMFORIA OMORIKASHIMA 1 91.2 26,061 0.3 1 91.1 25,067 0.3 COMFORIA OMORIMACHI 1 92.0 30,528 0.3 1 98.4 31,425 0.3 COMFORIA KAMIIKEDAI 1 95.1 55,094 0.6 1 93.1 54,736 0.6 CAMPUS VILLAGE SHIINAMACHI 1 100.0 66,178 0.7 1 100.0 66,170 0.7
COMFORIA TAKINOGAWA 1 98.1 88,819 1.0 1 99.4 98,168 1.1 COMFORIA KIBASHINSUIKOEN 1 96.3 25,620 0.3 1 94.4 30,555 0.3 COMFORIA NISHIMAGOME HILLSIDE 1 94.1 21,308 0.2 1 86.4 28,755 0.3
COMFORIA IKEBUKURO DEUX 1 96.0 9,703 0.1 1 96.9 49,821 0.5 COMFORIA NARIMASU 1 82.0 6,221 0.1 1 98.4 33,066 0.4 COMFORIA SHIN-OKACHIMACHI - - - - 1 96.4 19,413 0.2
COMFORIA MORISHITA WEST - - - - 1 93.5 19,493 0.2 COMFORIA TOYOCHO - - - - 1 98.4 60,554 0.7 COMFORIA FUDOMAE - - - - 1 96.1 27,803 0.3
Subtotal 3 95.3 3,968,614 44.0 3 95.8 4,102,364 45.3
Toky
o m
etro
polit
an
area
COMFORIA ICHIKAWAMYODEN (Note 3) 1 97.8 24,042 0.3 - - 19,378 0.2
COMFORIA YATSUKA 1 96.8 28,010 0.3 1 98.4 27,681 0.3 COMFORIA SHINKOYASU 1 100.0 41,322 0.5 1 97.1 40,734 0.4 COMFORIA GYOTOKU 1 96.6 29,410 0.3 1 93.0 27,694 0.3 GRANCREER CENTER-MINAMI 1 100.0 120,300 1.3 1 100.0 120,300 1.3 COMFORIA TAMA-PLAZA 1 95.6 54,655 0.6 1 97.4 56,914 0.6
Subtotal 2 99.1 297,742 3.3 2 99.0 292,702 3.2
Oth
er m
ajor
citi
es
COMFORIA SHIN-OSAKA 1 98.3 92,019 1.0 1 96.9 91,457 1.0 COMFORIA KITASANJO 1 92.3 36,901 0.4 1 96.7 36,753 0.4 COMFORIA SAPPORO SHOKUBUTSUEN 1 92.9 42,694 0.5 1 100.0 44,283 0.5
COMFORIA OGIMACHI 1 95.0 43,121 0.5 1 98.9 43,331 0.5 COMFORIA SHINSAIBASHI EAST 1 96.6 61,442 0.7 1 96.6 60,004 0.7
COMFORIA KYOMACHIBORI 1 92.8 47,390 0.5 1 97.6 48,601 0.5 COMFORIA AWAZA 1 95.1 42,715 0.5 1 96.3 42,618 0.5 COMFORIA KITAHAMA 1 91.1 52,558 0.6 1 100.0 54,828 0.6 COMFORIA ESAKAHIROSHIBACHO 1 98.3 49,489 0.5 1 94.2 49,251 0.5
Subtotal 1 95.1 468,333 5.2 1 97.4 471,131 5.2 Total 4 95.0 9,028,680 100.0 4 95.9 9,064,345 100.0
- 19 -
(Note 1) “Total number of tenants” indicates the total number of tenants under a direct lease relationship with the Investment Corporation or the trustee (including tenants planned to have lease relationships). Therefore, in cases where the Investment Corporation or trustee comprehensively leases all of the apartments for rent from each managed property to the master lease company (hereinafter referred to as the “introduction of a master lease”), and said master lease company subleases each room for rent to end tenants, the total number of tenants will be shown as “1,” and will not include the number of end tenants related to the said sublease. Tokyu Housing Lease Corporation, MAINICHICOMNET Co., Ltd., Tokyu Land Corporation and Sigma Japan are the four master lease companies hired by the Investment Corporation for its assets under management; therefore, the sum of the total number of tenants is set as “4,” which is the total number of master lease companies. Even for managed assets where a master lease is introduced, end tenants who do not accept the introduction of a master lease will be under a direct lease relationship with the Investment Corporation or trustee. However, the number of said end tenants is not included in the total number of tenants.
(Note 2) “Occupancy rate” is the percentage of rented area vs. the rentable area of each managed asset. (Note 3) This property was sold to a third party as of December 22, 2020. 4. Statement of Renewable Energy Power Generation Facilities
Not applicable 5. Statement of Operational License of Public Facilities
Not applicable 6. Statement of Securities Incorporated in the Portfolio
Not applicable 7. Details of Specified Transactions
The amount of specified derivative transactions entered into by the Investment Corporation and fair value as of January 31, 2021 are as follows.
Segment Type Contract amount (millions of yen) Fair value
(millions of yen) (Note 2) (Note 1) Over 1 year
Over-the-counter transactions
Receive floating, pay fixed interest-rate swap
transactions 45,470 37,245 –
Total 45,470 37,245 – (Note 1) The contract amount of the interest-rate swap transactions is based on the notional principal. (Note 2) The fair value was calculated by the counterparty of the relevant transaction based on the actual market interest rate. The fair value is omitted for
transactions that meet the requirements for special treatment pursuant to the Accounting Standard for Financial Instruments. 8. Other Assets
Trust beneficial interests in properties owned by the Investment Corporation are listed on the aforementioned “3. Statement of Properties Incorporated in the Portfolio.” As of the end of the 21st Fiscal Period, there is no incorporation in particular of specified assets as principal investment targets by the Investment Corporation, other than assets in the aforementioned “3. Statement of Properties Incorporated in the Portfolio,” “4. Statement of Renewable Energy Power Generation Facilities,” “5. Statement of Operational License of Public Facilities” and “6. Statement of Securities Incorporated in the Portfolio.”
9. Ownership of Assets by Country and Region
Not applicable for countries and regions other than Japan
38 3938 39

- 20 -
Capital Expenditure for Properties Owned 1. Expected Capital Expenditure
Major capital expenditure that accompanies repair work currently planned for assets already acquired (includes assets under management that were acquired after the account closing date) is as follows. The following expected amount of construction work includes portions that are separately accounted under expenses.
Property name (location) Purpose Scheduled period
Expected amount of construction work (thousands of yen)
Total amount Payment for the period
Total amount already paid
COMFORIA SHIBAURA BOWHOUSE (Minato-ku, Tokyo)
Large-scale repair work From Aug. 2020 to Mar. 2021
74,800 - -
COMFORIA AKABANEIWABUCHI (Kita-ku, Tokyo)
Large-scale repair work From Aug. 2020 to Mar. 2021
68,000 - -
COMFORIA NISHIWASEDA (Shinjuku-ku, Tokyo) Large-scale repair work From Aug. 2021
to Jan. 2022 62,900 - -
COMFORIA MISYUKU (Setagaya-ku, Tokyo) Large-scale repair work From Aug. 2021
to Jan. 2022 53,600 - -
COMFORIA KANDAJINBOCHO (Chiyoda-ku, Tokyo)
Large-scale repair work From Aug. 2020 to Mar. 2021
53,300 - -
2. Capital Expenditure during the Period
The overview of main construction work corresponding to capital expenditure that took place in the 21st Fiscal Period for the managed assets owned as of the end of the period is as follows. Capital expenditure during the 21st Fiscal Period was ¥137,605 thousand. Together with repair expenses of ¥326,772 thousand that were classified as expenses for the 21st Fiscal Period, construction work totaling ¥464,377 thousand was carried out.
Property name (location) Purpose Period Construction cost
(thousands of yen)
COMFORIA TAMA-PLAZA (Yokohama-shi, Kanagawa) Renovation of waterproofing From Sep. 2020
to Dec. 2020 29,375
COMFORIA SHINJUKU EASTSIDE TOWER (Shinjuku-ku, Tokyo)
Replacement of furniture and fixtures for common facilities
From Dec. 2020 to Dec. 2020
5,232
COMFORIA WASEDA DEUX (Shinjuku-ku, Tokyo) Renovation of exclusive areas From Jan. 2021
to Jan. 2021 2,246
Other properties, etc. Replacement of air conditioners, etc. From Aug. 2020 to Jan. 2021
100,750
Total 137,605
- 21 -
3. Funding Reserved for Long-Term Repair Plans From the cash flows during the fiscal period, the Investment Corporation sets aside reserves for repairs, which are to be appropriated for repairs in the medium to long term. (Thousands of yen)
Fiscal period 17th Fiscal Period 18th Fiscal Period 19th Fiscal Period 20th Fiscal Period 21st Fiscal Period
From Aug. 1, 2018 to Jan. 31, 2019
From Feb. 1, 2019 to Jul. 31, 2019
From Aug. 1, 2019 to Jan. 31, 2020
From Feb. 1, 2020 to Jul. 31, 2020
From Aug. 1, 2020 to Jan. 31, 2021
Balance of reserves at the beginning of period 357,243 396,925 398,483 386,748 639,150
Amount of reserves during period 477,118 624,729 559,814 921,967 330,220
Reversal of reserves during period 437,436 623,170 571,549 669,566 587,519
Amount carried forward to next period 396,925 398,483 386,748 639,150 381,851
(Note) For certain managed assets with sectional ownership, the Investment Corporation pays reserves for repairs to the management associations each month, but such amounts are not included in the table above.
40 4140 41
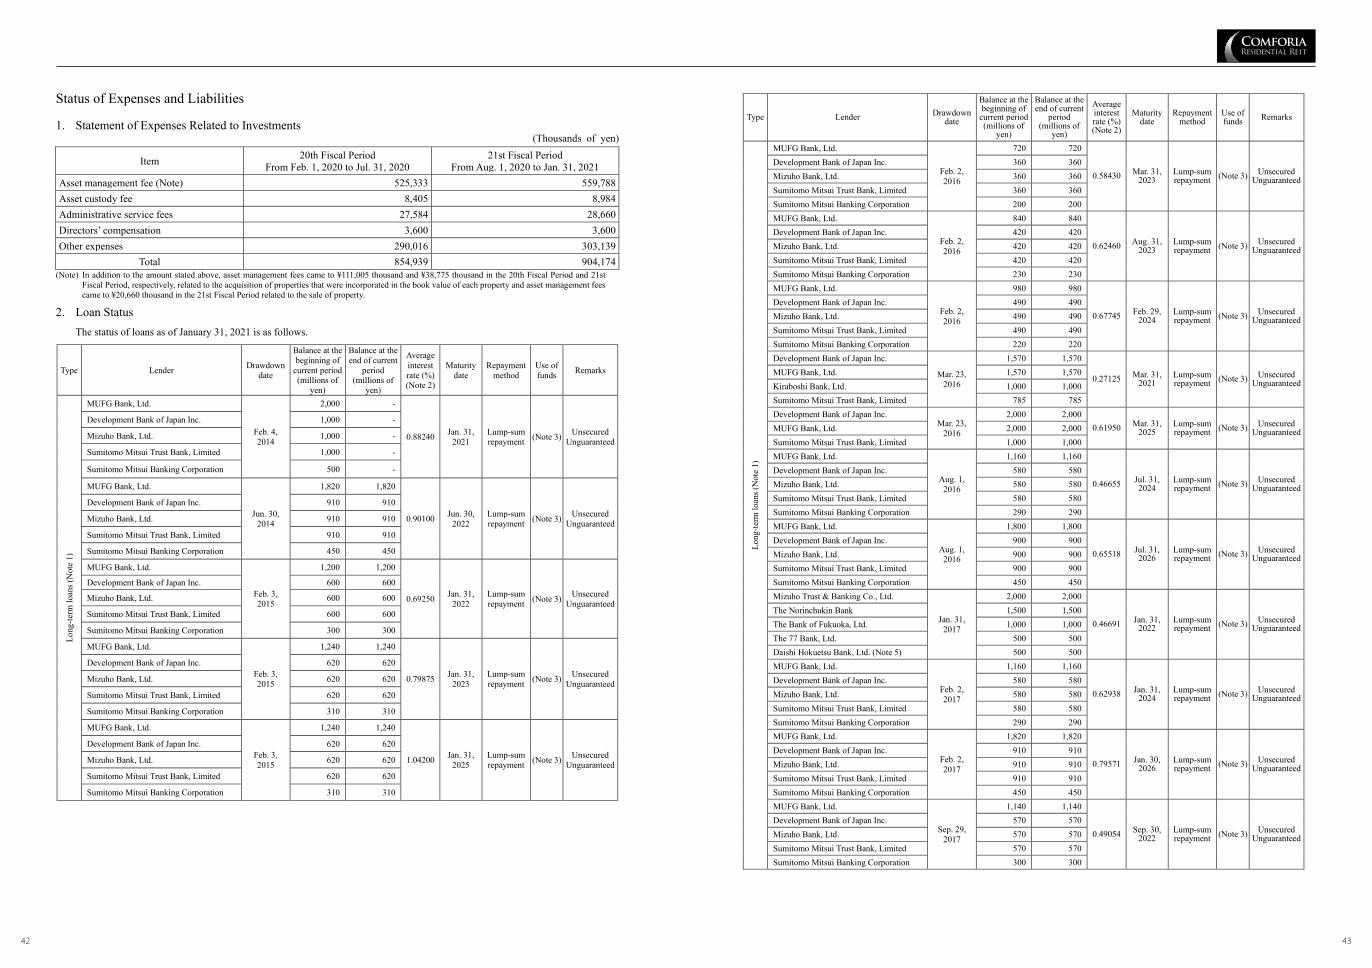
- 22 -
Status of Expenses and Liabilities 1. Statement of Expenses Related to Investments
(Thousands of yen)
Item 20th Fiscal Period From Feb. 1, 2020 to Jul. 31, 2020
21st Fiscal Period From Aug. 1, 2020 to Jan. 31, 2021
Asset management fee (Note) 525,333 559,788 Asset custody fee 8,405 8,984 Administrative service fees 27,584 28,660 Directors’ compensation 3,600 3,600 Other expenses 290,016 303,139
Total 854,939 904,174 (Note) In addition to the amount stated above, asset management fees came to ¥111,005 thousand and ¥38,775 thousand in the 20th Fiscal Period and 21st
Fiscal Period, respectively, related to the acquisition of properties that were incorporated in the book value of each property and asset management fees came to ¥20,660 thousand in the 21st Fiscal Period related to the sale of property.
2. Loan Status
The status of loans as of January 31, 2021 is as follows.
Type Lender Drawdown date
Balance at the beginning of
current period (millions of
yen)
Balance at the end of current
period (millions of
yen)
Average interest rate (%) (Note 2)
Maturity date
Repayment method
Use of funds Remarks
Long
-term
loan
s (N
ote
1)
MUFG Bank, Ltd.
Feb. 4, 2014
2,000 -
0.88240 Jan. 31, 2021
Lump-sum repayment (Note 3) Unsecured
Unguaranteed
Development Bank of Japan Inc. 1,000 -
Mizuho Bank, Ltd. 1,000 -
Sumitomo Mitsui Trust Bank, Limited 1,000 -
Sumitomo Mitsui Banking Corporation 500 -
MUFG Bank, Ltd.
Jun. 30, 2014
1,820 1,820
0.90100 Jun. 30, 2022
Lump-sum repayment (Note 3) Unsecured
Unguaranteed
Development Bank of Japan Inc. 910 910
Mizuho Bank, Ltd. 910 910
Sumitomo Mitsui Trust Bank, Limited 910 910
Sumitomo Mitsui Banking Corporation 450 450
MUFG Bank, Ltd.
Feb. 3, 2015
1,200 1,200
0.69250 Jan. 31, 2022
Lump-sum repayment (Note 3) Unsecured
Unguaranteed
Development Bank of Japan Inc. 600 600
Mizuho Bank, Ltd. 600 600
Sumitomo Mitsui Trust Bank, Limited 600 600
Sumitomo Mitsui Banking Corporation 300 300
MUFG Bank, Ltd.
Feb. 3, 2015
1,240 1,240
0.79875 Jan. 31, 2023
Lump-sum repayment (Note 3) Unsecured
Unguaranteed
Development Bank of Japan Inc. 620 620
Mizuho Bank, Ltd. 620 620
Sumitomo Mitsui Trust Bank, Limited 620 620
Sumitomo Mitsui Banking Corporation 310 310
MUFG Bank, Ltd.
Feb. 3, 2015
1,240 1,240
1.04200 Jan. 31, 2025
Lump-sum repayment (Note 3) Unsecured
Unguaranteed
Development Bank of Japan Inc. 620 620
Mizuho Bank, Ltd. 620 620
Sumitomo Mitsui Trust Bank, Limited 620 620
Sumitomo Mitsui Banking Corporation 310 310
- 23 -
Type Lender Drawdown date
Balance at the beginning of
current period (millions of
yen)
Balance at the end of current
period (millions of
yen)
Average interest rate (%) (Note 2)
Maturity date
Repayment method
Use of funds Remarks
Long
-term
loan
s (N
ote
1)
MUFG Bank, Ltd.
Feb. 2, 2016
720 720
0.58430 Mar. 31, 2023
Lump-sum repayment (Note 3) Unsecured
Unguaranteed
Development Bank of Japan Inc. 360 360 Mizuho Bank, Ltd. 360 360 Sumitomo Mitsui Trust Bank, Limited 360 360 Sumitomo Mitsui Banking Corporation 200 200 MUFG Bank, Ltd.
Feb. 2, 2016
840 840
0.62460 Aug. 31, 2023
Lump-sum repayment (Note 3) Unsecured
Unguaranteed
Development Bank of Japan Inc. 420 420 Mizuho Bank, Ltd. 420 420 Sumitomo Mitsui Trust Bank, Limited 420 420 Sumitomo Mitsui Banking Corporation 230 230 MUFG Bank, Ltd.
Feb. 2, 2016
980 980
0.67745 Feb. 29, 2024
Lump-sum repayment (Note 3) Unsecured
Unguaranteed
Development Bank of Japan Inc. 490 490 Mizuho Bank, Ltd. 490 490 Sumitomo Mitsui Trust Bank, Limited 490 490 Sumitomo Mitsui Banking Corporation 220 220 Development Bank of Japan Inc.
Mar. 23, 2016
1,570 1,570
0.27125 Mar. 31, 2021
Lump-sum repayment (Note 3) Unsecured
Unguaranteed MUFG Bank, Ltd. 1,570 1,570 Kiraboshi Bank, Ltd. 1,000 1,000 Sumitomo Mitsui Trust Bank, Limited 785 785 Development Bank of Japan Inc.
Mar. 23, 2016
2,000 2,000 0.61950 Mar. 31,
2025 Lump-sum repayment (Note 3) Unsecured
Unguaranteed MUFG Bank, Ltd. 2,000 2,000 Sumitomo Mitsui Trust Bank, Limited 1,000 1,000 MUFG Bank, Ltd.
Aug. 1, 2016
1,160 1,160
0.46655 Jul. 31, 2024
Lump-sum repayment (Note 3) Unsecured
Unguaranteed
Development Bank of Japan Inc. 580 580 Mizuho Bank, Ltd. 580 580 Sumitomo Mitsui Trust Bank, Limited 580 580 Sumitomo Mitsui Banking Corporation 290 290 MUFG Bank, Ltd.
Aug. 1, 2016
1,800 1,800
0.65518 Jul. 31, 2026
Lump-sum repayment (Note 3) Unsecured
Unguaranteed
Development Bank of Japan Inc. 900 900 Mizuho Bank, Ltd. 900 900 Sumitomo Mitsui Trust Bank, Limited 900 900 Sumitomo Mitsui Banking Corporation 450 450 Mizuho Trust & Banking Co., Ltd.
Jan. 31, 2017
2,000 2,000
0.46691 Jan. 31, 2022
Lump-sum repayment (Note 3) Unsecured
Unguaranteed
The Norinchukin Bank 1,500 1,500 The Bank of Fukuoka, Ltd. 1,000 1,000 The 77 Bank, Ltd. 500 500 Daishi Hokuetsu Bank, Ltd. (Note 5) 500 500 MUFG Bank, Ltd.
Feb. 2, 2017
1,160 1,160
0.62938 Jan. 31, 2024
Lump-sum repayment (Note 3) Unsecured
Unguaranteed
Development Bank of Japan Inc. 580 580 Mizuho Bank, Ltd. 580 580 Sumitomo Mitsui Trust Bank, Limited 580 580 Sumitomo Mitsui Banking Corporation 290 290 MUFG Bank, Ltd.
Feb. 2, 2017
1,820 1,820
0.79571 Jan. 30, 2026
Lump-sum repayment (Note 3) Unsecured
Unguaranteed
Development Bank of Japan Inc. 910 910 Mizuho Bank, Ltd. 910 910 Sumitomo Mitsui Trust Bank, Limited 910 910 Sumitomo Mitsui Banking Corporation 450 450 MUFG Bank, Ltd.
Sep. 29, 2017
1,140 1,140
0.49054 Sep. 30, 2022
Lump-sum repayment (Note 3) Unsecured
Unguaranteed
Development Bank of Japan Inc. 570 570 Mizuho Bank, Ltd. 570 570 Sumitomo Mitsui Trust Bank, Limited 570 570 Sumitomo Mitsui Banking Corporation 300 300
42 4342 43

- 24 -
Type Lender Drawdown date
Balance at the beginning of
current period (millions of
yen)
Balance at the end of current
period (millions of
yen)
Average interest rate (%) (Note 2)
Maturity date
Repayment method
Use of funds Remarks
Long
-term
loan
s (N
ote
1)
MUFG Bank, Ltd.
Sep. 29, 2017
1,140 1,140
0.77571 Sep. 30, 2026
Lump-sum repayment (Note 3) Unsecured
Unguaranteed
Development Bank of Japan Inc. 570 570
Mizuho Bank, Ltd. 570 570
Sumitomo Mitsui Trust Bank, Limited 570 570
Sumitomo Mitsui Banking Corporation 300 300
MUFG Bank, Ltd.
Feb. 2, 2018
1,040 1,040
0.65428 Jan. 31, 2025
Lump-sum repayment (Note 3) Unsecured
Unguaranteed
Development Bank of Japan Inc. 520 520
Mizuho Bank, Ltd. 520 520
Sumitomo Mitsui Trust Bank, Limited 520 520
Sumitomo Mitsui Banking Corporation 260 260
Shinkin Central Bank
Mar. 30, 2018
1,300 1,300
0.45804 Mar. 31, 2023
Lump-sum repayment (Note 3) Unsecured
Unguaranteed The Norinchukin Bank 1,300 1,300
The Bank of Fukuoka, Ltd. 1,300 1,300
Mizuho Trust & Banking Co., Ltd. 1,000 1,000
MUFG Bank, Ltd. Mar. 30,
2018
2,700 2,700
0.62188 Mar. 31, 2025
Lump-sum repayment (Note 3) Unsecured
Unguaranteed Mizuho Bank, Ltd. 1,350 1,350
Sumitomo Mitsui Banking Corporation 600 600
Nippon Life Insurance Company Aug. 31, 2018
500 500 0.55126 Jan. 31,
2024 Lump-sum repayment (Note 3) Unsecured
Unguaranteed Taiyo Life Insurance Company 500 500
Resona Bank, Ltd. Aug. 31, 2018 1,000 1,000 0.73497 Aug. 31,
2026 Lump-sum repayment (Note 3) Unsecured
Unguaranteed Development Bank of Japan Inc.
Sep. 25, 2018
550 550
0.85667 Mar. 31, 2027
Lump-sum repayment (Note 3) Unsecured
Unguaranteed
Mizuho Bank, Ltd. 550 550
Sumitomo Mitsui Trust Bank, Limited 550 550
MUFG Bank, Ltd. 275 275
Sumitomo Mitsui Banking Corporation 275 275
Development Bank of Japan Inc.
Jan. 31, 2019
550 550
0.43105 Jul. 31, 2023
Lump-sum repayment (Note 3) Unsecured
Unguaranteed
Mizuho Bank, Ltd. 550 550
Sumitomo Mitsui Trust Bank, Limited 550 550
MUFG Bank, Ltd. 550 550
Sumitomo Mitsui Banking Corporation 300 300
Mizuho Bank, Ltd.
Jan. 31, 2019
670 670
0.39950 Jan. 31, 2025
Lump-sum repayment (Note 3) Unsecured
Unguaranteed Sumitomo Mitsui Trust Bank, Limited 670 670
MUFG Bank, Ltd. 670 670
Sumitomo Mitsui Banking Corporation 320 320
Development Bank of Japan Inc. Jan. 31, 2019 670 670 0.49994 Jan. 31,
2025 Lump-sum repayment (Note 3) Unsecured
Unguaranteed Mizuho Bank, Ltd.
Apr. 5, 2019
700 700
0.54500 Sep. 30, 2026
Lump-sum repayment (Note 3) Unsecured
Unguaranteed Sumitomo Mitsui Trust Bank, Limited 700 700
MUFG Bank, Ltd. 350 350
Sumitomo Mitsui Banking Corporation 350 350
Development Bank of Japan Inc. Apr. 5, 2019 700 700 0.57826 Sep. 30,
2026 Lump-sum repayment (Note 3) Unsecured
Unguaranteed Mizuho Bank, Ltd.
Mar. 25, 2019
800 -
0.18361 Sep. 30, 2020
Lump-sum repayment (Note 3) Unsecured
Unguaranteed Sumitomo Mitsui Trust Bank, Limited 800 -
MUFG Bank, Ltd. 800 -
Sumitomo Mitsui Banking Corporation 400 -
Mizuho Bank, Ltd.
Mar. 25, 2019
800 800
0.24367 Mar. 31, 2022
Lump-sum repayment (Note 3) Unsecured
Unguaranteed Sumitomo Mitsui Trust Bank, Limited 800 800
MUFG Bank, Ltd. 800 800
Sumitomo Mitsui Banking Corporation 400 400 - 25 -
Type Lender Drawdown date
Balance at the beginning of
current period (millions of
yen)
Balance at the end of current
period (millions of
yen)
Average interest rate (%) (Note 2)
Maturity date
Repayment method
Use of funds Remarks
Long
-term
loan
s (N
ote
1)
Mizuho Bank, Ltd.
Mar. 25, 2019
1,000 1,000
0.45215 Sep. 30, 2025
Lump-sum repayment (Note 3) Unsecured
Unguaranteed Sumitomo Mitsui Trust Bank, Limited 1,000 1,000
MUFG Bank, Ltd. 1,000 1,000
Sumitomo Mitsui Banking Corporation 500 500
Mizuho Bank, Ltd.
Mar. 25, 2019
970 970
0.60810 Sep. 30, 2027
Lump-sum repayment (Note 3) Unsecured
Unguaranteed Sumitomo Mitsui Trust Bank, Limited 970 970
MUFG Bank, Ltd. 970 970
Sumitomo Mitsui Banking Corporation 485 485
Shinkin Central Bank
Mar. 20, 2019
525 525
0.42850 Mar. 31, 2026
Lump-sum repayment (Note 3) Unsecured
Unguaranteed The Norinchukin Bank 525 525
The Bank of Fukuoka, Ltd. 525 525
Mizuho Trust & Banking Co., Ltd. 525 525
Development Bank of Japan Inc. Sep. 30, 2019 1,350 1,350 0.54693 Mar. 31,
2028 Lump-sum repayment (Note 3) Unsecured
Unguaranteed Mizuho Bank, Ltd.
Feb. 3, 2020
590 -
0.24727 Feb. 26,
2021 (Note 4)
Lump-sum repayment (Note 3) Unsecured
Unguaranteed Sumitomo Mitsui Trust Bank, Limited 590 -
MUFG Bank, Ltd. 295 -
Sumitomo Mitsui Banking Corporation 295 -
Mizuho Bank, Ltd.
Mar. 2, 2020
210 210
0.26367 Mar. 31, 2021
Lump-sum repayment (Note 3) Unsecured
Unguaranteed Sumitomo Mitsui Trust Bank, Limited 210 210
MUFG Bank, Ltd. 100 100
Sumitomo Mitsui Banking Corporation 100 100
Development Bank of Japan Inc.
Mar. 2, 2020
750 750
0.47366 Aug. 31, 2028
Lump-sum repayment (Note 3) Unsecured
Unguaranteed
Mizuho Bank, Ltd. 750 750
Sumitomo Mitsui Trust Bank, Limited 750 750
MUFG Bank, Ltd. 375 375
Sumitomo Mitsui Banking Corporation 375 375
MUFG Bank, Ltd. Mar. 30, 2020 1,400 1,400 0.26367 Mar. 31,
2021 Lump-sum repayment (Note 3) Unsecured
Unguaranteed The 77 Bank, Ltd.
Mar. 31, 2020
460 460
0.46156 Sep. 30, 2026
Lump-sum repayment (Note 3) Unsecured
Unguaranteed
Shinkin Central Bank 460 460
The Norinchukin Bank 460 460
The Bank of Fukuoka, Ltd. 460 460
Mizuho Trust & Banking Co., Ltd. 460 460
Mizuho Bank, Ltd. Jun. 26,
2020
660 660
0.26367 Jul. 31, 2021
Lump-sum repayment (Note 3) Unsecured
Unguaranteed Sumitomo Mitsui Trust Bank, Limited 660 660
MUFG Bank, Ltd. 330 330
Mizuho Bank, Ltd. Jun. 26,
2020
780 780
0.26367 Jul. 31, 2021
Lump-sum repayment (Note 3) Unsecured
Unguaranteed Sumitomo Mitsui Trust Bank, Limited 780 780
MUFG Bank, Ltd. 390 390
Development Bank of Japan Inc.
Jun. 30, 2020
820 820
0.67532 Jun. 30, 2029
Lump-sum repayment (Note 3) Unsecured
Unguaranteed
Mizuho Bank, Ltd. 820 820
Sumitomo Mitsui Trust Bank, Limited 820 820
MUFG Bank, Ltd. 820 820
Sumitomo Mitsui Banking Corporation 420 420
Mizuho Bank, Ltd. Sep. 29,
2020
- 1,600
0.27124 Oct. 31, 2021
Lump-sum repayment (Note 3) Unsecured
Unguaranteed Sumitomo Mitsui Trust Bank, Limited - 1,600
MUFG Bank, Ltd. - 800
44 4544 45

- 26 -
Type Lender Drawdown date
Balance at the beginning of
current period (millions of
yen)
Balance at the end of current
period (millions of
yen)
Average interest rate (%) (Note 2)
Maturity date
Repayment method
Use of funds Remarks
Long
-term
loan
s (N
ote
1)
Development Bank of Japan Inc.
Sep. 29, 2020
- 1,000
0.56815 Sep. 29, 2029
Lump-sum repayment (Note 3) Unsecured
Unguaranteed
Mizuho Bank, Ltd. - 1,000
Sumitomo Mitsui Trust Bank, Limited - 1,000
MUFG Bank, Ltd. - 500
Sumitomo Mitsui Banking Corporation - 500
Mizuho Bank, Ltd.
Sep. 30, 2020
- 800
0.57308 Sep. 30, 2029
Lump-sum repayment (Note 3) Unsecured
Unguaranteed Sumitomo Mitsui Trust Bank, Limited - 800
MUFG Bank, Ltd. - 800
Sumitomo Mitsui Banking Corporation - 400
Development Bank of Japan Inc.
Jan. 29, 2021
- 1,220
0.68068 Jan. 29, 2031
Lump-sum repayment (Note 3) Unsecured
Unguaranteed
Mizuho Bank, Ltd. - 1,220
Sumitomo Mitsui Trust Bank, Limited - 1,220
MUFG Bank, Ltd. - 1,220
Sumitomo Mitsui Banking Corporation - 620
Total 122,920 129,150 (Note 1) Long-term loans include the current portion of long-term loans payable. (Note 2) Average interest rates consist of the borrowing rates for each loan agreement rounded to the fifth decimal place. Furthermore, the stated rate for loans
for which interest-rate swap transactions were carried out to avoid interest rate risk takes into account the effect of the interest-rate swap. (Note 3) The use of funds includes purchasing properties in trust and the repayment of existing borrowings. (Note 4) The Investment Corporation made early repayment of the entire amount on August 7, 2020. (Note 5) The Daishi Bank, Ltd. merged with The Hokuetsu Bank, Ltd. as of January 1, 2021 and changed its name to Daishi Hokuetsu Bank, Ltd.
- 27 -
3. Investment Corporation Bonds The status of investment corporation bonds as of January 31, 2021 is as follows.
Issue Issue date Balance at the
beginning of current period (millions of yen)
Balance at the end of current period (millions of yen)
Coupon rate (%)
Maturity date
Repayment method
Use of funds Security
1st Unsecured Bond (Note 1) Jul. 30, 2014 3,000 3,000 0.64000 Jul. 30, 2021 Lump-sum
repayment (Note 2) Unsecured
2nd Unsecured Bond (Note 1) Jul. 18, 2017 1,000 1,000 0.23000 Jul. 15, 2022 Lump-sum
repayment (Note 2) Unsecured
3rd Unsecured Bond (Note 1) Jul. 18, 2017 2,000 2,000 0.52000 Jul. 16, 2027 Lump-sum
repayment (Note 2) Unsecured
4th Unsecured Bond (Note 1) Jun. 14, 2018 1,000 1,000 0.23000 Dec. 14, 2023 Lump-sum
repayment (Note 2) Unsecured
5th Unsecured Bond (Note 1) Jun. 14, 2018 1,500 1,500 0.95000 Jun. 14, 2033 Lump-sum
repayment (Note 2) Unsecured
6th Unsecured Bond (Note 1) Jul. 18, 2019 1,000 1,000 0.23000 Jul. 18, 2024 Lump-sum
repayment (Note 2) Unsecured
7th Unsecured Bond (Note 1) Jul. 18, 2019 1,500 1,500 0.90000 Jul. 18, 2034 Lump-sum
repayment (Note 2) Unsecured
8th Unsecured Bond (Green Bonds) (Note 1)
Jul. 30, 2020 1,500 1,500 0.55000 Jul. 30, 2030 Lump-sum repayment (Note 2) Unsecured
Total 12,500 12,500 (Note 1) The bonds are subject to the pari passu clause among specified investment corporation bonds. (Note 2) The funds are primarily appropriated to the acquisition of real estate in trust and the repayment of some of the existing borrowings. 4. Short-Term Investment Corporation Bonds
Not applicable
5. Investment Unit Acquisition Rights Not applicable
46 4746 47

- 28 -
Purchase and Sale during the Period 1. Purchase and Sale of Properties and Asset Backed Securities
Property name Acquisition Sale
Acquisition date
Acquisition price (millions of yen) Sale date Sale price
(millions of yen) Book value
(millions of yen) Gain on sale
(millions of yen) COMFORIA SHIN-OKACHIMACHI Sep. 29, 2020 1,237 - - - -
COMFORIA MORISHITA WEST Sep. 29, 2020 1,222 - - - -
COMFORIA TOYOCHO Sep. 29, 2020 3,674 - - - - COMFORIA FUDOMAE Sep. 29, 2020 1,622 - - - - COMFORIA ICHIKAWAMYODEN - - Dec. 22, 2020 805 586 208
COMFORIA NISHIMAGOME - - Dec. 22, 2020 1,261 952 293
Total - 7,755 - 2,066 1,539 501 (Note) The acquisition price and sale price do not include miscellaneous expenses required for the acquisition or sale of said property, etc., fixed property tax, city
planning tax, consumption tax and local consumption tax. 2. Purchase and Sale of Other Assets
Main assets other than the above properties and asset backed securities are bank deposits or bank deposits within trust assets. 3. Appraisals of Specified Assets
(1) Real estate, etc.
Acquisition or sale Type of asset Property name Acquisition or
sale date
Acquisition price or sale
price (millions of yen) (Note 1)
Real estate appraisal Appraisal value
(millions of yen) (Note 2)
Appraisal company (Note 3)
Date of valuation
Acquisition Beneficial
interest in real estate trust
COMFORIA SHIN-OKACHIMACHI Sep. 29, 2020 1,237 1,290 (1) Jul. 31, 2020
Acquisition Beneficial
interest in real estate trust
COMFORIA MORISHITA WEST Sep. 29, 2020 1,222 1,270 (1) Jul. 31, 2020
Acquisition Beneficial
interest in real estate trust
COMFORIA TOYOCHO Sep. 29, 2020 3,674 3,760 (2) Jul. 31, 2020
Acquisition Beneficial
interest in real estate trust
COMFORIA FUDOMAE Sep. 29, 2020 1,622 1,700 (2) Jul. 31, 2020
Sale Beneficial
interest in real estate trust
COMFORIA ICHIKAWAMYODEN Dec. 22, 2020 805 766 (2) Jul. 31, 2020
Sale Beneficial
interest in real estate trust
COMFORIA NISHIMAGOME Dec. 22, 2020 1,261 1,110 (2) Jul. 31, 2020
(Note 1) The acquisition price and sale price do not include miscellaneous expenses required for the acquisition or sale of said property, fixed property tax, city planning tax, consumption tax and local consumption tax.
(Note 2) Appraisal value indicates appraisal value or investigated value. (Note 3) The real estate appraisers handling the real estate appraisal or research reports of each property are: (1) JLL Morii Valuation & Advisory K.K.,
and (2) Japan Real Estate Institute. (2) Other
Of the transactions carried out by the Investment Corporation, there were no other transactions than those shown in the aforementioned “(1) Real estate, etc.” that were deemed to require an appraisal pursuant to the provisions of Article 201 of the Investment Trusts Act.
- 29 -
4. Transactions with Related Parties (1) Information on transaction
Category Purchase and sales amount
Purchase amount Sales amount
Total amount ¥7,755,000 thousand ¥2,066,000 thousand
Breakdown of transactions between related parties
Tokyu Land Corporation ¥7,755,000 thousand (100.0%) ¥- thousand (-%)
Total ¥7,755,000 thousand (100.0%) ¥- thousand (-%) (Note) The term “Related parties” refers to related parties defined in Article 123 of the Order for Enforcement of the Act on Investment Trusts and
Investment Corporations as well as related parties of the Asset Management Company prescribed in Article 26, Paragraph 1, Item 27 of the Regulations Concerning Investment Reports of Investment Trusts and Investment Corporations issued by the Investment Trusts Association, Japan. Descriptions are included with regard to a related party that falls under any of these and that had transactions or paid commissions, etc. during the 21st Fiscal Period. (The same shall apply in “(2) Amount of commission paid” and “(3) Major payments to other related parties” below.)
(2) Amount of commission paid
Category
Total amount of commission paid
(A) (thousands of yen)
Breakdown of transaction with related parties Percentage of total
amount (B/A) (%) Payee
Amount of payment (B)
(thousands of yen)
Property management entrustment costs 719,975
Tokyu Housing Lease Corporation 458,479 63.7 Community One Co., Ltd. 36,324 5.0 Tokyu Community Corp. 3,808 0.5
Utilities expenses 110,495 Tokyu Community Corp. 57,765 52.3
Marketing-related expenses 253,334 Tokyu Livable, Inc. 1,638 0.6
Other expenses related to rent business 170,727
Tokyu Sports Oasis, Inc. 10,444 6.1 Community One Co., Ltd. 1,247 0.7
(3) Major payments to other related parties
Ewel Inc. ¥4,393 thousand (system usage, etc.) Community One Co., Ltd. ¥3,506 thousand (repair work, etc.) Tokyu Re・design Corporation ¥841 thousand (repair work, etc.)
5. Transactions with Asset Management Company related to Concurrent Operations Carried Out by the Asset
Management Company The Asset Management Company is not concurrently engaged in type I financial instruments business, type II financial instruments business, realty business or specified real estate cooperative business.
48 4948 49
- 30 -
Accounting Status 1. Assets, Liabilities, Principal and Profit/Loss
Please refer to “1. Balance Sheets,” “2. Statements of Income,” “3. Statements of Changes in Unitholders’ Equity,” “4. Statements of Cash Distributions,” “5. Statements of Cash Flows,” and “6. Notes.”
2. Changes in the Calculation Method of Depreciation
Not applicable 3. Changes in the Appraisal Method of Real Estate, etc.
Not applicable Other 1. Beneficiary Certificates of Investment Trusts Established by the Investment Corporation
Not applicable
2. Notices (1) Unitholders’ Meeting
Not applicable (2) Board of Directors of the Investment Corporation
The main overviews of the major conclusion and change of contracts that were approved by the Board of Directors of the Investment Corporation during current period are as follows.
Approval date Matter Overview
January 5, 2021
Conclusion of a new investment unit underwriting contract pertaining to the issuance of new investment units and the secondary offering of investment units, and the conclusion of a new investment unit purchase contract with regard to the Green Shoe option
A new investment unit underwriting contract with Mizuho Securities Co., Ltd. and four other companies (Note) for the issuance of new investment units and the secondary offering of investment units that were approved at the Board of Directors' meetings held on January 5, 2021 and January 13, 2021, as well as a new investment unit purchase contract pertaining to the Green Shoe option with the book runner (Mizuho Securities Co., Ltd.) were concluded as of January 13, 2021, respectively.
(Note) Other than Mizuho Securities Co., Ltd. and SMBC Nikko Securities Inc., which are co-lead managers, the companies are Daiwa Securities Co. Ltd., Mitsubishi UFJ Morgan Stanley Securities Co., Ltd. and Nomura Securities Co., Ltd.
3. Disclosure on Overseas Property-Owning Corporations
Not applicable 4. Disclosure on Real Estate Owned by Overseas Property-Owning Corporations
Not applicable 5. Other
Figures in this document are rounded down (values) and rounded to the nearest decimal place (percentages) unless otherwise indicated.
50 5150 51
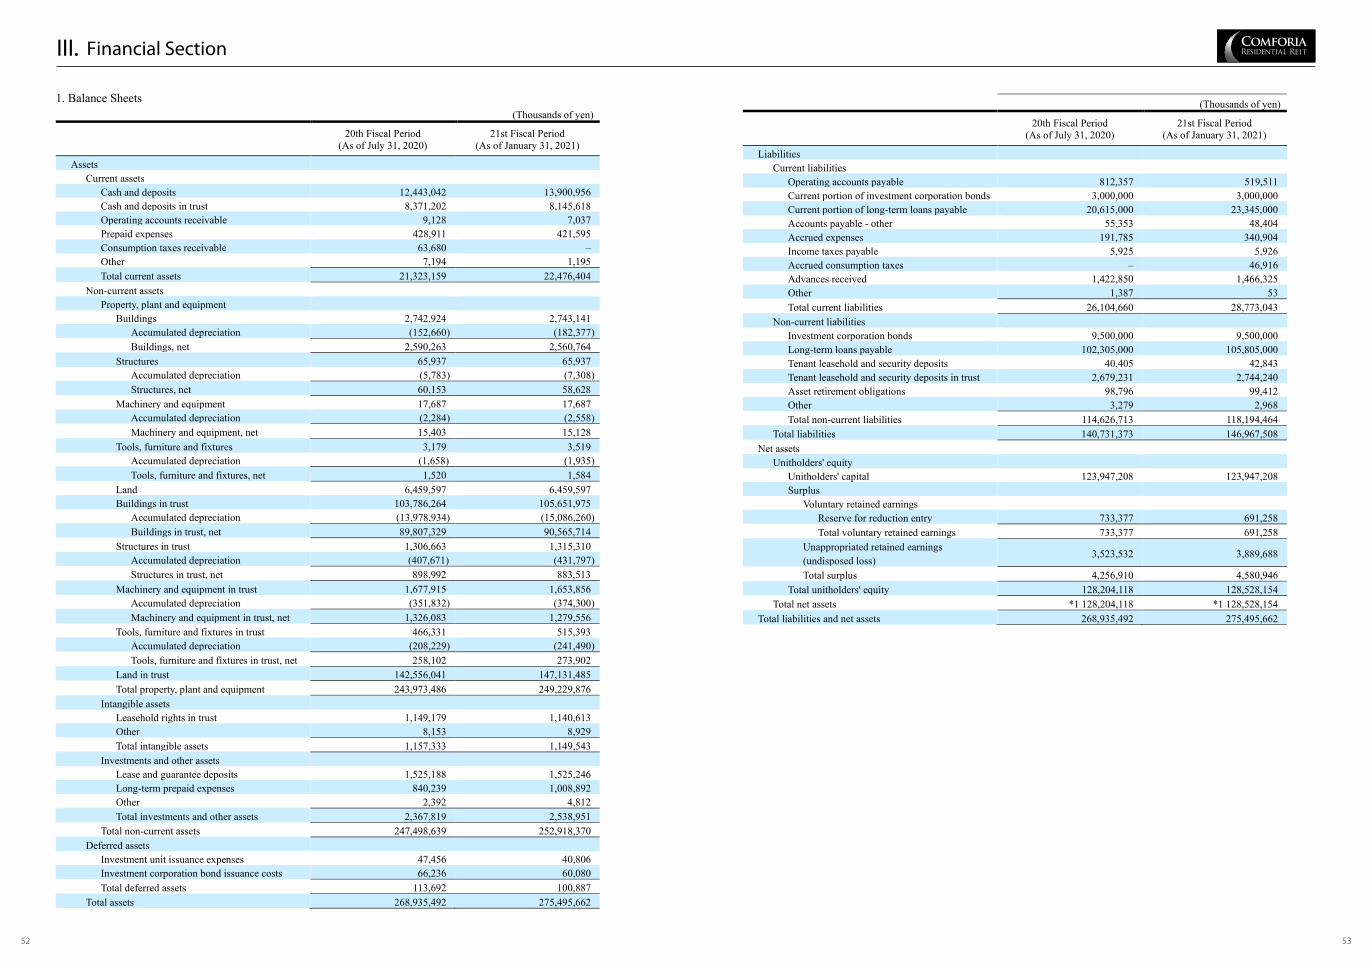
- 28 -
III. Financial Section 1. Balance Sheets
(Thousands of yen)
20th Fiscal Period (As of July 31, 2020)
21st Fiscal Period (As of January 31, 2021)
Assets Current assets
Cash and deposits 12,443,042 13,900,956 Cash and deposits in trust 8,371,202 8,145,618 Operating accounts receivable 9,128 7,037 Prepaid expenses 428,911 421,595 Consumption taxes receivable 63,680 – Other 7,194 1,195 Total current assets 21,323,159 22,476,404
Non-current assets Property, plant and equipment
Buildings 2,742,924 2,743,141 Accumulated depreciation (152,660) (182,377) Buildings, net 2,590,263 2,560,764
Structures 65,937 65,937 Accumulated depreciation (5,783) (7,308) Structures, net 60,153 58,628
Machinery and equipment 17,687 17,687 Accumulated depreciation (2,284) (2,558) Machinery and equipment, net 15,403 15,128
Tools, furniture and fixtures 3,179 3,519 Accumulated depreciation (1,658) (1,935) Tools, furniture and fixtures, net 1,520 1,584
Land 6,459,597 6,459,597 Buildings in trust 103,786,264 105,651,975
Accumulated depreciation (13,978,934) (15,086,260) Buildings in trust, net 89,807,329 90,565,714
Structures in trust 1,306,663 1,315,310 Accumulated depreciation (407,671) (431,797) Structures in trust, net 898,992 883,513
Machinery and equipment in trust 1,677,915 1,653,856 Accumulated depreciation (351,832) (374,300) Machinery and equipment in trust, net 1,326,083 1,279,556
Tools, furniture and fixtures in trust 466,331 515,393 Accumulated depreciation (208,229) (241,490) Tools, furniture and fixtures in trust, net 258,102 273,902
Land in trust 142,556,041 147,131,485 Total property, plant and equipment 243,973,486 249,229,876
Intangible assets Leasehold rights in trust 1,149,179 1,140,613 Other 8,153 8,929 Total intangible assets 1,157,333 1,149,543
Investments and other assets Lease and guarantee deposits 1,525,188 1,525,246 Long-term prepaid expenses 840,239 1,008,892 Other 2,392 4,812 Total investments and other assets 2,367,819 2,538,951
Total non-current assets 247,498,639 252,918,370 Deferred assets
Investment unit issuance expenses 47,456 40,806 Investment corporation bond issuance costs 66,236 60,080 Total deferred assets 113,692 100,887
Total assets 268,935,492 275,495,662
- 29 -
(Thousands of yen)
20th Fiscal Period (As of July 31, 2020)
21st Fiscal Period (As of January 31, 2021)
Liabilities Current liabilities
Operating accounts payable 812,357 519,511 Current portion of investment corporation bonds 3,000,000 3,000,000 Current portion of long-term loans payable 20,615,000 23,345,000 Accounts payable - other 55,353 48,404 Accrued expenses 191,785 340,904 Income taxes payable 5,925 5,926 Accrued consumption taxes – 46,916 Advances received 1,422,850 1,466,325 Other 1,387 53 Total current liabilities 26,104,660 28,773,043
Non-current liabilities Investment corporation bonds 9,500,000 9,500,000 Long-term loans payable 102,305,000 105,805,000 Tenant leasehold and security deposits 40,405 42,843 Tenant leasehold and security deposits in trust 2,679,231 2,744,240 Asset retirement obligations 98,796 99,412 Other 3,279 2,968 Total non-current liabilities 114,626,713 118,194,464
Total liabilities 140,731,373 146,967,508 Net assets
Unitholders' equity Unitholders' capital 123,947,208 123,947,208 Surplus
Voluntary retained earnings Reserve for reduction entry 733,377 691,258 Total voluntary retained earnings 733,377 691,258
Unappropriated retained earnings (undisposed loss) 3,523,532 3,889,688
Total surplus 4,256,910 4,580,946 Total unitholders' equity 128,204,118 128,528,154
Total net assets *1 128,204,118 *1 128,528,154 Total liabilities and net assets 268,935,492 275,495,662
52 5352 53
Financial SectionIII.
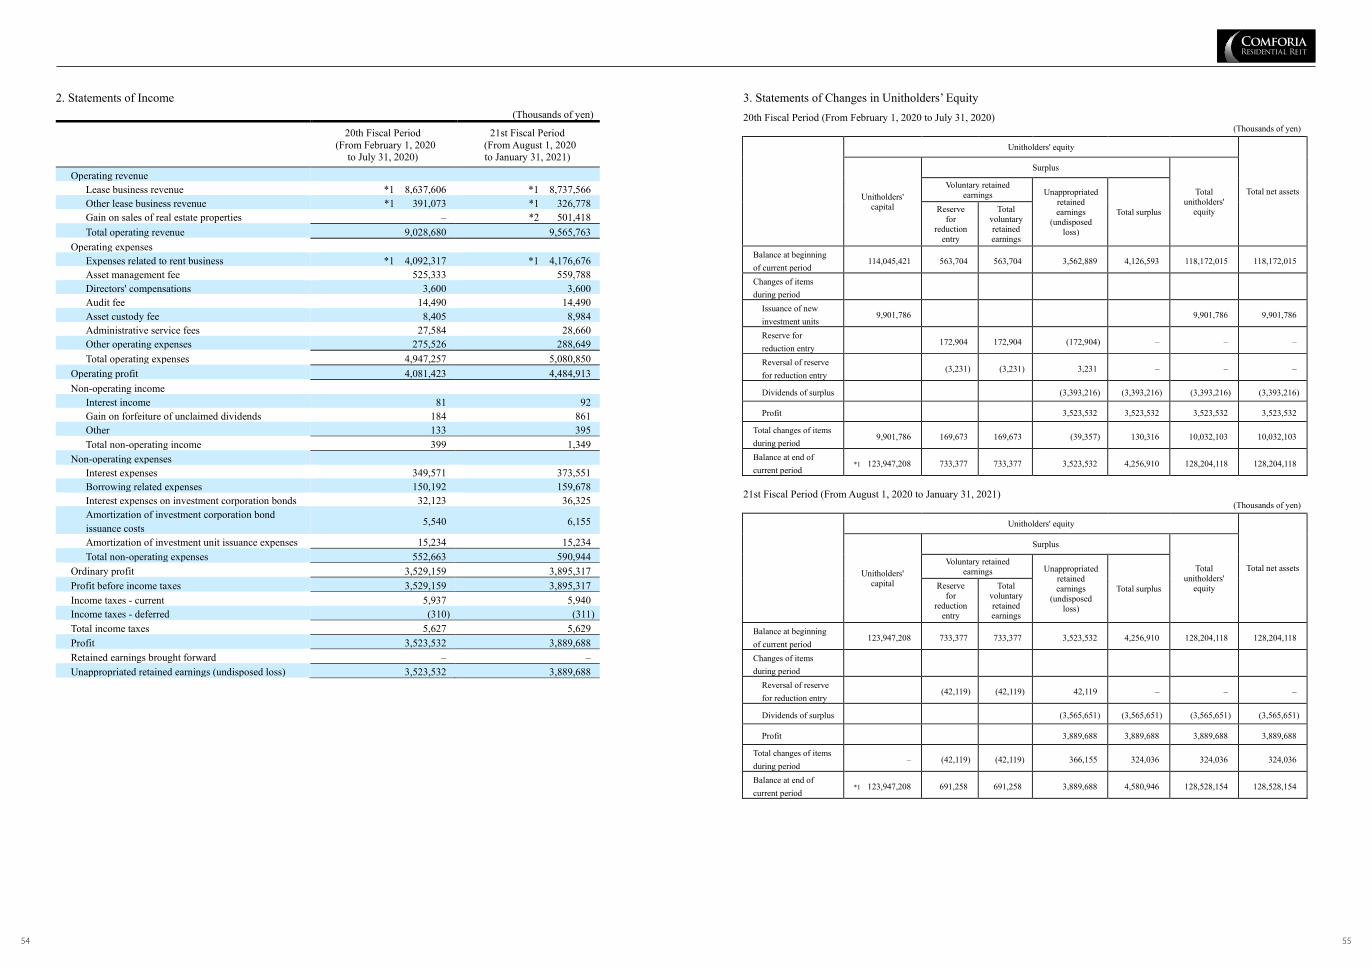
- 30 -
2. Statements of Income (Thousands of yen)
20th Fiscal Period
(From February 1, 2020 to July 31, 2020)
21st Fiscal Period (From August 1, 2020
to January 31, 2021)
Operating revenue Lease business revenue *1 8,637,606 *1 8,737,566 Other lease business revenue *1 391,073 *1 326,778 Gain on sales of real estate properties – *2 501,418 Total operating revenue 9,028,680 9,565,763
Operating expenses Expenses related to rent business *1 4,092,317 *1 4,176,676 Asset management fee 525,333 559,788 Directors' compensations 3,600 3,600 Audit fee 14,490 14,490 Asset custody fee 8,405 8,984 Administrative service fees 27,584 28,660 Other operating expenses 275,526 288,649 Total operating expenses 4,947,257 5,080,850
Operating profit 4,081,423 4,484,913 Non-operating income
Interest income 81 92 Gain on forfeiture of unclaimed dividends 184 861 Other 133 395 Total non-operating income 399 1,349
Non-operating expenses Interest expenses 349,571 373,551 Borrowing related expenses 150,192 159,678 Interest expenses on investment corporation bonds 32,123 36,325 Amortization of investment corporation bond issuance costs
5,540 6,155
Amortization of investment unit issuance expenses 15,234 15,234 Total non-operating expenses 552,663 590,944
Ordinary profit 3,529,159 3,895,317 Profit before income taxes 3,529,159 3,895,317 Income taxes - current 5,937 5,940 Income taxes - deferred (310) (311) Total income taxes 5,627 5,629 Profit 3,523,532 3,889,688 Retained earnings brought forward – – Unappropriated retained earnings (undisposed loss) 3,523,532 3,889,688
- 31 -
3. Statements of Changes in Unitholders’ Equity 20th Fiscal Period (From February 1, 2020 to July 31, 2020)
(Thousands of yen)
Unitholders' equity
Total net assets
Unitholders' capital
Surplus
Total unitholders'
equity
Voluntary retained earnings Unappropriated
retained earnings
(undisposed loss)
Total surplus
Reserve for
reduction entry
Total voluntary retained earnings
Balance at beginning of current period
114,045,421 563,704 563,704 3,562,889 4,126,593 118,172,015 118,172,015
Changes of items during period
Issuance of new investment units
9,901,786 9,901,786 9,901,786
Reserve for reduction entry
172,904 172,904 (172,904) – – –
Reversal of reserve for reduction entry
(3,231) (3,231) 3,231 – – –
Dividends of surplus (3,393,216) (3,393,216) (3,393,216) (3,393,216)
Profit 3,523,532 3,523,532 3,523,532 3,523,532
Total changes of items during period
9,901,786 169,673 169,673 (39,357) 130,316 10,032,103 10,032,103
Balance at end of current period
*1 123,947,208 733,377 733,377 3,523,532 4,256,910 128,204,118 128,204,118
21st Fiscal Period (From August 1, 2020 to January 31, 2021)
(Thousands of yen)
Unitholders' equity
Total net assets
Unitholders' capital
Surplus
Total unitholders'
equity
Voluntary retained earnings Unappropriated
retained earnings
(undisposed loss)
Total surplus
Reserve for
reduction entry
Total voluntary retained earnings
Balance at beginning of current period
123,947,208 733,377 733,377 3,523,532 4,256,910 128,204,118 128,204,118
Changes of items during period
Reversal of reserve for reduction entry
(42,119) (42,119) 42,119 – – –
Dividends of surplus (3,565,651) (3,565,651) (3,565,651) (3,565,651)
Profit 3,889,688 3,889,688 3,889,688 3,889,688
Total changes of items during period
– (42,119) (42,119) 366,155 324,036 324,036 324,036
Balance at end of current period
*1 123,947,208 691,258 691,258 3,889,688 4,580,946 128,528,154 128,528,154
54 5554 55

- 32 -
4. Statements of Cash Distributions
Category 20th Fiscal Period
(From February 1, 2020 to July 31, 2020)
21st Fiscal Period (From August 1, 2020 to January 31, 2021)
I. Unappropriated retained earnings ¥3,523,532,301 ¥ 3,889,688,083 II. Reversal of Voluntary retained
earnings
Reversal of reserve for reduction entry ¥42,119,515 ¥–
III. Distributions ¥3,565,651,816 ¥3,633,485,840 [Distribution per unit] [¥5,309] [¥5,410] IV. Voluntary retained earnings Provision of reserve for reduction
entry ¥– ¥256,202,243
V. Retained earnings carried forward ¥0 ¥0 Method for calculating distributions
The Investment Corporation will make cash distributions up to the amount of accounting profit based on the distribution policy outlined in Article 35-1 of the Investment Corporation’s Articles of Incorporation, in an amount that exceeds 90% of the “amount of distributable profit” of the Investment Corporation as set forth in Article 67-15 of the Act on Special Measures Concerning Taxation. Based on this policy, the Investment Corporation has determined to pay out ¥3,565,651,816 as the total amount of dividends for the period under review, which is equivalent to the entire amount of unappropriated retained earnings after adding reversal of reserve for reduction entry. Furthermore, the Investment Corporation does not pay out dividends that exceed accounting profit as outlined in Article 35-2 of the Investment Corporation’s Articles of Incorporation.
The Investment Corporation will make cash distributions up to the amount of accounting profit based on the distribution policy outlined in Article 35-1 of the Investment Corporation’s Articles of Incorporation, in an amount that exceeds 90% of the “amount of distributable profit” of the Investment Corporation as set forth in Article 67-15 of the Act on Special Measures Concerning Taxation. Based on this policy, the Investment Corporation has determined to pay out ¥3,633,485,840 as the total amount of dividends for the period under review, which is equivalent to the entire amount of unappropriated retained earnings after deducting the provision of reserve for reduction entry pursuant to Article 66-2 of the Act on Special Measures Concerning Taxation. Furthermore, the Investment Corporation does not pay out dividends that exceed accounting profit as outlined in Article 35-2 of the Investment Corporation’s Articles of Incorporation.
- 33 -
5. Statements of Cash Flows (Thousands of yen)
20th Fiscal Period
(From February 1, 2020 to July 31, 2020)
21st Fiscal Period (From August 1, 2020 to January 31, 2021)
Cash flows from operating activities Profit before income taxes 3,529,159 3,895,317 Depreciation 1,343,923 1,376,513 Borrowing related expenses 150,192 159,678 Amortization of investment corporation bond issuance costs 5,540 6,155 Amortization of investment unit issuance expenses 15,234 15,234 Interest income (81) (92) Gain on forfeiture of unclaimed dividends (184) (861) Interest expenses 381,695 409,876 Decrease (increase) in operating accounts receivable (1,300) 2,090 Decrease (increase) in prepaid expenses (31,604) 30,601 Decrease (increase) in consumption taxes receivable (63,680) 63,680 Increase (decrease) in accrued consumption taxes (93,021) 46,916 Increase (decrease) in operating accounts payable 120,152 (92,838) Increase (decrease) in accounts payable - other (2,136) 13,285 Increase (decrease) in accrued expenses 7,488 146,174 Increase (decrease) in advances received 46,015 43,475 Decrease (increase) in long-term prepaid expenses 6,205 6,639 Decrease in property, plant and equipment in trust due to sales – 1,539,124 Other, net (8,240) 4,664 Subtotal 5,405,360 7,665,637 Interest income received 81 92 Interest expenses paid (381,696) (405,708) Income taxes paid (5,936) (5,939) Net cash provided by (used in) operating activities 5,017,808 7,254,081
Cash flows from investing activities Purchase of property, plant and equipment (3,108,043) (10,902) Purchase of property, plant and equipment in trust (17,516,262) (8,374,206) Proceeds from tenant leasehold and security deposits 15,344 8,160 Repayments of tenant leasehold and security deposits (3,280) (6,448) Proceeds from tenant leasehold and security deposits in trust 367,449 308,927 Repayments of tenant leasehold and security deposits in trust (234,674) (247,958) Other, net (1,989) (2,478) Net cash provided by (used in) investing activities (20,481,455) (8,324,907)
Cash flows from financing activities Proceeds from long-term loans payable 16,206,289 15,950,440 Repayments of long-term loans payable (6,000,000) (10,070,000) Proceeds from issuance of investment corporation bonds 1,489,954 – Proceeds from issuance of investment units 9,874,925 – Dividends paid (3,393,031) (3,565,184) Other, net (11,025) (12,100) Net cash provided by (used in) financing activities 18,167,111 2,303,155
Net increase (decrease) in cash and cash equivalents 2,703,464 1,232,330 Cash and cash equivalents at beginning of period 18,110,780 20,814,244 Cash and cash equivalents at end of period *1 20,814,244 *1 22,046,575
56 5756 57

- 34 -
6. Notes <Summary of Significant Accounting Policies>
1. Method of depreciation and amortization of non-current assets
(1) Property, plant and equipment (including trust assets) Property, plant and equipment are depreciated by the straight-line method over the estimated useful lives as follows: Buildings 2–70 years Structures 2–69 years Machinery and equipment 10–38 years Tools, furniture and fixtures 2–15 years
(2) Intangible assets (including assets in trust)
Intangible assets are amortized by the straight-line method.
(3) Long-term prepaid expenses Long-term prepaid expenses are amortized by the straight-line method.
2. Accounting policies for deferred assets
(1) Investment corporation bond issuance costs Investment corporation bond issuance costs are amortized by the straight-line method over the redemption periods.
(2) Investment unit issuance expenses Investment unit issuance expenses are amortized by the straight-line method over three years.
3. Accounting standards for revenues and expenses
Accounting treatment of property tax, city planning tax, and depreciable asset tax For property tax, city planning tax, and depreciable asset tax (“property tax”) for real estate properties held, the amounts to be paid for the current fiscal period are expensed as expenses related to rent business out of the tax amounts decided to be levied. Of the amounts paid for the acquisition of real estate property or beneficial interests in real estate trust, the amounts equivalent to property tax settled with the seller of the property are capitalized as part of the acquisition cost of the relevant property rather than being charged as expenses.
4. Method of hedge accounting (1) Method of hedge accounting The deferred hedge method is applied. However, the special accounting treatment is applied for interest-rate swap transactions that meet certain criteria.
(2) Hedging instruments and hedged items
Hedging instruments: Interest rate swap transactions Hedged items: Interest expenses on loans payable
(3) Hedging policy
The Investment Corporation enters into derivative transactions based on its investment management guidelines with the objective of hedging interest rate fluctuation risks and other risks pertaining to borrowings, etc.
(4) Method of evaluating the effectiveness of hedging
As for the method of assessing the effectiveness of the hedge, the cumulative changes in cash flow of the hedged items and hedging instruments are compared and a judgment is made by verifying the ratio of the changed amount. However, an assessment of the effectiveness of hedging activities is omitted in the case of interest-rate swap transactions that meet the requirements for the special treatment.
5. Scope of funds (cash and cash equivalents) on the Statements of Cash Flows
The funds (cash and cash equivalents) on the Statements of Cash Flows consist of cash on hand and cash in trust, deposits and deposits in trust that are readily available, and short-term investments with maturities of three months or less from the date of purchase which are readily convertible to cash and with insignificant risk of market value fluctuation.
- 35 -
6. Other significant accounting policies applied in the preparation of financial statements
(1) Accounting method for beneficial interests in real estate trust and other assets Regarding trust beneficiary interests in real estate, all assets and liability accounts of entrusted properties as well as revenue and expense accounts generated by the property in trust are recorded in relevant accounts on the Balance Sheets and Statements of Income. Important line items included in accounting for financial assets and liabilities in the Investment Corporation’s Balance Sheets are as follows: (i) Cash and deposits in trust (ii) Buildings in trust; structures in trust; machinery and equipment in trust; tools,
furniture and fixtures in trust; land in trust; construction in progress in trust; and leasehold rights in trust
(iii) Tenant leasehold and security deposits in trust
(2) Accounting method for consumption taxes Revenues and expenses in the Statements of Income do not include consumption taxes. Non-deductible consumption taxes applicable to the acquisition of non-current assets, etc. are included in the cost of acquisition for each asset.
<Notes to the Balance Sheets> *1. Minimum net assets pursuant to Article 67-4 of the Act on Investment Trusts and Investment Corporations
(Thousands of yen)
20th Fiscal Period (As of July 31, 2020)
21st Fiscal Period (As of January 31, 2021)
50,000 50,000 2. Commitment line agreement
The Investment Corporation has commitment line contracts with three of the banks (as of July 31, 2020) and three of the banks (as of January 31, 2021), respectively.
(Thousands of yen)
20th Fiscal Period (As of July 31, 2020)
21st Fiscal Period (As of January 31, 2021)
Credit limit 10,500,000 13,500,000 Outstanding debt – – Unused commitment line 10,500,000 13,500,000
58 5958 59

- 36 -
<Notes to the Statements of Income> *1. Breakdown of real estate rental revenues and expenses
(Thousands of yen)
20th Fiscal Period
(From February 1, 2020 to July 31, 2020)
21st Fiscal Period (From August 1, 2020 to January 31, 2021)
A. Real estate rental revenue Lease business revenue
(Rental revenues and common service charges) 8,485,088 8,587,082 (Parking revenues) 152,517 8,637,606 150,483 8,737,566
Other lease business revenue (Key money and contract renewal fees) 251,961 184,281 (Other revenues) 139,112 391,073 142,497 326,778 Total real estate rental revenues 9,028,680 9,064,345
B. Real estate rental expenses Expenses related to rent business
(Property management fees and facility management fees) 722,535 719,975
(Repairs and maintenance) 385,794 326,772 (Land rent) 707,285 707,331 (Tax and public dues) 436,009 454,121 (Insurance) 6,821 7,082 (Utilities) 110,118 110,495 (Marketing-related expenses) 169,330 253,334 (Trust fees) 49,708 51,028 (Depreciation) 1,341,509 1,374,621 (Other expenses related to rent business) 163,205 171,911 Total real estate rental expenses 4,092,317 4,176,676
C. Income from real estate rental business (A - B) 4,936,362 4,887,669
*2. Breakdown of gain on sales of real estate properties
20th Fiscal Period (From February 1, 2020 to July 31, 2020) Not applicable.
21st Fiscal Period (From August 1, 2020 to January 31, 2021)
(Thousands of yen) (1) COMFORIA ICHIKAWAMYODEN
Revenue from sales of real estate properties 805,000 Cost of sales of real estate properties 586,495 Other sales expenses 10,210 596,705 Gain on sales of real estate properties 208,294
(2) COMFORIA NISHIMAGOME
Revenue from sales of real estate properties 1,261,000 Cost of sales of real estate properties 952,629 Other sales expenses 15,246 967,876 Gain on sales of real estate properties 293,123
- 37 -
<Notes to the Statements of Changes in Unitholders’ Equity>
20th Fiscal Period
(From February 1, 2020 to July 31, 2020)
21st Fiscal Period (From August 1, 2020 to January 31, 2021)
*1. Total number of authorized investment units and total number of investment units issued and outstanding
Total number of authorized investment units 8,000,000 units 8,000,000 units Total number of investment units issued and outstanding 671,624 units 671,624 units
<Notes to the Statements of Cash Flows> *1. Reconciliation of balance sheets items to cash and cash equivalents at end of period in the Statements of Cash Flows
(Thousands of yen)
20th Fiscal Period
(From February 1, 2020 to July 31, 2020)
21st Fiscal Period (From August 1, 2020 to January 31, 2021)
Cash and deposits 12,443,042 13,900,956 Cash and deposits in trust 8,371,202 8,145,618 Cash and cash equivalents 20,814,244 22,046,575
<Notes to lease transactions> 1. Operating lease transactions (Lessee)
Future minimum lease payments under non-cancelable operating lease transactions (Thousands of yen)
20th Fiscal Period (As of July 31, 2020)
21st Fiscal Period (As of January 31, 2021)
Due within 1 year 1,382,904 1,382,904 Due after 1 year 77,995,785 77,304,333 Total 79,378,689 78,687,237
2. Operating lease transactions (Lessor)
Future minimum lease payments receivable under non-cancelable operating lease transactions (Thousands of yen)
20th Fiscal Period (As of July 31, 2020)
21st Fiscal Period (As of January 31, 2021)
Due within 1 year 825,936 798,889 Due after 1 year 5,617,704 5,307,792 Total 6,443,641 6,106,681
<Notes to financial instruments> 1. Status of financial instruments
(1) Policies for financial instruments With a focus on stability, flexibility and efficiency as the basis of its financial policy, the Investment Corporation procures funds through borrowings as well as the issuance of investment corporation bonds (including short-term investment corporation bonds; the same shall apply hereinafter) and investment units among other means with the aim of growing its investment assets through their acquisition. The Investment Corporation may enter into derivatives transactions, which shall be executed solely for the purpose of hedging against interest-rate fluctuations and other risks pertaining to borrowings, etc.
(2) Characteristics and risk profile of each financial instrument and risk management system
The funds from borrowings and investment corporation bonds are mainly appropriated for the acquisition of investment assets and repayment of borrowings, etc. With regard to liquidity and interest rate fluctuation risks associated with these financing activities, the Investment Corporation endeavors to manage and limit them by considering and implementing multifaceted funding methods including the utilization of surplus funds and raising funds, etc. from capital markets through issuance of investment units, etc. while diversifying funding sources. Although loans with floating interest rates are exposed to a risk of fluctuation in interest rate, the Investment Corporation employs derivative transactions (interest-rate swap transactions) as hedging instruments in order to avoid interest rate fluctuation risks and fix payment of interest expenses. For more detailed information on the method of hedge accounting, hedging instruments, hedged items, hedging policy and the evaluation method for hedge effectiveness, please refer to the previous section “6. Notes: Summary of significant accounting policies, 4. Method of hedge accounting.”
(3) Supplementary note regarding fair value of financial instruments
The fair values of financial instruments presented in this report is based on their market value, and in cases where market value is not available, reasonably estimated values are presented. Since the estimation of fair value is based on certain assumptions, fair value could differ depending on the assumptions used.
60 6160 61

- 38 -
2. Fair value of financial instruments The carrying value of financial instruments on the balance sheet, their fair value and the differences between them as of July 31, 2020 are as follows.
(Thousands of yen)
Carrying value (Note 1)
Fair value (Note 1) Difference
(1) Cash and deposits 12,443,042 12,443,042 ―
(2) Cash and deposits in trust 8,371,202 8,371,202 ―
(3) Current portion of investment corporation bonds (3,000,000) (3,017,824) 17,824
(4) Current portion of long-term loans payable (20,615,000) (20,636,383) 21,383
(5) Investment corporation bonds (9,500,000) (9,684,812) 184,812
(6) Long-term loans payable (102,305,000) (103,457,314) 1,152,314
(7) Derivative transactions ― ― ― The carrying value of financial instruments on the balance sheet, their fair value and the differences between them as of January 31, 2021 are as follows.
(Thousands of yen)
Carrying value (Note 1)
Fair value (Note 1) Difference
(1) Cash and deposits 13,900,956 13,900,956 ―
(2) Cash and deposits in trust 8,145,618 8,145,618 ―
(3) Current portion of investment corporation bonds (3,000,000) (3,009,559) 9,559
(4) Current portion of long-term loans payable (23,345,000) (23,373,968) 28,968
(5) Investment corporation bonds (9,500,000) (9,659,656) 159,656
(6) Long-term loans payable (105,805,000) (107,000,217) 1,195,217
(7) Derivative transactions ― ― ―
(Note 1) Figures in parentheses indicate liabilities. (Note 2) Methods to determine the fair value of financial instruments:
(1) Cash and deposits and (2) Cash and deposits in trust Due to their short tenors, the carrying values of these assets are reasonable approximations of their present value and hence are used as their fair value.
(3) Current portion of Investment corporation bonds and (5) Investment corporation bonds The fair value of investment corporation bonds is measured based upon the present value obtained by discounting the total amount of principal and interest at a rate that takes into account the term to maturity and credit risk.
(4) Current portion of long-term loans payable and (6) Long-term loans payable For loans with floating interest rates, since the interest rates on such loans reflect market rates reasonably well over the short term and their carrying values are good approximations of their fair value, the carrying values are presented as their fair value. However, the fair value of floating-rate long-term loans payable and current portion of long-term loans payable hedged by interest-rate swap transactions subject to special accounting treatment (refer to the following section entitled “Notes to derivative transactions”) are calculated by discounting the aggregated principal and interest on such loans, after taking into account the effect of said interest-rate swap transactions, using reasonable estimates of the rates that would be applicable in a similar borrowing.
(7) Derivative transactions Please refer to the following section entitled “Notes to derivative transactions.”
(Note 3) Carrying value of financial instruments whose fair value cannot be reliably measured (Thousands of yen)
20th Fiscal Period (As of July 31, 2020)
21st Fiscal Period (As of January 31, 2021)
(1) Tenant leasehold and security deposits (40,405) (42,843)
(2) Tenant leasehold and security deposits in trust (2,679,231) (2,744,240)
(1)(2) Fair values of tenant leasehold and security deposits and leasehold and security deposits in trust are not subject to disclosure of fair value, as these items have no market value and their future cash flows are difficult to reasonably estimate given the fact that although a predetermined period for each lease contract exists, the actual deposit period cannot be calculated due to possible contract termination, renewal or extension.
(3) Figures in parentheses indicate liabilities.
- 39 -
(Note 4) Redemption schedule for monetary claims (Thousands of yen)
20th Fiscal Period (As of July 31, 2020)
Due within 1 year or less
Deposits 12,443,042
Deposits in trust 8,371,202
Total 20,814,244
21st Fiscal Period (As of January 31, 2021)
Due within 1 year or less
Deposits 13,900,956
Deposits in trust 8,145,618
Total 22,046,575
(Note 5) Repayment and redemption schedule for loans payable and investment corporation bonds (Thousands of yen)
20th Fiscal Period (As of July 31, 2020)
Due within 1 year or less
Due after 1 year to 2 years
Due after 2 years to 3 years
Due after 3 years to 4 years
Due after 4 years to 5 years Due after 5 years
Current portion of long-term loans payable
20,615,000 ― ― ― ― ―
Long-term loans payable ― 16,600,000 15,960,000 12,380,000 18,920,000 38,445,000
Current portion of investment corporation bonds
3,000,000 ― ― ― ― ―
Investment corporation bonds ― 1,000,000 ― 2,000,000 ― 6,500,000
Total 23,615,000 17,600,000 15,960,000 14,380,000 18,920,000 44,945,000
21st Fiscal Period (As of January 31, 2021)
Due within 1 year or less
Due after 1 year to 2 years
Due after 2 years to 3 years
Due after 3 years to 4 years
Due after 4 years to 5 years Due after 5 years
Current portion of long-term loans payable
23,345,000 ― ― ― ― ―
Long-term loans payable ― 14,360,000 15,920,000 15,130,000 18,150,000 42,245,000
Current portion of investment corporation bonds
3,000,000 ― ― ― ― ―
Investment corporation bonds ― 1,000,000 1,000,000 1,000,000 ― 6,500,000
Total 26,345,000 15,360,000 16,920,000 16,130,000 18,150,000 48,745,000
<Notes to investment securities>
20th Fiscal Period (As of July 31, 2020) Not applicable
21st Fiscal Period (As of January 31, 2021) Not applicable
<Notes to derivative transactions> 1. Transactions not subject to hedge accounting
20th Fiscal Period (As of July 31, 2020) Not applicable
21st Fiscal Period (As of January 31, 2021) Not applicable
62 6362 63
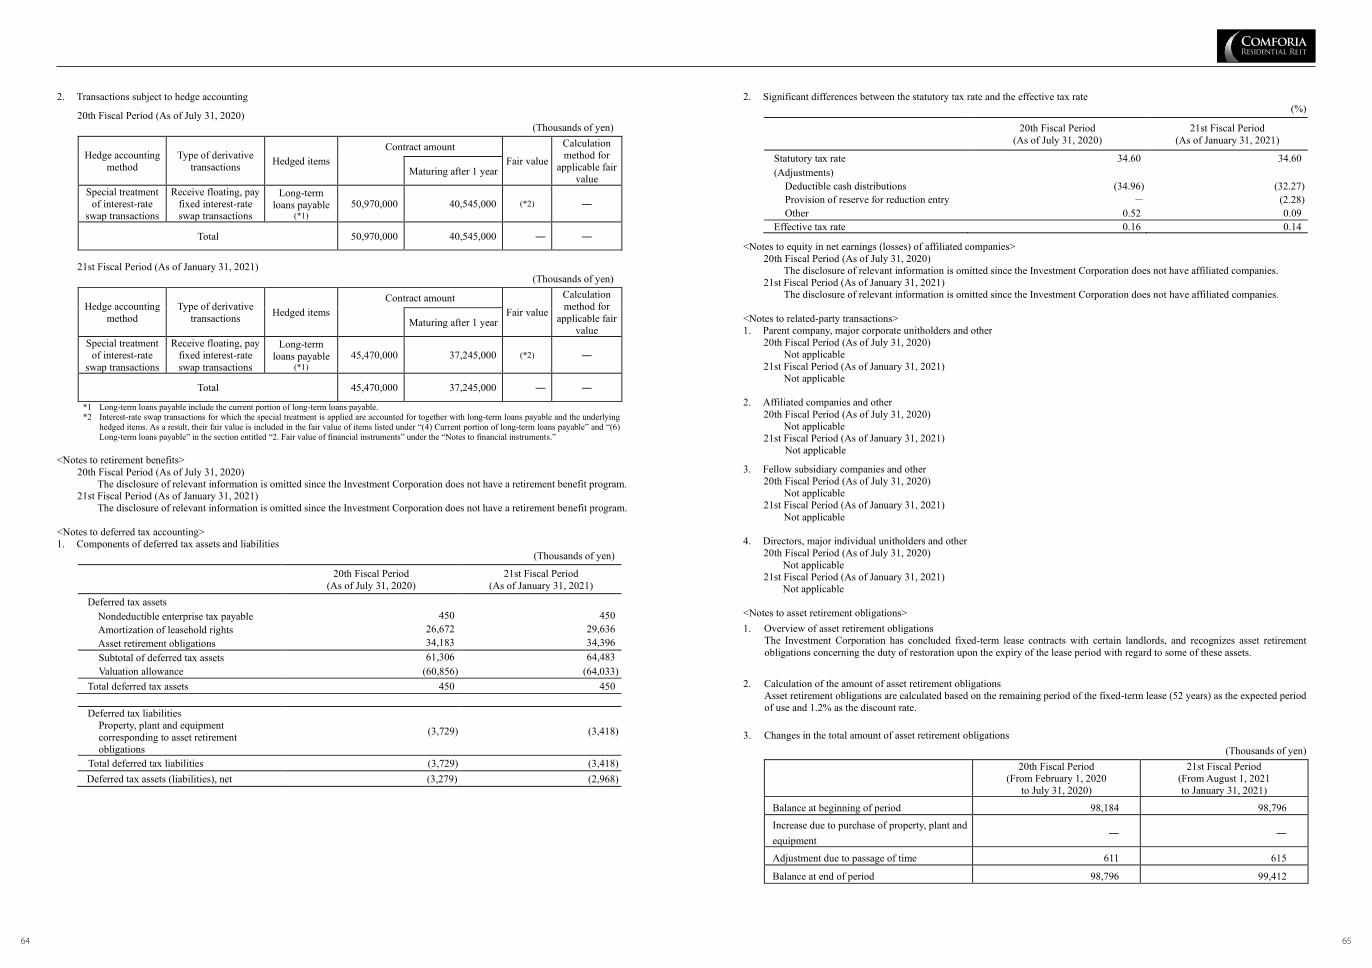
- 40 -
2. Transactions subject to hedge accounting
20th Fiscal Period (As of July 31, 2020) (Thousands of yen)
Hedge accounting method
Type of derivative transactions Hedged items
Contract amount Fair value
Calculation method for
applicable fair value
Maturing after 1 year
Special treatment of interest-rate
swap transactions
Receive floating, pay fixed interest-rate swap transactions
Long-term loans payable
(*1) 50,970,000 40,545,000 (*2) ―
Total 50,970,000 40,545,000 ― ―
21st Fiscal Period (As of January 31, 2021)
(Thousands of yen)
Hedge accounting method
Type of derivative transactions Hedged items
Contract amount Fair value
Calculation method for
applicable fair value
Maturing after 1 year
Special treatment of interest-rate
swap transactions
Receive floating, pay fixed interest-rate swap transactions
Long-term loans payable
(*1) 45,470,000 37,245,000 (*2) ―
Total 45,470,000 37,245,000 ― ―
*1 Long-term loans payable include the current portion of long-term loans payable. *2 Interest-rate swap transactions for which the special treatment is applied are accounted for together with long-term loans payable and the underlying
hedged items. As a result, their fair value is included in the fair value of items listed under “(4) Current portion of long-term loans payable” and “(6) Long-term loans payable” in the section entitled “2. Fair value of financial instruments” under the “Notes to financial instruments.”
<Notes to retirement benefits>
20th Fiscal Period (As of July 31, 2020) The disclosure of relevant information is omitted since the Investment Corporation does not have a retirement benefit program.
21st Fiscal Period (As of January 31, 2021) The disclosure of relevant information is omitted since the Investment Corporation does not have a retirement benefit program.
<Notes to deferred tax accounting> 1. Components of deferred tax assets and liabilities
(Thousands of yen)
20th Fiscal Period (As of July 31, 2020)
21st Fiscal Period (As of January 31, 2021)
Deferred tax assets Nondeductible enterprise tax payable 450 450 Amortization of leasehold rights 26,672 29,636 Asset retirement obligations 34,183 34,396 Subtotal of deferred tax assets 61,306 64,483 Valuation allowance (60,856) (64,033)
Total deferred tax assets 450 450
Deferred tax liabilities Property, plant and equipment corresponding to asset retirement obligations
(3,729) (3,418)
Total deferred tax liabilities (3,729) (3,418) Deferred tax assets (liabilities), net (3,279) (2,968)
- 41 -
2. Significant differences between the statutory tax rate and the effective tax rate (%)
20th Fiscal Period (As of July 31, 2020)
21st Fiscal Period (As of January 31, 2021)
Statutory tax rate 34.60 34.60 (Adjustments)
Deductible cash distributions (34.96) (32.27) Provision of reserve for reduction entry - (2.28) Other 0.52 0.09
Effective tax rate 0.16 0.14
<Notes to equity in net earnings (losses) of affiliated companies> 20th Fiscal Period (As of July 31, 2020)
The disclosure of relevant information is omitted since the Investment Corporation does not have affiliated companies. 21st Fiscal Period (As of January 31, 2021)
The disclosure of relevant information is omitted since the Investment Corporation does not have affiliated companies. <Notes to related-party transactions> 1. Parent company, major corporate unitholders and other
20th Fiscal Period (As of July 31, 2020) Not applicable
21st Fiscal Period (As of January 31, 2021) Not applicable
2. Affiliated companies and other
20th Fiscal Period (As of July 31, 2020) Not applicable
21st Fiscal Period (As of January 31, 2021) Not applicable
3. Fellow subsidiary companies and other 20th Fiscal Period (As of July 31, 2020)
Not applicable 21st Fiscal Period (As of January 31, 2021)
Not applicable 4. Directors, major individual unitholders and other
20th Fiscal Period (As of July 31, 2020) Not applicable
21st Fiscal Period (As of January 31, 2021) Not applicable
<Notes to asset retirement obligations> 1. Overview of asset retirement obligations
The Investment Corporation has concluded fixed-term lease contracts with certain landlords, and recognizes asset retirement obligations concerning the duty of restoration upon the expiry of the lease period with regard to some of these assets.
2. Calculation of the amount of asset retirement obligations Asset retirement obligations are calculated based on the remaining period of the fixed-term lease (52 years) as the expected period of use and 1.2% as the discount rate.
3. Changes in the total amount of asset retirement obligations
(Thousands of yen)
20th Fiscal Period
(From February 1, 2020 to July 31, 2020)
21st Fiscal Period (From August 1, 2021 to January 31, 2021)
Balance at beginning of period 98,184 98,796
Increase due to purchase of property, plant and equipment
― ―
Adjustment due to passage of time 611 615
Balance at end of period 98,796 99,412
64 6564 65

- 42 -
<Notes to investment and rental properties> The Investment Corporation owns real estate for rental purposes (including land) in the Tokyo metropolitan area and other regional areas. The book value, changes during the period and fair value regarding the above real estate for rental purposes are as follows.
(Thousands of yen) 20th Fiscal Period
(From February 1, 2020 to July 31, 2020)
21st Fiscal Period (From August 1, 2020 to January 31, 2021)
Book value
Balance at beginning of period 225,911,402 245,122,666
Changes during period 19,211,263 5,247,824
Balance at end of period 245,122,666 250,370,490
Fair value at end of period 301,101,000 312,721,000 (Note 1) The book value excludes accumulated depreciation from acquisition cost. The book value does not include construction in progress and
construction in progress in trust. (Note 2) Among changes in the book value of real estate for rental purposes that occurred during the 20th Fiscal Period, the principal increase consisted of
the acquisition of 9 properties (COMFORIA HIGASHISHINJUKU STATION FRONT and other 8 properties; ¥20,241,476 thousand), while the principal decrease consisted of depreciation of ¥1,340,897 thousand. During the 21st Fiscal Period, the principal increase consisted of the acquisition of 4 properties (COMFORIA TOYOCHO and other 3 properties; ¥8,023,350 thousand), while the principal decrease consisted of the disposition of 2 properties (COMFORIA NISHIMAGOME and another property: ¥1,539,124 thousand) and depreciation of ¥1,374,006 thousand.
(Note 3) The fair value at end of period is the appraisal value or the survey value determined by outside appraisers.
Income and loss related to real estate for rental purposes, etc. for the 20th Fiscal Period (From February 1, 2020 to July 31, 2020) and 21st Fiscal Period (From August 1, 2020 to January 31, 2021) are listed in “Notes to the Statements of Income.”
<Notes to segment information> (Segment information)
Disclosure is omitted because the property leasing business is the Investment Corporation’s sole business, with no reportable segment subject to disclosure.
(Related information)
20th Fiscal Period (From February 1, 2020 to July 31, 2020) 1. Information about each product and service
Disclosure is omitted because net sales to external customers for a single product/service category account for over 90% of the operating revenues on the Statements of Income.
2. Information about each geographic area (1) Net sales
Disclosure is omitted because net sales to external customers in Japan account for over 90% of the operating revenues on the Statements of Income.
(2) Property, plant and equipment Disclosure is omitted because the amount of property, plant and equipment located in Japan accounts for over 90% of the amount of property, plant and equipment on the Balance Sheet.
3. Information about each major customer Disclosure is omitted because there is no single external customer whose net sales account for 10% or more of operating revenues on the Statements of Income.
21st Fiscal Period (From August 1, 2020 to January 31, 2021) 1. Information about each product and service
Disclosure is omitted because net sales to external customers of a single product/service category account for over 90% of the operating revenues on the Statements of Income.
2. Information about each geographic area (1) Net sales
Disclosure is omitted because net sales to external customers in Japan account for over 90% of the operating revenues on the Statement of Income.
(2) Property, plant and equipment Disclosure is omitted because the amount of property, plant and equipment located in Japan accounts for over 90% of the amount of property, plant and equipment on the Balance Sheet.
3. Information about each major customer Disclosure is omitted because there is no single external customer whose net sales account for 10% or more of operating revenues on the Statements of Income.
- 43 -
<Notes to per unit information>
20th Fiscal Period
(From February 1, 2020 to July 31, 2020)
21st Fiscal Period (From August 1, 2020
to January 31, 2021) Net assets per unit ¥190,886 ¥191,369
Profit per unit ¥5,249 ¥5,791
(Note 1) Profit per unit was calculated by dividing profit for the period by the daily weighted average number of investment units issued and outstanding. Profit per unit after adjusting for diluted units is not included because there were no diluted investment units.
(Note 2) The basis for calculating profit per unit is as follows:
20th Fiscal Period
(From February 1, 2020 to July 31, 2020)
21st Fiscal Period (From August 1, 2020
to January 31, 2021) Profit (thousands of yen) 3,523,532 3,889,688 Amount not attributable to common unitholders (thousands of yen) ― ―
Profit attributable to common investment units (thousands of yen) 3,523,532 3,889,688
Average number of investment units for the period (units) 671,157 671,624
<Note to significant subsequent events> Issuance of New Investment Units The Investment Corporation resolved at the Board of Directors’ meetings held on January 5, 2021 and January 13, 2021 concerning the issuances of new investment units as described below. Based on the resolution, capital contributions have been completed on February 1, 2021 for the new investment units issued through public offering and on February 17, 2021 for the new investment units offered by way of third-party allotment, respectively. As a result, unitholders’ capital increased to ¥129,791,732,102, with the number of investment units issued and outstanding being 692,994 units. Issuance of New Investment Units through Public Offering (Primary Offering)
Number of investment units issued: 20,360 units Issue price: ¥282,623 per unit Total issue amount: ¥5,754,204,280 Paid-in amount (issue value): ¥273,492 per unit Total paid-in amount (issue value): ¥5,568,297,120 Payment date: February 1, 2021
Issuance of New Investment Units Offered by Way of Third-Party Allotment
Number of investment units offered: 1,010 units Paid-in amount (issue value): ¥273,492 per unit Total paid-in amount (issue value): ¥276,226,920 Payment date: February 17, 2021 Allottee: Mizuho Securities Co., Ltd.
66 6766 67
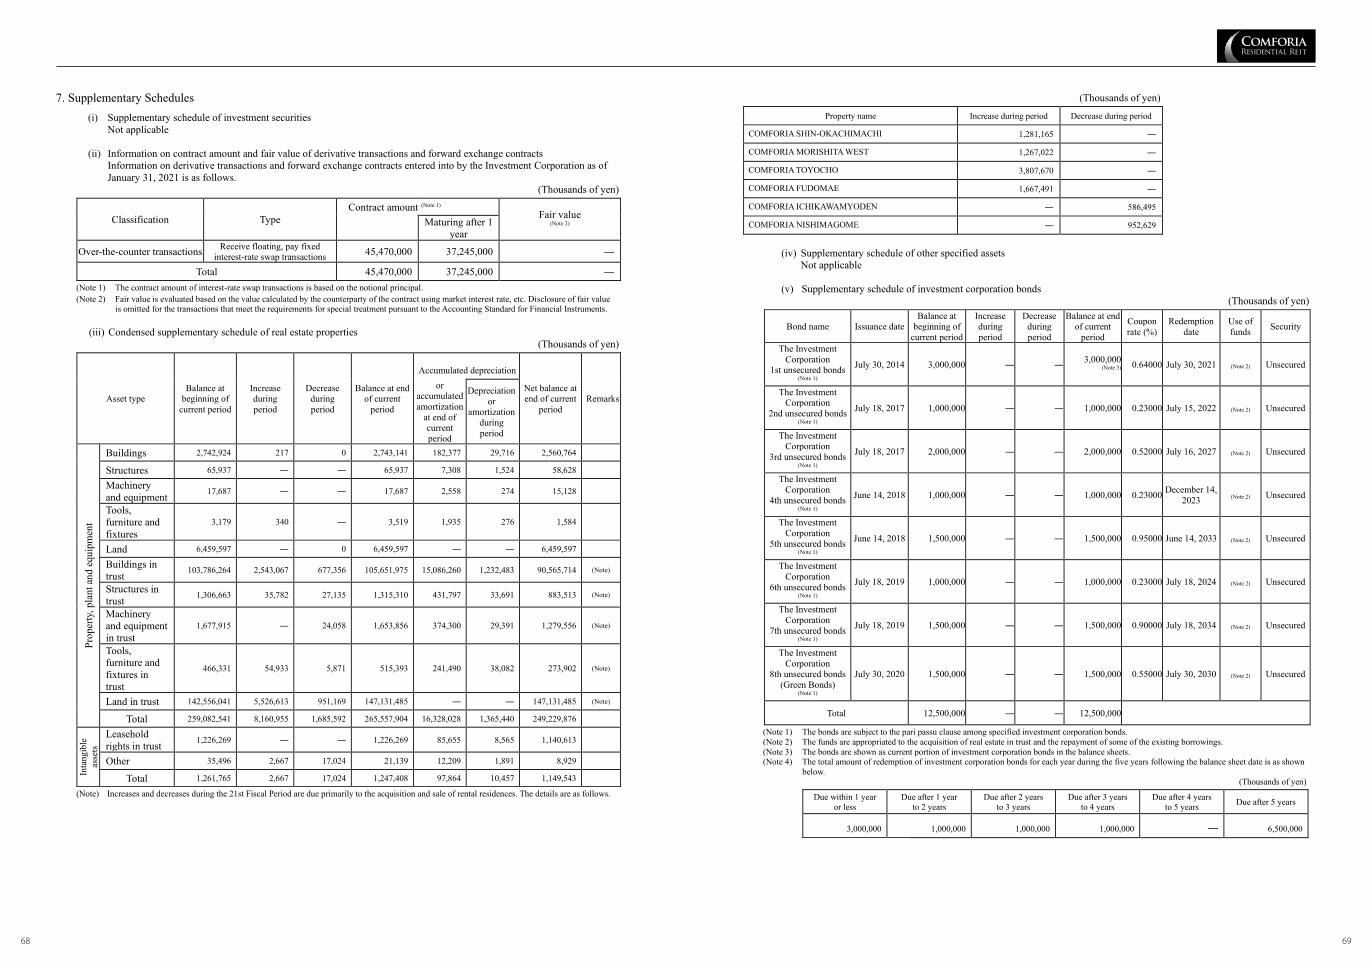
- 44 -
7. Supplementary Schedules (i) Supplementary schedule of investment securities
Not applicable
(ii) Information on contract amount and fair value of derivative transactions and forward exchange contracts Information on derivative transactions and forward exchange contracts entered into by the Investment Corporation as of January 31, 2021 is as follows.
(Thousands of yen)
Classification Type Contract amount (Note 1)
Fair value (Note 2) Maturing after 1
year
Over-the-counter transactions Receive floating, pay fixed interest-rate swap transactions 45,470,000 37,245,000 ―
Total 45,470,000 37,245,000 ― (Note 1) The contract amount of interest-rate swap transactions is based on the notional principal. (Note 2) Fair value is evaluated based on the value calculated by the counterparty of the contract using market interest rate, etc. Disclosure of fair value
is omitted for the transactions that meet the requirements for special treatment pursuant to the Accounting Standard for Financial Instruments.
(iii) Condensed supplementary schedule of real estate properties (Thousands of yen)
Asset type Balance at
beginning of current period
Increase during period
Decrease during period
Balance at end of current
period
Accumulated depreciation
Net balance at end of current
period Remarks
or accumulated amortization
at end of current period
Depreciation or
amortization during period
Prop
erty
, pla
nt a
nd e
quip
men
t
Buildings 2,742,924 217 0 2,743,141 182,377 29,716 2,560,764
Structures 65,937 ― ― 65,937 7,308 1,524 58,628 Machinery and equipment 17,687 ― ― 17,687 2,558 274 15,128
Tools, furniture and fixtures
3,179 340 ― 3,519 1,935 276 1,584
Land 6,459,597 ― 0 6,459,597 ― ― 6,459,597 Buildings in trust 103,786,264 2,543,067 677,356 105,651,975 15,086,260 1,232,483 90,565,714 (Note)
Structures in trust 1,306,663 35,782 27,135 1,315,310 431,797 33,691 883,513 (Note)
Machinery and equipment in trust
1,677,915 ― 24,058 1,653,856 374,300 29,391 1,279,556 (Note)
Tools, furniture and fixtures in trust
466,331 54,933 5,871 515,393 241,490 38,082 273,902 (Note)
Land in trust 142,556,041 5,526,613 951,169 147,131,485 ― ― 147,131,485 (Note)
Total 259,082,541 8,160,955 1,685,592 265,557,904 16,328,028 1,365,440 249,229,876
Inta
ngib
le
asse
ts
Leasehold rights in trust 1,226,269 ― ― 1,226,269 85,655 8,565 1,140,613
Other 35,496 2,667 17,024 21,139 12,209 1,891 8,929
Total 1,261,765 2,667 17,024 1,247,408 97,864 10,457 1,149,543 (Note) Increases and decreases during the 21st Fiscal Period are due primarily to the acquisition and sale of rental residences. The details are as follows.
- 45 -
(Thousands of yen)
(iv) Supplementary schedule of other specified assets
Not applicable (v) Supplementary schedule of investment corporation bonds
(Thousands of yen)
Bond name Issuance date Balance at
beginning of current period
Increase during period
Decrease during period
Balance at end of current
period
Coupon rate (%)
Redemption date
Use of funds Security
The Investment Corporation
1st unsecured bonds (Note 1)
July 30, 2014 3,000,000 ― ― 3,000,000 (Note 3) 0.64000 July 30, 2021 (Note 2) Unsecured
The Investment Corporation
2nd unsecured bonds (Note 1)
July 18, 2017 1,000,000 ― ― 1,000,000 0.23000 July 15, 2022 (Note 2) Unsecured
The Investment Corporation
3rd unsecured bonds (Note 1)
July 18, 2017 2,000,000 ― ― 2,000,000 0.52000 July 16, 2027 (Note 2) Unsecured
The Investment Corporation
4th unsecured bonds (Note 1)
June 14, 2018 1,000,000 ― ― 1,000,000 0.23000 December 14, 2023 (Note 2) Unsecured
The Investment Corporation
5th unsecured bonds (Note 1)
June 14, 2018 1,500,000 ― ― 1,500,000 0.95000 June 14, 2033 (Note 2) Unsecured
The Investment Corporation
6th unsecured bonds (Note 1)
July 18, 2019 1,000,000 ― ― 1,000,000 0.23000 July 18, 2024 (Note 2) Unsecured
The Investment Corporation
7th unsecured bonds (Note 1)
July 18, 2019 1,500,000 ― ― 1,500,000 0.90000 July 18, 2034 (Note 2) Unsecured
The Investment Corporation
8th unsecured bonds (Green Bonds)
(Note 1)
July 30, 2020 1,500,000 ― ― 1,500,000 0.55000 July 30, 2030 (Note 2) Unsecured
Total 12,500,000 ― ― 12,500,000
(Note 1) The bonds are subject to the pari passu clause among specified investment corporation bonds. (Note 2) The funds are appropriated to the acquisition of real estate in trust and the repayment of some of the existing borrowings. (Note 3) The bonds are shown as current portion of investment corporation bonds in the balance sheets. (Note 4) The total amount of redemption of investment corporation bonds for each year during the five years following the balance sheet date is as shown
below. (Thousands of yen)
Due within 1 year or less
Due after 1 year to 2 years
Due after 2 years to 3 years
Due after 3 years to 4 years
Due after 4 years to 5 years Due after 5 years
3,000,000 1,000,000 1,000,000 1,000,000 ― 6,500,000
Property name Increase during period Decrease during period
COMFORIA SHIN-OKACHIMACHI 1,281,165 ―
COMFORIA MORISHITA WEST 1,267,022 ―
COMFORIA TOYOCHO 3,807,670 ―
COMFORIA FUDOMAE 1,667,491 ―
COMFORIA ICHIKAWAMYODEN ― 586,495
COMFORIA NISHIMAGOME ― 952,629
68 6968 69

- 46 -
(vi) Supplementary schedule of borrowings Information on the Investment Corporation’s borrowings as of January 31, 2021 is as follows:
Classification Balance at beginning of
current period (thousands of
yen)
Increase during period (thousands of
yen)
Decrease during period (thousands of
yen)
Balance at end of current
period (thousands of
yen)
Average interest rate
(%) (Note 2)
Maturity date
Repayment method
Use of funds Remarks
Lender
Long-term loans
payable (Note 1)
MUFG Bank, Ltd. 2,000,000 - 2,000,000 -
0.88240 January 31, 2021
Lump-sum repayment (Note 3) Unsecured
Unguaranteed
Development Bank of Japan Inc. 1,000,000 - 1,000,000 -
Mizuho Bank, Ltd. 1,000,000 - 1,000,000 -
Sumitomo Mitsui Trust Bank, Limited 1,000,000 - 1,000,000 -
Sumitomo Mitsui Banking Corporation 500,000 - 500,000 -
MUFG Bank, Ltd. 1,820,000 - - 1,820,000
0.90100 June 30, 2022 Lump-sum repayment (Note 3) Unsecured
Unguaranteed
Development Bank of Japan Inc. 910,000 - - 910,000
Mizuho Bank, Ltd. 910,000 - - 910,000
Sumitomo Mitsui Trust Bank, Limited 910,000 - - 910,000
Sumitomo Mitsui Banking Corporation 450,000 - - 450,000
MUFG Bank, Ltd. 1,200,000 - - 1,200,000
0.69250 January 31, 2022
Lump-sum repayment (Note 3) Unsecured
Unguaranteed
Development Bank of Japan Inc. 600,000 - - 600,000
Mizuho Bank, Ltd. 600,000 - - 600,000
Sumitomo Mitsui Trust Bank, Limited 600,000 - - 600,000
Sumitomo Mitsui Banking Corporation 300,000 - - 300,000
MUFG Bank, Ltd. 1,240,000 - - 1,240,000
0.79875 January 31, 2023
Lump-sum repayment (Note 3) Unsecured
Unguaranteed
Development Bank of Japan Inc. 620,000 - - 620,000
Mizuho Bank, Ltd. 620,000 - - 620,000
Sumitomo Mitsui Trust Bank, Limited 620,000 - - 620,000
Sumitomo Mitsui Banking Corporation 310,000 - - 310,000
MUFG Bank, Ltd. 1,240,000 - - 1,240,000
1.04200 January 31, 2025
Lump-sum repayment (Note 3) Unsecured
Unguaranteed
Development Bank of Japan Inc. 620,000 - - 620,000
Mizuho Bank, Ltd. 620,000 - - 620,000
Sumitomo Mitsui Trust Bank, Limited 620,000 - - 620,000
Sumitomo Mitsui Banking Corporation 310,000 - - 310,000
MUFG Bank, Ltd. 720,000 - - 720,000
0.58430 March 31, 2023
Lump-sum repayment (Note 3) Unsecured
Unguaranteed
Development Bank of Japan Inc. 360,000 - - 360,000
Mizuho Bank, Ltd. 360,000 - - 360,000
Sumitomo Mitsui Trust Bank, Limited 360,000 - - 360,000
Sumitomo Mitsui Banking Corporation 200,000 - - 200,000
MUFG Bank, Ltd. 840,000 - - 840,000
0.62460 August 31, 2023
Lump-sum repayment (Note 3) Unsecured
Unguaranteed
Development Bank of Japan Inc. 420,000 - - 420,000
Mizuho Bank, Ltd. 420,000 - - 420,000
Sumitomo Mitsui Trust Bank, Limited 420,000 - - 420,000
Sumitomo Mitsui Banking Corporation 230,000 - - 230,000
MUFG Bank, Ltd. 980,000 - - 980,000
0.67745 February 29, 2024
Lump-sum repayment (Note 3) Unsecured
Unguaranteed
Development Bank of Japan Inc. 490,000 - - 490,000
Mizuho Bank, Ltd. 490,000 - - 490,000
Sumitomo Mitsui Trust Bank, Limited 490,000 - - 490,000
Sumitomo Mitsui Banking Corporation 220,000 - - 220,000
- 47 -
Classification Balance at beginning of
current period (thousands of
yen)
Increase during period (thousands of
yen)
Decrease during period (thousands of
yen)
Balance at end of current
period (thousands of
yen)
Average interest rate
(%) (Note 2)
Maturity date
Repayment method
Use of funds Remarks
Lender
Long-term loans
payable (Note 1)
Development Bank of Japan Inc. 1,570,000 - - 1,570,000
0.27125 March 31,
2021 Lump-sum repayment
(Note 3) Unsecured
Unguaranteed
MUFG Bank, Ltd. 1,570,000 - - 1,570,000
Kiraboshi Bank, Ltd. 1,000,000 - - 1,000,000
Sumitomo Mitsui Trust Bank, Limited 785,000 - - 785,000
Development Bank of Japan Inc. 2,000,000 - - 2,000,000
0.61950 March 31,
2025 Lump-sum repayment
(Note 3) Unsecured
Unguaranteed MUFG Bank, Ltd. 2,000,000 - - 2,000,000
Sumitomo Mitsui Trust Bank, Limited 1,000,000 - - 1,000,000
MUFG Bank, Ltd. 1,160,000 - - 1,160,000
0.46655 July 31 2024
Lump-sum repayment
(Note 3) Unsecured
Unguaranteed
Development Bank of Japan Inc. 580,000 - - 580,000
Mizuho Bank, Ltd. 580,000 - - 580,000
Sumitomo Mitsui Trust Bank, Limited 580,000 - - 580,000
Sumitomo Mitsui Banking Corporation 290,000 - - 290,000
MUFG Bank, Ltd. 1,800,000 - - 1,800,000
0.65518 July 31,
2026 Lump-sum repayment
(Note 3) Unsecured
Unguaranteed
Development Bank of Japan Inc. 900,000 - - 900,000
Mizuho Bank, Ltd. 900,000 - - 900,000
Sumitomo Mitsui Trust Bank, Limited 900,000 - - 900,000
Sumitomo Mitsui Banking Corporation 450,000 - - 450,000
Mizuho Trust & Banking Co., Ltd. 2,000,000 - - 2,000,000
0.46691 January 31,
2022 Lump-sum repayment
(Note 3) Unsecured
Unguaranteed
The Norinchukin Bank 1,500,000 - - 1,500,000
The Bank of Fukuoka, Ltd. 1,000,000 - - 1,000,000
The 77 Bank, Ltd. 500,000 - - 500,000
Daishi Hokuetsu Bank, Ltd. (Note 5) 500,000 - - 500,000
MUFG Bank, Ltd. 1,160,000 - - 1,160,000
0.62938 January 31,
2024 Lump-sum repayment
(Note 3) Unsecured
Unguaranteed
Development Bank of Japan Inc. 580,000 - - 580,000
Mizuho Bank, Ltd. 580,000 - - 580,000
Sumitomo Mitsui Trust Bank, Limited 580,000 - - 580,000
Sumitomo Mitsui Banking Corporation 290,000 - - 290,000
MUFG Bank, Ltd. 1,820,000 - - 1,820,000
0.79571 January 30,
2026 Lump-sum repayment
(Note 3) Unsecured
Unguaranteed
Development Bank of Japan Inc. 910,000 - - 910,000
Mizuho Bank, Ltd. 910,000 - - 910,000
Sumitomo Mitsui Trust Bank, Limited 910,000 - - 910,000
Sumitomo Mitsui Banking Corporation 450,000 - - 450,000
MUFG Bank, Ltd. 1,140,000 - - 1,140,000
0.49054 September 30,
2022 Lump-sum repayment
(Note 3) Unsecured
Unguaranteed
Development Bank of Japan Inc. 570,000 - - 570,000
Mizuho Bank, Ltd. 570,000 - - 570,000
Sumitomo Mitsui Trust Bank, Limited 570,000 - - 570,000
Sumitomo Mitsui Banking Corporation 300,000 - - 300,000
MUFG Bank, Ltd. 1,140,000 - - 1,140,000
0.77571 September 30,
2026 Lump-sum repayment
(Note 3) Unsecured
Unguaranteed
Development Bank of Japan Inc. 570,000 - - 570,000
Mizuho Bank, Ltd. 570,000 - - 570,000
Sumitomo Mitsui Trust Bank, Limited 570,000 - - 570,000
Sumitomo Mitsui Banking Corporation 300,000 - - 300,000
70 7170 71

- 48 -
Classification Balance at beginning of
current period (thousands of
yen)
Increase during period (thousands of
yen)
Decrease during period (thousands of
yen)
Balance at end of current
period (thousands of
yen)
Average interest rate
(%) (Note 2)
Maturity date
Repayment method
Use of funds Remarks
Lender
Long-term loans
payable (Note 1)
MUFG Bank, Ltd. 1,040,000 - - 1,040,000
0.65428 January 31,
2025 Lump-sum repayment
(Note 3) Unsecured
Unguaranteed
Development Bank of Japan Inc. 520,000 - - 520,000
Mizuho Bank, Ltd. 520,000 - - 520,000
Sumitomo Mitsui Trust Bank, Limited 520,000 - - 520,000
Sumitomo Mitsui Banking Corporation 260,000 - - 260,000
Shinkin Central Bank 1,300,000 - - 1,300,000
0.45804 March 31,
2023 Lump-sum repayment
(Note 3) Unsecured
Unguaranteed
The Norinchukin Bank 1,300,000 - - 1,300,000
The Bank of Fukuoka, Ltd. 1,300,000 - - 1,300,000
Mizuho Trust & Banking Co., Ltd. 1,000,000 - - 1,000,000
MUFG Bank, Ltd. 2,700,000 - - 2,700,000
0.62188 March 31,
2025 Lump-sum repayment
(Note 3) Unsecured
Unguaranteed Mizuho Bank, Ltd. 1,350,000 - - 1,350,000
Sumitomo Mitsui Banking Corporation 600,000 - - 600,000
Nippon Life Insurance Company 500,000 - - 500,000 0.55126
January 31, 2024
Lump-sum repayment
(Note 3) Unsecured
Unguaranteed Taiyo Life Insurance Company 500,000 - - 500,000
Resona Bank, Ltd. 1,000,000 - - 1,000,000 0.73497 August 31,
2026 Lump-sum repayment
(Note 3) Unsecured
Unguaranteed
Development Bank of Japan Inc. 550,000 - - 550,000
0.85667 March 31,
2027 Lump-sum repayment
(Note 3) Unsecured
Unguaranteed
Mizuho Bank, Ltd. 550,000 - - 550,000
Sumitomo Mitsui Trust Bank, Limited 550,000 - - 550,000
MUFG Bank, Ltd. 275,000 - - 275,000
Sumitomo Mitsui Banking Corporation 275,000 - - 275,000
Development Bank of Japan Inc. 550,000 - - 550,000
0.43105 July 31,
2023 Lump-sum repayment
(Note 3) Unsecured
Unguaranteed
Mizuho Bank, Ltd. 550,000 - - 550,000
Sumitomo Mitsui Trust Bank, Limited 550,000 - - 550,000
MUFG Bank, Ltd. 550,000 - - 550,000
Sumitomo Mitsui Banking Corporation 300,000 - - 300,000
Mizuho Bank, Ltd. 670,000 - - 670,000
0.39950 January 31,
2025 Lump-sum repayment
(Note 3) Unsecured
Unguaranteed
Sumitomo Mitsui Trust Bank, Limited 670,000 - - 670,000
MUFG Bank, Ltd. 670,000 - - 670,000
Sumitomo Mitsui Banking Corporation 320,000 - - 320,000
Development Bank of Japan Inc. 670,000 - - 670,000 0.49994 January 31,
2025 Lump-sum repayment
(Note 3) Unsecured
Unguaranteed
Mizuho Bank, Ltd. 700,000 - - 700,000
0.54500 September 30,
2026 Lump-sum repayment
(Note 3) Unsecured
Unguaranteed
Sumitomo Mitsui Trust Bank, Limited 700,000 - - 700,000
MUFG Bank, Ltd. 350,000 - - 350,000
Sumitomo Mitsui Banking Corporation 350,000 - - 350,000
Development Bank of Japan Inc. 700,000 - - 700,000 0.57826 September 30,
2026 Lump-sum repayment
(Note 3) Unsecured
Unguaranteed
Mizuho Bank, Ltd. 800,000 - 800,000 -
0.18361 September 30,
2020 Lump-sum repayment
(Note 3) Unsecured
Unguaranteed
Sumitomo Mitsui Trust Bank, Limited 800,000 - 800,000 -
MUFG Bank, Ltd. 800,000 - 800,000 -
Sumitomo Mitsui Banking Corporation 400,000 - 400,000 -
- 49 -
Classification Balance at beginning of
current period (thousands of
yen)
Increase during period (thousands of
yen)
Decrease during period (thousands of
yen)
Balance at end of current
period (thousands of
yen)
Average interest rate
(%) (Note 2)
Maturity date
Repayment method
Use of funds Remarks
Lender
Long-term loans
payable (Note 1)
Mizuho Bank, Ltd. 800,000 - - 800,000
0.24367 March. 31,
2022 Lump-sum repayment
(Note 3) Unsecured
Unguaranteed
Sumitomo Mitsui Trust Bank, Limited 800,000 - - 800,000
MUFG Bank, Ltd. 800,000 - - 800,000
Sumitomo Mitsui Banking Corporation 400,000 - - 400,000
Mizuho Bank, Ltd. 1,000,000 - - 1,000,000
0.45215 September 30,
2025 Lump-sum repayment
(Note 3) Unsecured
Unguaranteed
Sumitomo Mitsui Trust Bank, Limited 1,000,000 - - 1,000,000
MUFG Bank, Ltd. 1,000,000 - - 1,000,000
Sumitomo Mitsui Banking Corporation 500,000 - - 500,000
Mizuho Bank, Ltd. 970,000 - - 970,000
0.60810 September 30,
2027 Lump-sum repayment
(Note 3) Unsecured
Unguaranteed
Sumitomo Mitsui Trust Bank, Limited 970,000 - - 970,000
MUFG Bank, Ltd. 970,000 - - 970,000
Sumitomo Mitsui Banking Corporation 485,000 - - 485,000
Shinkin Central Bank 525,000 - - 525,000
0.42850 March 31,
2026 Lump-sum repayment
(Note 3) Unsecured
Unguaranteed
The Norinchukin Bank 525,000 - - 525,000
The Bank of Fukuoka, Ltd. 525,000 - - 525,000
Mizuho Trust & Banking Co., Ltd. 525,000 - - 525,000
Development Bank of Japan Inc. 1,350,000 - - 1,350,000 0.54693 March 31,
2028 Lump-sum repayment
(Note 3) Unsecured
Unguaranteed
Mizuho Bank, Ltd. 590,000 - 590,000 -
0.24727 February 26,
2021 (Note 4)
Lump-sum repayment
(Note 3) Unsecured
Unguaranteed
Sumitomo Mitsui Trust Bank, Limited 590,000 - 590,000 -
MUFG Bank, Ltd. 295,000 - 295,000 -
Sumitomo Mitsui Banking Corporation 295,000 - 295,000 -
Mizuho Bank, Ltd. 210,000 - - 210,000
0.26367 March 31,
2021 Lump-sum repayment
(Note 3) Unsecured
Unguaranteed
Sumitomo Mitsui Trust Bank, Limited 210,000 - - 210,000
MUFG Bank, Ltd. 100,000 - - 100,000
Sumitomo Mitsui Banking Corporation 100,000 - - 100,000
Development Bank of Japan Inc. 750,000 - - 750,000
0.47366 August 31,
2028 Lump-sum repayment
(Note 3) Unsecured
Unguaranteed
Mizuho Bank, Ltd. 750,000 - - 750,000
Sumitomo Mitsui Trust Bank, Limited 750,000 - - 750,000
MUFG Bank, Ltd. 375,000 - - 375,000
Sumitomo Mitsui Banking Corporation 375,000 - - 375,000
MUFG Bank, Ltd. 1,400,000 - - 1,400,000 0.26367 March 31,
2021 Lump-sum repayment
(Note 3) Unsecured
Unguaranteed
The 77 Bank, Ltd. 460,000 - - 460,000
0.46156 September 30,
2026 Lump-sum repayment
(Note 3) Unsecured
Unguaranteed
Shinkin Central Bank 460,000 - - 460,000
The Norinchukin Bank 460,000 - - 460,000
The Bank of Fukuoka, Ltd. 460,000 - - 460,000
Mizuho Trust & Banking Co., Ltd. 460,000 - - 460,000
Mizuho Bank, Ltd. 660,000 - - 660,000
0.26367 July 31, 2021 Lump-sum repayment
(Note 3) Unsecured
Unguaranteed Sumitomo Mitsui Trust Bank, Limited 660,000 - - 660,000
MUFG Bank, Ltd. 330,000 - - 330,000
Mizuho Bank, Ltd. 780,000 - - 780,000
0.26367 July 31, 2021 Lump-sum repayment
(Note 3) Unsecured
Unguaranteed Sumitomo Mitsui Trust Bank, Limited 780,000 - - 780,000
MUFG Bank, Ltd. 390,000 - - 390,000
72 7372 73
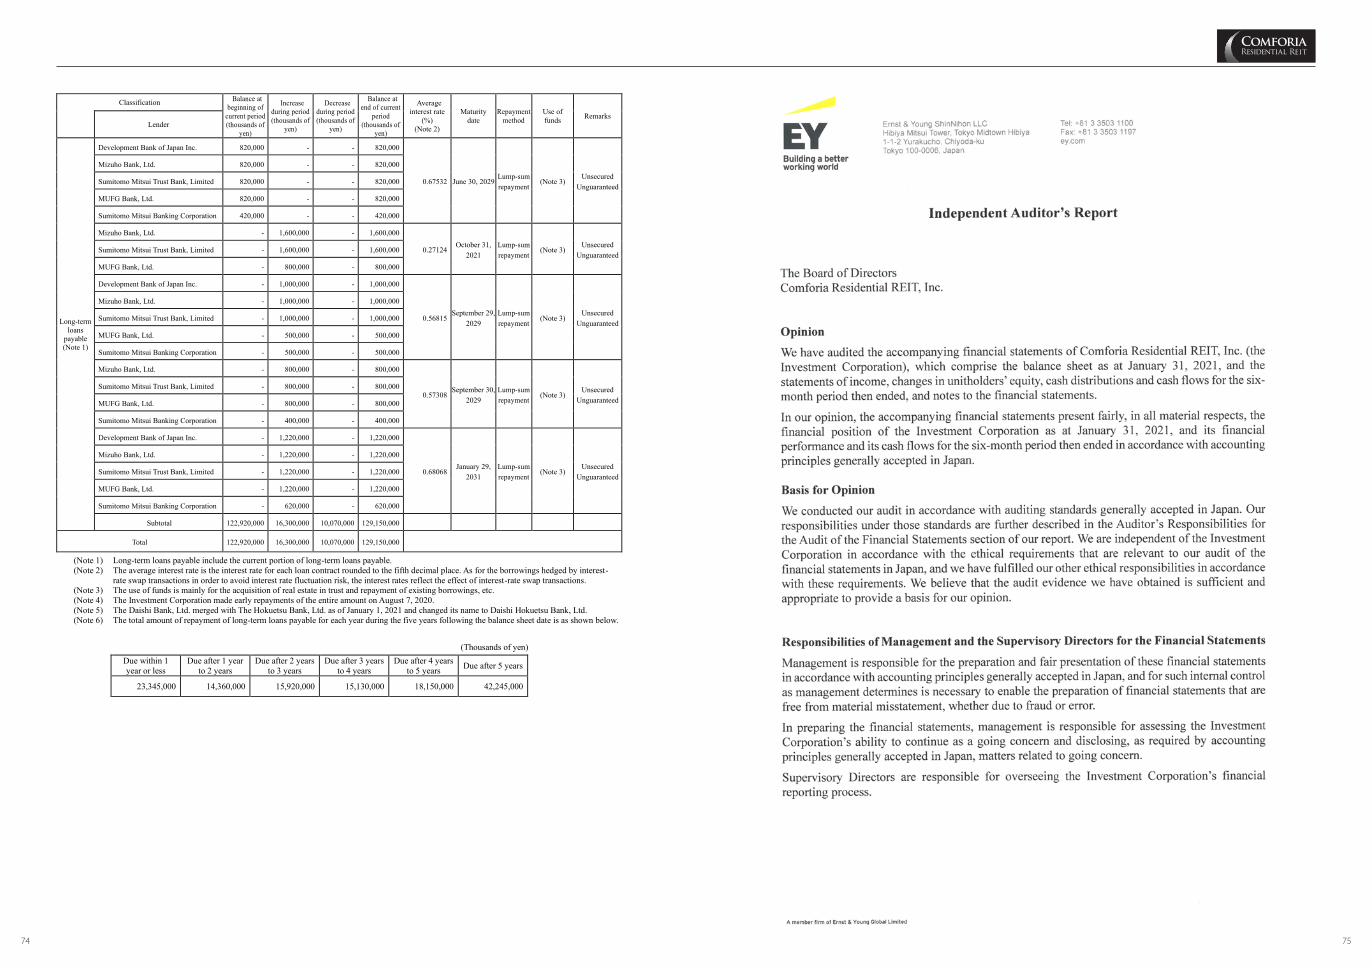
- 50 -
Classification Balance at beginning of
current period (thousands of
yen)
Increase during period (thousands of
yen)
Decrease during period (thousands of
yen)
Balance at end of current
period (thousands of
yen)
Average interest rate
(%) (Note 2)
Maturity date
Repayment method
Use of funds Remarks
Lender
Long-term loans
payable (Note 1)
Development Bank of Japan Inc. 820,000 - - 820,000
0.67532 June 30, 2029 Lump-sum repayment
(Note 3) Unsecured
Unguaranteed
Mizuho Bank, Ltd. 820,000 - - 820,000
Sumitomo Mitsui Trust Bank, Limited 820,000 - - 820,000
MUFG Bank, Ltd. 820,000 - - 820,000
Sumitomo Mitsui Banking Corporation 420,000 - - 420,000
Mizuho Bank, Ltd. - 1,600,000 - 1,600,000
0.27124 October 31,
2021 Lump-sum repayment
(Note 3) Unsecured
Unguaranteed Sumitomo Mitsui Trust Bank, Limited - 1,600,000 - 1,600,000
MUFG Bank, Ltd. - 800,000 - 800,000
Development Bank of Japan Inc. - 1,000,000 - 1,000,000
0.56815 September 29,
2029 Lump-sum repayment
(Note 3) Unsecured
Unguaranteed
Mizuho Bank, Ltd. - 1,000,000 - 1,000,000
Sumitomo Mitsui Trust Bank, Limited - 1,000,000 - 1,000,000
MUFG Bank, Ltd. - 500,000 - 500,000
Sumitomo Mitsui Banking Corporation - 500,000 - 500,000
Mizuho Bank, Ltd. - 800,000 - 800,000
0.57308 September 30,
2029 Lump-sum repayment
(Note 3) Unsecured
Unguaranteed
Sumitomo Mitsui Trust Bank, Limited - 800,000 - 800,000
MUFG Bank, Ltd. - 800,000 - 800,000
Sumitomo Mitsui Banking Corporation - 400,000 - 400,000
Development Bank of Japan Inc. - 1,220,000 - 1,220,000
0.68068 January 29,
2031 Lump-sum repayment
(Note 3) Unsecured
Unguaranteed
Mizuho Bank, Ltd. - 1,220,000 - 1,220,000
Sumitomo Mitsui Trust Bank, Limited - 1,220,000 - 1,220,000
MUFG Bank, Ltd. - 1,220,000 - 1,220,000
Sumitomo Mitsui Banking Corporation - 620,000 - 620,000
Subtotal 122,920,000 16,300,000 10,070,000 129,150,000
Total 122,920,000 16,300,000 10,070,000 129,150,000
(Note 1) Long-term loans payable include the current portion of long-term loans payable. (Note 2) The average interest rate is the interest rate for each loan contract rounded to the fifth decimal place. As for the borrowings hedged by interest-
rate swap transactions in order to avoid interest rate fluctuation risk, the interest rates reflect the effect of interest-rate swap transactions. (Note 3) The use of funds is mainly for the acquisition of real estate in trust and repayment of existing borrowings, etc. (Note 4) The Investment Corporation made early repayments of the entire amount on August 7, 2020. (Note 5) The Daishi Bank, Ltd. merged with The Hokuetsu Bank, Ltd. as of January 1, 2021 and changed its name to Daishi Hokuetsu Bank, Ltd. (Note 6) The total amount of repayment of long-term loans payable for each year during the five years following the balance sheet date is as shown below.
(Thousands of yen) Due within 1 year or less
Due after 1 year to 2 years
Due after 2 years to 3 years
Due after 3 years to 4 years
Due after 4 years to 5 years Due after 5 years
23,345,000 14,360,000 15,920,000 15,130,000 18,150,000 42,245,000
74 7574 75
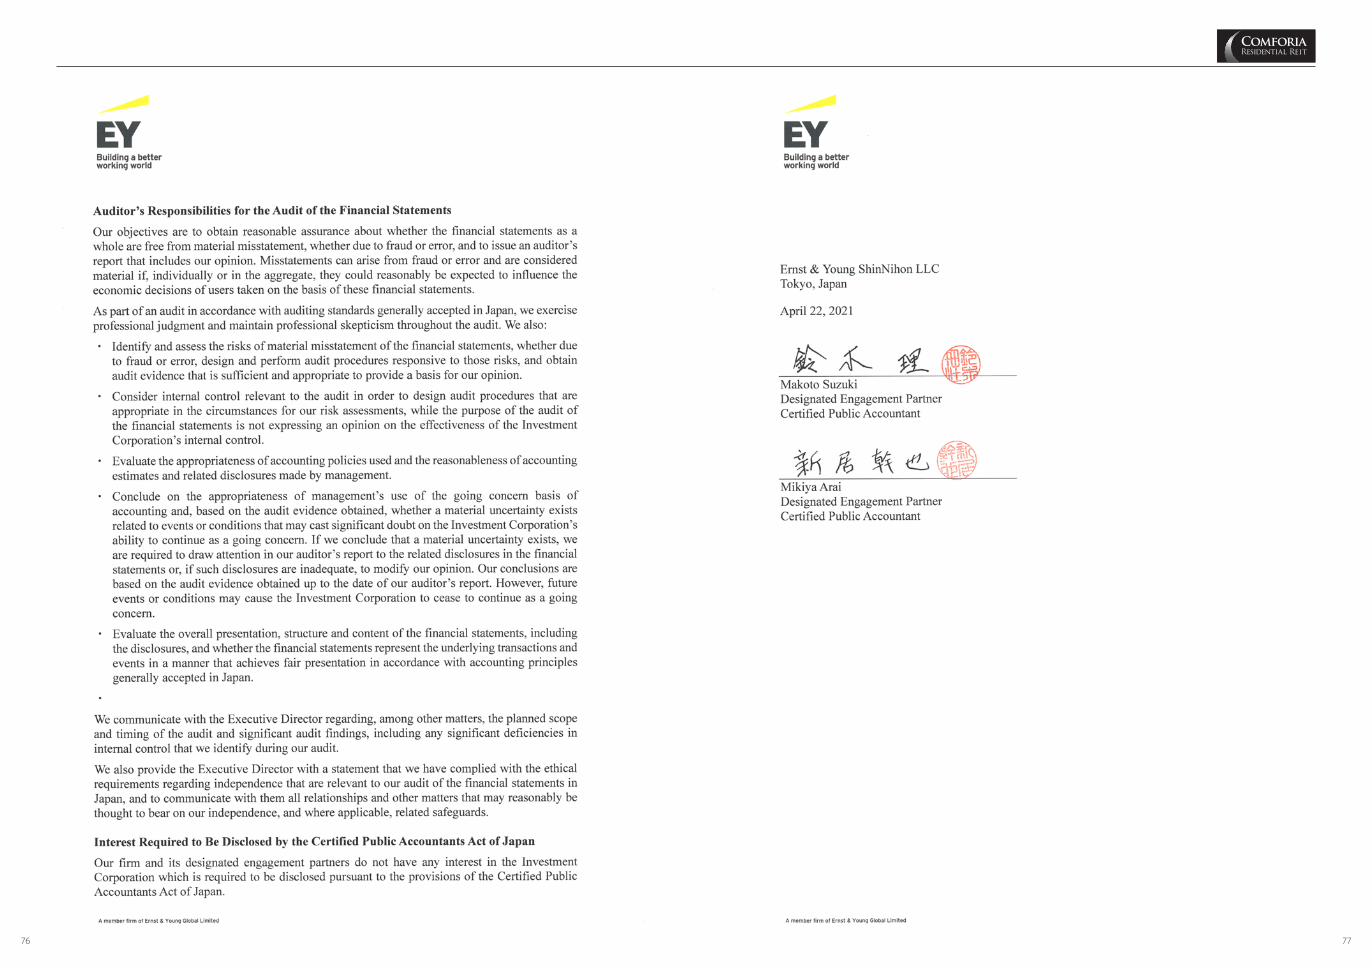
76 7776 77