22 demyelinating and inflammatory disease of the spinal
TRANSCRIPT

22 Demyelinating and Inflammatory Disease of the
Spinal Cord on Magnetic Resonance Imaging
CLINICAL IMAGAGINGAN ATLAS OF DIFFERENTIAL DAIGNOSIS
EISENBERG
DR. Muhammad Bin Zulfiqar PGR-FCPS III SIMS/SHL

• Fig SP 22-1 Multiple sclerosis. (A) T1-weighted and (B) T2-weighted sagittal images show focal enlargement of the cord at the C2 level that demonstrates high signal intensity (arrow, B).20

• Fig SP 22-2 Multiple sclerosis. (A) Sagittal T2-weighted image shows focal increased signal posteriorly (arrows) at the level of C3 in a normal-sized spinal cord. The plaque is approximately half a vertebral segment in length and is longer than it is wide. (B) Axial T2-weighted scan through the plaque shows the typical peripheral posterolateral location in cross section (arrow). Note that the plaque involves less than half the cross-sectional area of the cord. (C) Axial proton-density image at the same level shows clear involvement of the left dorsal and lateral horns of the central gray matter (large arrows) compared with the appearance of the normal right dorsal and lateral horns (small arrows).21

• Fig SP 22-3 Transverse myelitis. T2-weighted sagittal images in a young boy with rapid onset of back pain and paraplegia 3 weeks after a viral illness show diffuse, increased signal intensity in the cord, consistent with edema.20

• Fig SP 22-4 Inflammatory myelitis. (A) Initial parasagittal proton-density image shows diffuse enlargement of the thoracic cord, which has a heterogeneously high signal. (B) After contrast administration, there are several areas of abnormal enhancement within the enlarged thoracic cord. The largest of these areas demonstrates a peripheral, diffuse pattern of enhancement (arrow). A separate area of enhancement is noted superiorly (curved arrow). (Courtesy of Linda L. Coleman, M.D.)22

• Fig SP 22-5 AIDS-related myelopathy. T2-weighted sagittal image demonstrates high intramedullary signal in a somewhat swollen area of the thoracic cord.20

• Fig SP 22-6 Postradiation myelitis. T2-weighted image after radiation therapy for laryngeal cancer shows increased signal intensity (arrows) in the spinal cord from C4-C7.11
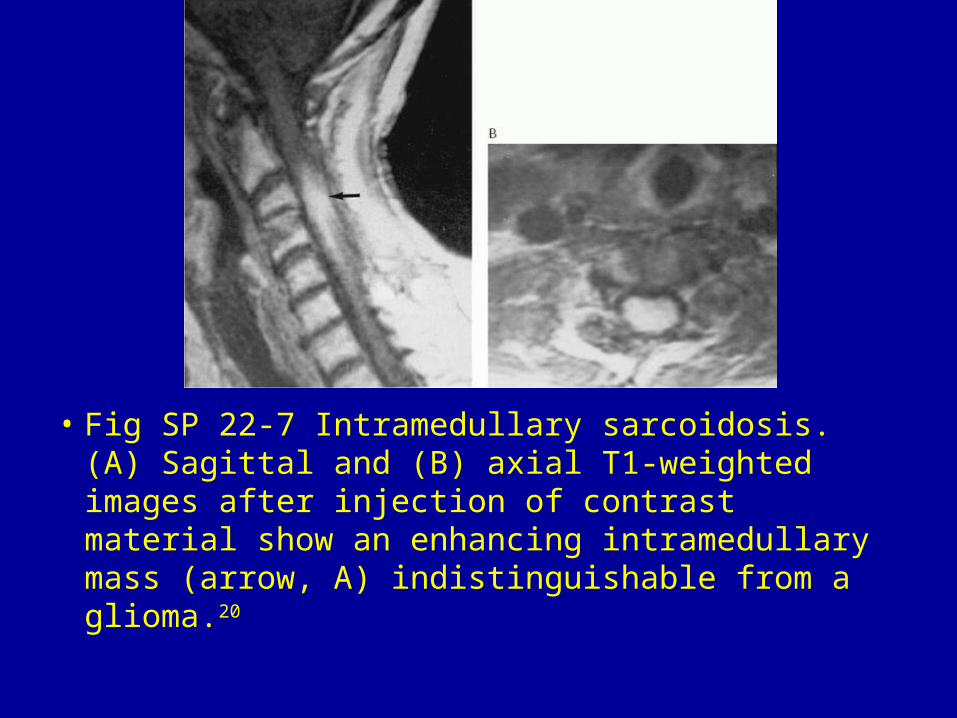
• Fig SP 22-7 Intramedullary sarcoidosis. (A) Sagittal and (B) axial T1-weighted images after injection of contrast material show an enhancing intramedullary mass (arrow, A) indistinguishable from a glioma.20

• Fig SP 22-8 Pial sarcoidosis. T1-weighted axial image of the thoracic region of the spine after injection of contrast material demonstrates pial enhancement along the conus (arrows). The patient's bilateral lower extremity numbness resolved after steroid therapy.20

