22. kinematics and mechanics of the indian ocean …22. kinematics and mechanics of the indian ocean...
TRANSCRIPT
Cochran, J. R., Stow, D.A.V., et al., 1990Proceedings of the Ocean Drilling Program, Scientific Results, Vol. 116
22. KINEMATICS AND MECHANICS OF THE INDIAN OCEAN DIFFUSEPLATE BOUNDARY ZONE1
Carol A. Stein,2 Sierd Cloetingh,3 and Rinus Wortel4
ABSTRACT
We review data and models for the recent tectonics of the region in the northern Indian Ocean from the CentralIndian Ridge to the Sumatra Trench, long considered an anomalous tectonic region. Seismicity is much greater thanexpected for an area not traditionally considered to be a plate boundary, and the crust and sediments are deformedby both folding and faulting. Recently these phenomena, previously considered examples of deformation within anonrigid Indo-Australian Plate, have been explained in terms of rigid plate tectonics. Analysis of relative platemotion data along the Carlsberg and Central Indian Ridges indicates the presence of distinct Indian and Australianplates. The seismicity and deformation thus reflect a diffuse boundary between these two rigid plates. This platemotion model eliminates the nonclosure of the Indian Ocean triple junction. The kinematic models, which describethe present-day plate motions, do not directly address the mechanics of the formation of the diffuse plate boundary.Further insight can be obtained from mechanical models of the stresses in the Central Indian Basin, including onesbased on plate driving forces. The predicted stresses are consistent with the diffuse boundary model and distributionof deformation shown by seismicity, and by marine geophysical and satellite gravity data. Furthermore, theyprovide an explanation for the widespread pattern of compressional folding east, west, and on the Ninetyeast Ridge.These data and the kinematic and mechanical models provide insight into three enigmatic tectonic features: thecomplex blocky structure of the Ninetyeast Ridge north of 10°S, the trend of the southernmost 85°E Ridge, and therapid recent subsidence of the southern Chagos-Laccadive Ridge.
INTRODUCTION
The northeastern Indian Ocean has unusually high seismic-ity compared to most intraplate regions (Gutenberg and Rich-ter, 1954; Stover, 1966; Rothe, 1969; Sykes, 1970; Stein andOkal, 1978; Stein, 1978; Wiens and Stein, 1983; 1984; Berg-man et al., 1984; Bergman and Solomon, 1984; 1985; Wiens,1986; Petroy and Wiens, 1989). Concentrations of earthquakesoccur near the Ninetyeast and Chagos-Laccadive ridges, andothers are distributed throughout a wide region Fig. 1). Thefocal mechanisms show a pattern of faulting varying from bothnormal and strike-slip between the Central Indian and Carls-berg ridges and the Chagos-Laccadive Ridge, to thrust andstrike-slip faulting eastward to the Sumatra subduction zone.
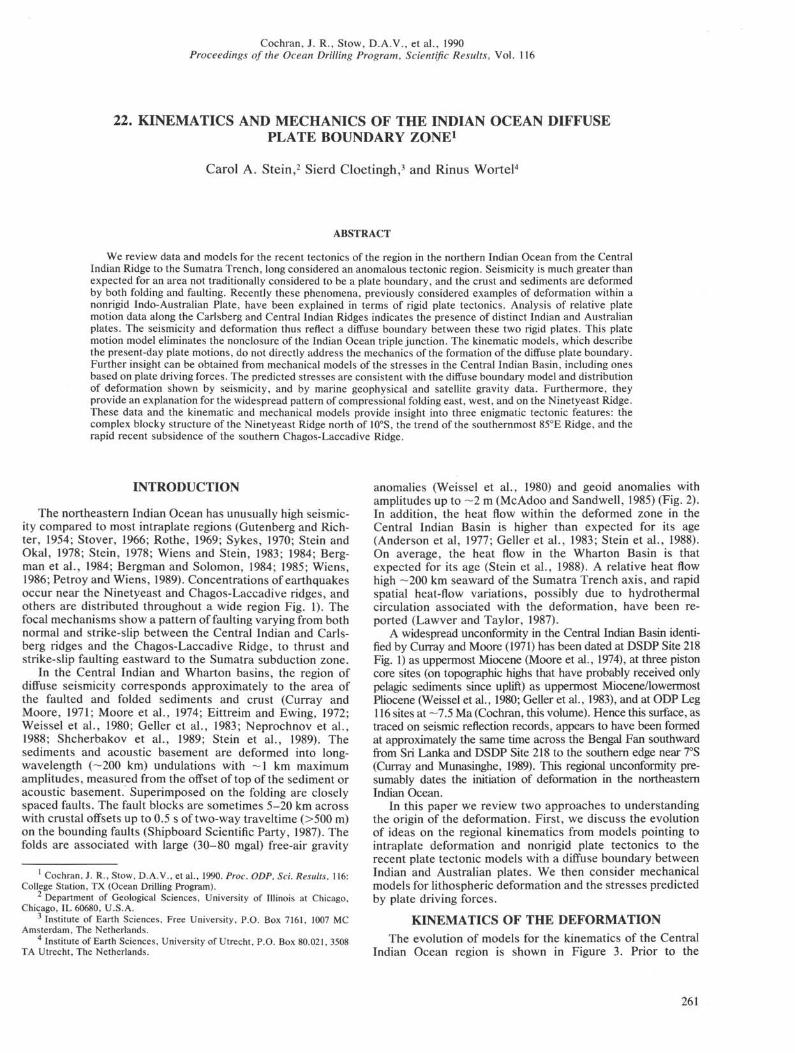
In the Central Indian and Wharton basins, the region ofdiffuse seismicity corresponds approximately to the area ofthe faulted and folded sediments and crust (Curray andMoore, 1971; Moore et al., 1974; Eittreim and Ewing, 1972;Weissel et al., 1980; Geller et al., 1983; Neprochnov et al.,1988; Shcherbakov et al., 1989; Stein et al., 1989). Thesediments and acoustic basement are deformed into long-wavelength (—200 km) undulations with ~l km maximumamplitudes, measured from the offset of top of the sediment oracoustic basement. Superimposed on the folding are closelyspaced faults. The fault blocks are sometimes 5-20 km acrosswith crustal offsets up to 0.5 s of two-way traveltime (>500 m)on the bounding faults (Shipboard Scientific Party, 1987). Thefolds are associated with large (30-80 mgal) free-air gravity
1 Cochran, J. R., Stow, D.A.V., et al., 1990. Proc. ODP, Sci. Results, 116:College Station, TX (Ocean Drilling Program).
2 Department of Geological Sciences, University of Illinois at Chicago,Chicago, IL 60680, U.S.A.
3 Institute of Earth Sciences, Free University, P.O. Box 7161, 1007 MCAmsterdam, The Netherlands.
4 Institute of Earth Sciences, University of Utrecht, P.O. Box 80.021, 3508TA Utrecht, The Netherlands.
anomalies (Weissel et al., 1980) and geoid anomalies withamplitudes up to ~2 m (McAdoo and Sandwell, 1985) (Fig. 2).In addition, the heat flow within the deformed zone in theCentral Indian Basin is higher than expected for its age(Anderson et al, 1977; Geller et al., 1983; Stein et al., 1988).On average, the heat flow in the Wharton Basin is thatexpected for its age (Stein et al., 1988). A relative heat flowhigh —200 km seaward of the Sumatra Trench axis, and rapidspatial heat-flow variations, possibly due to hydrothermalcirculation associated with the deformation, have been re-ported (Lawver and Taylor, 1987).
A widespread unconformity in the Central Indian Basin identi-fied by Curray and Moore (1971) has been dated at DSDP Site 218Fig. 1) as uppermost Miocene (Moore et al., 1974), at three pistoncore sites (on topographic highs that have probably received onlypelagic sediments since uplift) as uppermost Miocene/lowermostPliocene (Weissel et al., 1980; Geller et al., 1983), and at ODP Leg116 sites at —7.5 Ma (Cochran, this volume). Hence this surface, astraced on seismic reflection records, appears to have been formedat approximately the same time across the Bengal Fan southwardfrom Sri Lanka and DSDP Site 218 to the southern edge near 7°S(Curray and Munasinghe, 1989). This regional unconformity pre-sumably dates the initiation of deformation in the northeasternIndian Ocean.
In this paper we review two approaches to understandingthe origin of the deformation. First, we discuss the evolutionof ideas on the regional kinematics from models pointing tointraplate deformation and nonrigid plate tectonics to therecent plate tectonic models with a diffuse boundary betweenIndian and Australian plates. We then consider mechanicalmodels for lithospheric deformation and the stresses predictedby plate driving forces.
KINEMATICS OF THE DEFORMATIONThe evolution of models for the kinematics of the Central
Indian Ocean region is shown in Figure 3. Prior to the
261

C. STEIN, S. CLOETINGH, R. WORTEL
20° N^ DSDP ond ODP
d r i l l s i t βs
10'
ChogoβLoccod i veRidge
Intropioie
eorihquokes
nilSTRRLlrilfPLflTE
K|inei yeastRidge
20'
30° S90O 100° 110 120°E
Figure 1. Intraplate seismicity, focal mechanisms, plate boundaries, and major seafloor features for the northeastern Indian Ocean. The shadedregion is the diffuse plate boundary between the Indian and Australian plates. For convenience we describe the Wharton Basin as the region eastof the Ninetyeast Ridge. Focal mechanisms from Stein (1978), Wiens and Stein (1983, 1984), Bergman, et al. (1984), Bergman and Solomon (1984,1985), Wiens (1986), Petroy and Wiens (1989), and Stein and Weissel (in press). Some of the epicenters are from relocations by Wiens (1986) andPetroy and Wiens (1989).
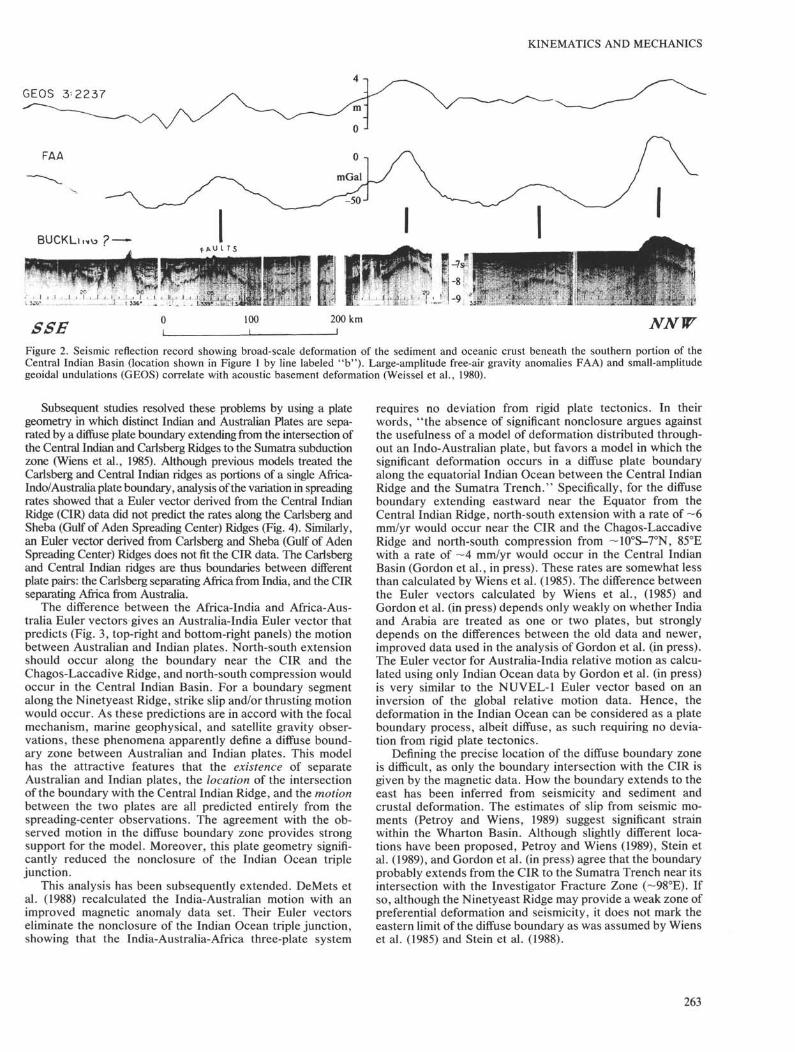
development of plate tectonics, Gutenberg and Richter (1954)noted an unusual concentration of activity near the southernend of the Chagos Ridge and the northern Ninetyeast Ridge.Sykes (1970) suggested that this seismicity reflected an incip-ient island arc extending from Sri Lanka to Australia, possiblyrelated to a westward change in the location of the Sumatrasubduction zone. Subsequent focal mechanism studies (Fitch,1972; Stein and Okal, 1978; Bergman and Solomon, 1985)showed strike-slip motion within the proposed nascent sub-duction zone. Stein and Okal (1978) suggested that the left-lateral strike slip faulting along the northern Ninetyeast Ridgerepresents relative motion between the eastern and westernhalves of the Indo-Australian Plate, with a boundary extend-ing northward from the southeast Indian Ridge. This slip,estimated at —20 mm/yr from seismic moments, was thoughtto result from the greater resistance along the Himalayan zoneof continental collision compared to the plate portion sub-ducted beneath the Indonesian Arc. Based on a reanalysis ofthe earthquake data, including hypocentral locations andseismic moments, Petroy and Wiens (1989) concluded that theslip is —2.8 mm/yr.
Relative plate motion models provide additional insight. Ifthree plates meeting at a triple junction act rigidly, the threeEuler vectors describing their relative motions must sum tozero, within the uncertainties of the velocity estimates. Min-ster and Jordan (1978), however, noted that the Indian Oceantriple junction (between Africa, Antarctica, and Indo-Aus-tralia) had significant non-closure, which could be reduced byseparating the Indo-Australian Plate into two portions, per-haps with a boundary near the Ninetyeast Ridge, as implied bythe seismicity. The improved fit to the data introduced bysplitting the Indo-Australian Plate is statistically significant(Stein and Gordon, 1984).
Three major problems were not explained by this model.First, the Ninetyeast Ridge being a transform boundarybetween two plates was incompatible with the observationthat the high seismicity and associated blocky morphologyof the ridge did not extend south of — 10°S. Second, thismodel did not explain the normal faulting earthquakes nearthe Chagos Bank. Third, it did not explain the diffuseseismicity throughout the Central Indian and Wharton ba-sins.
262
KINEMATICS AND MECHANICS
GEOS 32237
SSBFigure 2. Seismic reflection record showing broad-scale deformation of the sediment and oceanic crust beneath the southern portion of theCentral Indian Basin (location shown in Figure 1 by line labeled "b"). Large-amplitude free-air gravity anomalies FAA) and small-amplitudegeoidal undulations (GEOS) correlate with acoustic basement deformation (Weissel et al., 1980).
Subsequent studies resolved these problems by using a plategeometry in which distinct Indian and Australian Plates are sepa-rated by a diffuse plate boundary extending from the intersection ofthe Central Indian and Carlsberg Ridges to the Sumatra subductionzone (Wiens et al., 1985). Although previous models treated theCarlsberg and Central Indian ridges as portions of a single Africa-Indo/Australia plate boundary, analysis of the variation in spreadingrates showed that a Euler vector derived from the Central IndianRidge (CIR) data did not predict the rates along the Carlsberg andSheba (Gulf of Aden Spreading Center) Ridges (Fig. 4). Similarly,an Euler vector derived from Carlsberg and Sheba (Gulf of AdenSpreading Center) Ridges does not fit the CIR data. The Carlsbergand Central Indian ridges are thus boundaries between differentplate pairs: the Carlsberg separating Africa from India, and the CIRseparating Africa from Australia.
The difference between the Africa-India and Africa-Aus-tralia Euler vectors gives an Australia-India Euler vector thatpredicts (Fig. 3, top-right and bottom-right panels) the motionbetween Australian and Indian plates. North-south extensionshould occur along the boundary near the CIR and theChagos-Laccadive Ridge, and north-south compression wouldoccur in the Central Indian Basin. For a boundary segmentalong the Ninety east Ridge, strike slip and/or thrusting motionwould occur. As these predictions are in accord with the focalmechanism, marine geophysical, and satellite gravity obser-vations, these phenomena apparently define a diffuse bound-ary zone between Australian and Indian plates. This modelhas the attractive features that the existence of separateAustralian and Indian plates, the location of the intersectionof the boundary with the Central Indian Ridge, and the motionbetween the two plates are all predicted entirely from thespreading-center observations. The agreement with the ob-served motion in the diffuse boundary zone provides strongsupport for the model. Moreover, this plate geometry signifi-cantly reduced the nonclosure of the Indian Ocean triplejunction.
This analysis has been subsequently extended. DeMets etal. (1988) recalculated the India-Australian motion with animproved magnetic anomaly data set. Their Euler vectorseliminate the nonclosure of the Indian Ocean triple junction,showing that the India-Australia-Africa three-plate system
requires no deviation from rigid plate tectonics. In theirwords, "the absence of significant nonclosure argues againstthe usefulness of a model of deformation distributed through-out an Indo-Australian plate, but favors a model in which thesignificant deformation occurs in a diffuse plate boundaryalong the equatorial Indian Ocean between the Central IndianRidge and the Sumatra Trench." Specifically, for the diffuseboundary extending eastward near the Equator from theCentral Indian Ridge, north-south extension with a rate of ~6mm/yr would occur near the CIR and the Chagos-LaccadiveRidge and north-south compression from ~10°S-7°N, 85°Ewith a rate of ~4 mm/yr would occur in the Central IndianBasin (Gordon et al., in press). These rates are somewhat lessthan calculated by Wiens et al. (1985). The difference betweenthe Euler vectors calculated by Wiens et al., (1985) andGordon et al. (in press) depends only weakly on whether Indiaand Arabia are treated as one or two plates, but stronglydepends on the differences between the old data and newer,improved data used in the analysis of Gordon et al. (in press).The Euler vector for Australia-India relative motion as calcu-lated using only Indian Ocean data by Gordon et al. (in press)is very similar to the NUVEL-1 Euler vector based on aninversion of the global relative motion data. Hence, thedeformation in the Indian Ocean can be considered as a plateboundary process, albeit diffuse, as such requiring no devia-tion from rigid plate tectonics.
Defining the precise location of the diffuse boundary zoneis difficult, as only the boundary intersection with the CIR isgiven by the magnetic data. How the boundary extends to theeast has been inferred from seismicity and sediment andcrustal deformation. The estimates of slip from seismic mo-ments (Petroy and Wiens, 1989) suggest significant strainwithin the Wharton Basin. Although slightly different loca-tions have been proposed, Petroy and Wiens (1989), Stein etal. (1989), and Gordon et al. (in press) agree that the boundaryprobably extends from the CIR to the Sumatra Trench near itsintersection with the Investigator Fracture Zone (~98°E). Ifso, although the Ninetyeast Ridge may provide a weak zone ofpreferential deformation and seismicity, it does not mark theeastern limit of the diffuse boundary as was assumed by Wienset al. (1985) and Stein et al. (1988).
263
90E & CHAGOSANOMALOUS SEISMICITY
2O'N
20"S
6Q E. 80'E, 1OO°E,
JUTENBERG
A RICHTER
1954
INDIA - AUSTRALIA MOTIONALONG 90E
6 0 ' E . 8Q E, 100'E,
2O"N
20*S
CEYLON - AUSTRALIANASCENT ARC
6Q E. 80'E, 100'E.
20"N
20"S
20'N
0°
20*S
PLATE MOTION INVERSION MODELS40'E, 60'E. 80"E. 100°E.
WIENS ET Al..,. _ „ J ANTARCTIC > AUSTRALIAN1985 PLATE V PLATE
CIR-SUMATRA DIFFUSE BOUNDARY
6O'E. 80'E. 100'E,
20"N
20*S
2O'N
20"S
40'E,NUVEL - 1
80'E, 100'E,
DEMETS ET AANTARCTIC
PLATE
Figure 3. Schematic diagrams illustrating the historical development of tectonic models for the northern Indian Ocean. Modified from Wiens et al. (1986).

KINEMATICS AND MECHANICS
GULF OF ADEN POLE
25 mm/yr full rate
DATAprofile OW 8-11
7.9°N, 59.1°E
CENTRAL INDIAN RIDGE POLE
14 mm/yrSW NE
B
i i i0 20 40
NUVEL-1
AFRICA-ARAB I A-
AUSTRALIA
I60
I80
r200
gammas
15
10~S 0" 10°N
BOUNDARY LATITUDERATE
(CM/YR)
AZIMUTH
N40°E
E
S40°E
S10°W
ICARLSBERG nn. c_.__,_ GULr _RIDGE 0F
ADENCENTRALINDIANRIDGE
PREDICTED:
CIR POLE
"GULF OF ADENPOLE
OWEN i[TRANSFORM
20S 10S 0LATITUDE
10N
Figure 4. A. Carlsberg Ridge magnetic anomalies. Synthetic anomalies for 25 mm/yr full ratepredicted by the Euler vector for the Gulf of Aden, fit the observed data better than the slowerrate predicted from the Central Indian Ridge data (after Wiens et al., 1985). B. (Top) platekinematic test of the proposed boundary geometry (after Wiens et al., 1985). (Middle) misfitto relative motion data as a function of the assumed location of the boundary between theIndo-Arabian and Australian plates. The minimum misfit occurs for a boundary between 4°Nand the Equator. (Bottom) rate and azimuth data along the boundary separating Africa fromplates to the east. The Carlsberg Ridge rates and Owen Transform azimuth are better fit by thepredictions of a pole from the Gulf of Aden data (solid line) than those for a pole from theCentral Indian Ridge data (dashed line).
265
C. STEIN, S. CLOETINGH, R. WORTEL
Gordon et al. (in press) have shown that the cumulativedeformation estimated from seismicity and seismic reflectionrecords is compatible with the Indian/Australian motion polefor present-day motions maintained over the last 7.5 Ma.Also, Leg 116 drilling results suggest that the deformation hasbeen more or less continuous since its initiation at 7.5 Ma(Cochran, this volume). As noted by Gordon et al. (in press),in the Central Indian Basin the folding can only account for afew kilometers of horizontal shortening (substantially lessthan predicted by the Euler vector for Australian-Indianmotion) and they suggest that much of the shortening mayoccur by reverse faulting. Many reverse faults are observedon seismic reflection records (Weissel et al., 1980; Geller etal., 1983).
MECHANICS OF THE DEFORMATIONAlthough the diffuse boundary model explains the defor-
mation^ location and sense of faulting, it is a kinematic modeland hence does not address the mechanics of the diffuse plateboundary. Insight into the mechanics can be obtained fromseveral approaches. The shape of the folding reflects therheology and applied stresses. In addition, constraints onmodels of the plate driving forces can be derived from thestate of stress within a plate (Richardson et al., 1979). Modelsfor the mechanics of the deformation can thus be compared tothe principal stress directions inferred from focal mechanismsolutions and the orientation, distribution, and magnitude ofthe faulting and folding.
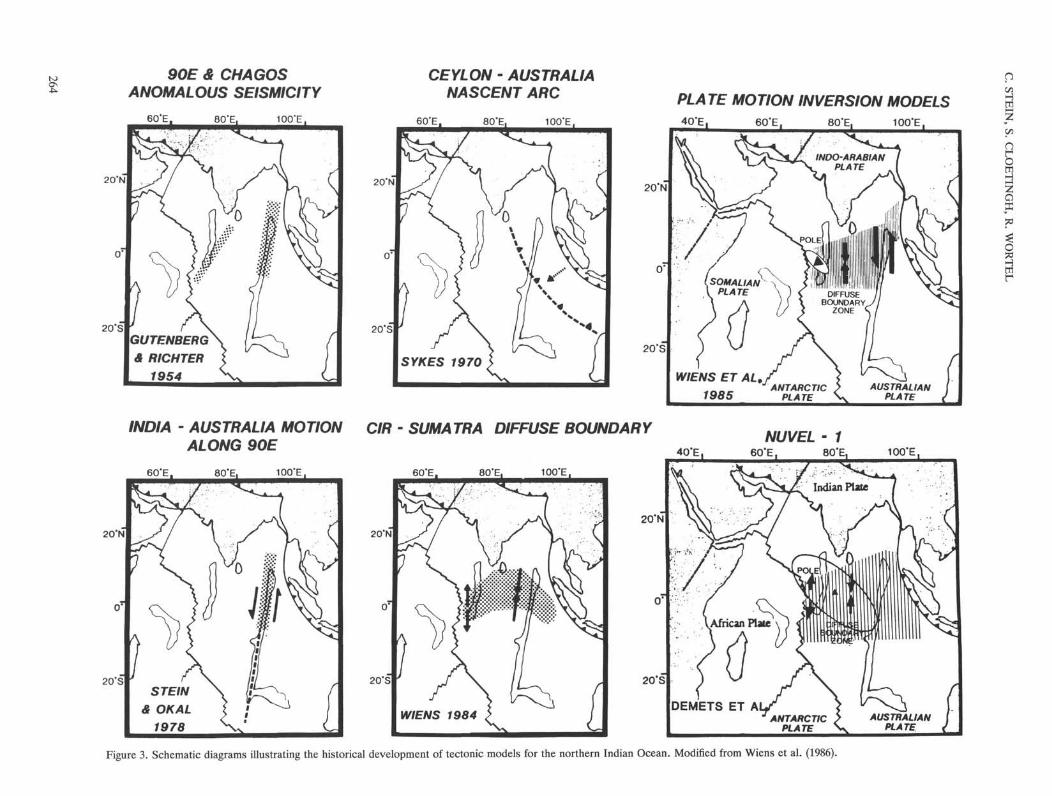
The temperature structure is important in determining thelithospheric strength (Goetze, 1978; Goetze and Evans, 1979)and hence stress and deformation. This issue is relevant forthe Central Indian Basin, as the heat flow is about 10-40mW/m2 greater than expected for its age (Geller et al., 1983;Stein et al., 1988). Attempts have thus been made to under-stand the origin of the additional heat and to determine if thetemperatures at depth are significantly greater than predictedby thermal models (e.g. Parsons and Sclater, 1977).
Lithospheric TemperaturesThe temperature distribution with depth can be constrained
by combining heat flow, bathymetry, and seismicity data (Fig.5). The heat-flow constrains the near-surface temperaturedistribution. The bathymetric depths for the Central IndianBasin, on average those expected for these lithospheric agesafter corrections for sediment loads (Cochran and Talwani,1977; Stein, 1984) (Fig. 6), constrain the integral of thetemperature with depth. As the depths of oceanic intraplateearthquakes appear to be limited by an isotherm ~750°C(Chen and Molnar, 1983; Wiens and Stein, 1983) (Fig. 7), themaximum earthquake depth (40 km) constrains the minimumdepth of deformation and the maximum temperature there(Stein, 1984). Assuming a dry olivine rheology and averageglobal intraplate strain rate of 10~18/s, the strength corre-sponding to a limiting temperature for seismicity of 750°C is 17MPa. As the strain rate in the Central Indian Basin is higher,possibly 10~15/s, a limiting temperature for seismicity of~880°C may be more appropriate (Stein and Weissel, inpress).
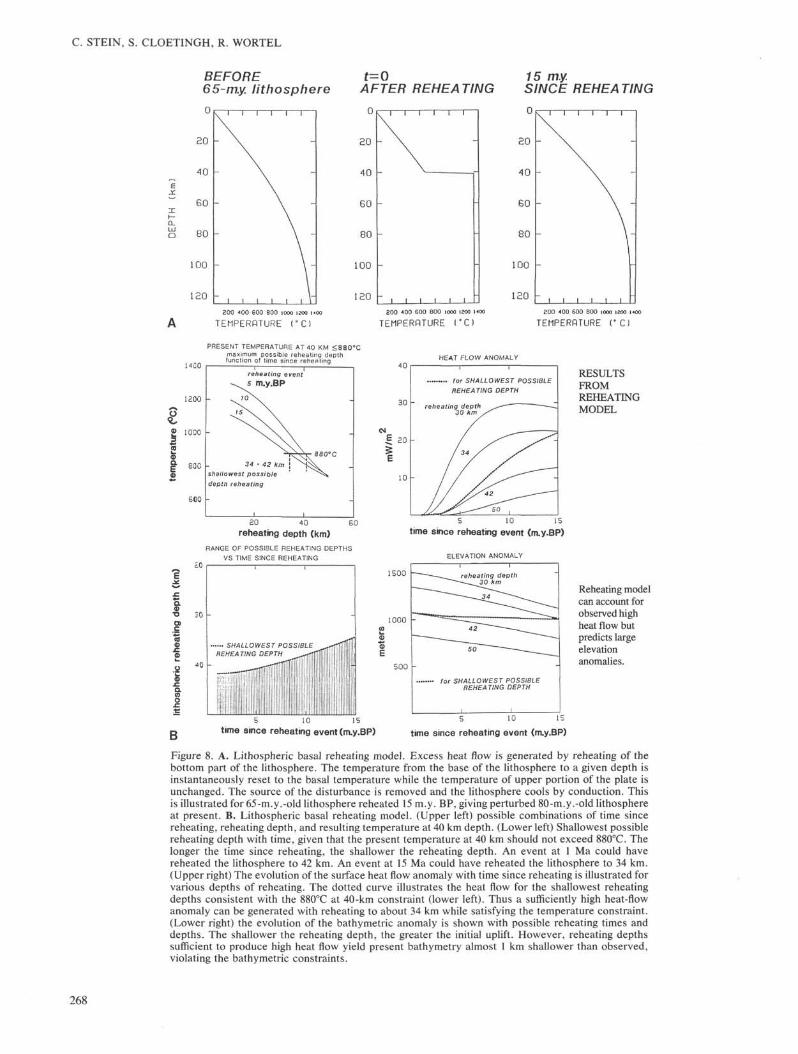
The present thermal structure was investigated by exam-ining different models and attempting to match these threeobservational constraints. First, high heat flow may resultfrom anomalous lithosphere with a basal temperature orthickness different from typical oceanic lithosphere. In thiscase the temperature constraints from the earthquake depthsrestrict the additional heat flux to less than 10-15 mW/m2.Second, extra flux may result from reheating the bottomportion of the lithosphere to asthenospheric temperatures Fig.
80 MA LITHOSPHERE STRENGTH ENVELOPE
•
HEAT FLOW
\
Mi lk EARTH-\ QUAKE.\DEPTHS
ELEVATION \
_ 750 C
300 600 900TEMPERATURE (C)
-750 0 750 1500STRENGTH(MPA)
Figure 5. Geotherm and strength envelope for 80-Ma oceanic litho-sphere. (Left) temperature profile for the Parsons and Sclater (1977)plate cooling model and schematic illustration of the observableconstraints. Heat flow constrains the near-surface thermal gradient.The bathymetry constrains the vertical integral of the temperatureswithin the plate. The maximum depth of earthquakes provides infor-mation on the temperature at that depth. (Right) strength envelopecalculated for a dry olivine rheology and the temperature profileshown at left. Ductile strength calculated for two strain rates of10~15/s and 10~18/s; the ductile strength is higher at greater strainrates. Zero pore pressure is assumed in brittle strength calculation.The maximum observed depth of intraplate oceanic earthquakesappears to be limited approximately by the 750°C isotherm (Wiens andStein, 1983).
8A). Substantial reheating 30-40 km below the surface isrequired to match the high heat flow Fig. 8B). Such reheatingshould produce ~l km of uplift, whereas the average base-ment depth is no shallower than expected for its age. Thus,significant deep lithospheric reheating cannot be widespreadover the deformed region. Third, a temperature perturbationwithin the lithosphere can change the surface heat flux withtime Fig. 9). A temperature perturbation at shallow depthscould produce the present heat-flow anomaly, but no evidencefor shallow intrusion or other mechanisms for such an effectexists. Hence, despite the heat flow anomaly, the lack of anaverage bathymetric anomaly and the observation of seismic-ity to depths in excess of 30 km indicate that lithospherictemperatures in the Central Indian Basin are not significantlydifferent from those expected for its age (Stein and Weissel, inpress).
It has been suggested that horizontal water flow over largedistances in the Bengal Fan sediments may be responsible forthe high heat flow. Drilling during Leg 116 supported theconclusions derived from temperature measurements in theupper 5 m (Geller et al., 1983), indicating very vigorous waterflux through the sediment column and perhaps through theupper crust (Cochran, Stow, et al., 1989). This mechanism isconsistent with the conclusions that the source must beshallow and that no major resetting of lithospheric tempera-tures has occurred (Stein and Weissel, in press).
Stresses and BucklingIf the widespread folding of sediment and acoustic base-
ment is the result of lithospheric buckling, the stress requiredto produce the undulations can be estimated. Weissel et al.(1980) calculated that, to match the observed 160-km wave-length with an elastic rheology requires stresses of 2400 MPa(24 kb) and an apparent elastic thickness (12 km) much thinnerthan expected for the lithospheric age of the Central IndianBasin. Significantly lower stresses are required for otherrheologies. With a depth-dependent rheology, 600 MPa (6 kb
266

KINEMATICS AND MECHANICS
SEA FLOOR
-« THEORETICAL
UNLOADED BASEMENT
BASEMENT
SEA FLOOR
UNLOADED BASEMENT
-+ THEORETICAL
BASEMENT
KM
Figure 6. Depths of the seafloor, unloaded acoustic basement, and acoustic basement for the two seismic reflection profiles a and b shownin Figure 1. Profile b same as in Figure 2. Unloaded basement depths (calculated assuming Airy isostatic adjustment after "removing"sediment load) are on the average equal to or somewhat less than expected for lithospheric age (dotted line (Parsons and Sclater, 1977)).Profiles projected to 0°N.
OCEANIC "INTRAPLATE" EARTHQUAKES
20 40 60 80 100 120LITHOSPHERIC AGE (MA)
Figure 7. Focal depth vs. age for intraplate earthquakes. Those for theconventionally defined Indo-Australian Plate are shown as triangles.Larger triangles (reflecting greater uncertainty) indicate events stud-ied using only short-period seismograph records. Data from Stein andOkal (1978), Wiens and Stein (1983, 1984), Bergman et al. (1984),Bergman and Solomon (1984, 1985), Wiens (1986), and Stein andWeissel (in press).
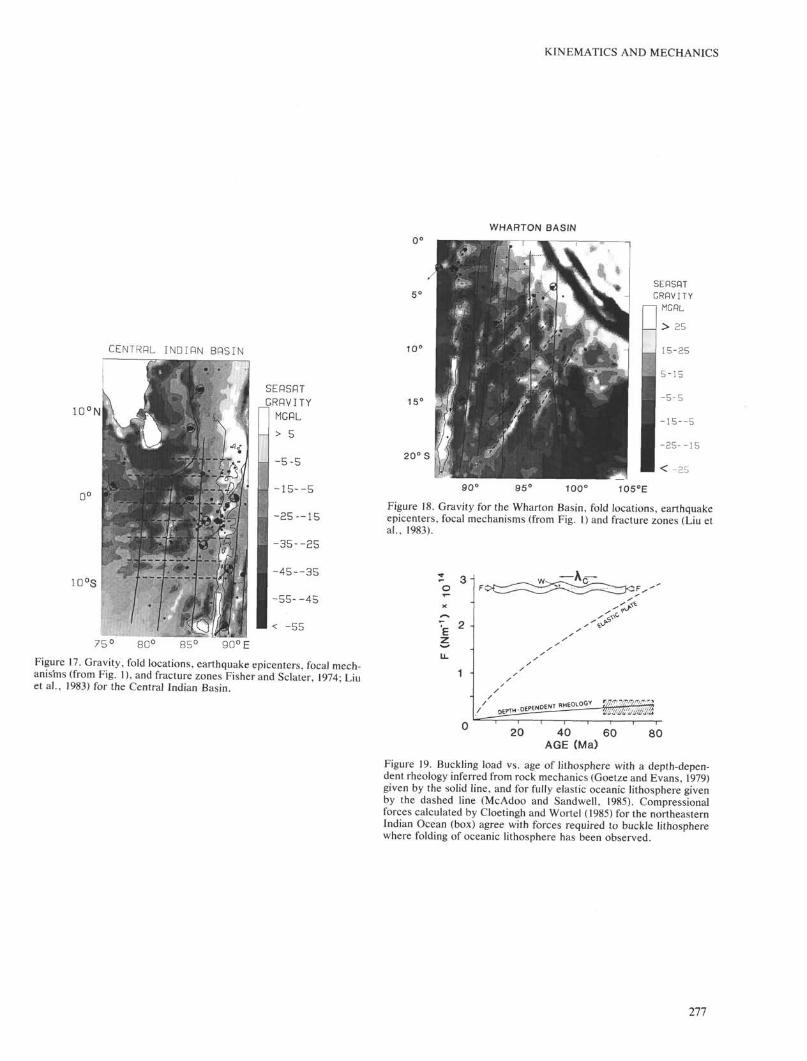
stresses) are required for buckling (McAdoo and Sandwell,1985); with a viscous rheology, several hundred MPa (sev-eral kb) are required (Zuber, 1987). Analysis of seismicrefraction data from the Central Indian Basin indicates thatthe crust beneath the fold highs may be —30% thickercompared to adjacent undeformed crust, suggesting that the
hydrodynamical flow model of Zuber (1987) may be a moreappropriate model of the folds than deformation by buckling(Leger, 1989). Stresses generated by plate driving forcesmay be able to generate stresses of these magnitudes toproduce folding.
Stresses and Plate Driving ForcesIf stresses resulting from plate driving forces cause the
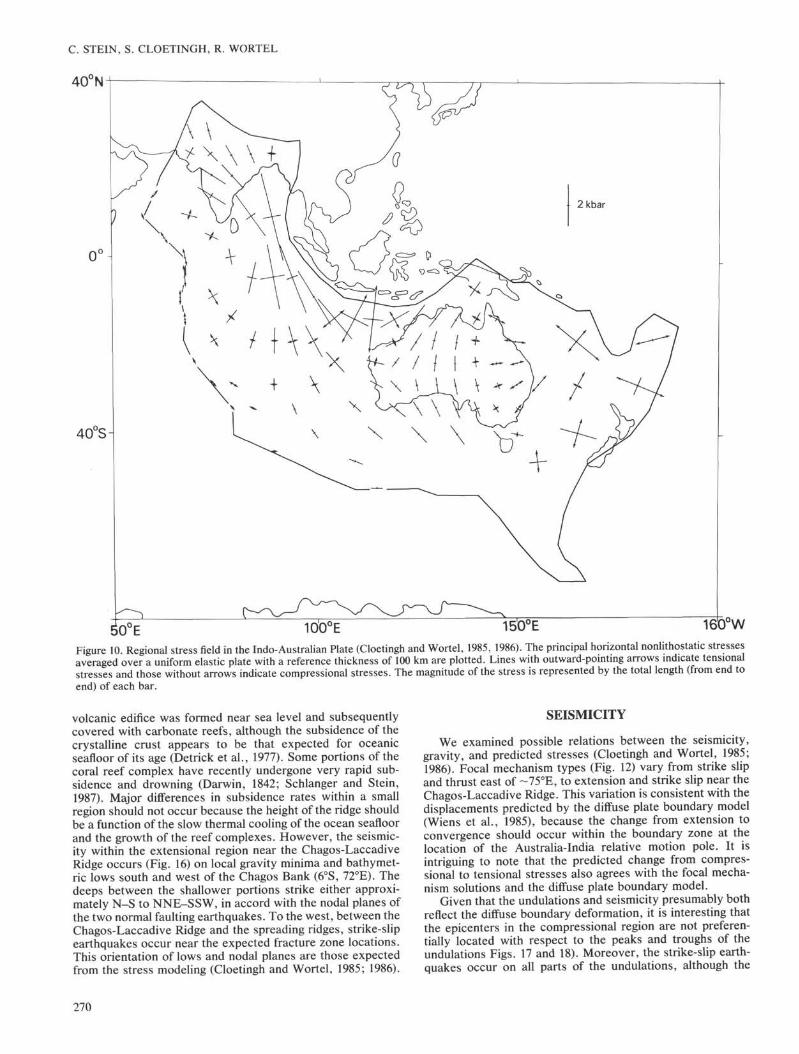
deformation in the Indian Ocean, driving force modelsshould be able to predict the distribution of stresses inferredfrom earthquake locations and mechanisms and the orienta-tion and location of fault and fold structures. Stresses for asingle Indo-Australian Plate have been predicted by finite-element modeling incorporating age-dependent slab pull andridge push forces and basal shear forces (Cloetingh andWortel, 1985; 1986). Figure 10 shows the calculated princi-pal horizontal nonlithostatic stresses averaged over a uni-form elastic plate with a reference thickness of 100 km. Theorientation of the stresses are consistent with those inferredfrom earthquake focal mechanism stadies Fig. 11). To moreclosely relate the calculated stresses with the magnitude ofdeformation we rescaled the stresses to lithosphere with anelastic thickness equal to the depth of the 750°C isothermFig. 12).
The stress orientations are compatible with the locations ofwell-formed grabens within the Sumatra Trench (Cloetinghand Wortel, 1986). Lateral variations in the component of theregional stress field perpendicular to the trench greatly influ-ence the style of trench tectonics (Wortel and Cloetingh,1985). Regional tension lowers the neutral plane in the bendingplate, and promotes the development of grabens, whereasregional compression results in the opposite. Well-developedgrabens within the trench are found only where the stresscomponent normal to the trench is tensional.
267
C. STEIN, S. CLOETINGH, R. WORTEL
BEFORE65-m.y. lithosphere
S 80 -
100 -
AFTER REHEATING
120 -
0
20
40
GO
80
100
120 -
i r i i i i
I I I 1 L
15 my.SINCE REHEA TING
l oo -
120 -200 400 600 800 1000 1200 I<OO
TEMPERATURE I'C)
300 •400 600 800 1000 1200 H00
TEMPERATURE C O£00 400 600 800 1000 1200 I<OO
TEMPERATURE C O
PRESENT TEMPERATURE AT 40 KM < 8 8 0 ° Cmaximum possible reheating depthluπction of time since reheating HEAT FLOW ANOMALY
1200
£ 1000
reheating event5 m.y.BP
34 - 42 kmshallowest possibledepth reheating
for SHALLOWEST POSSIBLE
REHEATING DEPTH
reheating depth30 k
RESULTSFROMREHEATINGMODEL
ao 40 eoreheating depth (km)
RANGE OF POSSIBLE REHEATING DEPTHS
VS TIME SINCE REHEATING
5 10 15time since reheating event (m.y.BP)
ELEVATION ANOMALY
I
B
SHALLOWEST POSSIBLE
REHEATING DEPTH
1500
5 0 0
for SHALLOWEST POSSIBLEREHEATING DEPTH
Reheating modelcan account forobserved highheat flow butpredicts largeelevationanomalies.
5 10 15time since reheating event (m.y.BP)
5 10 15
time since reheating event (m.y.BP)
Figure 8. A. Lithospheric basal reheating model. Excess heat flow is generated by reheating of thebottom part of the lithosphere. The temperature from the base of the lithosphere to a given depth isinstantaneously reset to the basal temperature while the temperature of upper portion of the plate isunchanged. The source of the disturbance is removed and the lithosphere cools by conduction. Thisis illustrated for 65-m.y.-old lithosphere reheated 15 m.y. BP, giving perturbed 80-m.y.-old lithosphereat present. B. Lithospheric basal reheating model. (Upper left) possible combinations of time sincereheating, reheating depth, and resulting temperature at 40 km depth. (Lower left) Shallowest possiblereheating depth with time, given that the present temperature at 40 km should not exceed 880°C. Thelonger the time since reheating, the shallower the reheating depth. An event at 1 Ma could havereheated the lithosphere to 42 km. An event at 15 Ma could have reheated the lithosphere to 34 km.(Upper right) The evolution of the surface heat flow anomaly with time since reheating is illustrated forvarious depths of reheating. The dotted curve illustrates the heat flow for the shallowest reheatingdepths consistent with the 880°C at 40-km constraint (lower left). Thus a sufficiently high heat-flowanomaly can be generated with reheating to about 34 km while satisfying the temperature constraint.(Lower right) the evolution of the bathymetric anomaly is shown with possible reheating times anddepths. The shallower the reheating depth, the greater the initial uplift. However, reheating depthssufficient to produce high heat flow yield present bathymetry almost 1 km shallower than observed,violating the bathymetric constraints.
268

KINEMATICS AND MECHANICS
ADDITIONAL HEAT FLOW FROMTEMPERATURE ANOMALY
ASSUMES CONDUCTIVE HEAT TRANSFER
M O D E LTemperature
SURFACEHEAT-FLOW ANOMALY
500°C\ - I 2 km
originalgeotherm
2 4 6Time Since Reheating (Ma)
Figure 9. Shallow thermal perturbation model. The temperature of a2-km section of lithosphere is raised instantaneously by 500°C. Thelithosphere then cools conductively. Surface heat-flow anomaly withtime since reheating is calculated for various reheating depths. Tomatch observed heat-flow anomaly, the source must be relativelyshallow and applied in the last few million years, presumably after 7Ma when deformation began in the Central Indian Basin.
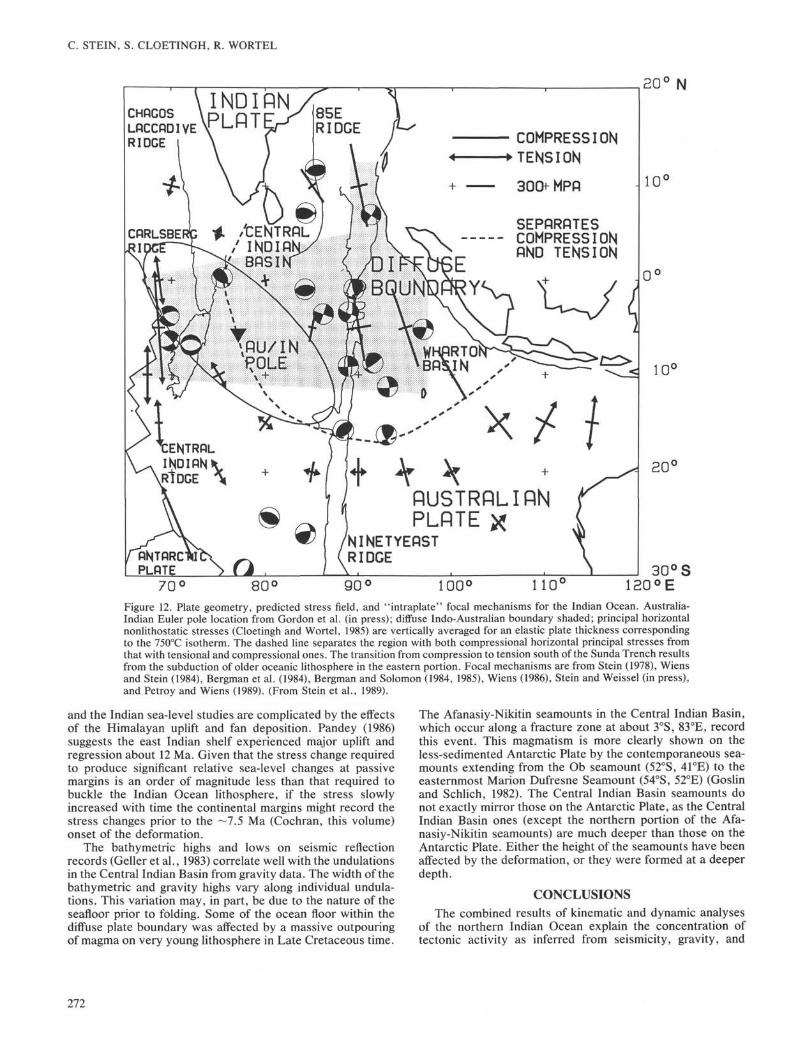
The orientation and magnitude of the calculated stressesare consistent with the present-day plate-motion model (Gor-don et al., in press). The smallest predicted stresses within thediffuse plate boundary region are near the pole of Indo/Australian relative motion (Fig. 12), where the seismicity is aminimum (Fig. 13). Within the portion of the diffuse plateboundary where the relative motions predict shortening, thestress model predicts compression, and folding and thrustfaulting are observed. Similarly, where the relative motionspredict extension, the stress model predicts tension, andnormal faulting is observed.
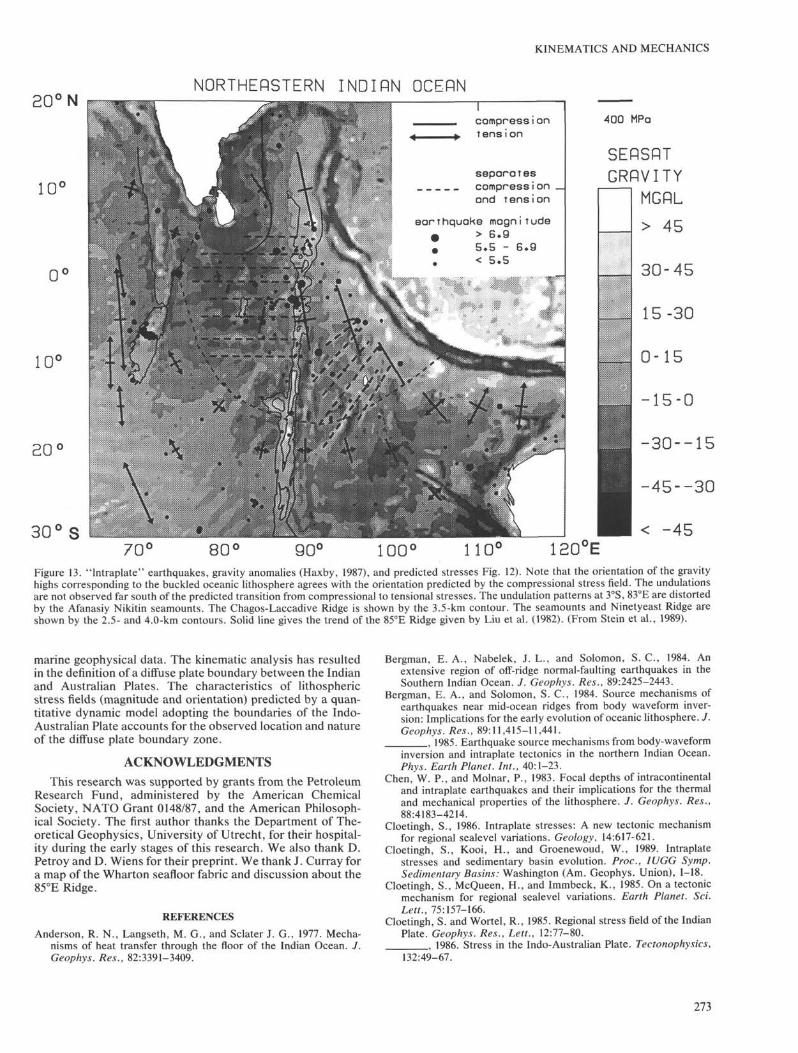
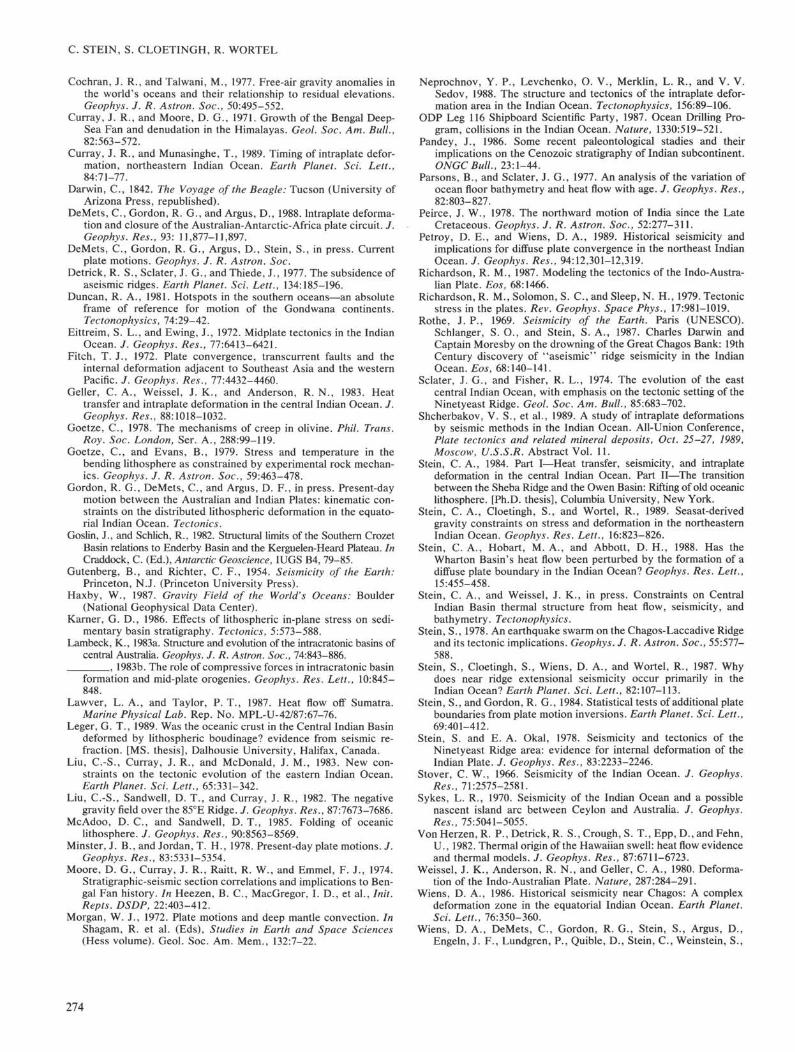
If the predicted compressional stresses are large enough toproduce buckling, several effects may be observable. Thelong-wavelength folds should be restricted to the regions ofpredicted compression and trend normal to the direction ofmaximum compression. Furthermore, the undulations extendonly slightly south of the predicted transition from compres-sion for both principal horizontal stresses to tension for one ofthe principal stresses. The locations of the basement undula-tions are shown by SEAS AT gravity anomaly (Fig. 13) andseismic reflection data (Weissel et al., 1980; McAdoo andSand well, 1985). The spatial distribution of the folding can bemapped using SEASAT gravity anomaly data (Haxby, 1987).Due to the thick sediments of the Bengal Fan, partiallydeposited after the initiation of deformation in the CentralIndian Ocean, the northern undulations cannot often beidentified using bathymetric data. In the Central Indian Basin,undulations trending east-west are best developed from about3°N to 10°S and 80°E to 85°E (Fig. 14), but continue to thewest and east into the Wharton Basin. Although the northern-most observed sediment deformation is just south of DSDPSite 118 (8°N, 86°E) (J. Curray, pers. comm., 1988), somedeformation may extend somewhat northward as seismicitycontinues to the north. In the Wharton Basin, NE-SW trend-ing undulations can be most clearly seen from 6°S to 18°S (Fig.15). North of 6°S they are difficult to distinguish from aban-doned spreading centers, fracture zones (Liu et al., 1983) andthe trench outer high. The locations and orientations of thebasement undulations are remarkably consistent with thepredicted stresses (Stein et al., 1989).
Folding in the Indian Ocean appears to result from theplate-wide stress distribution. On the local scale, pre-existingloads may affect the deflections (Lambeck, 1983a, 1983b)resulting from compressional stresses. Karner and Weissel(this volume) suggest that the Afanasiy Nikitin seamountshave affected the pattern of folding in the Central Indian Basinin such a manner and may be the reason why folds near theseseamounts are so prominent.
OTHER MORPHOLOGIC FEATURESExamination of the deformation reflected in the gravity
data (Haxby, 1987) has interesting implications for threeprominent features of the northeastern Indian Ocean: theNinety east, 85°E, and the southern Chagos-Laccadive Ridges.The morphology of the Ninetyeast Ridge changes from asmooth continuous ridge south of 7°-10°S to a series of enechelon ENE-WSW-trending highs north of 7°-10°S (Sclaterand Fisher, 1974). This difference is puzzling because theridge is thought to be a hot-spot track reflecting the rapidnorthward motion of India (Morgan, 1972; Peirce, 1978).Sclater and Fisher (1974) suggested that the change in ridgemorphology may reflect the separation of Australia and Ant-arctica. Stein and Okal (1978) noted that the irregular mor-phology is associated with the region of highest seismicity.
The gravity anomaly data (Fig. 14) shows that the highs onthe Ninetyeast Ridge are located at about the same latitudeand have a spacing similar to undulations to the west in theCentral Indian Basin (Stein et al., 1989). The bathymetric datashow that the depths between the highs and lows on theNinetyeast Ridge are sometimes equal or greater than 1 km,similar to the maximum fold amplitudes in the Central Indianand Wharton Basins. Stein et al. (1989) proposed that themorphology of the northern Ninetyeast Ridge is a continua-tion of the basement undulations from the west and hencereflects the recent deformation that has modified the originalsmooth morphology, presently preserved to the south. Com-parison with the stress model thus suggests that the ENE-WSW trend of the en echelon highs may reflect the predictedvariation in stress from north-south compression west of thenorthern Ninetyeast Ridge to NW-SE compression east of theRidge. Similarly, the smooth morphology occurs where themodel does not predict large compressional stresses. Petroyand Wiens (1989) also suggest that the morphology of thenorthern Ninetyeast Ridge reflects the recent lithosphericbuckling. Such models hence explain the correlation of seis-micity, gravity, and ridge morphology.
Using shipboard gravity and seismic reflection data, Liu et al.(1982) identified the buried 85°E Ridge that extends from ~18°N to~5°N and characterized by a free-air gravity low. Although theridge approximately parallels the Ninetyeast Ridge north of 5°N,Liu et al. interpreted its trend as diverging to the southwest from3°N to 5°N, and noted that this change precluded a hot-spot originunless the hot spot moved relative to that presumably forming theNinetyeast Ridge. At ~5°N, where Liu et al. (1982) show the trendof the 85°E Ridge changing to the southwest, the SEASAT gravitydata show a gravity low continuing to the south. Liu et al. (1982)had a gap in the shipboard gravity data for the region between~1°N-5°N and ~85°E-87°E. Hence, the 85°E Ridge may continueto the south and an undulation high at 3°N, south of Sri Lanka,previously interpreted as the southern portion of the 85°E Ridge,may instead reflect the recent deformation (Stein et al., 1989).
The maximum predicted tensional stresses are located(Fig. 13) near the southern portion of the Chagos LaccadiveRidge (Stein et al., 1987), an area associated with large normalfault earthquakes and rapid recent subsidence. The ridge wasproduced as the Indo-Australian Plate moved over a hot spot(Morgan, 1972; Duncan, 1981). Associated magmatic activityis located from the Deccan traps to Reunion Island. The
269
C. STEIN, S. CLOETINGH, R. WORTEL
40°N
40°SH
100°E 150°E 160üW
Figure 10 Regional stress field in the Indo-Australian Plate (Cloetingh and Wortel, 1985, 1986). The principal horizontal nonhthostatic stressesaveraged over a uniform elastic plate with a reference thickness of 100 km are plotted. Lines with outward-pointing arrows indicate tensionalstresses and those without arrows indicate compressional stresses. The magnitude of the stress is represented by the total length (from end toend) of each bar.
volcanic edifice was formed near sea level and subsequentlycovered with carbonate reefs, although the subsidence of thecrystalline crust appears to be that expected for oceanicseafloor of its age (Derrick et al., 1977). Some portions of thecoral reef complex have recently undergone very rapid sub-sidence and drowning (Darwin, 1842; Schlanger and Stein,1987). Major differences in subsidence rates within a smallregion should not occur because the height of the ridge shouldbe a function of the slow thermal cooling of the ocean seafloorand the growth of the reef complexes. However, the seismic-ity within the extensional region near the Chagos-LaccadiveRidge occurs (Fig. 16) on local gravity minima and bathymet-ric lows south and west of the Chagos Bank (6°S, 72°E). Thedeeps between the shallower portions strike either approxi-mately N-S to NNE-SSW, in accord with the nodal planes ofthe two normal faulting earthquakes. To the west, between theChagos-Laccadive Ridge and the spreading ridges, strike-slipearthquakes occur near the expected fracture zone locations.This orientation of lows and nodal planes are those expectedfrom the stress modeling (Cloetingh and Wortel, 1985; 1986).
SEISMICITY
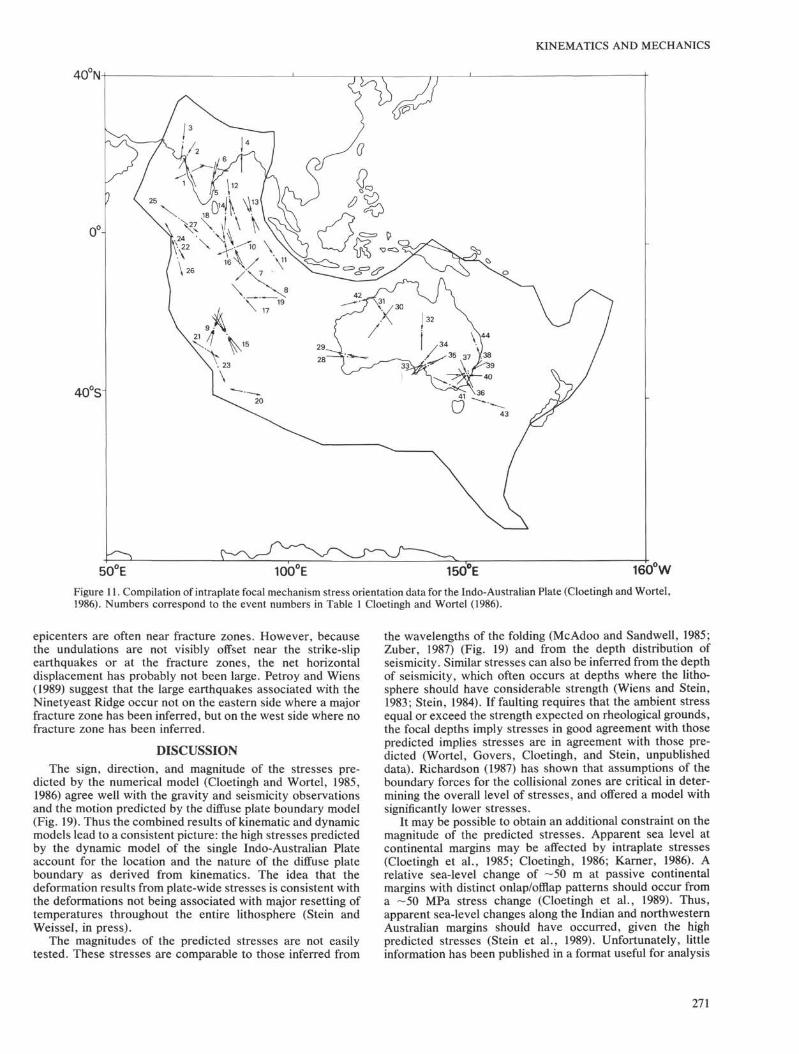
We examined possible relations between the seismicity,gravity, and predicted stresses (Cloetingh and Wortel, 1985;1986). Focal mechanism types (Fig. 12) vary from strike slipand thrust east of ~75°E, to extension and strike slip near theChagos-Laccadive Ridge. This variation is consistent with thedisplacements predicted by the diffuse plate boundary model(Wiens et al., 1985), because the change from extension toconvergence should occur within the boundary zone at thelocation of the Australia-India relative motion pole. It isintriguing to note that the predicted change from compres-sional to tensional stresses also agrees with the focal mecha-nism solutions and the diffuse plate boundary model.
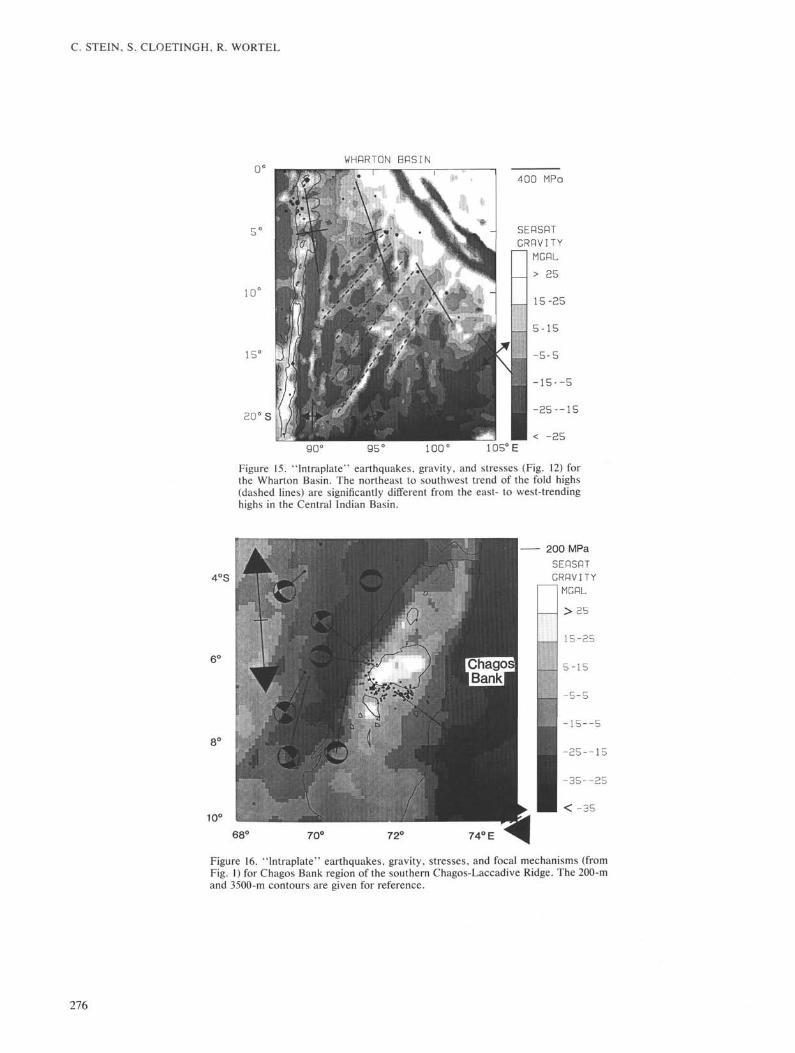
Given that the undulations and seismicity presumably bothreflect the diffuse boundary deformation, it is interesting thatthe epicenters in the compressional region are not preferen-tially located with respect to the peaks and troughs of theundulations Figs. 17 and 18). Moreover, the strike-slip earth-quakes occur on all parts of the undulations, although the
270
KINEMATICS AND MECHANICS
40°N
40uS
50°E 1OOUE 150°E 160 WFigure 11. Compilation of intraplate focal mechanism stress orientation data for the Indo-Australian Plate (Cloetingh and Wortel,1986). Numbers correspond to the event numbers in Table 1 Cloetingh and Wortel (1986).
epicenters are often near fracture zones. However, becausethe undulations are not visibly offset near the strike-slipearthquakes or at the fracture zones, the net horizontaldisplacement has probably not been large. Petroy and Wiens(1989) suggest that the large earthquakes associated with theNinety east Ridge occur not on the eastern side where a majorfracture zone has been inferred, but on the west side where nofracture zone has been inferred.
DISCUSSIONThe sign, direction, and magnitude of the stresses pre-
dicted by the numerical model (Cloetingh and Wortel, 1985,1986) agree well with the gravity and seismicity observationsand the motion predicted by the diffuse plate boundary model(Fig. 19). Thus the combined results of kinematic and dynamicmodels lead to a consistent picture: the high stresses predictedby the dynamic model of the single Indo-Australian Plateaccount for the location and the nature of the diffuse plateboundary as derived from kinematics. The idea that thedeformation results from plate-wide stresses is consistent withthe deformations not being associated with major resetting oftemperatures throughout the entire lithosphere (Stein andWeissel, in press).
The magnitudes of the predicted stresses are not easilytested. These stresses are comparable to those inferred from
the wavelengths of the folding (McAdoo and Sandwell, 1985;Zuber, 1987) (Fig. 19) and from the depth distribution ofseismicity. Similar stresses can also be inferred from the depthof seismicity, which often occurs at depths where the litho-sphere should have considerable strength (Wiens and Stein,1983; Stein, 1984). If faulting requires that the ambient stressequal or exceed the strength expected on Theological grounds,the focal depths imply stresses in good agreement with thosepredicted implies stresses are in agreement with those pre-dicted (Wortel, Govers, Cloetingh, and Stein, unpublisheddata). Richardson (1987) has shown that assumptions of theboundary forces for the collisional zones are critical in deter-mining the overall level of stresses, and offered a model withsignificantly lower stresses.
It may be possible to obtain an additional constraint on themagnitude of the predicted stresses. Apparent sea level atcontinental margins may be affected by intraplate stresses(Cloetingh et al., 1985; Cloetingh, 1986; Karner, 1986). Arelative sea-level change of —50 m at passive continentalmargins with distinct onlap/offlap patterns should occur froma -50 MPa stress change (Cloetingh et al., 1989). Thus,apparent sea-level changes along the Indian and northwesternAustralian margins should have occurred, given the highpredicted stresses (Stein et al., 1989). Unfortunately, littleinformation has been published in a format useful for analysis
271
C. STEIN, S. CLOETINGH, R. WORTEL
\πi π r r V
SEPRRRTESCOMPRESSIONRND TENSION
tENTRRLiNDIflBflSI
ENTROLNDIR
RIDGE
nUSTRRLIRNPLflTE X
NINETYERSTRIDGE
30° S120°E
Figure 12. Plate geometry, predicted stress field, and "intraplate" focal mechanisms for the Indian Ocean. Australia-Indian Euler pole location from Gordon et al. (in press); diffuse Indo-Australian boundary shaded; principal horizontalnonlithostatic stresses (Cloetingh and Wortel, 1985) are vertically averaged for an elastic plate thickness correspondingto the 750°C isotherm. The dashed line separates the region with both compressional horizontal principal stresses fromthat with tensional and compressional ones. The transition from compression to tension south of the Sunda Trench resultsfrom the subduction of older oceanic lithosphere in the eastern portion. Focal mechanisms are from Stein (1978), Wiensand Stein (1984), Bergman et al. (1984), Bergman and Solomon (1984, 1985), Wiens (1986), Stein and Weissel (in press),and Petroy and Wiens (1989). (From Stein et al., 1989).
and the Indian sea-level studies are complicated by the effectsof the Himalayan uplift and fan deposition. Pandey (1986)suggests the east Indian shelf experienced major uplift andregression about 12 Ma. Given that the stress change requiredto produce significant relative sea-level changes at passivemargins is an order of magnitude less than that required tobuckle the Indian Ocean lithosphere, if the stress slowlyincreased with time the continental margins might record thestress changes prior to the —7.5 Ma (Cochran, this volume)onset of the deformation.
The bathymetric highs and lows on seismic reflectionrecords (Geller et al., 1983) correlate well with the undulationsin the Central Indian Basin from gravity data. The width of thebathymetric and gravity highs vary along individual undula-tions. This variation may, in part, be due to the nature of theseafloor prior to folding. Some of the ocean floor within thediffuse plate boundary was affected by a massive outpouringof magma on very young lithosphere in Late Cretaceous time.
The Afanasiy-Nikitin seamounts in the Central Indian Basin,which occur along a fracture zone at about 3°S, 83°E, recordthis event. This magmatism is more clearly shown on theless-sedimented Antarctic Plate by the contemporaneous sea-mounts extending from the Ob seamount (52°S, 41°E) to theeasternmost Marion Dufresne Seamount (54°S, 52°E) (Goslinand Schlich, 1982). The Central Indian Basin seamounts donot exactly mirror those on the Antarctic Plate, as the CentralIndian Basin ones (except the northern portion of the Afa-nasiy-Nikitin seamounts) are much deeper than those on theAntarctic Plate. Either the height of the seamounts have beenaffected by the deformation, or they were formed at a deeperdepth.
CONCLUSIONS
The combined results of kinematic and dynamic analysesof the northern Indian Ocean explain the concentration oftectonic activity as inferred from seismicity, gravity, and
272
20° NNORTHEΠSTERN INDIΠN OCEPN
0
20
30° S
eαrthquoke magnitude
KINEMATICS AND MECHANICS
400 MPa
SEPSPT
GRnVITY* MGPL
45
100' 110' 120°EFigure 13. "lntraplate" earthquakes, gravity anomalies (Haxby, 1987), and predicted stresses Fig. 12). Note that the orientation of the gravityhighs corresponding to the buckled oceanic lithosphere agrees with the orientation predicted by the compressional stress field. The undulationsare not observed far south of the predicted transition from compressional to tensional stresses. The undulation patterns at 3CS, 83°E are distortedby the Afanasiy Nikitin seamounts. The Chagos-Laccadive Ridge is shown by the 3.5-km contour. The seamounts and Ninetyeast Ridge areshown by the 2.5- and 4.0-km contours. Solid line gives the trend of the 85°E Ridge given by Liu et al. (1982). (From Stein et al., 1989).
marine geophysical data. The kinematic analysis has resultedin the definition of a diffuse plate boundary between the Indianand Australian Plates. The characteristics of lithosphericstress fields (magnitude and orientation) predicted by a quan-titative dynamic model adopting the boundaries of the Indo-Australian Plate accounts for the observed location and natureof the diffuse plate boundary zone.
ACKNOWLEDGMENTS
This research was supported by grants from the PetroleumResearch Fund, administered by the American ChemicalSociety, NATO Grant 0148/87, and the American Philosoph-ical Society. The first author thanks the Department of The-oretical Geophysics, University of Utrecht, for their hospital-ity during the early stages of this research. We also thank D.Petroy and D. Wiens for their preprint. We thank J. Curray fora map of the Wharton seafloor fabric and discussion about the85°E Ridge.
REFERENCES
Anderson, R. N., Langseth, M. G., and Sclater J. G., 1977. Mecha-nisms of heat transfer through the floor of the Indian Ocean. J.Geophys. Res., 82:3391-3409.
Bergman, E. A., Nabelek, J. L., and Solomon, S. C , 1984. Anextensive region of off-ridge normal-faulting earthquakes in theSouthern Indian Ocean. J. Geophys. Res., 89:2425-2443.
Bergman, E. A., and Solomon, S. C , 1984. Source mechanisms ofearthquakes near mid-ocean ridges from body waveform inver-sion: Implications for the early evolution of oceanic lithosphere. J.Geophys. Res., 89:11,415-11,441.
, 1985. Earthquake source mechanisms from body-waveforminversion and intraplate tectonics in the northern Indian Ocean.Phys. Earth Planet. Int., 40:1-23.
Chen, W. P., and Molnar, P., 1983. Focal depths of intracontinentaland intraplate earthquakes and their implications for the thermaland mechanical properties of the lithosphere. J. Geophys. Res.,88:4183-4214.
Cloetingh, S., 1986. Intraplate stresses: A new tectonic mechanismfor regional sealevel variations. Geology, 14:617-621.
Cloetingh, S., Kooi, H., and Groenewoud, W., 1989. Intraplatestresses and sedimentary basin evolution. Proc, IUGG Symp.Sedimentary Basins: Washington (Am. Geophys. Union), 1-18.
Cloetingh, S., McQueen, H., and Immbeck, K., 1985. On a tectonicmechanism for regional sealevel variations. Earth Planet. Sci.Lett., 75:157-166.
Cloetingh, S. and Wortel, R., 1985. Regional stress field of the IndianPlate. Geophys. Res., Lett., 12:77-80.
, 1986. Stress in the Indo-Australian Plate. Tectonophysics,132:49-67.
273
C. STEIN, S. CLOETINGH, R. WORTEL
Cochran, J. R., and Talwani, M., 1977. Free-air gravity anomalies inthe worlcTs oceans and their relationship to residual elevations.Geophys. J. R. Astron. Soc, 50:495-552.
Curray, J. R., and Moore, D. G., 1971. Growth of the Bengal Deep-Sea Fan and denudation in the Himalayas. Geol. Soc. Am. Bull.,82:563-572.
Curray, J. R., and Munasinghe, T., 1989. Timing of intraplate defor-mation, northeastern Indian Ocean. Earth Planet. Sci. Lett.,84:71-77.
Darwin, C , 1842. The Voyage of the Beagle: Tucson (University ofArizona Press, republished).
DeMets, C , Gordon, R. G., and Argus, D., 1988. Intraplate deforma-tion and closure of the Australian-Antarctic-Africa plate circuit. J.Geophys. Res., 93: 11,877-11,897.
DeMets, C , Gordon, R. G., Argus, D., Stein, S., in press. Currentplate motions. Geophys. J. R. Astron. Soc.
Detrick, R. S., Sclater, J. G., and Thiede, J., 1977. The subsidence ofaseismic ridges. Earth Planet. Sci. Lett., 134:185-196.
Duncan, R. A., 1981. Hotspots in the southern oceans—an absoluteframe of reference for motion of the Gondwana continents.Tectonophysics, 74:29-42.
Eittreim, S. L., and Ewing, J., 1972. Midplate tectonics in the IndianOcean. J. Geophys. Res., 77:6413-6421.
Fitch, T. J., 1972. Plate convergence, transcurrent faults and theinternal deformation adjacent to Southeast Asia and the westernPacific. J. Geophys. Res., 77:4432-4460.
Geller, C. A., Weissel, J. K., and Anderson, R. N., 1983. Heattransfer and intraplate deformation in the central Indian Ocean. J.Geophys. Res., 88:1018-1032.
Goetze, C , 1978. The mechanisms of creep in olivine. Phil. Trans.Roy. Soc. London, Ser. A., 288:99-119.
Goetze, C , and Evans, B., 1979. Stress and temperature in thebending lithosphere as constrained by experimental rock mechan-ics. Geophys. J. R. Astron. Soc, 59:463-478.
Gordon, R. G., DeMets, C , and Argus, D. F., in press. Present-daymotion between the Australian and Indian Plates: kinematic con-straints on the distributed lithospheric deformation in the equato-rial Indian Ocean. Tectonics.
Goslin, J., and Schlich, R., 1982. Structural limits of the Southern CrozetBasin relations to Enderby Basin and the Kerguelen-Heard Plateau. InCraddock, C. (Ed.), Antarctic Geoscience, IUGS B4, 79-85.
Gutenberg, B., and Richter, C. F., 1954. Seismicity of the Earth:Princeton, N.J. (Princeton University Press).
Haxby, W., 1987. Gravity Field of the World's Oceans: Boulder(National Geophysical Data Center).
Karner, G. D., 1986. Effects of lithospheric in-plane stress on sedi-mentary basin stratigraphy. Tectonics, 5:573-588.
Lambeck, K., 1983a. Structure and evolution of the intracratonic basins ofcentral Australia. Geophys. J. R. Astron. Soc, 74:843-886.
, 1983b. The role of compressive forces in intracratonic basinformation and mid-plate orogenies. Geophys. Res. Lett., 10:845-848.
Lawver, L. A., and Taylor, P. T., 1987. Heat flow off Sumatra.Marine Physical Lab. Rep. No. MPL-U-42/87:67-76.
Leger, G. T., 1989. Was the oceanic crust in the Central Indian Basindeformed by lithospheric boudinage? evidence from seismic re-fraction. [MS. thesis], Dalhousie University, Halifax, Canada.
Liu, C.-S., Curray, J. R., and McDonald, J. M., 1983. New con-straints on the tectonic evolution of the eastern Indian Ocean.Earth Planet. Sci. Lett., 65:331-342.
Liu, C.-S., Sandwell, D. T., and Curray, J. R., 1982. The negativegravity field over the 85°E Ridge. J. Geophys. Res., 87:7673-7686.
McAdoo, D. C , and Sandwell, D. T., 1985. Folding of oceaniclithosphere. J. Geophys. Res., 90:8563-8569.
Minster, J. B., and Jordan, T. H., 1978. Present-day plate motions. J.Geophys. Res., 83:5331-5354.
Moore, D. G., Curray, J. R., Raitt, R. W., and Emmel, F. J., 1974.Stratigraphic-seismic section correlations and implications to Ben-gal Fan history. In Heezen, B. C , MacGregor, I. D., et al., Init.Repts. DSDP, 22:403-412.
Morgan, W. J., 1972. Plate motions and deep mantle convection. InShagam, R. et al. (Eds), Studies in Earth and Space Sciences(Hess volume). Geol. Soc. Am. Mem., 132:7-22.
Neprochnov, Y. P., Levchenko, O. V., Merklin, L. R., and V. V.Sedov, 1988. The structure and tectonics of the intraplate defor-mation area in the Indian Ocean. Tectonophysics, 156:89-106.
ODP Leg 116 Shipboard Scientific Party, 1987. Ocean Drilling Pro-gram, collisions in the Indian Ocean. Nature, 1330:519-521.
Pandey, J., 1986. Some recent paleontological stadies and theirimplications on the Cenozoic stratigraphy of Indian subcontinent.ONGCBulL, 23:1-44.
Parsons, B., and Sclater, J. G., 1977. An analysis of the variation ofocean floor bathymetry and heat flow with age. J. Geophys. Res.,82:803-827.
Peirce, J. W., 1978. The northward motion of India since the LateCretaceous. Geophys. J. R. Astron. Soc, 52:277-311.
Petroy, D. E., and Wiens, D. A., 1989. Historical seismicity andimplications for diffuse plate convergence in the northeast IndianOcean. J. Geophys. Res., 94:12,301-12,319.
Richardson, R. M., 1987. Modeling the tectonics of the Indo-Austra-lian Plate. Eos, 68:1466.
Richardson, R. M., Solomon, S. C , and Sleep, N. H., 1979. Tectonicstress in the plates. Rev. Geophys. Space Phys., 17:981-1019.
Rothe, J. P., 1969. Seismicity of the Earth. Paris (UNESCO).Schlanger, S. O., and Stein, S. A., 1987. Charles Darwin andCaptain Moresby on the drowning of the Great Chagos Bank: 19thCentury discovery of "aseismic" ridge seismicity in the IndianOcean. Eos, 68:140-141.
Sclater, J. G., and Fisher, R. L., 1974. The evolution of the eastcentral Indian Ocean, with emphasis on the tectonic setting of theNinetyeast Ridge. Geol. Soc. Am. Bull., 85:683-702.
Shcherbakov, V. S., et al., 1989. A study of intraplate deformationsby seismic methods in the Indian Ocean. Ail-Union Conference,Plate tectonics and related mineral deposits, Oct. 25-27, 1989,Moscow, U.S.S.R. Abstract Vol. 11.
Stein, C. A., 1984. Part I—Heat transfer, seismicity, and intraplatedeformation in the central Indian Ocean. Part II—The transitionbetween the Sheba Ridge and the Owen Basin: Rifting of old oceaniclithosphere. [Ph.D. thesis], Columbia University, New York.
Stein, C. A., Cloetingh, S., and Wortel, R., 1989. Seasat-derivedgravity constraints on stress and deformation in the northeasternIndian Ocean. Geophys. Res. Lett., 16:823-826.
Stein, C. A., Hobart, M. A., and Abbott, D. H., 1988. Has theWharton Basin's heat flow been perturbed by the formation of adiffuse plate boundary in the Indian Ocean? Geophys. Res. Lett.,15:455-458.
Stein, C. A., and Weissel, J. K., in press. Constraints on CentralIndian Basin thermal structure from heat flow, seismicity, andbathymetry. Tectonophysics.
Stein, S., 1978. An earthquake swarm on the Chagos-Laccadive Ridgeand its tectonic implications. Geophys. J. R. Astron. Soc, 55:577-588.
Stein, S., Cloetingh, S., Wiens, D. A., and Wortel, R., 1987. Whydoes near ridge extensional seismicity occur primarily in theIndian Ocean? Earth Planet. Sci. Lett., 82:107-113.
Stein, S., and Gordon, R. G., 1984. Statistical tests of additional plateboundaries from plate motion inversions. Earth Planet. Sci. Lett.,69:401-412.
Stein, S. and E. A. Okal, 1978. Seismicity and tectonics of theNinetyeast Ridge area: evidence for internal deformation of theIndian Plate. / . Geophys. Res., 83:2233-2246.
Stover, C. W., 1966. Seismicity of the Indian Ocean. J. Geophys.Res., 71:2575-2581.
Sykes, L. R., 1970. Seismicity of the Indian Ocean and a possiblenascent island arc between Ceylon and Australia. J. Geophys.Res., 75:5041-5055.
Von Herzen, R. P., Detrick, R. S., Crough, S. T., Epp, D., and Fehn,U., 1982. Thermal origin of the Hawaiian swell: heat flow evidenceand thermal models. J. Geophys. Res., 87:6711-6723.
Weissel, J. K., Anderson, R. N., and Geller, C. A., 1980. Deforma-tion of the Indo-Australian Plate. Nature, 287:284-291.
Wiens, D. A., 1986. Historical seismicity near Chagos: A complexdeformation zone in the equatorial Indian Ocean. Earth Planet.Sci. Lett., 76:350-360.
Wiens, D. A., DeMets, C , Gordon, R. G., Stein, S., Argus, D.,Engeln, J. F., Lundgren, P., Quible, D., Stein, C , Weinstein, S.,
274

KINEMATICS AND MECHANICS
and Woods, D. F., 1985. A diffuse plate boundary model forIndian Ocean tectonics. Geophys. Res. Lett., 12:429-432.
Wiens, D. A., and Stein, S., 1983. Age dependence of oceanicintraplate seismicity and implications for lithospheric evolution. J.Geophys. Res., 88:6455-6668.
, 1984. Intraplate seismicity and stresses in young oceaniclithosphere. /. Geophys. Res., 89:11,442-11,464.
Wiens, D., Stein, S., DeMets, C , Gordon, R., and Stein, C , 1986.Plate tectonic models for Indian Ocean "intraplate" deformation.Tectonophysics, 132: 37-48.
Wilson, J. T., 1965. A new class of faults and their bearing oncontinental drift. Nature, 207:343-347.
Wortel, M.J.R., and Cloetingh, S.A.P.L., 1985. Accretion and lateralvariations in tectonic structure along the Peru-Chile trench. Tec-tonophysics, 112:443-462.
Zuber, M. T., 1987. Compression of oceanic lithosphere: An analysisof intraplate deformation in the central Indian Basin. J. Geophys.Res., 92:4817-4825.
Date of initial receipt: 11 May 1989Date of acceptance: 6 February 1990Ms 116B-153
CENITRRL INDIPN BPSIN
10°N
400 MPα
I SERSRT
GRAVITY
MGFIL
U > 5
I < -5575° 80° 85° 90°E
10°S
Figure 14. "Intraplate" earthquakes, gravity, and stresses (Fig. 12) forthe Central Indian Basin and Ninetyeast Ridge. The highs on theNinetyeast Ridge appear to be a continuation of the pattern from theCentral Indian Basin to the west. Fracture zone trends from Sclaterand Fisher (1974) and Liu et al. (1983). (From Stein et al., 1989).
275
C. STEIN, S. CLOETINGH, R. WORTEL
WHRRTON BPSIN
10
20°S -25--15
< -2595 100' 105°E
4°S
Figure 15. "lntraplate" earthquakes, gravity, and stresses (Fig. 12) forthe Wharton Basin. The northeast to southwest trend of the fold highs(dashed lines) are significantly different from the east- to west-trendinghighs in the Central Indian Basin.
200 MPa
SEPSfiTGRAVITYMGRL
10°
Figure 16. "lntraplate" earthquakes, gravity, stresses, and focal mechanisms (fromFig. 1) for Chagos Bank region of the southern Chagos-Laccadive Ridge. The 200-mand 3500-m contours are given for reference.
276
KINEMATICS AND MECHANICS
WHARTON BASIN
CENTRAL INDIflN BRSIN
10°N
SERSRTGRRVITY
MGRL
> 5
10°S
Figure 17. Gravity, fold locations, earthquake epicenters, focal mech-anisms (from Fig. 1), and fracture zones Fisher and Sclater, 1974- Liuet al., 1983) for the Central Indian Basin.
10c
15'
20° S i
100c 105°E
Figure 18. Gravity for the Wharton Basin, fold locations, earthquakeepicenters, focal mechanisms (from Fig. 1) and fracture zones (Liu etal., 1983).
2 -
1 -
π 1 1 1 1 1 ru 20 40 60 80
AGE (Ma)
Figure 19. Buckling load vs. age of lithosphere with a depth-depen-dent rheology inferred from rock mechanics (Goetze and Evans, 1979)given by the solid line, and for fully elastic oceanic lithosphere givenby the dashed line (McAdoo and Sandwell, 1985). Compressionalforces calculated by Cloetingh and Wortel (1985) for the northeasternIndian Ocean (box) agree with forces required to buckle lithospherewhere folding of oceanic lithosphere has been observed.
277