22 september 2014 sunway berhad outperform research - here comes... · sunway berhad outperform ......
TRANSCRIPT
Quick Bites
22 September 2014
PP7004/02/2013(031762) Page 1 of 8
Sunway Berhad OUTPERFORM ↔ Price: RM3.36 Here Comes the Double Dividends! Target Price: RM3.87 ↑
By Sarah Lim l [email protected]; Adrian Ng l [email protected]
News � Last Friday, Sunway Berhad (SUNWAY) proposed to list its construction division that is currently held under its indirectly wholly-owned subsidiary, Sunway Construction Sdn Bhd (SUNCON), on the Main Market of Bursa Malaysia Securities.
Comments
� We were surprised by the announcement, as we did not expect SUNWAY to relist its construction unit shortly within three years since the merger between Sunway Holdings and Sunway City back in 2011, which was aimed at creating synergies between the two entities and minimizing RPTs. The key difference in the new structure is that there are no overlaps in property and construction businesses between both entities, as seen in the past, which puts to rest investors’ concerns of conflicts of interests.
� Nonetheless, we are still positive with the proposed listing of SUNCON due to the following reasons; (i) synergies between SUNWAY and SUNCON would be maintained and management had reiterated that SUNWAY’s property division margins would not be affected given that SUNCON are still required to go through competitive bidding process for internal building jobs, (ii) an exercise to reward SUNWAY shareholders through dividend-in-specie of SUNCON shares based on entitlement ratio of 1 SUNCON shares for every 10 SUNWAY shares held, coupled with a special cash dividend from the proceeds of the listing of SUNCON shares which is expected to be completed by 2Q15.
� Our SoP values SUNCON’s market capitalisation at RM1.2b or RM0.89 per share based on 15x FY15 PER and SUNWAY would be able to raise a proceeds ranging from RM331.1m to RM357.6m depending on the conversion of warrants and ESOS. Based on our assumptions, we expect each Sunway shareholder to get 1 share in SUNCON for every 10 SUNWAY shares held worth RM0.89/share and cash dividend ranging from of 12.75 sen to 16.60 sen. (refer overleaf for more details.) (iii) un-locking of value in its construction division whilst benefiting Sunway Bhd through less holding company discounts which would enhance its property valuations.
Outlook � While the property market remains fairly quiet, we believe that SUNWAY is on track to meet its sales target of RM1.8b for FY14 given that recent launches, like Sunway Geo Residence 2 and Citrine, has received encouraging bookings rate of 70% and 100%, respectively. Based on channel checks, we gather that 40%-50% of its Sunway Geo Residence 2 bookings had been converted into sales.
� Its property unbilled sales remains fairly strong at RM2.4b with remaining external orderbook of RM1.9b that easily provides another 1-1.5 years visibility.
Forecast � No changes to our FY14-15E estimate at this juncture.
Rating Maintain OUTPERFORM Valuation � We are raising our Target Price for SUNWAY from RM3.70
to RM3.87 as we roll forward our SoP driven valuation base to FY15E from FY14E (refer overleaf for more details.)
� We also reiterate our OUTPERFORM call on SUNWAY for its ability to deliver healthy sales despite the multiple cooling measures undertaken to cool off the property market.
Risks to Our Call
� Unable to meet sales targets or replenish landbank. Sector risks, including additional negative policies.
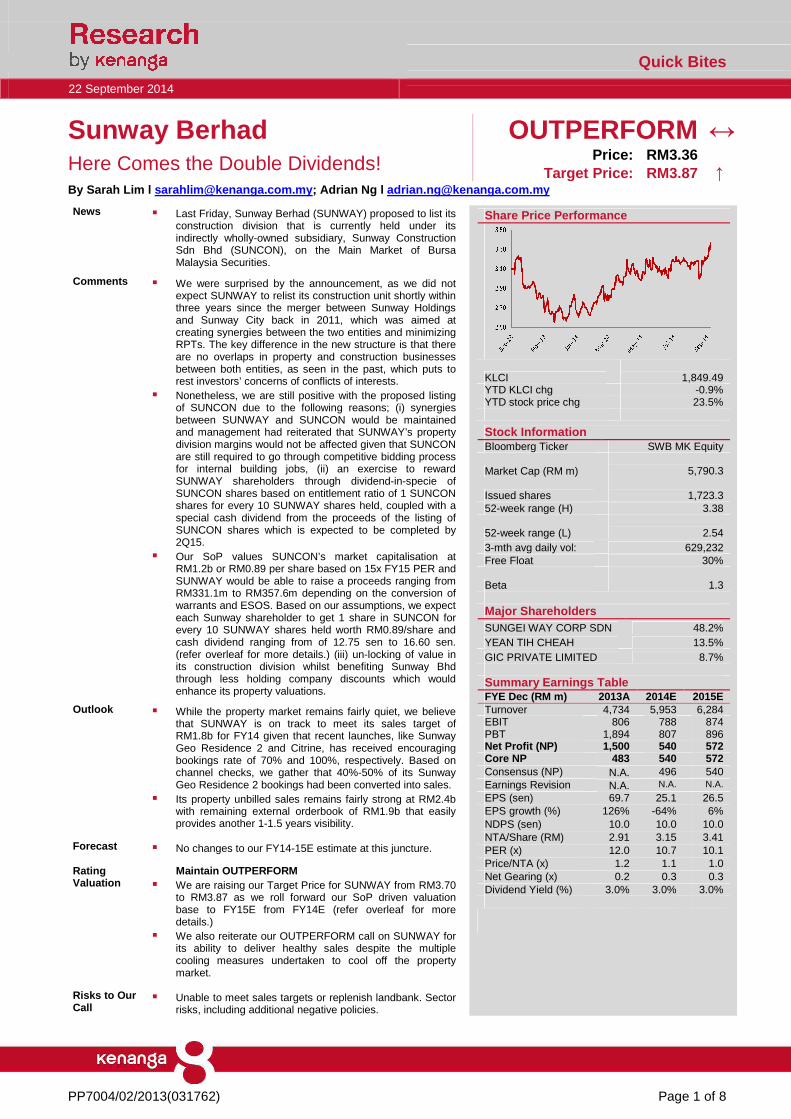
Share Price Performance
KLCI
1,849.49 YTD KLCI chg -0.9% YTD stock price chg 23.5%
Stock Information Bloomberg Ticker SWB MK Equity
Market Cap (RM m)
5,790.3
Issued shares
1,723.3 52-week range (H) 3.38
52-week range (L)
2.54 3-mth avg daily vol: 629,232 Free Float 30%
Beta
1.3
Major Shareholders SUNGEI WAY CORP SDN 48.2% YEAN TIH CHEAH 13.5% GIC PRIVATE LIMITED 8.7%
Summary Earnings Table
FYE Dec (RM m) 2013A 2014E 2015E Turnover 4,734 5,953 6,284 EBIT 806 788 874 PBT 1,894 807 896 Net Profit (NP) 1,500 540 572 Core NP 483 540 572 Consensus (NP) N.A. 496 540 Earnings Revision N.A. N.A. N.A.
EPS (sen) 69.7 25.1 26.5 EPS growth (%) 126% -64% 6% NDPS (sen) 10.0 10.0 10.0 NTA/Share (RM) 2.91 3.15 3.41 PER (x) 12.0 10.7 10.1 Price/NTA (x) 1.2 1.1 1.0 Net Gearing (x) 0.2 0.3 0.3 Dividend Yield (%) 3.0% 3.0% 3.0%
Sunway Berhad Quick Bites 22 September 2014
PP7004/02/2013(031762) Page 2 of 8
OTHER POINTS
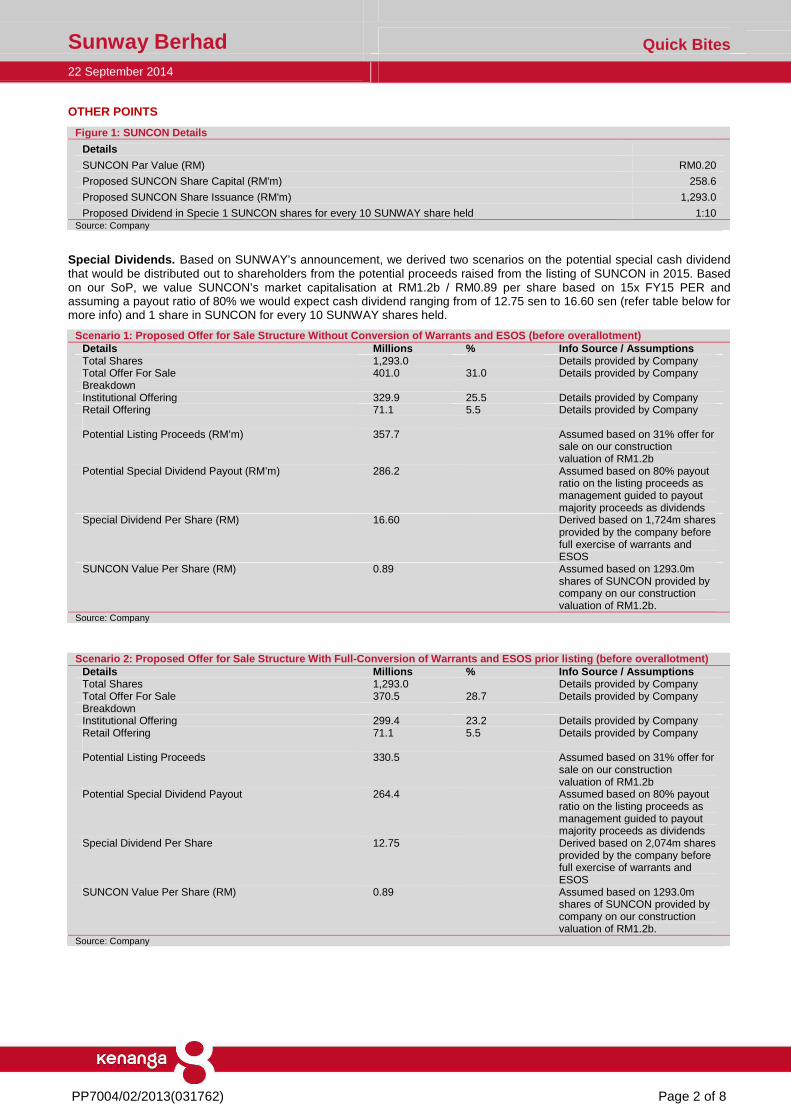
Figure 1: SUNCON Details
Details
SUNCON Par Value (RM) RM0.20
Proposed SUNCON Share Capital (RM'm) 258.6
Proposed SUNCON Share Issuance (RM'm) 1,293.0
Proposed Dividend in Specie 1 SUNCON shares for every 10 SUNWAY share held 1:10 Source: Company
Special Dividends. Based on SUNWAY’s announcement, we derived two scenarios on the potential special cash dividend that would be distributed out to shareholders from the potential proceeds raised from the listing of SUNCON in 2015. Based on our SoP, we value SUNCON’s market capitalisation at RM1.2b / RM0.89 per share based on 15x FY15 PER and assuming a payout ratio of 80% we would expect cash dividend ranging from of 12.75 sen to 16.60 sen (refer table below for more info) and 1 share in SUNCON for every 10 SUNWAY shares held.
Scenario 1: Proposed Offer for Sale Structure Witho ut Conversion of Warrants and ESOS (before overallo tment) Details Millions % Info Source / Assumptions Total Shares 1,293.0 Details provided by Company Total Offer For Sale 401.0 31.0 Details provided by Company Breakdown Institutional Offering 329.9 25.5 Details provided by Company Retail Offering 71.1 5.5 Details provided by Company Potential Listing Proceeds (RM’m) 357.7 Assumed based on 31% offer for
sale on our construction valuation of RM1.2b
Potential Special Dividend Payout (RM’m) 286.2 Assumed based on 80% payout ratio on the listing proceeds as management guided to payout majority proceeds as dividends
Special Dividend Per Share (RM) 16.60 Derived based on 1,724m shares provided by the company before full exercise of warrants and ESOS
SUNCON Value Per Share (RM) 0.89 Assumed based on 1293.0m shares of SUNCON provided by company on our construction valuation of RM1.2b.
Source: Company
Scenario 2: Proposed Offer for Sale Structure With Full-Conversion of Warrants and ESOS prior listing (before overallotment) Details Millions % Info Source / Assumptions Total Shares 1,293.0 Details provided by Company Total Offer For Sale 370.5 28.7 Details provided by Company Breakdown Institutional Offering 299.4 23.2 Details provided by Company Retail Offering 71.1 5.5 Details provided by Company Potential Listing Proceeds 330.5 Assumed based on 31% offer for
sale on our construction valuation of RM1.2b
Potential Special Dividend Payout 264.4 Assumed based on 80% payout ratio on the listing proceeds as management guided to payout majority proceeds as dividends
Special Dividend Per Share 12.75 Derived based on 2,074m shares provided by the company before full exercise of warrants and ESOS
SUNCON Value Per Share (RM) 0.89 Assumed based on 1293.0m shares of SUNCON provided by company on our construction valuation of RM1.2b.
Source: Company
Sunway Berhad Quick Bites 22 September 2014
PP7004/02/2013(031762) Page 3 of 8
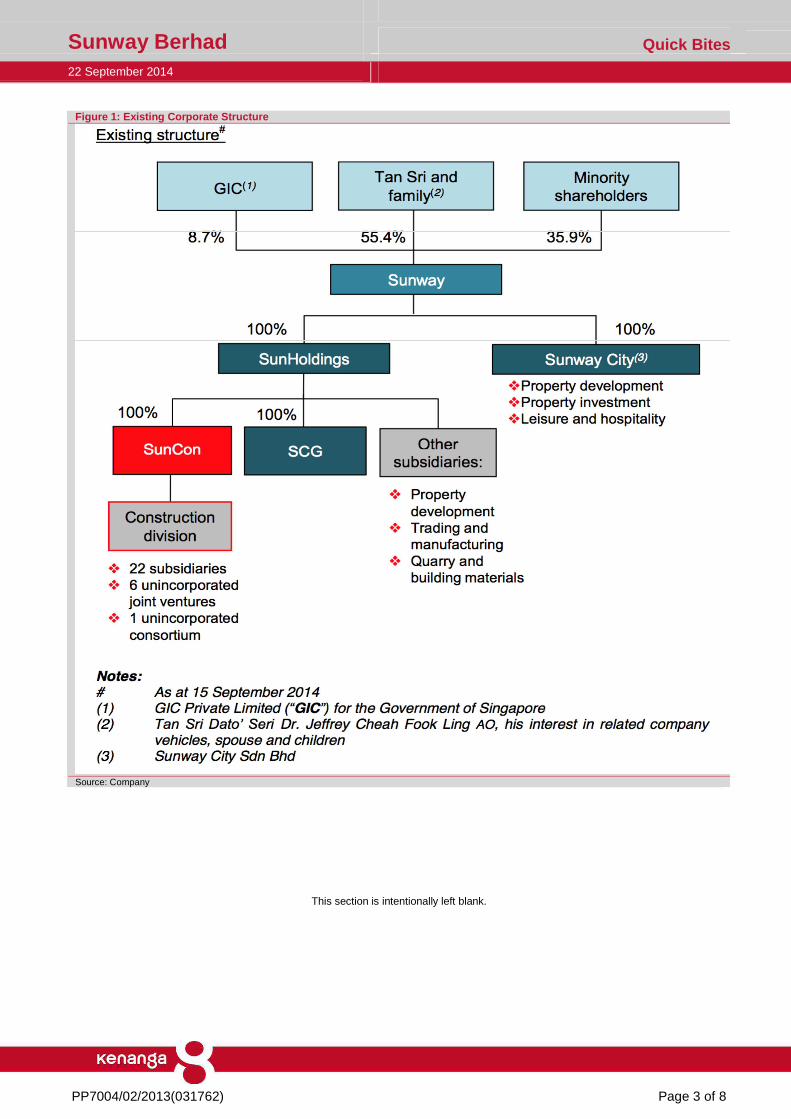
Figure 1: Existing Corporate Structure
Source: Company
This section is intentionally left blank.
Sunway Berhad Quick Bites 22 September 2014
PP7004/02/2013(031762) Page 4 of 8
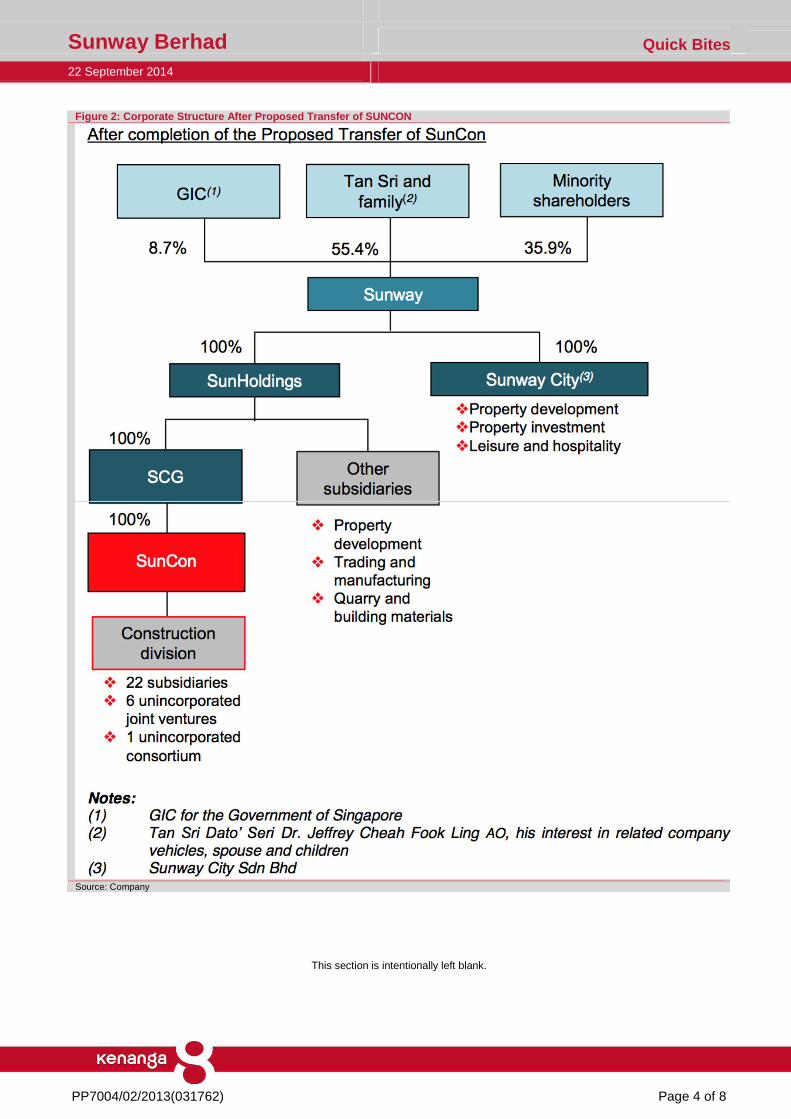
Figure 2: Corporate Structure After Proposed Transf er of SUNCON
Source: Company
This section is intentionally left blank.
Sunway Berhad Quick Bites 22 September 2014
PP7004/02/2013(031762) Page 5 of 8
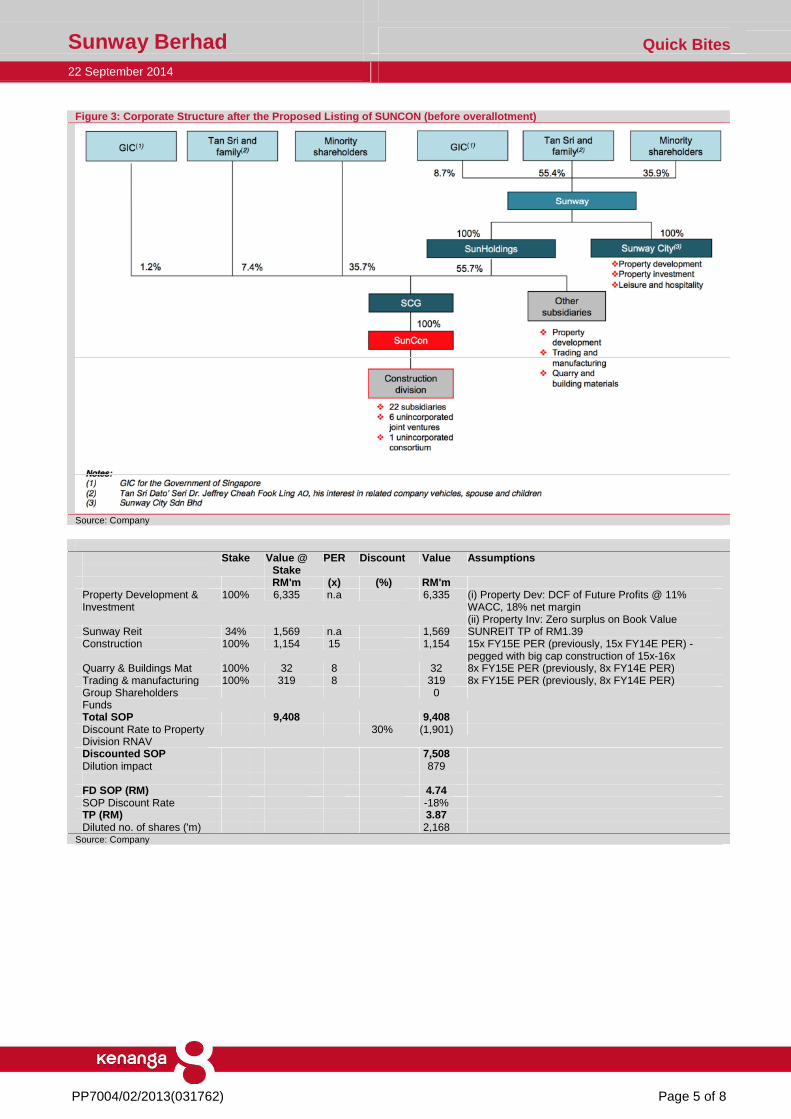
Figure 3: Corporate Structure after the Proposed Li sting of SUNCON (before overallotment)
Source: Company
Stake Value @ Stake
PER Discount Value Assumptions
RM'm (x) (%) RM'm Property Development & Investment
100% 6,335 n.a 6,335 (i) Property Dev: DCF of Future Profits @ 11% WACC, 18% net margin (ii) Property Inv: Zero surplus on Book Value
Sunway Reit 34% 1,569 n.a 1,569 SUNREIT TP of RM1.39 Construction 100% 1,154 15 1,154 15x FY15E PER (previously, 15x FY14E PER) -
pegged with big cap construction of 15x-16x Quarry & Buildings Mat 100% 32 8 32 8x FY15E PER (previously, 8x FY14E PER) Trading & manufacturing 100% 319 8 319 8x FY15E PER (previously, 8x FY14E PER) Group Shareholders Funds
0
Total SOP 9,408 9,408 Discount Rate to Property Division RNAV
30% (1,901)
Discounted SOP 7,508 Dilution impact 879 FD SOP (RM) 4.74 SOP Discount Rate -18% TP (RM) 3.87 Diluted no. of shares ('m) 2,168
Source: Company
Sunway Berhad Quick Bites 22 September 2014
PP7004/02/2013(031762) Page 6 of 8
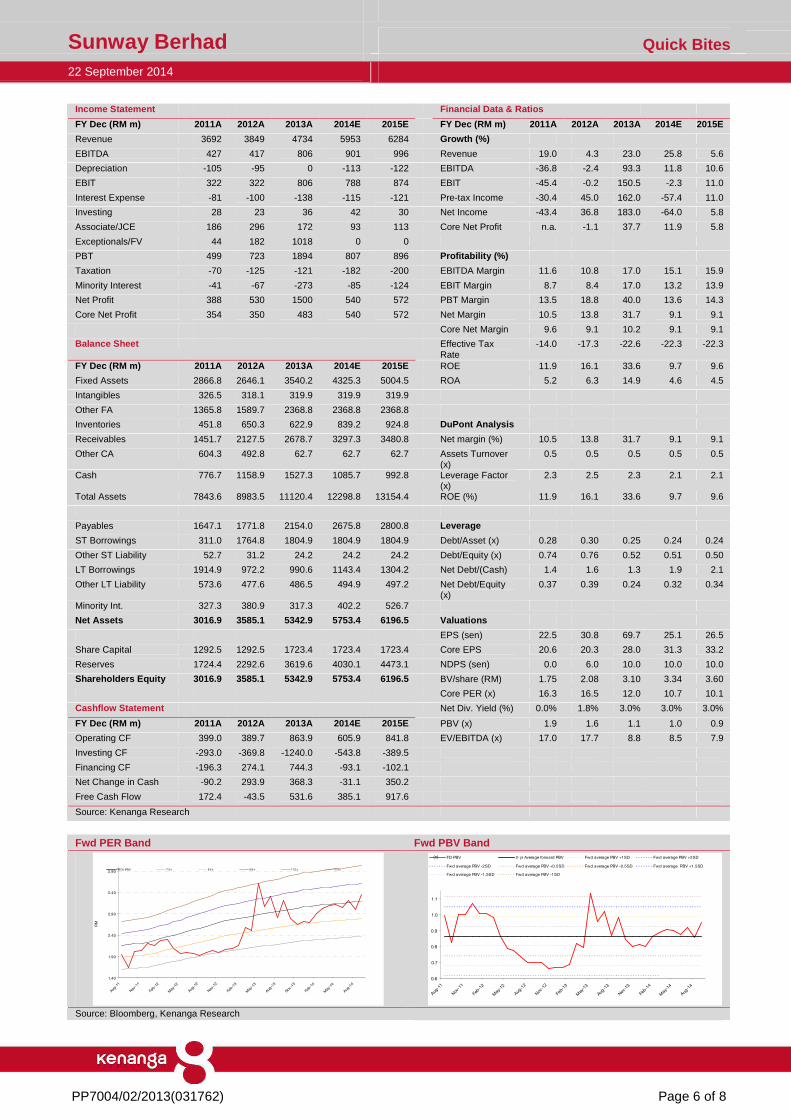
Income Statement Financial Data & Ratios
FY Dec (RM m) 2011A 2012A 2013A 2014E 2015E FY Dec (RM m) 2011A 2012A 2013A 2014E 2015E
Revenue 3692 3849 4734 5953 6284 Growth (%)
EBITDA 427 417 806 901 996 Revenue 19.0 4.3 23.0 25.8 5.6
Depreciation -105 -95 0 -113 -122 EBITDA -36.8 -2.4 93.3 11.8 10.6
EBIT 322 322 806 788 874 EBIT -45.4 -0.2 150.5 -2.3 11.0
Interest Expense -81 -100 -138 -115 -121 Pre-tax Income -30.4 45.0 162.0 -57.4 11.0
Investing 28 23 36 42 30 Net Income -43.4 36.8 183.0 -64.0 5.8
Associate/JCE 186 296 172 93 113 Core Net Profit n.a. -1.1 37.7 11.9 5.8
Exceptionals/FV 44 182 1018 0 0
PBT 499 723 1894 807 896 Profitability (%)
Taxation -70 -125 -121 -182 -200 EBITDA Margin 11.6 10.8 17.0 15.1 15.9
Minority Interest -41 -67 -273 -85 -124 EBIT Margin 8.7 8.4 17.0 13.2 13.9
Net Profit 388 530 1500 540 572 PBT Margin 13.5 18.8 40.0 13.6 14.3
Core Net Profit 354 350 483 540 572 Net Margin 10.5 13.8 31.7 9.1 9.1
Core Net Margin 9.6 9.1 10.2 9.1 9.1
Balance Sheet Effective Tax Rate
-14.0 -17.3 -22.6 -22.3 -22.3
FY Dec (RM m) 2011A 2012A 2013A 2014E 2015E ROE 11.9 16.1 33.6 9.7 9.6
Fixed Assets 2866.8 2646.1 3540.2 4325.3 5004.5 ROA 5.2 6.3 14.9 4.6 4.5
Intangibles 326.5 318.1 319.9 319.9 319.9
Other FA 1365.8 1589.7 2368.8 2368.8 2368.8
Inventories 451.8 650.3 622.9 839.2 924.8 DuPont Analysis
Receivables 1451.7 2127.5 2678.7 3297.3 3480.8 Net margin (%) 10.5 13.8 31.7 9.1 9.1
Other CA 604.3 492.8 62.7 62.7 62.7 Assets Turnover (x)
0.5 0.5 0.5 0.5 0.5
Cash 776.7 1158.9 1527.3 1085.7 992.8 Leverage Factor (x)
2.3 2.5 2.3 2.1 2.1
Total Assets 7843.6 8983.5 11120.4 12298.8 13154.4 ROE (%) 11.9 16.1 33.6 9.7 9.6
Payables 1647.1 1771.8 2154.0 2675.8 2800.8 Leverage
ST Borrowings 311.0 1764.8 1804.9 1804.9 1804.9 Debt/Asset (x) 0.28 0.30 0.25 0.24 0.24
Other ST Liability 52.7 31.2 24.2 24.2 24.2 Debt/Equity (x) 0.74 0.76 0.52 0.51 0.50
LT Borrowings 1914.9 972.2 990.6 1143.4 1304.2 Net Debt/(Cash) 1.4 1.6 1.3 1.9 2.1
Other LT Liability 573.6 477.6 486.5 494.9 497.2 Net Debt/Equity (x)
0.37 0.39 0.24 0.32 0.34
Minority Int. 327.3 380.9 317.3 402.2 526.7
Net Assets 3016.9 3585.1 5342.9 5753.4 6196.5 Valuations
EPS (sen) 22.5 30.8 69.7 25.1 26.5
Share Capital 1292.5 1292.5 1723.4 1723.4 1723.4 Core EPS 20.6 20.3 28.0 31.3 33.2
Reserves 1724.4 2292.6 3619.6 4030.1 4473.1 NDPS (sen) 0.0 6.0 10.0 10.0 10.0
Shareholders Equity 3016.9 3585.1 5342.9 5753.4 6196.5 BV/share (RM) 1.75 2.08 3.10 3.34 3.60
Core PER (x) 16.3 16.5 12.0 10.7 10.1
Cashflow Statement Net Div. Yield (%) 0.0% 1.8% 3.0% 3.0% 3.0%
FY Dec (RM m) 2011A 2012A 2013A 2014E 2015E PBV (x) 1.9 1.6 1.1 1.0 0.9
Operating CF 399.0 389.7 863.9 605.9 841.8 EV/EBITDA (x) 17.0 17.7 8.8 8.5 7.9
Investing CF -293.0 -369.8 -1240.0 -543.8 -389.5
Financing CF -196.3 274.1 744.3 -93.1 -102.1
Net Change in Cash -90.2 293.9 368.3 -31.1 350.2
Free Cash Flow 172.4 -43.5 531.6 385.1 917.6
Source: Kenanga Research
Fwd PER Band Fwd PBV Band
1.40
1.90
2.40
2.90
3.40
3.90
Aug
-11
Nov
-11
Feb-1
2
May
-12
Aug
-12
Nov
-12
Feb-1
3
May
-13
Aug
-13
Nov
-13
Feb-1
4
May
-14
Aug
-14
RM
PRICE (RM) 7.3 x 8.5 x 9.8 x 11.0 x 12.3 x
(x)
0.6
0.7
0.8
0.9
1.0
1.1
Aug
-11
Nov
-11
Feb-1
2
May
-12
Aug
-12
Nov
-12
Feb-1
3
May
-13
Aug-1
3
Nov
-13
Feb-1
4
May
-14
Aug-1
4
FD PBV 2-yr Average forward PBV Fwd average PBV +1SD Fwd average PBV +2SD
Fwd average PBV -2SD Fwd average PBV +0.5SD Fwd average PBV -0.5SD Fwd average PBV +1.5SD
Fwd average PBV -1.5SD Fwd average PBV -1SD
Source: Bloomberg, Kenanga Research

Sunway Berhad Quick Bites 22 September 2014
PP7004/02/2013(031762) Page 7 of 8
Peer Comparison Price
(19/9/14) Mkt Cap
PER (x) Est. NDiv. Yld.
Historical ROE
P/BV Net Profit (RMm) FY13/14 NP Growth
FY14/15 NP
Growth
Target Price
Rating NAME
(RM) (RMm) FY13/14 FY14/15 FY15/16 (%) (%) (x) FY13/14 FY14/15 FY15/16 (%) (%) (RM)
DEVELOPERS UNDER COVERAGE
UEM Sunrise* 1.87 8,485 18.5 16.0 21.8 2.1% 10.2% 1.3 459.1 528.8 389.9 15.2% -26.3% 2.05 MARKET PERFORM IOI Properties* 2.73 8843 18.5 15.4 14.5 2.9% 4.3% 0.8 479.2 573.0 611.0 19.6% 6.6% 2.80 OUTPERFORM SP Setia* 3.27 8,300 19.2 24.7 15.9 3.1% 8.7% 1.3 417.9 325.3 504.6 -22.2% 55.1% 3.30 MARKET PERFORM Sunway Berhad 3.36 5790 12.0 10.7 10.1 2.3% 33.6% 1.0 482.7 540.0 572.2 11.9% 6.0% 3.87 OUTPERFORM IJM Land* 3.23 5,035 15.0 13.7 12.6 1.9% 17.7% 1.4 335.2 368.0 400.2 9.8% 8.7% 3.55 ACCEPT OFFER Mah Sing Group 2.42 3,571 12.2 10.2 8.9 3.9% 17.6% 1.6 280.6 334.6 385.5 19.2% 15.2% 3.05 OUTPERFORM UOA Development* 2.09 2,991 8.1 10.0 8.3 6.7% 16.0% 1.1 344.6 280.8 336.2 -18.5% 19.7% 2.00 MARKET PERFORM Tropicana 1.36 1,863 10.4 6.5 7.3 3.1% 15.3% 0.5 145.3 233.1 207.3 60.4% -11.1% 1.40 MARKET PERFORM Matrix Concepts 3.25 1,484 9.6 8.8 7.7 5.1% 29.8% 2.3 152.9 167.2 190.2 9.4% 13.8% 3.48 OUTPERFORM Crescendo* 2.81 639 7.6 7.6 6.9 5.4% 18.4% 0.8 84.2 84.4 93.2 0.3% 10.5% 3.15 OUTPERFORM Hua Yang 2.40 634 7.7 6.2 5.6 5.5% 22.8% 1.4 82.2 102.9 113.7 25.2% 10.5% 2.60 OUTPERFORM * Core NP and Core PER
** Crescendo per share data is based on non-Fully Diluted
CONSENSUS NUMBERS BERJAYA LAND BHD 0.85 4,230 41.9 N.A. N.A. N.A. 1.9% 0.8 101.0 N.A. N.A. N.A. N.A. 0.93 NEUTRAL IGB CORPORATION BHD 2.88 3,845 17.5 16.9 16.0 2.3% 5.3% 0.9 220.3 226.9 240.3 3.0% 5.9% 3.14 NEUTRAL YNH PROPERTY BHD 2.08 851 18.1 12.6 11.6 2.3% 5.7% 1.0 47.1 67.5 73.7 43.5% 9.1% 2.22 NEUTRAL YTL LAND & DEVELOPMENT BHD 0.96 792 36.3 N.A. 39.8 N.A. 3.2% 0.8 21.8 N.A. 19.9 N.A. N.A. N.A. BUY GLOMAC BHD 1.15 836 7.7 7.1 6.3 4.4% 12.9% 0.9 108.4 117.7 133.0 8.7% 13.0% 1.23 BUY KSL HOLDINGS BHD 4.67 1,805 9.1 6.0 7.0 3.4% 14.9% 1.3 198.1 301.4 258.9 52.1% -14.1% N.A. BUY PARAMOUNT CORP BHD 1.57 663 8.6 9.2 9.2 5.7% 9.1% 0.8 77.0 71.8 71.8 -6.8% 0.0% 1.76 BUY IVORY PROPERTIES GROUP BHD 0.59 263 11.0 N.A. N.A. N.A. 1.5% 0.7 23.9 N.A. N.A. N.A. N.A. N.A. BUY TAMBUN INDAH LAND BHD 2.46 1,012 10.2 10.3 8.5 3.9% 30.3% 2.9 99.2 97.9 118.4 -1.3% 21.0% 2.78 BUY Source: Kenanga Research
Sunway Berhad Quick Bites 22 September 2014
PP7004/02/2013(031762) Page 8 of 8
Stock Ratings are defined as follows: Stock Recommendations OUTPERFORM : A particular stock’s Expected Total Return is MORE than 10% (an approximation to the 5-year annualised Total Return of FBMKLCI of 10.2%). MARKET PERFORM : A particular stock’s Expected Total Return is WITHIN the range of 3% to 10%. UNDERPERFORM : A particular stock’s Expected Total Return is LESS than 3% (an approximation to the 12-month Fixed Deposit Rate of 3.15% as a proxy to Risk-Free Rate). Sector Recommendations*** OVERWEIGHT : A particular sector’s Expected Total Return is MORE than 10% (an approximation to the 5-year annualised Total Return of FBMKLCI of 10.2%). NEUTRAL : A particular sector’s Expected Total Return is WITHIN the range of 3% to 10%. UNDERWEIGHT : A particular sector’s Expected Total Return is LESS than 3% (an approximation tothe
12-month Fixed Deposit Rate of 3.15% as a proxy to Risk-Free Rate). ***Sector recommendations are defined based on market capitalisation weighted average expected total return for stocks under our coverage.
This document has been prepared for general circulation based on information obtained from sources believed to be reliable but we do not make any representations as to its accuracy or completeness. Any recommendation contained in this document does not have regard to the specific investment objectives, financial situation and the particular needs of any specific person who may read this document. This document is for the information of addressees only and is not to be taken in substitution for the exercise of judgement by addressees. Kenanga Investment Bank Berhad accepts no liability whatsoever for any direct or consequential loss arising from any use of this document or any solicitations of an offer to buy or sell any securities. Kenanga Investment Bank Berhad and its associates, their directors, and/or employees may have positions in, and may effect transactions in securities mentioned herein from time to time in the open market or otherwise, and may receive brokerage fees or act as principal or agent in dealings with respect to these companies.
Published and printed by: KENANGA INVESTMENT BANK BERHAD (15678-H) 8th Floor, Kenanga International, Jalan Sultan Ismail, 50250 Kuala Lumpur, Malaysia Chan Ken Yew Telephone: (603) 2166 6822 Facsimile: (603) 2166 6823 Website: www.kenanga.com.my Head of Research