221 december 2015 2 identifying beliefs underlying pre ... · 1 221 december 2015 2 identifying...
TRANSCRIPT

1
22 December 2015 1
Identifying beliefs underlying pre-drivers’ intentions to take risks: 2
An application of the Theory of Planned Behaviour 3
4
Richard Rowe1, Elizabeth Andrews
2, Peter R. Harris
3, Christopher J Armitage
4, Frank P. 5
McKenna5 and Paul Norman
1 6
1Department of Psychology, University of Sheffield, UK 7
2Bradford Institute for Health Research, UK 8
3School of Psychology, University of Sussex, UK 9
4Manchester Centre for Health Psychology, School of Psychological Sciences, Manchester 10
Academic Health Science Centre, University of Manchester, UK 11
5University of Reading, UK 12
13
Address correspondence to: Dr Richard Rowe, Department of Psychology, University of 14
Sheffield, Western Bank, Sheffield, S10 2TN. Tel: (+44) (0)114 22 26606. Fax: (+44) 15
(0)114 22 26515. Email: [email protected] 16
17

2
Abstract 18
Novice motorists are at high crash risk during the first few months of driving. Risky 19
behaviours such as speeding and driving while distracted are well-documented contributors to 20
crash risk during this period. To reduce this public health burden, effective road safety 21
interventions need to target the pre-driving period. We use the Theory of Planned Behaviour 22
(TPB) to identify the pre-driver beliefs underlying intentions to drive over the speed limit 23
(N=77), and while over the legal alcohol limit (N=72), talking on a hand-held mobile phone 24
(N=77) and feeling very tired (N=68). The TPB explained between 41% and 69% of the 25
variance in intentions to perform these behaviours. Attitudes were strong predictors of 26
intentions for all behaviours. Subjective norms and perceived behavioural control were 27
significant, though weaker, independent predictors of speeding and mobile phone use. 28
Behavioural beliefs underlying these attitudes could be separated into those reflecting 29
perceived disadvantages (e.g., speeding increases my risk of crash) and advantages (e.g., 30
speeding gives me a thrill). Interventions that can make these beliefs safer in pre-drivers may 31
reduce crash risk once independent driving has begun. 32
33
3
Introduction 34
Road traffic crashes are a serious challenge to public health. On UK roads there were 1754 35
fatalities and 23039 serious injuries during 2012 (Department for Transport, 2013). Novice 36
drivers are over-represented in crash statistics, with particular vulnerability during the first 37
few months of driving (McCartt, Mayhew, Braitman, Ferguson, & Simpson, 2009). While 38
skill deficits are likely to contribute to this crash risk among young drivers, propensity to take 39
risks and violate safe driving laws and conventions also make strong contributions (Blows, 40
Ameratunga, Ivers, Lo, & Norton, 2005; Rowe, Roman, McKenna, Barker, & Poulter, 2015). 41
Road traffic violations are more strongly correlated with crash involvement in younger than 42
older drivers (de Winter & Dodou, 2010). 43
The concept of violations includes a number of separate, though correlated, risky 44
behaviours (e.g., Reason, Manstead, Stradling, Baxter, & Campbell, 1990). Evidence shows 45
that speeding is a risk factor for crash involvement (Aarts & van Schagen, 2006). Desire to 46
drive faster than is safe for road conditions is a component of many other violations including 47
tailgating, crossing red lights and dangerous overtaking. Other well documented risk factors 48
include driving under the influence of alcohol (Fell & Voas, 2014), while using a mobile 49
phone (Ferdinand & Menachemi, 2014) and while sleepy (Garbarino, Nobili, Beelke, De 50
Carli, & Ferrillo, 2001). Young drivers are particularly likely to engage in violations (Reason 51
et al., 1990). Their sleep is more commonly disturbed (Lyznick, Doege, Davis, & Williams, 52
1998) and their driving may be more vulnerable to sleep disruption (Groeger, 2006). 53
A recent study applied growth curve modelling to violation data repeatedly measured 54
over the first three years of driving (Roman, Poulter, Barker, McKenna, & Rowe, 2015). This 55
study identified three latent classes of driver who followed trajectories of consistently high, 56
medium or low levels of violations across the study period. This suggests that the key 57

4
determinants of risky driving behaviour develop very early in driving or are in place before 58
driving starts. 59
A number of sources of evidence highlight that the attitudes underlying violating 60
behaviour develop during pre-driving. Pre-driving is defined here as the period before 61
independent driving on public roads. In the UK pre-drivers include people without a driving 62
licence and provisional licence holders who can only drive on public roads for the purposes 63
of training, under the supervision of a fully licensed driver. Waylen and McKenna (2008) 64
showed that correlates of risky attitudes among 11-16 year old pre-drivers were similar to 65
those in independent drivers in that they were riskier in males than females and were related 66
to social deviance and sensation seeking. Longitudinal studies show pre-driving attitudes 67
predict post-licence behaviour. Mann and Sullman (2008) found pre-driving speeding 68
intentions predicted violation behaviours (r=.28) when the sample was driving independently 69
12 months later. Rowe, Maughan, Gregory and Eley (2013) reported that violations were 70
predicted by attitudes to speeding in learners (r=.33) and non-drivers (r=.13) measured three 71
years earlier. 72
Effective pre-driving interventions are required to reduce the elevated crash rates 73
observed in the first few months of driving. This may offer the opportunity to influence 74
driving behaviours before they become automated (Harre, Brandt, & Dawe, 2000). A further 75
advantage is that intervention participation can be mandatory in the licencing process. 76
Current evidence indicates that: (a) attitudes to speeding become riskier during the transition 77
from pre-driver to full driver, a tendency that interventions must counter; and (b) attitudes to 78
other violations (e.g., using the horn to indicate displeasure) are safer in independent drivers 79
than pre-drivers, a trend that interventions must enhance (Helman, Kinnear, McKenna, 80
Allsop, & Horswill, 2013; Rowe, Andrews, & Harris, 2013; Rowe, Maughan, et al., 2013). 81

5
Many interventions using different forms of delivery and targeting various attitudes 82
and behaviours have been applied to pre-drivers with little evidence of efficacy. The literature 83
contains reports of interventions with little or no effect or that had unintended negative 84
consequences (Glendon, McNally, Jarvis, Chalmers, & Salisbury, 2014; Poulter & McKenna, 85
2010; Roberts & Kwan, 2006). This problem is not peculiar to pre-drivers; interventions for 86
drivers are also often ineffective (Ker et al., 2003). Road safety interventions are often based 87
on presenters’ intuitions rather than psychological theory, although theory-based 88
interventions are likely to be more effective than atheoretical ones (Michie, Rothman, & 89
Sheeran, 2007). A recent meta-analysis of internet-based interventions across a range of 90
health behaviours (Webb, Joseph, Yardley, & Michie, 2010) found that those based on the 91
Theory of Planned Behaviour (TPB; Ajzen, 1991) showed larger effects than interventions 92
based on other theories and those without theoretical foundation. 93
The TPB has often been employed to understand the psychological antecedents of 94
health related behaviours to inform intervention design (Ajzen, 2013). For example, a recent 95
meta-analysis reported that the TPB accounted for 44% of the variance in intentions and 19% 96
of behavioural variance across 237 prospective empirical tests (McEachan, Conner, Taylor, & 97
Lawton, 2011). The TPB proposes that intention is the most proximal determinant of 98
behaviour and that intentions are themselves based upon (1) attitudes (positive/negative 99
evaluations of the behaviour), (2) subjective norms (perceived social pressure regarding the 100
behaviour) and (3) perceived behavioural control (perceived ease/difficulty of controlling the 101
behaviour). Each of these components is posited to summarise sets of salient beliefs. 102
Underlying attitudes are behavioural beliefs about likely behavioural consequences; for 103
example believing that speeding means quicker journeys might be one of a set of behavioural 104
beliefs underlying a positive attitude towards speeding. Similarly, sets of normative beliefs 105
about the perceived opinions of significant others are proposed to underlie subjective norms, 106

6
and sets of control beliefs about factors that facilitate or inhibit behaviour to underlie 107
perceived behavioural control. 108
Studies have demonstrated that TPB components effectively predict driving 109
violations. For example, the TPB components have been found to predict speeding intentions 110
in drivers and motorcyclists (e.g., Chorlton, Conner, & Jamson, 2012; Conner et al., 2007; 111
Elliott, Armitage, & Baughan, 2007; Parker, Manstead, Stradling, & Reason, 1992). 112
Longitudinal data have shown that change in the TPB components predicts change in 113
speeding intentions, providing increased confidence that the TPB components cause 114
intentions (Elliott, 2012). The TPB components have also been shown to underlie intentions 115
regarding other violations including drink-driving (Moan & Rise, 2011; Parker et al., 1992) 116
and mobile phone use (Gauld, Lewis, & White, 2014; Nemme & White, 2010). 117
A subset of TPB studies has examined drivers’ beliefs regarding speeding (Chorlton 118
et al., 2012; Elliott, Armitage, & Baughan, 2005; Parker et al., 1992) and drink-driving 119
(Parker et al., 1992). Across these studies important behavioural beliefs have included 120
arriving at destinations more quickly, feeling exhilarated, greater fuel usage, and increased 121
crash likelihood. Identified normative beliefs include disapproval from family, friends, police 122
and other road users. Salient control beliefs have addressed road conditions, time pressure 123
and the behaviour of other drivers. Two studies have developed effective interventions to 124
change the beliefs identified via the TPB, thereby reducing violation intentions in drivers 125
with a range of experience (Elliott & Armitage, 2009; Parker, Stradling, & Manstead, 1996). 126
This paper applies the TPB to guide identification of pre-driver beliefs underlying 127
intentions to drive over the speed limit, while over the legal alcohol limit, talking on a hand-128
held mobile phone and feeling very tired. The TPB has not previously been applied to 129
identify the beliefs underlying risky intentions in pre-drivers. Given that pre-drivers cannot 130

7
actually violate, we focus on intentions to violate as our outcome measure. This approach is 131
supported by evidence that intentions are strong predictors of behaviour. In a meta-analysis of 132
185 studies, the intention-behaviour correlation was .47 (Armitage & Conner, 2001). A meta-133
analysis of 47 experimental studies showed that manipulating intentions has a significant 134
impact on subsequent behaviour (d=.36, Webb & Sheeran, 2006). Drivers’ speeding 135
intentions correlate with self-reported behaviour, r=.67 to .76 (Elliott, Armitage, & Baughan, 136
2003; Elliott et al., 2007) and with speeding in both real driving, r=.41, and in a simulator, 137
r=.48 (Conner et al., 2007). 138
The present study has two phases. In a qualitative belief elicitation study, pre-drivers 139
identified behavioural, normative and control beliefs underlying violations. Next, a 140
quantitative study assessed the extent to which the modal salient beliefs identified in phase 1 141
were associated with components of the TPB, and which TPB components were most 142
strongly associated with intentions to engage in the risky driving behaviours once a licence 143
was awarded. 144
145
Method 146
Elicitation Study 147
Sixty students from a Yorkshire sixth form college participated in the elicitation study. They 148
completed the study in a classroom session under the supervision of a college tutor. Their 149
mean age was 16.6 years (range 16-18 years), 53% were female and 85% reported their 150
ethnic origin as White British. Fifty-three per cent had no driving licence, which means they 151
were prohibited from driving on public roads under any circumstances and 47% held a 152
provisional licence that allows supervised driving for training purposes. Students were 153
randomised to answer questions about behavioural, normative and control beliefs regarding 154

8
one of driving over the speed limit (N=17), driving while talking on a hand-held mobile 155
phone (N=16), driving whilst feeling very tired (N=12) and driving while over the legal 156
alcohol limit (N=15). 157
Following the standard method for TPB belief elicitation studies (Ajzen, 2013; 158
Conner & Sparks, 2015) we elicited behavioural beliefs in questionnaires that asked the 159
participants what they believed (a) to be the advantages, (b) to be the disadvantages (c) they 160
would like or enjoy and (d) would dislike or hate about a target behaviour. Normative beliefs 161
were elicited by asking (e) “Which individuals would approve (i.e., think it was a good 162
idea)?”, (f) “Which individuals would disapprove (i.e., think it was a bad idea)?”, and (g) 163
“Are there any other individuals or groups of people who would approve or disapprove of 164
you driving over the speed limit?”. Control beliefs were probed by asking “What things (i.e., 165
factors or circumstances)?” would make the target behaviour (h) more and (i) less likely and 166
(j) whether there were other things that would make the target behaviour more or less likely. 167
Two raters independently coded the generated beliefs. Coding agreement ranged from 89% to 168
95% across the four violations studied. Commonly identified beliefs (identified by more than 169
3 participants), were used to populate the belief questionnaires in the main study (see Tables 170
1-4). 171
Main Study 172
Participants and procedure 173
There were 294 participants from five Yorkshire schools and sixth form colleges. 174
Questionnaires were completed in classroom settings under the supervision of school/college 175
tutors. The average age was 17.06 (SD = 0.68, range 16-19) and 62% were female. Seventy-176
eight per cent of the sample identified themselves as White British with the remainder 177
identifying ethnicities including Black African (3%) and Pakistani (3%). Forty-six per cent 178

9
did not have a driving licence and 54% held provisional licences. Participants were 179
randomised to answer questions regarding one of the four violations targeted: driving over 180
the speed limit (N=77), driving while over the legal alcohol limit (N=72), driving while 181
talking on a hand-held mobile phone (N=77) and driving whilst feeling very tired (N=68). 182
Participants provided informed consent and all study procedures, including the belief 183
elicitation study, were approved by the Ethics Committee, Department of Psychology, 184
University of Sheffield. 185
Measures 186
Beliefs 187
The belief questions in the main study were based on the beliefs identified in the elicitation 188
study. The behavioural beliefs were presented as statements. Participants rated how likely 189
they thought each statement (e.g., Driving over the speed limit would increase my chances of 190
injuring other road users) was to be true on a 7 point scale anchored Unlikely - Likely. 191
Normative beliefs were presented as statements about different groups of people that might 192
approve or disapprove of engagement in each violation (e.g., My parents think that I 193
should/should not drive whilst talking on a hand-held mobile phone) on a 7 point scale 194
anchored Think I should – Think I should not. Scores were reversed so that high scores 195
indicated greater violation approval. Control beliefs were presented as statements about how 196
situations might affect the likelihood of engaging in the violations (e.g., Having no alternative 197
way to get home). Participants rated these on a seven point scale anchored Less likely – More 198
likely. These items were reverse scored so that higher scores indicated less behavioural 199
control. 200
Components of the Theory of Planned Behaviour 201
10
The components of the TPB (attitudes, subjective norms, perceived behavioural control) were 202
measured using the standard questions from the literature (Conner & Sparks, 2015). In this 203
approached each construct is probed with a set of defined items, which tap overlapping but 204
distinct aspects of the construct. The overall score for each TPB component is calculated as 205
the mean of the item-set. Taking the mean provides an index of the composite construct and 206
reduces the impact of item-specific measurement error on the construct score. Cronbach’s 207
alpha is calculated to check that the constituent items are measuring the same construct. 208
Alpha values range between 0 and 1 with higher scores indicating greater internal 209
consistency. 210
Attitudes 211
Attitudes to the target behaviours were measured as the mean of four semantic differential 212
items rated on seven point scales. These asked whether the target behaviour would be (1) 213
Pleasant – Unpleasant, (2) Harmful – Beneficial, (3) Negative – Positive, and (4) Wise – 214
Foolish. Items were coded so that higher scores indicated riskier attitudes. Cronbach’s alpha 215
reliabilities ranged from .83 to .86 across the four target behaviours. 216
Subjective Norms 217
Subjective norms regarding the target behaviours were measured as the mean of two items, 218
each rated on a seven point scale, e.g., (1) People who are important to me think I 219
should/should not drive over the speed limit and (2) People who are important to me would 220
approve/disapprove of me driving over the speed limit. The poles were labelled Think I 221
should – Think I should not and Would approve – Would disapprove for these items 222
respectively. These items were coded so that higher scores indicated greater approval for 223
violating. Alpha reliabilities ranged from .58 to .72 across the four target behaviours. 224

11
Perceived Behavioural Control 225
Perceived behavioural control was measured using the mean of four items addressing (1) 226
How much control would you have over whether or not you would drive over the speed limit? 227
with scale poles labelled Complete control – No control, (2) I would have complete control 228
over whether or not I would drive over the speed limit with scale poles labelled Agree – 229
Disagree, (3) If I wanted to, driving over the speed limit would be… with scale poles labelled 230
Easy – Difficult and (4) If I wanted to, I could easily drive over the speed limit with scale 231
poles labelled Likely – Unlikely. High scores indicated more difficulty in controlling the 232
behaviour. Alpha reliabilities ranged from .48 to .78 across the four target behaviours. 233
Intention 234
Intention was measured as the mean of three items; (1) How likely is it that you would drive 235
over the speed limit? (Likely – Unlikely) (2) I would be very likely / unlikely to drive over 236
the speed limit... (Very likely – Very unlikely) and (3) How willing would you be to drive 237
over the speed limit? (Very willing – Not at all willing). Items were recoded so that higher 238
scores indicated riskier intentions. Alpha ranged from .64 to .80 across the four target 239
behaviours. 240
Analysis 241
There were many moderate and strong correlations within the sets of behavioural, normative 242
and control beliefs elicited. Therefore we conducted exploratory factor analyses to combine 243
related beliefs into scales. Many belief variables were non-normally distributed. Therefore we 244
analysed them as ordinal scales using Geomin rotation, allowing correlated factors to be 245
extracted, in MPlus 7.11 (Muthen & Muthen, 2013). The only exception was the control 246
beliefs regarding driving while tired where the Mplus models would not converge. Therefore 247

12
a principal component factor analysis with promax rotation was conducted in Stata 10.1 248
(StataCorp, 2007) for these items. Factor solutions were primarily chosen based on the scree 249
plot and factor interpretability, with cross-loading items minimised. We then formed scales 250
by adding up the scores of high loading items (>.5), the reliability of which were examined 251
using Cronbach’s alpha. Regression models guided by the TPB identified the extent to which 252
behavioural beliefs predicted attitudes, normative beliefs predicted subjective norms and 253
control beliefs predicted perceived behavioural control. We also fitted models to identify the 254
extent to which attitudes, subjective norms and perceived behavioural control predicted 255
intentions to drive riskily. 256
Results 257
Exploratory Factor Analyses of Belief Variables 258
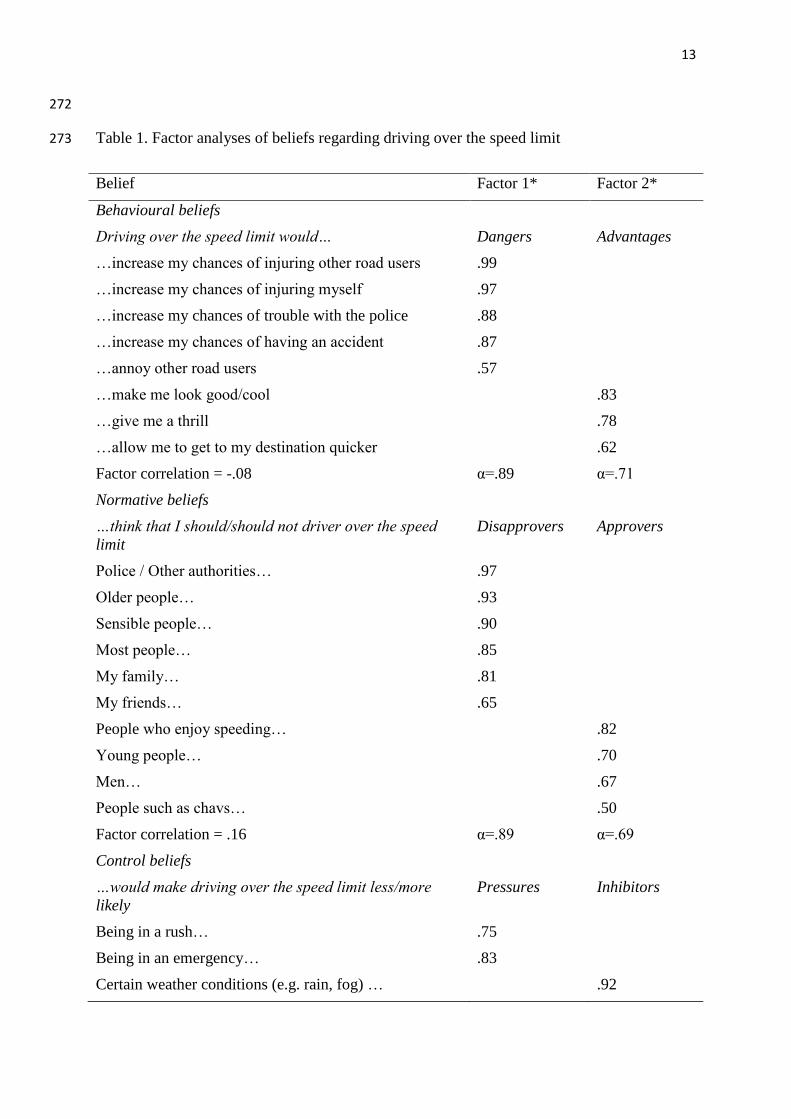
Driving over the speed limit: The commonly identified beliefs from the elicitation study, and 259
the results of the factor analyses conducted on the quantitative items formed from these 260
beliefs, are shown in Table 1. Two factor models provided good fits to the behavioural, 261
normative and control beliefs. Factor structure was interpretable with the minor exception of 262
one cross-loading control belief item. This item was omitted from both scales. Items 263
addressing dangers of speeding, such as the chances of injuring others loaded onto one 264
behavioural beliefs factor. The other represented advantages of speeding, including “looking 265
cool” and arriving more quickly. The normative belief analysis identified separate factors 266
comprising disapprovers (e.g., the police) and approvers (e.g., young people) of speeding. 267
The two control beliefs factors separated items that formed pressures for speeding (e.g., being 268
in a rush or an emergency) from those that inhibited speeding (e.g., weather conditions). In 269
all cases correlations between factors were modest. Alpha analyses indicated that summing 270
the high loading items generated reliable scales. 271
13
272
Table 1. Factor analyses of beliefs regarding driving over the speed limit 273
Belief Factor 1* Factor 2*
Behavioural beliefs
Driving over the speed limit would… Dangers Advantages
…increase my chances of injuring other road users .99
…increase my chances of injuring myself .97
…increase my chances of trouble with the police .88
…increase my chances of having an accident .87
…annoy other road users .57
…make me look good/cool .83
…give me a thrill .78
…allow me to get to my destination quicker .62
Factor correlation = -.08 α=.89 α=.71
Normative beliefs
…think that I should/should not driver over the speed
limit
Disapprovers Approvers
Police / Other authorities… .97
Older people… .93
Sensible people… .90
Most people… .85
My family… .81
My friends… .65
People who enjoy speeding… .82
Young people… .70
Men… .67
People such as chavs… .50
Factor correlation = .16 α=.89 α=.69
Control beliefs
…would make driving over the speed limit less/more
likely
Pressures Inhibitors
Being in a rush… .75
Being in an emergency… .83
Certain weather conditions (e.g. rain, fog) … .92

14
Having passengers in my car… .84
The presence of police / speed cameras… .69
Being with my friends who are encouraging me to
speed**…
.58 .59
Certain road conditions (e.g. busy traffic)… .51
Factor correlation = .13 α=.70 α=.77
*Only factor loadings above .5 are displayed 274
**Cross-loading item omitted from both scales 275
276
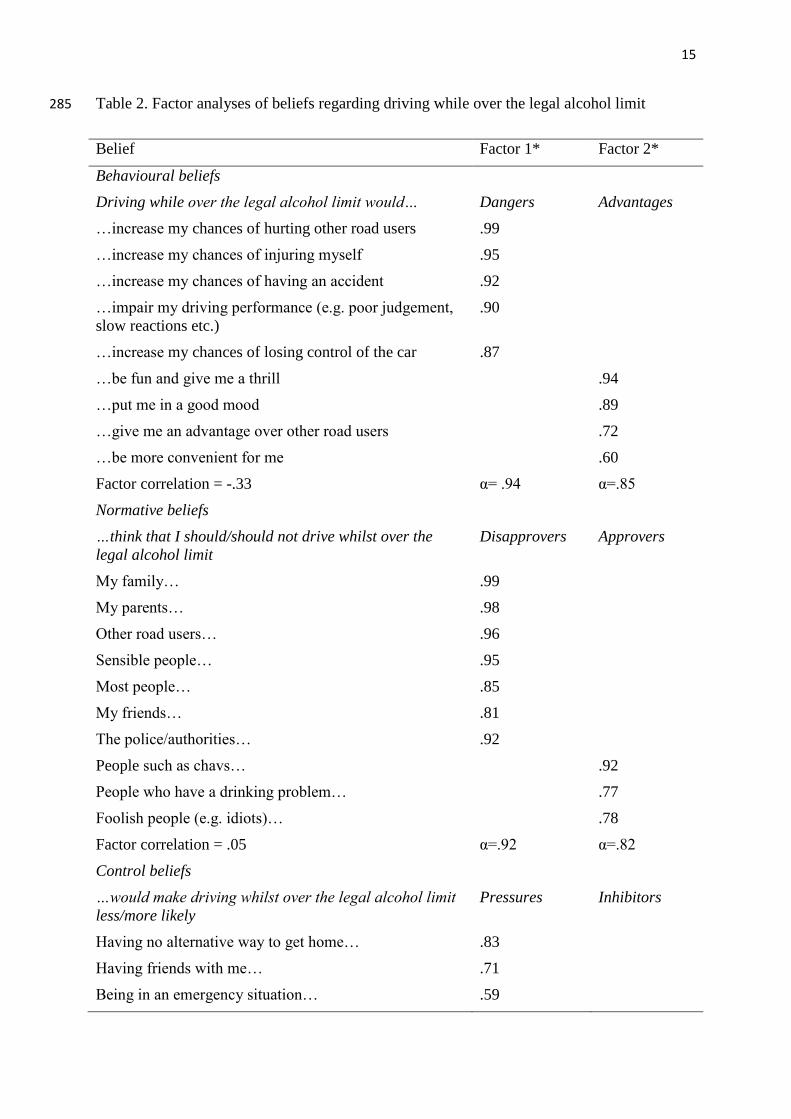
Driving while over the legal alcohol limit: Two factor models were again selected for all 277
belief types (Table 2). Behavioural beliefs were separated into negatively correlated factors 278
representing the dangers (e.g., increased accident risk) and advantages (e.g., give me a thrill) 279
of driving under the influence of alcohol. Normative beliefs separated into disapprovers (e.g., 280
my family) and approvers (e.g., “chavs”1). Control beliefs were separated into pressures to 281
encourage driving under the influence (e.g., an emergency) and inhibitors (e.g., the presence 282
of police). Scales based on high loading items had acceptable reliabilities. 283
284
1 “Chav” is slang for an antisocial young person
15
Table 2. Factor analyses of beliefs regarding driving while over the legal alcohol limit 285
Belief Factor 1* Factor 2*
Behavioural beliefs
Driving while over the legal alcohol limit would… Dangers Advantages
…increase my chances of hurting other road users .99
…increase my chances of injuring myself .95
…increase my chances of having an accident .92
…impair my driving performance (e.g. poor judgement,
slow reactions etc.)
.90
…increase my chances of losing control of the car .87
…be fun and give me a thrill .94
…put me in a good mood .89
…give me an advantage over other road users .72
…be more convenient for me .60
Factor correlation = -.33 α= .94 α=.85
Normative beliefs
…think that I should/should not drive whilst over the
legal alcohol limit
Disapprovers Approvers
My family… .99
My parents… .98
Other road users… .96
Sensible people… .95
Most people… .85
My friends… .81
The police/authorities… .92
People such as chavs… .92
People who have a drinking problem… .77
Foolish people (e.g. idiots)… .78
Factor correlation = .05 α=.92 α=.82
Control beliefs
…would make driving whilst over the legal alcohol limit
less/more likely
Pressures Inhibitors
Having no alternative way to get home… .83
Having friends with me… .71
Being in an emergency situation… .59

16
The presence of the police… .96
Knowing a victim of a road accident… .93
Having thought about the risks… .82
Having passengers in the car…** .58 .73
Factor correlation = -.03 α=.68 α=.88
*Only factor loadings above .5 are displayed 286
**Cross-loading item omitted from both scales 287
Driving whilst talking on a hand-held mobile phone: Table 3 shows that there were two 288
behavioural beliefs factors; dangers (including reduced control of car) and advantages 289
containing two items (allow me to talk with people and to multi-task). Although the 290
normative beliefs factor analysis identified two factors, the second factor had an eigenvalue 291
of only 1.12, there were cross-loading items, and a substantial correlation between the factors 292
(r=.64). Therefore a one factor solution was preferred. All items loaded positively onto the 293
single factor representing disapprovers of driving while using a phone. Two control beliefs 294
factors were identified: pressures encouraging phone use (e.g., an emergency) and inhibitors 295
to prevent it (e.g., driving near pedestrians). Alpha reliabilities were acceptable for 296
constructed scales. 297
298
Table 3. Factor analyses of beliefs regarding driving whilst talking on a hand-held mobile 299
phone 300
Belief Factor 1* Factor 2*
Behavioural beliefs
Driving whilst talking on a hand-held mobile phone
would…
Dangers Advantages
…allow me to keep in touch / talk with people .95
…allow me to multi-task .58
…reduce my control of the car .89

17
…increase my chances of having an accident .88
….mean diverting my attention from the road .88
…increase my level of distraction .88
…increase the chances of trouble with the police .75
Factor correlation = .02 α=.86 α=.67
Normative beliefs
…think that I should/should not drive whilst talking on a
hand-held mobile phone
Disapprovers
Older people… .93
Sensible people… .90
My parents… .89
Police and other authorities… .82
Most people… .79
Young people… .57
Foolish people (e.g. idiots)…
α=.77
Control beliefs
…would make driving whilst talking on a hand-held
mobile phone less/more likely
Pressures Inhibitors
Needing to make an important or urgent call… .93
Receiving an important call… .77
Being in an emergency situation… .51
Driving on a quiet or remote road…
Driving near pedestrians or a school… .93
Police presence… .95
Knowing of road accidents involving drivers using
mobile phones…
.91
Driving in busy traffic… .67
Factor correlation = .10 α=.71 α=.87
*Only factor loadings above .5 are displayed 301
Driving while feeling very tired: As shown in Table 4, we preferred a one factor behavioural 302
beliefs solution as, in the two factor model, the second factor eigenvalue was only 1.08, a 303
number items loaded onto both factors and there was a strong correlation between the factors 304

18
(r=.59). The single factor focussed on the dangers of driving while tired, including poor 305
concentration. There was a single subjective norms factor including disapprovers of driving 306
while tired. The principal components factor analysis of control beliefs identified two 307
components. Two items loaded onto a pressures to drive while tired factor (needing to drive 308
early in the morning and late at night). Three items loaded onto an inhibitors factor including 309
having no real need to drive. All alphas were above .60 for the constructed scales. 310
311
Table 4. Factor analyses of beliefs regarding driving whilst feeling very tired 312
Belief Factor 1* Factor 2*
Behavioural beliefs
Driving whilst feeling very tired… Dangers
…impair my driving performance (e.g. poor
concentration)
.94
…increase my chances of having an accident .88
…increase my chances of hurting other road users .88
…result in me having slower reactions to events on the
road
.83
…increase my chances of falling asleep at the wheel .77
…increase the probability of me dying .69
…mean I had to invest greater effort to stay awake .67
…get me to my destination quicker than using public
transport
…give me an advantage over other road users*** .71
α= .91
Normative beliefs
…think that I should/should not drive whilst feeling very
tired
Disapprovers
The police/authorities… 1.00
Sensible people… .90
Most people… .83
Older people… .77

19
Young people… .66
Foolish people (e.g. idiots)…****
α= .88
Control beliefs**
…would make driving whilst feeling very tired less/more
likely
Pressures Inhibitors
Needing to drive in the early morning… .90
Needing to drive late at night… .87
Having no real need to make a journey… .81
Being in an emergency situation…*** .77
Fear of having an accident… .66
Factor correlation = .09 α=.70 α=.61
*Only factor loadings above .5 are displayed 313
**Factor results calculated using Principal Factor Analysis with promax rotation 314
***Item reverse scored 315
**** Item dropped as preventing model convergence 316
317
Theory of Planned Behaviour Analyses 318
As Table 5 shows, attitudes, subjective norms and perceived behavioural control jointly 319
accounted for substantial proportions of variance in intentions regarding all behaviours (R2 320
range .41 - .69). Attitudes were significant independent predictors of intention for all 321
behaviours, whereas subjective norms and perceived behavioural control predicted intention 322
to speed and use a mobile phone, but did not predict intention to drive under the influence of 323
alcohol or while tired. 324
325

20
Table 5. β coefficients (and 95% Confidence Intervals) from multiple regression models 326
predicting risky intentions from attitudes, subjective norm and perceived behavioural control 327
Driving…
Predictor1
N
R2
Over the speed
limit
77
.69***
Over the legal
alcohol limit
72
.68***
While talking on
a hand-held
mobile phone
77
.63***
While feeling
very tired
68
.41***
Attitudes .53*** (.35, .70) .72*** (.50, .94) .53*** (.33, .73) .49** (.21, .78)
Subjective
norms
.29** (.12, .46) .08 (-.13, .29) .19* (.02, .37) .14 (-.14, .42)
Perceived
behavioural
control
.19** (.05, .33) .10 (-.05, .26) .17* (.01, .33) .13 (-.10, .34)
1Age and sex were entered as covariates into all models. 328
***p<.001 **p<.01 *p<.05 329
330
As Table 6 shows, behavioural beliefs regarding dangers predicted attitudes towards all 331
behaviours. Behavioural beliefs regarding advantages predicted attitudes to speeding and 332
driving under the influence of alcohol. Normative beliefs about disapprovers of violating 333
predicted subjective norms for all behaviours. Where normative beliefs about approvers of 334
violation were identified (speeding and driving under the influence of alcohol), they did not 335
predict subjective norms independently from normative beliefs regarding disapprovers. 336
Inhibitory control beliefs predicted perceived behavioural control for speeding, with no 337
significant predictors of perceived behavioural control identified for the other behaviours. 338
339

21
Table 6. β coefficients (and 95% Confidence Intervals) from multiple regression models predicting attitudes, subjective norms and perceived 340
behavioural control from the beliefs hypothesised to underlie these constructs according to the Theory of Planned Behaviour. Age and sex were 341
entered as covariates into all models. 342
Driving…
Behavioural
Beliefs
Attitudes
Normative Beliefs
Subjective norms
Control Beliefs
Perceived
behavioural
control
…Over the speed
limit
R2=.54***
R2=.46***
R2=.20**
Dangers -.40***
(-.56, -.24)
Disapprovers .58***
(.39, .77)
Pressures .08
(-.14, .31)
Advantages .58***
(.42, .75)
Approvers .15
(-.04, .33)
Inhibitors -.33**
(-.56, -.10)
…While over the
legal alcohol limit
R2=.28***
R2=.19**
R2=.04
Dangers -.32**
(-.55, -.09)
Disapprovers .43***
(.20, .65)
Pressures .02
(-.23, .27)
Advantages .28*
(.06, .50)
Approvers -.16
(-.39, .06)
Inhibitors .18
(-.07, .43)
…While talking
on a hand-held
mobile phone
R2=.27*** R
2=.22*** R
2=.07
Dangers -.44***
(-.64, -.25)
Disapprovers .45***
(.23, .66)
Pressures .18
(-.06, .43)
Advantages .17
(-.03, .36)
Inhibitors -.10
(-.36, .16)

22
…While feeling
very tired
R2=.42*** R
2=.45*** R
2=.07
Dangers -.64***
(-.83, -.44)
Disapprovers .64***
(.45, .84)
Pressures .01
(-.24, .26)
Inhibitors .13
(-.12, .38)

23
Discussion 343
Application of the TPB to pre-driver intentions 344
This study used the TPB to identify pre-driving beliefs that underlie intentions to engage in 345
four driving violations. From the perspective of the TPB, the key beliefs for interventions to 346
target are those that significantly predict TPB components that in turn significantly predict 347
intentions. In combination the TPB components were strong predictors of violation 348
intentions, explaining between 63% and 69% of the variance for driving over the speed limit, 349
driving above the legal alcohol limit and driving while talking on a hand held mobile phone, 350
and 41% in driving while feeling very tired. This compares to an average 44% of variance 351
explained in intentions by TPB variables across 206 studies (McEachan et al., 2011). In the 352
current study, attitudes were strong predictors of intentions for all behaviours while 353
subjective norms and perceived behavioural control were significant, though weaker, 354
independent predictors regarding speeding and phone use. 355
For all four violations, behavioural beliefs explained substantial proportions of 356
variance in attitude: 54% regarding speeding intentions, 42% for tiredness, 28% for alcohol 357
use and 29% for mobile phone distraction. There were some notable similarities in the 358
important beliefs identified across behaviours. A set of beliefs regarding risk of accident 359
and/or injury predicted attitudes towards all violations. Specific negative behavioural beliefs 360
were also identified. Impaired driving performance, such as diverted attention and slowed 361
reactions, and risk of loss of vehicle control were identified for alcohol use, mobile phone use 362
and tiredness. The risk of annoying other drivers was identified regarding speeding. Separate 363
behavioural belief factors regarding the advantages offered by violating were identified for 364
speeding and alcohol use. The practical advantages of violating were highlighted; arriving 365

24
faster for speeding and convenience for driving under the influence of alcohol. Regarding 366
speeding, a feeling of thrill and looking good or “cool” was also highlighted. 367
Subjective norms predicted intentions to speed and to use a mobile phone. Significant 368
others who disapprove of violations were prominent including the police as well as family 369
and friends, older and “sensible” people. Perceived behavioural control predicted intentions 370
to speed and to use a mobile phone. For speeding the significant control beliefs included 371
items that might reduce likelihood of speeding. These included weather and road conditions, 372
the presence of speed cameras and having passengers in the car. The identified control beliefs 373
did not predict perceived behavioural control of using a mobile phone. 374
Informing road safety interventions 375
The current results add to the information currently available to develop road safety 376
interventions for pre-drivers. Specifically, intervention designers can focus on bolstering 377
negative beliefs about risky driving (e.g., speeding increases injury risk) and countering the 378
positive beliefs (e.g., speeding substantially reduces journey times). Such belief modification 379
would be predicted to lead, in turn, to less frequent violations during future independent 380
driving. Prospective studies, ideally involving a randomised intervention to change beliefs, 381
will be needed to test this hypothesis. 382
A number of the beliefs identified here are often addressed in road safety material 383
aimed at both pre-drivers and fully qualified drivers. For example, these include the 384
behavioural beliefs that violations increase risk of crash and injury, that mobile phone use 385
causes distraction, that alcohol slows reactions, and that the police disapprove of risk taking 386
which may lead to traffic citation. Our results may therefore be seen as an impetus to 387
continue with these efforts, and in particular provide a novel basis for their extension to pre-388
driver audiences. However, some of the other beliefs identified as important predictors in our 389

25
study suggest further targets for intervention. The belief that speeding will result in shorter 390
journey times could be addressed with demonstrations that speeding motorists are likely to 391
save relatively little time on many journeys. A body of literature has addressed biases in 392
assessment of time savings relative to speed (e.g., Svenson, 2008) and interventions 393
developed there could be applied in pre-driving education. Beliefs that risk-taking looks good 394
and is enjoyable may be addressed with counter-examples in which risk-taking leads to 395
negative consequences such as disapproval from passengers, embarrassing road-side 396
discussions with police or unattractive damage to vehicles. Beliefs about family and 397
disapproval of speeding and mobile phone use may be enhanced by making this a focus of 398
road safety material. 399
Road safety education packages addressing the beliefs identified here may take 400
various forms including media campaigns, on- and off-line literature, and live small- and 401
large-group educational programmes. For example, media-based packages often graphically 402
depict car crashes resulting from speeding, alcohol consumption, distraction or fatigue. 403
Interventions of this form are likely to have high face validity as bolstering the behavioural 404
beliefs that risky behaviour increases the risk of crash and injury; beliefs that we have 405
identified as important predictors of intentions to violate in this study. Indeed, face validity is 406
a necessary component for road safety intervention; both the presenters and audience must 407
view the intervention as acceptable and appropriate for the intervention to be viable for large-408
scale adoption. However, face validity is not sufficient; interventions must also demonstrate 409
objective evidence that they can change their attitudinal and behavioural targets, ideally in 410
randomized controlled trials (RCT). 411
A body of research has begun to address links between parent and child driving and 412
the concept of family culture for road safety has been developed (Taubman-Ben-Ari & Katz-413
26
Ben-Ami, 2012). A number of interventions for teen driver road safety have targeted parental 414
behaviours (Curry, Peek-Asa, Hamann, & Mirman, 2015). This approach may be particularly 415
well suited to intervening to improve the pre-driver beliefs identified in our study. 416
Evaluating road safety interventions for pre-drivers 417
Whatever form interventions to address pre-driving beliefs take, evidence that they 418
can reduce future crash rates would prove particularly compelling. However, the rarity of 419
crashes and plethora of other factors involved in their causation, such as exposure and the 420
behaviour of other road users, may make gathering evidence of this sort unfeasible 421
(Hutchinson & Wundersitz, 2011). Instead, intervention effectiveness may be tested in 422
studies that measure “variables that can be objectively observed and are closely related to 423
safety” (Hutchinson & Wundersitz, 2011 page 235). Therefore, for pre-drivers, measures are 424
required that can be answered by people who do not drive but that have been demonstrated to 425
correlate with safety-critical aspects of behaviour in drivers. Examples include the Attitudes 426
to Driving Violations Scale (West & Hall, 1997) which, when assessed in learner drivers 427
predicts post-license driving violations (Rowe, Maughan, et al., 2013) and the Violations 428
Willingness Scale, which correlates strongly with driving violations when measured in 429
drivers (Rowe, Andrews, et al., 2013). 430
As discussed in the introduction, there is currently little RCT evidence for the 431
effectiveness of pre-driver road safety interventions. However, there is evidence that TPB-432
informed interventions may be effective in encouraging other health behaviours, such as 433
reduced alcohol consumption and smoking (Webb et al., 2010). We also noted that two 434
studies reported effective TPB based interventions with driving. Elliott and Armitage (2009) 435
found that messages regarding control beliefs were key to mediating the effect of their 436
intervention. Conversely, Parker et al. (1996) found that targeting normative beliefs was most 437

27
effective. Although not directly comparable, the strength of the association between attitudes 438
and intention is striking in the current study and indicates that behavioural beliefs may be a 439
particularly attractive initial target for RCT studies of interventions for pre-drivers. 440
Limitations 441
These results must be considered in the context of a number of limitations. First, the 442
reliability of some of the assessed TPB variables was lower than desirable. It is likely that 443
measuring these constructs using a small number of items contributed to this issue. Using 444
more items might have improved reliability but this would also have contributed to 445
participant fatigue. Second, the focus on pre-drivers meant that our outcome measures were 446
intentions to drive riskily in the future rather than risky driving behaviour. Studies following 447
up from pre-driving to actual driving behaviour months or years later are clearly of great 448
value in identifying key pre-driving beliefs and attitudes. Currently these are rare in the 449
literature. We believe that our results provide a useful guide to the pre-driving beliefs that are 450
likely to be important in safe driving that can inform intervention at the present time. Our 451
results and approach may also inform the design of longitudinal studies that can track 452
associations of pre-driving beliefs and post-driving behaviours across the driver training 453
process. 454
Implications 455
The early driving period is an attractive target for road safety intervention in that 456
crash risk is very high in the first few months after beginning independent driving (McCartt 457
et al., 2009). Therefore, interventions that are effective for only a few months could have a 458
strong road safety impact. This situation contrasts with many other health behaviours, such as 459
alcohol use and smoking, where interventions need to be effective for much longer periods to 460
have meaningful public health impact. Combined with the political and public appetite for 461
28
educational solutions to the novice driver problem (Williams & Ferguson, 2004), this 462
provides considerable impetus for the design of theoretically informed road safety 463
interventions. We believe that interventions that aim to modify the pre-driving beliefs 464
identified here offer the potential to impact upon the substantial public health problem of 465
novice driver crash involvement. 466
467

29
Acknowledgements 468
This work was supported by a Higher Education Innovation Fund Knowledge Transfer Grant. 469
Many thanks to South Yorkshire Safer Roads Partnership for assistance in running the 470
project. 471

30
References 472
Aarts, L., & van Schagen, I. (2006). Driving Speed and the Risk of Road Crashes: A Review. 473
Accident Analysis and Prevention, 38(2), 215-224. 474
Ajzen, I. (1991). The theory of planned behaviour. Organizational Behaviour and Human 475
Decision Processes, 50, 179-211. 476
Ajzen, I. (2013). Constructing a Theory of Planned Behavior Questionnaire. 477
Armitage, C. J., & Conner, M. (2001). Efficacy of the theory of planned behaviour: A meta-478
analytic review. British Journal of Social Psychology, 40, 471-499. 479
doi:10.1348/014466601164939 480
Blows, S., Ameratunga, S., Ivers, R. Q., Lo, S. K., & Norton, R. (2005). Risky driving habits 481
and motor vehicle driver injury. Accident Analysis and Prevention, 37(4), 619-624. 482
doi:10.1016/j.aap.2005.03.003 483
Chorlton, K., Conner, M., & Jamson, S. (2012). Identifying the psychological determinants of 484
risky riding: An application of an extended Theory of Planned Behaviour. Accident 485
Analysis and Prevention, 49, 142-153. doi:10.1016/j.aap.2011.07.003 486
Conner, M., Lawton, R., Parker, D., Chorlton, K., Manstead, A. S. R., & Stradlings, S. 487
(2007). Application of the theory of planned behaviour to the prediction of objectively 488
assessed breaking of posted speed limits. British Journal of Psychology, 98, 429-453. 489
doi:10.1348/000712606x133597 490
Conner, M., & Sparks, P. (2015). Theory of Planned Behaviour and Health Behaviour. In M. 491
Conner & P. Norman (Eds.), Predicting Health Behaviour. Buckingham: Open 492
University Press. 493
Curry, A. E., Peek-Asa, C., Hamann, C. J., & Mirman, J. H. (2015). Effectiveness of Parent-494
Focused Interventions to Increase Teen Driver Safety: A Critical Review. Journal of 495
Adolescent Health, 57(1), S6-S14. doi:10.1016/j.jadohealth.2015.01.003 496

31
de Winter, J. C. F., & Dodou, D. (2010). The Driver Behaviour Questionnaire as a predictor 497
of accidents: A meta-analysis. Journal of Safety Research, 41(6), 463-470. 498
doi:10.1016/j.jsr.2010.10.007 499
Department for Transport. (2013). Reported Road Casualties Great Britain: 2012. Retrieved 500
from London 501
Elliott, M. A. (2012). Testing the capacity within an extended theory of planned behaviour to 502
reduce the commission of driving violations. Transportmetrica, 8(5), 321-343. 503
doi:10.1080/18128602.2010.502548 504
Elliott, M. A., & Armitage, C. J. (2009). Promoting drivers' compliance with speed limits: 505
Testing an intervention based on the theory of planned behaviour. British Journal of 506
Psychology, 100, 111-132. doi:10.1348/000712608x318626 507
Elliott, M. A., Armitage, C. J., & Baughan, C. J. (2003). Drivers' compliance with speed 508
limits: An application of the theory of planned behavior. Journal of Applied 509
Psychology, 88(5), 964-972. doi:10.1037/0021-9010.88.5.964 510
Elliott, M. A., Armitage, C. J., & Baughan, C. J. (2005). Exploring the beliefs underpinning 511
drivers' intentions to comply with speed limits. Transportation Research Part F-512
Traffic Psychology and Behaviour, 8(6), 459-479. Retrieved from <Go to 513
ISI>://000233312800006 514
Elliott, M. A., Armitage, C. J., & Baughan, C. J. (2007). Using the theory of planned 515
behaviour to predict observed driving behaviour. British Journal of Social 516
Psychology, 46, 69-90. doi:10.1348/14466605x90801 517
Fell, J. C., & Voas, R. B. (2014). The effectiveness of a 0.05 blood alcohol concentration ( 518
BAC) limit for driving in the United States. Addiction, 109(6), 869-874. 519
doi:10.1111/add.12365 520
32
Ferdinand, A. O., & Menachemi, N. (2014). Associations between driving performance and 521
engaging in secondary tasks: a systematic review. American Journal of Public Health, 522
104(3), e39-48. doi:10.2105/ajph.2013.301750 523
Garbarino, S., Nobili, L., Beelke, M., De Carli, F., & Ferrillo, F. (2001). The contributing 524
role of sleepiness in highway vehicle accidents. Sleep, 24(2), 203-206. Retrieved 525
from <Go to ISI>://000167583200008 526
Gauld, C. S., Lewis, I., & White, K. M. (2014). Concealing their communication: Exploring 527
psychosocial predictors of young drivers' intentions and engagement in concealed 528
texting. Accident Analysis and Prevention, 62, 285-293. 529
doi:10.1016/j.aap.2013.10.016 530
Glendon, A. I., McNally, B., Jarvis, A., Chalmers, S. L., & Salisbury, R. L. (2014). 531
Evaluating a novice driver and pre-driver road safety intervention. Accident Analysis 532
& Prevention, 64(0), 100-110. doi:http://dx.doi.org/10.1016/j.aap.2013.11.017 533
Groeger, J. A. (2006). Youthfulness, inexperience, and sleep loss: the problems young drivers 534
face and those they pose for us. Injury Prevention, 12, 19-24. 535
doi:10.1136/ip.2006.012070 536
Harre, N., Brandt, T., & Dawe, M. (2000). The development of risky driving in adolescence. 537
Journal of Safety Research, 31(4), 185-194. Retrieved from <Go to 538
ISI>://WOS:000165977400002 539
Helman, S., Kinnear, N. A. D., McKenna, F. P., Allsop, R. E., & Horswill, M. S. (2013). 540
Changes in self-reported driving intentions and attitudes while learning to drive in 541
Great Britain. Accident Analysis & Prevention, 59(0), 425-431. 542
doi:http://dx.doi.org/10.1016/j.aap.2013.06.038 543
33
Hutchinson, T. P., & Wundersitz, L. N. (2011). Road safety mass media campaigns: why are 544
results inconclusive, and what can be done? Int J Inj Contr Saf Promot, 18(3), 235-545
241. doi:10.1080/17457300.2010.540330 546
Ker, K., Roberts, I. G., Collier, T., Beyer, F. R., Bunn, F., & Frost, C. (2003). Strong 547
evidence that advanced and remedial driver education does not reduce road traffic 548
crashes or injuries. Cochrane Database of Systematic Reviews. 549
Lyznick, J. M., Doege, T. C., Davis, R. M., & Williams, M. A. (1998). Sleepiness, driving 550
and motor vehicle crashes. Journal of the American Medical Association, 279, 1908-551
1913. 552
Mann, H. N., & Sullman, M. J. M. (2008). Pre-driving attitudes and non-driving road-user 553
behaviours: Does the past predict future driving behaviour? In L. Dorn (Ed.), Driver 554
Behaviour and Training: Volume 3. Aldershot, UK: Ashgate. 555
McCartt, A. T., Mayhew, D. R., Braitman, K. A., Ferguson, S. A., & Simpson, H. M. (2009). 556
Effects of Age and Experience on Young Driver Crashes: Review of Recent 557
Literature. Traffic Injury Prevention, 10(3), 209-219. 558
doi:10.1080/15389580802677807 559
McEachan, R. R. C., Conner, M., Taylor, N. J., & Lawton, R. J. (2011). Prospective 560
prediction of health-related behaviours with the Theory of Planned Behaviour: a 561
meta-analysis. Health Psychology Review, 5(2), 97-144. 562
doi:10.1080/17437199.2010.521684 563
Michie, S., Rothman, A., & Sheeran, P. (2007). Current issues and new direction in 564
Psychology and Health : Advancing the science of behavior change. Psychology & 565
Health, 22(3), 249-253. doi:10.1080/14768320701233582 566

34
Moan, I. S., & Rise, J. (2011). Predicting intentions not to "drink and drive" using an 567
extended version of the theory of planned behaviour. Accident Analysis and 568
Prevention, 43(4), 1378-1384. doi:10.1016/j.aap.2011.02.012 569
Muthen, L. K., & Muthen, B. O. (2013). MPlus User's Guide. Los Angeles, CA: Muthen & 570
Muthen. 571
Nemme, H. E., & White, K. M. (2010). Texting while driving: Psychosocial influences on 572
young people's texting intentions and behaviour. Accident Analysis & Prevention, 573
42(4), 1257-1265. doi:http://dx.doi.org/10.1016/j.aap.2010.01.019 574
Parker, D., Manstead, A. S. R., Stradling, S. G., & Reason, J. T. (1992). Determinants of 575
intentions to commit driving violations. Accident Analysis and Prevention, 24(2), 576
117-131. doi:10.1016/0001-4575(92)90028-h 577
Parker, D., Stradling, S. G., & Manstead, A. S. R. (1996). Modifying Beliefs and Attitudes to 578
Exceeding the Speed Limit: An Intervention Study Based on the Theory of Planned 579
Behavior1. Journal of Applied Social Psychology, 26(1), 1-19. doi:10.1111/j.1559-580
1816.1996.tb01835.x 581
Poulter, D. R., & McKenna, F. P. (2010). Evaluating the effectiveness of a road safety 582
education intervention for pre-drivers: An application of the theory of planned 583
behaviour. British Journal of Educational Psychology, 80(2), 163-181. 584
doi:10.1348/014466509x468421 585
Reason, J. T., Manstead, A., Stradling, S., Baxter, J., & Campbell, K. (1990). Errors and 586
Violations on the Roads - a Real Distinction. Ergonomics, 33(10-11), 1315-1332. 587
Retrieved from <Go to ISI>://A1990EH39700012 588
http://www.tandfonline.com/doi/abs/10.1080/00140139008925335?url_ver=Z39.88-589
2003&rfr_id=ori:rid:crossref.org&rfr_dat=cr_pub%3dpubmed 590

35
Roberts, I. G., & Kwan, I. (2006). School-base education for the prevention of driver crashes. 591
Cochrane Database of Systematic Reviews(2). 592
Roman, G. D., Poulter, D., Barker, E., McKenna, F. P., & Rowe, R. (2015). Novice drivers’ 593
individual trajectories of driver behavior over the first three years of driving. Accident 594
Analysis & Prevention, 82(0), 61-69. doi:http://dx.doi.org/10.1016/j.aap.2015.05.012 595
Rowe, R., Andrews, E., & Harris, P. (2013). Measuring risky-driving propensity in pre-596
drivers: The Violation Willingness Scale. Transportation Research Part F-Traffic 597
Psychology and Behaviour, 19, 1-10. doi:10.1016/j.trf.2013.01.003 598
Rowe, R., Maughan, B., Gregory, A. M., & Eley, T. C. (2013). The development of risky 599
attitudes from pre-driving to fully-qualified driving. Injury Prevention, 19(4), 244-600
249. doi:10.1136/injuryprev-2012-040551 601
Rowe, R., Roman, G. D., McKenna, F. P., Barker, E., & Poulter, D. (2015). Measuring errors 602
and violations on the road: A bifactor modeling approach to the Driver Behavior 603
Questionnaire. Accident Analysis & Prevention, 74(0), 118-125. 604
doi:http://dx.doi.org/10.1016/j.aap.2014.10.012 605
StataCorp. (2007). Stata Statistical Software: Release 10.1. College Station, TX: Stata 606
Corporation. 607
Svenson, O. (2008). Decisions among time saving options: When intuition is strong and 608
wrong. Acta Psychologica, 127(2), 501-509. doi:10.1016/j.actpsy.2007.09.003 609
Taubman-Ben-Ari, O., & Katz-Ben-Ami, L. (2012). The contribution of family climate for 610
road safety and social environment to the reported driving behavior of young drivers. 611
Accident Analysis and Prevention, 47, 1-10. doi:10.1016/j.aap.2012.01.003 612
Waylen, A. E., & McKenna, F. P. (2008). Risky attitudes towards road use in pre-drivers. 613
Accident Analysis and Prevention, 40(3), 905-911. doi:10.1016/j.aap.2007.10.005 614

36
Webb, T. L., Joseph, J., Yardley, L., & Michie, S. (2010). Using the Internet to Promote 615
Health Behavior Change: A Systematic Review and Meta-analysis of the Impact of 616
Theoretical Basis, Use of Behavior Change Techniques, and Mode of Delivery on 617
Efficacy. Journal of Medical Internet Research, 12(1), 18. doi:10.2196/jmir.1376 618
Webb, T. L., & Sheeran, P. (2006). Does changing behavioral intentions engender bahaviour 619
change? A meta-analysis of the experimental evidence. Psychological Bulletin, 620
132(2), 249-268. doi:10.1037/0033-2909.132.2.249 621
West, R., & Hall, J. (1997). The role of personality and attitudes in traffic accident risk. 622
Applied Psychology-an International Review-Psychologie Appliquee-Revue 623
Internationale, 46(3), 253-264. Retrieved from <Go to ISI>://A1997XL48000004 624
Williams, A. F., & Ferguson, S. A. (2004). Driver education renaissance? Injury Prevention, 625
10(1), 4-7. doi:10.1136/ip.2003.004358 626
627

37