23rd london group meeting 2017 land accounts and a link … · 23rd london group meeting 2017 land...
TRANSCRIPT

Utkast/Version Sida DOKUMENTTYP 0 (12) 2017-09-14
23rd London group meeting 2017
Land accounts and a link to ecosystem services in Sweden
Nancy Steinbach and Viveka Palm
SCB, Stockholm 08-506 940 00 SCB, Örebro 019-17 6 00
www.scb.se

Sida 1 (12)
Introduction Ecosystem accounting and parts thereof are developing rapidly. The 23rd London group meeting is touching upon the methodological aspects of compiling regular, harmonized data on e.g. condition indicators, on carbon accounts and assets.
This paper focus on the discussion had in the development of the research agendas of both the SEEA Central Framework (SEEA CF) and the SEEA Experimental Ecosystem Accounts (SEEA EEA) on the link between the two areas.
The SEEA CF looks specifically at the economic activities as set out in the national accounts and link these with environmental statistics, see figure 1. This enable new information to be available on the flows, pressures and assets that the economy are responsible for. It’s a simple model that requires the availability of data on both the economy and the environment and the manipulation in-between to create the link.
Figure 1: Linking economic statistics to environmental statistics
On the other hand the SEEA EEA is a complex model that requires not only data that are available on the ecosystems, but also knowledge in satellite imagery and modelling.
Below is an excerpt of the explanation of the model depicted in figure 2, taken from the technical guide version 20017, page 17-18.
“The SEEA EEA ecosystem accounting model has five main components that are reflected figure 2. The framework is based around accounting for the various biotic and abiotic components within an ecosystem asset (1) that is

Sida 2 (12)
represented by a spatial area1. A delineation of the area that defines an ecosystem asset is required for accounting purposes and should be considered a statistical representation of ecosystems, which by their nature are not discrete systems that align to strict spatial boundaries. There will be different types of ecosystem assets within a territory (e.g. forests, wetlands) which will need to be distinguished. Each ecosystem asset has a range of relevant ecosystem characteristics and
processes (2) that together describe the functioning of the ecosystem. The accounting framework proposes that the stock and changes in stock of ecosystem assets is measured by assessing the ecosystem asset’s extent and
condition using indicators of the relevant ecosystem asset’s area, characteristics and processes. The extent and condition of an ecosystem asset will be affected by natural changes and also by human activity in the landscape. While each ecosystem asset is considered separable for accounting purposes there will be connections with other ecosystem assets
reflecting both the transfer of water, energy and materials and the supply of ecosystem services. Each ecosystem asset generates a set or basket of ecosystem services (3)
which, in turn, contribute to the production of benefits (4). Benefits may be goods or services (products) currently included in the economic production boundary of the SNA (e.g. timber products), referred to as SNA benefits; or they may be benefits received by individuals that are not produced by economic units (e.g. clean air). These are referred to as non-SNA benefits. Both SNA and non-SNA benefits contribute to individual and societal well-
being (5). “
1 Some of these components can be accounted for individually using the asset accounting descriptions in the SEEA CF – e.g. accounts for timber, water and soil.

Sida 3 (12)
Figure 2: Ecosystem Accounting model
Source: UNSD technical guide, version V4.1: 6March 2017
So in this model of ecosystem accounting the SEEA CF is embedded and new data, models and areas are extending the information set.
The easy part belongs to item 1 in the model in figure 2, the ecosystem assets. This because it looks at the same things as the SEEA CF on timber, water and e.g. carbon. But then it becomes more entangled with other aspects where statistics might struggle and models come into place.
At Statistics Sweden a pilot project looked into how far it is possible to link existing statistics from the SEEA CF industry (ISIC) breakdown and ecosystem services. The result of the project is briefly described below.

Sida 4 (12)
Landownership in the accounts This project has further developed and improved a method of accounting for
land ownership in the environmental accounts system. The aim was that this
production system should be fully harmonised with the environmental
accounts system and be possible to put into operation. The method has also
been tested for the production of complete statistics at two different points in
time in order to assess changes over time. Proposals for improvements
regarding input data are also provided.
The production system that has now been created for land accounts provides several ways of reporting by linking micro data with other registers and statistics. For the statistics produced in this project alone, the following information can be reported:
Type of land by time and owner category according to such as, the
real estate assessment records.
Type of land by time and property type code according to such as,
the real estate assessment records.
Type of land by time and ISIC code including section, division,
group, class and detailed group.
All variables can be reported in the following regional categories:
National level
Water districts
National regions
National areas (NUTS)
Counties
Municipalities
The data set can be extended and be associated with the location of the population, income groups involved and the infrastructure in the area. This may provide a first glimpse into how land ownership is affected within a region. Is the land owned by private individuals to a greater extent than by companies, has this affected the establishment and migration to the region, and does it affect enterprising in the area, such as small-scale tourism or the establishment of clubs and associations?
It is also possible to establish a link to the economy. As statistics show here,
92 percent of all land in Sweden is owned by companies and the state. This
means that the services provided by the land are largely affected by
economic interests. The right of public access2 has established the starting
2 In Sweden the general public has a right by law to access lands and water for recreation, berry picking and camping and more. More information about it is available at Naturvårdsverket, see reference list.

Sida 5 (12)
point that land is freely accessible, but that a company owning land has
control of how the land is used and may use it in its economic activity.
In Figure 3, which is a typical example of variables from the environmental accounts, landowners are categorised into service and goods production. The variables are the groups’ value added (their contribution to GDP), employed persons, carbon dioxide tax, use of fossil and biogenic fuel, greenhouse gases, forest land, pasture and land (which is the sum total of forest land, pasture and arable land, wetlands, built-up land and other land). This type of graph provides a snapshot of the structure for all of Sweden, showing who has the largest share of the various factors.
According to the figure, the largest proportion of land in Sweden is owned
by goods producers, including agriculture and forestry and paper and steel
manufacturing. The second largest group of owners comprise service
producers, including property management and government activities. From
a regional perspective the north of Sweden is owned by the government
through national parks and businesses like e.g. mining and quarrying. In the
suburbs however, it is a larger share of households owning land.
In general, service production contributes a major share of employment and value added (contribution to GDP) but owns a smaller share of land compared with agriculture and forestry.
Figure 3.
Environmental-economic profile by industry (NACE/ISIC) and households in 2014, percent of total value for the country
Footnote: * The data relates to 2015
Source: Statistics Sweden's environmental accounts
0% 10% 20% 30% 40% 50% 60% 70% 80% 90%
Land*
Pasture*
Forest*
Greenhousegas
Use of bio fuels
Use of fossil fuels
Carbon dioxide tax
Employment
Value added
Households
Producer of services
Producer of goods
Sida 6 (12)
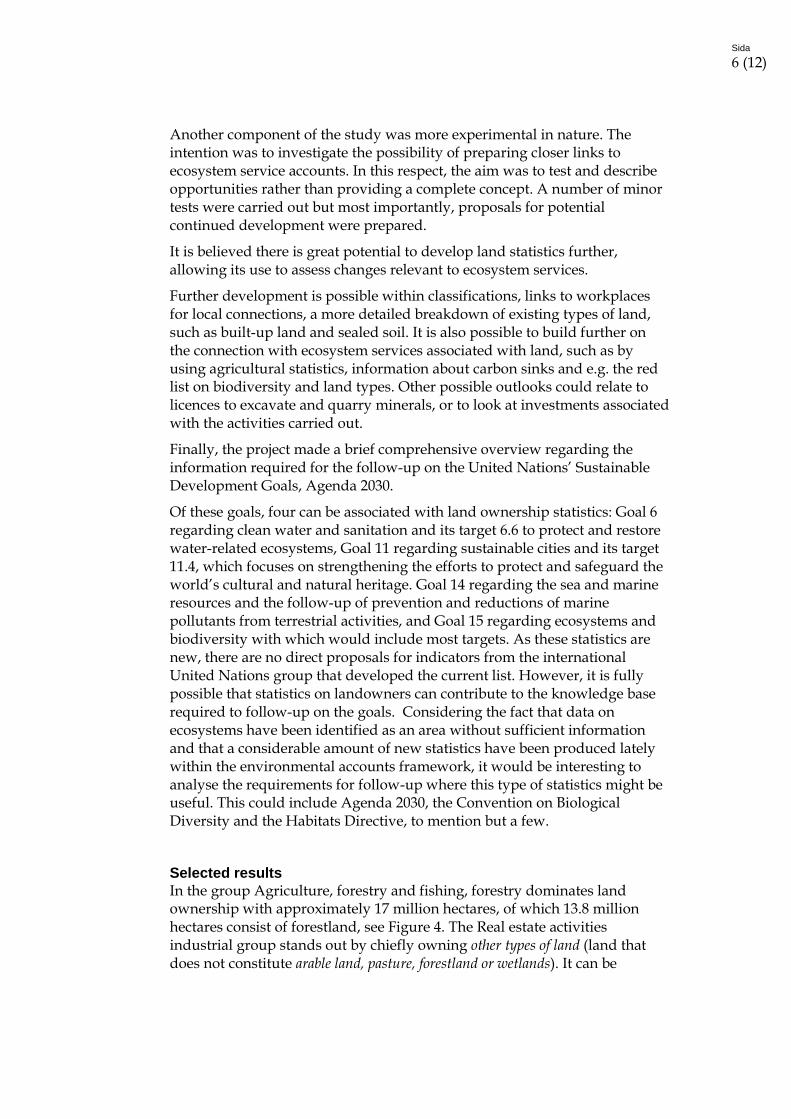
Another component of the study was more experimental in nature. The intention was to investigate the possibility of preparing closer links to ecosystem service accounts. In this respect, the aim was to test and describe opportunities rather than providing a complete concept. A number of minor tests were carried out but most importantly, proposals for potential continued development were prepared.
It is believed there is great potential to develop land statistics further, allowing its use to assess changes relevant to ecosystem services.
Further development is possible within classifications, links to workplaces for local connections, a more detailed breakdown of existing types of land, such as built-up land and sealed soil. It is also possible to build further on the connection with ecosystem services associated with land, such as by using agricultural statistics, information about carbon sinks and e.g. the red list on biodiversity and land types. Other possible outlooks could relate to licences to excavate and quarry minerals, or to look at investments associated with the activities carried out.
Finally, the project made a brief comprehensive overview regarding the information required for the follow-up on the United Nations’ Sustainable Development Goals, Agenda 2030.
Of these goals, four can be associated with land ownership statistics: Goal 6 regarding clean water and sanitation and its target 6.6 to protect and restore water-related ecosystems, Goal 11 regarding sustainable cities and its target 11.4, which focuses on strengthening the efforts to protect and safeguard the world’s cultural and natural heritage. Goal 14 regarding the sea and marine resources and the follow-up of prevention and reductions of marine pollutants from terrestrial activities, and Goal 15 regarding ecosystems and biodiversity with which would include most targets. As these statistics are new, there are no direct proposals for indicators from the international United Nations group that developed the current list. However, it is fully possible that statistics on landowners can contribute to the knowledge base required to follow-up on the goals. Considering the fact that data on ecosystems have been identified as an area without sufficient information and that a considerable amount of new statistics have been produced lately within the environmental accounts framework, it would be interesting to analyse the requirements for follow-up where this type of statistics might be useful. This could include Agenda 2030, the Convention on Biological Diversity and the Habitats Directive, to mention but a few.
Selected results
In the group Agriculture, forestry and fishing, forestry dominates land ownership with approximately 17 million hectares, of which 13.8 million hectares consist of forestland, see Figure 4. The Real estate activities industrial group stands out by chiefly owning other types of land (land that does not constitute arable land, pasture, forestland or wetlands). It can be

Sida 7 (12)
assumed on good grounds that it largely involves various types of built-up land, but as there is no input data for built-up land at present, this category cannot be distinguished in the statistics yet.
The Real estate activities industrial group is also the second largest owner of forestland, with approximately 1.5 million hectares of forestland, and of wetlands, with approximately 500 thousand hectares of open wetlands.
Manufacturing industries, including the manufacturing of pulp and paper, steel and furniture, constituted the fourth largest group of landowners in Sweden. Approximately 93 percent of the industrial group’s total land ownership is by companies in the pulp and paper manufacturing industry, and these companies primarily own forestland.
Figure 4.
Landowner by industry (ISIC) and type of land, 2015, percent of total type of land
Footnote: In addition to arable land, pasture and forest, the land type “land” includes all other unspecified types of land.
Source: Statistics Sweden's environmental accounts
Structural changes in society and the economy are also reflected in ownership structures. Even if changes in ownership occur slowly and therefore must be studied over relatively long time, certain changes can be observed also for shorter periods of time (approximately 4–5 years). For example, household ownership dropped by approximately 2 million hectares
0%
10%
20%
30%
40%
50%
60%
70%
80%
Agriculture,forestry and
fishery
Real estate Households Manufacturing Public sectorand defens
Other
Land Fields Pasture Forestry Open wetlands
Sida 8 (12)
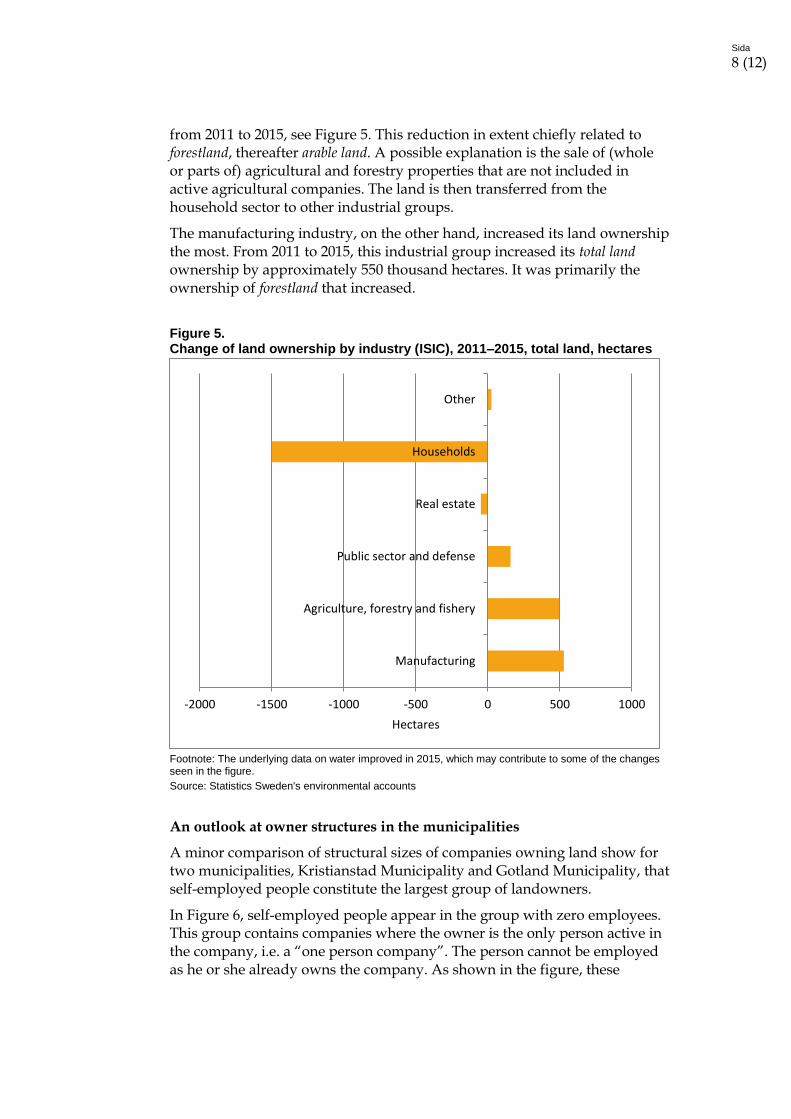
from 2011 to 2015, see Figure 5. This reduction in extent chiefly related to forestland, thereafter arable land. A possible explanation is the sale of (whole or parts of) agricultural and forestry properties that are not included in active agricultural companies. The land is then transferred from the household sector to other industrial groups.
The manufacturing industry, on the other hand, increased its land ownership the most. From 2011 to 2015, this industrial group increased its total land ownership by approximately 550 thousand hectares. It was primarily the ownership of forestland that increased.
Figure 5. Change of land ownership by industry (ISIC), 2011–2015, total land, hectares
Footnote: The underlying data on water improved in 2015, which may contribute to some of the changes seen in the figure.
Source: Statistics Sweden's environmental accounts
An outlook at owner structures in the municipalities
A minor comparison of structural sizes of companies owning land show for two municipalities, Kristianstad Municipality and Gotland Municipality, that self-employed people constitute the largest group of landowners.
In Figure 6, self-employed people appear in the group with zero employees. This group contains companies where the owner is the only person active in the company, i.e. a “one person company”. The person cannot be employed as he or she already owns the company. As shown in the figure, these
-2000 -1500 -1000 -500 0 500 1000
Manufacturing
Agriculture, forestry and fishery
Public sector and defense
Real estate
Households
Other
Hectares

Sida 9 (12)
smaller “one person companies” are the most common type of landowner on Gotland, with approximately 65 percent of the land area, and 63 percent in Kristianstad. The category “one person companies” often comprises small agricultural and forestry companies, which explains why they own such a large proportion of the land area.
Other conditions shown include that more large companies are landowners
in Kristianstad than on Gotland. It is also apparent from the figure that
trends differ between the municipalities. In Kristianstad, the proportion of
major companies owning land is growing, while it is declining in Gotland
Municipality. The same applies to households; in Kristianstad, their share is
growing, while it is decreasing in Gotland Municipality.
Figure 6. Gotland and Kristianstad – Company size, in number of employees, land total
Source: Statistics Sweden’s environmental accounts and the Real Estate Taxation Register
Applications closely connected to ecosystem services
The analysts and potential users of the results asked for more details of the properties of the land and therefore the project looked at how the results of the basic land account by industry could be applied to further analysis on the services connected to it.
One such example was a test on carbon sequestration. One of the most important forest-related ecosystem services is the regulation of the climate through carbon sequestration. The forest’s ability to sequester carbon in
0%
10%
20%
30%
40%
50%
60%
70%
250+employees
10-249employees
1-9 employees Zeroemployees
Households
Shar
e o
f to
tal l
and
Kristianstad_2015 Gotland_2015 Kristianstad_2011 Gotland_2011
Sida
10
(12)
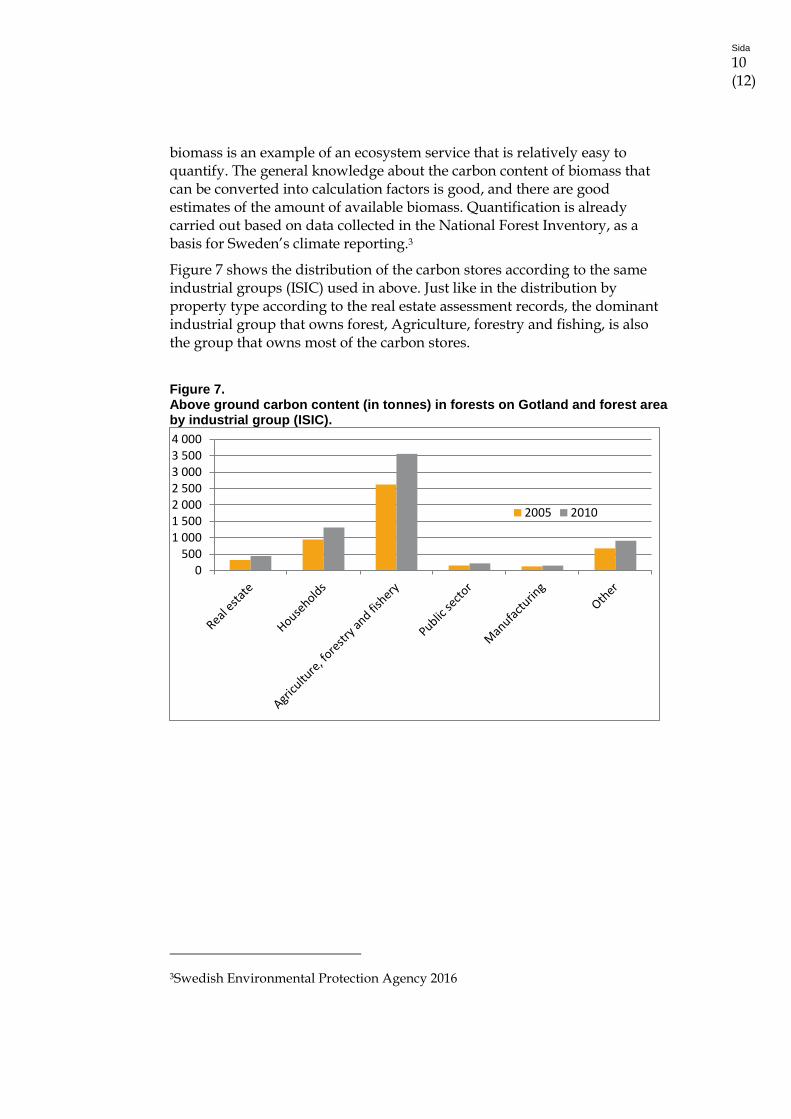
biomass is an example of an ecosystem service that is relatively easy to quantify. The general knowledge about the carbon content of biomass that can be converted into calculation factors is good, and there are good estimates of the amount of available biomass. Quantification is already carried out based on data collected in the National Forest Inventory, as a basis for Sweden’s climate reporting.3
Figure 7 shows the distribution of the carbon stores according to the same industrial groups (ISIC) used in above. Just like in the distribution by property type according to the real estate assessment records, the dominant industrial group that owns forest, Agriculture, forestry and fishing, is also the group that owns most of the carbon stores.
Figure 7. Above ground carbon content (in tonnes) in forests on Gotland and forest area by industrial group (ISIC).
3Swedish Environmental Protection Agency 2016
0500
1 0001 5002 0002 5003 0003 5004 000
2005 2010
Sida
11
(12)
Potential developments Statistics Sweden considers that the development of the production system that has now been developed for basic land accounts is finalised. The system is flexible and capable of reporting statistics with many different divisions, both thematic and geographic.
It is estimated that the foremost development potential lies in the use of other input data that may provide a better classification of the land. As described above, there is currently no alternative to the data sources at the national level used in the study. For the past few years, a consortium consisting of Statistics Sweden and a number of other authorities under the leadership of Metria has developed a concept for a new national land cover product4. As of 2016, the work in the consortium has continued, now under the leadership of the Swedish Environmental Protection Agency. The aim is to create a new national, regularly updated land cover map based on the European Sentinel satellite system. A new land cover product could replace and enhance the land data currently used in the project, resulting in with several significant advantages:
A more refined division of the existing types of land could be
reported
New types of land that are currently missing completely could be
reported, such as built-up land/sealed soil
A delimitation of land types based on land cover data should be
closer to existing official definitions, for example regarding forest
land (economically productive and unproductive, respectively).
Statistics produced based on land accounts would then harmonise
better with other statistics in the land use area.
There is potential for further development regarding other data sources and variables that can be linked to the land, such as the localisation of workplaces and combine this with more local data. This would enable a linking of the activities actually carried out with land use and the contributions it provides by way of income, production and environmental impact.
Each new data source should be evaluated based on its definitions and methods to allow an assessment of how well it agrees with existing land account statistics.
Accordingly, this is an example of how an ecosystem service that is also a benefit to the general public can be linked to the new landowners’ statistics using calculation factors. With more factors like these regarding the presence of various types of ecosystem services, advanced calculation systems can
4http://metria.se/CadasterENV/About-CadasterENV/
Sida
12
(12)
finally be developed, which in the long term will enable the creation of a framework for national statistics on ecosystem services.
It is also necessary to enhance the link between ecosystem services and land accounts, e.g. the significance for food supply and land availability and the impact of landownership on biodiversity and habitats.
Questions to the London group:
1. Do you see this type of analysis useful in the context linking SEEA CF to the SEEA EEA? Would you be willing to test it nationally?
2. Could this type of methodology and analysis be proposed to be included in an up-coming revision of the SEEA EEA?
3. Do you know of coefficients/factors available for the “production” of different ecosystems services by type of land? E.g. 1 square meter in area X produces Y kg blueberries, Z kg mushrooms, lowers CO2 emissions by 100 Kg etc? Such a list of coefficients could be beneficial to identify in up-coming revisions of the EEA manual/handbook.
References
Naturvårdsverket: Right of public access – a unique opportunity.
http://www.naturvardsverket.se/Documents/publikationer6400/978-91-620-8522-3.pdf?pid=4204
UNSD: SEEA Experimental Ecosystem Accounting: Technical recommendations. Consultation Draft V4.1: 6 March 2017
https://unstats.un.org/unsd/envaccounting/ceea/meetings/twelfth_meeting/SEEA%20EEA%20Tech%20Rec%20Consultation%20Draft%20II%20v4.1%20March2017.pdf
Statistics Sweden: Land accounts for ecosystem services. Environmental Accounts series 2017:1
https://www.scb.se/contentassets/6d29a226fcd34a0fa192c97c8ec339dc/mi1301_2015a01_br_mi71br1701eng.pdf
Statistics Sweden: Land accounts for biodiversity – a methodological study. Environmental Accounts series 2015:3
https://www.scb.se/Statistik/_Publikationer/MI1301_2014A01_BR_MI71BR1503.pdf