2467 presentation 2012
TRANSCRIPT
Presentation to the Financial CommunityPresentation to the Financial Community
March 2013March 2013
2012 Consolidated Results and 2013 Outlook
2012 Consolidated Results and 2013 Outlook

2
Forward-Looking Statements
By their nature, forward-looking statements are subject to risk and uncertainty since they are
dependent on upon circumstances which should or are considered likely to occur in the future
and are outside of the Company’s control. These include, but are not limited to: monetary
exchange and interest rate fluctuations, commodity price volatility, credit and liquidity risks,
HSE risks, the levels of capital expenditure in the oil and gas industry and other sectors,
political instability in areas where the Group operates, actions by competitors, success of
commercial transactions, risks associated with the execution of projects (including ongoing
investment projects), in addition to changes in stakeholders’ expectations and other changes
affecting business conditions.
Actual results could therefore differ materially from the forward-looking statements.
The Financial Reports contain in-depth analyses of some of the aforementioned risks.
Forward-looking statements are to be considered in the context of the date of their release.
Saipem S.p.A. does not undertake to review, revise or correct forward-looking statements
once they have been released, barring cases required by Law.
Forward-looking statements neither represent nor can be considered as estimates for legal,
accounting, fiscal or investment purposes. Forward-looking statements are not intended to
provide assurances and/or solicit investment.

3
Presentation Outline
Backlog Analysis
2013 Guidance
2012 Financial Results
Net Debt and Working Capital evolution
Looking Ahead

4
2012 Financial Results2012 Financial Results

5
Q4 2012 Financial Results
OnshoreDrillingOffshore OffshoreOnshore
Revenues EBITDA EBIT Net Profit(Mln €)
Q4 2012Q3 2012 Q4 2012Q3 2012 Q4 2012Q3 2012
249
180
3,5493,549591591
401401
% on Revenues509509
% on Revenues
(17.8%)
(54.4%)
(32.0%)
(7.6%)
(12.9%)
(26.6%)
(7.0%)
(13.9%)
3,4233,423
(17.7%)
(51.5%)
(30.8%)
(2.7%)
318318
(12.6%)
(26.6%)
(2.2%)
(13.4%)
% on Revenues
% on Revenues
(16.7%)
(14.9%)(11.3%)
(9.3%)
Q4 2012Q3 2012
Impact of completion of higher margin contracts Lower than expected recovery of claims from clients in E&C, mainly in onshore Slower activity during the last quarter of the year across E&C

6
FY 2012 Preliminary Financial Results
Dividend policy confirmed; €0.68 per share proposed for 2012
OnshoreDrillingOffshore Offshore
Onshore
Revenues EBITDA EBIT Net Profit
20122011 2012201120122011 20122011
921 902
941941
443443
518518
2,1352,135
233233
686686
222222
483483
1,4931,493
% on Revenues
102102
2,2072,207 % on Revenues
(18.5%)
(53.2%)
(31.5%)
(8.7%)
(13.5%)
(26.7%)
(8.1%)
(13.8%)
50755075
59455945
12,59312,593
833833
53565356
61756175
13,36913,369
10881088
750750740740
963963
578578
428428
238238
(18.0%)
(53.1%)
(31.7%)
(6.9%)
690690
293293
395395
1,4811,481
103103
(12.9%)
(26.9%)
(6.4%)
(13.7%)
% on Revenues
% on Revenues
(17.0%)(16.5%)
(11.9%) (11.1%)
(Mln €)

7
Capex
OnshoreOffshore
Drilling OffshoreOnshore
Outflows
Sources and uses of funds,Net Debt & D/E Ratio
3,1923,192
4,2784,278
Net Debt @ Dec. 2012
D/E =0.77D/E =0.77
Sources UsesNet Debt @Dec. 2011
D/E = 0.66D/E = 0.66
Inflows
Dividends & Shares Buyback
Capex
Cash Flow
2,7142,714
1,6281,628
(Net Profit +Depreciation)
Working Capital and Others
1,0151,015
FY 2012 Preliminary Financial Results
2011 2012
59591,0151,015
8484
525525
284284
122122
509509
509509
1,1991,199
323323
(Mln €)
122122
1,3761,376

8
Backlog AnalysisBacklog Analysis

9
FY 2012 Contract Acquisitions & Backlog
Contract Acquisitions Backlog
OnshoreDrillingOffshore OffshoreOnshore
12,50512,505
6,1316,131
5,0065,006
588588
780780
6,6006,600
3,3013,301
9,6049,604
20,41720,417
912912
20122011 Dec., 31 ’12Dec., 31 ’11
13,39113,391
3,9723,972
7,4777,477
1,0251,025917917
8,7218,721
3,2383,238
6,7016,701
1,0791,079
(Mln €)
19,73919,739

10
Backlog Analysis
Saipem Backlog € 19.7 Bln @ Dec., 31 2012
by Geo Area
by Client by Year of Execution
by Country – Local Content Focus
46%of present backlogin Countries where
Saipem has a strong Local Content Commitment
OnshoreOnshoreOffshoreOffshoreDrillingOff.Off. On.On.
4,7064,706 4,7104,7101,1271,127400
2013 Backlog split by Business Unit
11
Net Debt and Working Capital evolutionNet Debt and Working Capital evolution

3.2 3.2
Net Debt @ Dec 2011
Cash Flow
Capex
Dividend
Claims
Terms&Cond.
Expected Net Debt
@ Dec 2012
Sources of Funds Applications of Funds
Net Debt in 2012
1.61.6
1.01.0
4.3 4.3
Working Capital
(Bln €)
12
1.4 1.4

Net Debt in 2013E
(Bln €)4.3 4.3
Expected Net Debt
@ Dec 2012
Expected Net Debt
@Dec 2013
1.2 1.2
0.5 0.5
Capex
Dividend
Cash Flow
Sources of Funds Applications of Funds
13
Working Capital
0.3 0.3
0.2 0.2
4.2 4.2
Claims Terms&Cond.

14
2013 Guidance2013 Guidance
15
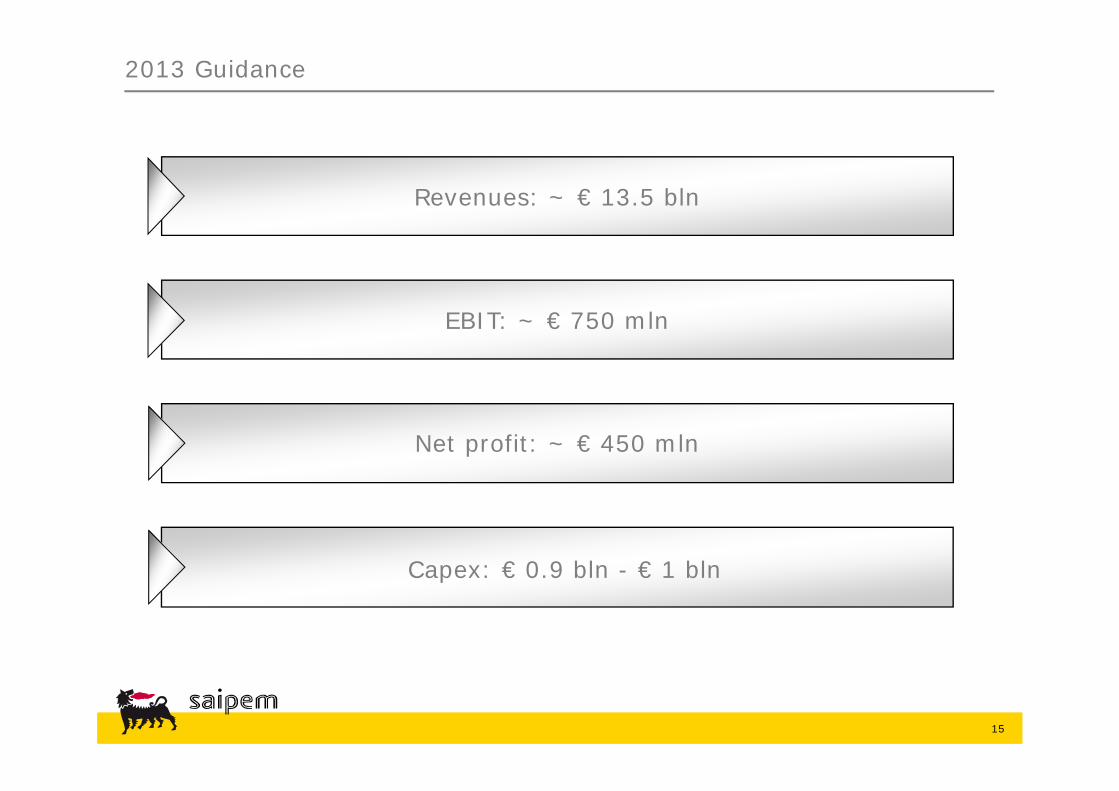
2013 Guidance
Revenues: ~ € 13.5 bln
EBIT: ~ € 750 mln
Net profit: ~ € 450 mln
Capex: € 0.9 bln - € 1 bln

2013 Drilling Outlook
Increasing market day-rates
Continued high utilisation of the fleet
Full year contribution of new-built DW semisubs Scarabeo 8 and Scarabeo 9
Full year contribution of Scarabeo 6
Short time to full operational efficiency of new-built rigs
In Offshore Drilling, revenues and margins are expected to increase thanks to:
In Onshore Drilling, outlook continues to be positive thanks to:
Positive and solid outlook for Drilling business based on the Saipem fleet’s long-term contractual commitment
EBIT: 20% increase compared to 2012
16

2013 E&C Outlook
E&C EBIT reduction vs 2012 due to a combination of factors:
17
A number of contracts with higher profitability have been completed in 2012 or are very close to completion
The majority of contracts to be executed in 2013 are lower margin and this reflects the highly competitive market conditions faced since 2009, after which these contracts were entered into
New large contract awards delayed with respect to previous expectations
The new management team has taken a more conservative approach to reflect market trends occurring in the second half of 2012, with particular reference to:
timing of new contract awards timing of new project execution estimates on margins
No provision judged necessary in relations to Algerian investigation to date

Comparison with FY2012 guidance for E&C(Bln €)
New expected contract awards reflecting the historical mix of marginsContracts awarded before 2013
Contracts completed in 2012 or close to completion
Contracts continuing in 2013 and beyond
E&C 2012 E&C 2013E
‘Structure’ Cost = commercial, idleness, R&D and G&A costs.
Revenues Sales Margin
1.5711.5
Revenues Sales Margin
11.4
0.72
EBIT EBIT
1.57(0.48)
1.09
‘Structure’ Cost0.72(0.48)
0.24
Sales Margin‘Structure’ Cost
Sales Margin
4.54.5
6.96.9
2.02.0
9.49.4
Sales Margin = project revenues – project costs;
18

Management projects a balanced profitability mix of new contracts
Contracts completed
E&C 2012 E&C 2013E
40%40%
60%60%
19
E&C 2014E
Existing lower margin contracts
80%80%
20%20%
35%35%
65%65%
Higher proportion of lower margin contracts
Evolution of portfolio mix in E&C
Previously expected new contracts currently delayed
New contracts

20
Existing E&C lower margin projects are phasing out
Ons
hore
Off
shor
e
21
Looking AheadLooking Ahead

22
Operational review
improved execution to capture project upsides
• closeness to clients across all project phases
• responsibility/accountability of decentralised operations
improved risk management
greater commercial discipline to protect margin and cash flow profile
The new management team has commenced a comprehensive operational review of the entire business
The outcome of this review will be presented at a seminar in early Spring 2013
The objective is to quickly ensure an operating structure to deliver:

Global E&P spending is set to further increase in 2013 by 7%* versus 2012 supporting ongoing opportunities for the Oil Services industry
23
Market Opportunities
E&P Spending Forecast*
* Source: Barclays Research, Global 2013 E&P Spending Outlook, December 2012
Increased focus on gas monetisation and LNG industry
Over 50% of giant discoveries took place in deep water over the last six years
More exploration and development drilling in ultra deep water and harsh environments
$ Bln

24
Bonga (Nigeria) Burullus 9B (Egypt) Carioca (Brazil) Egina (Nigeria) Jangkrik (Indonesia) Kaombo - Block 32 (Angola) Lula 2 fields (Brazil) Moho North (Congo) Mozambique - Anadarko (Mozambique) Mozambique - Eni (Mozambique) OPL 245 (Nigeria) Rabicoes (Brazil) Scarborough URF (Australia)
SURF/Subsea
Gendalo-Gehem FPU 2 units (Indonesia)
Kaombo (Block 32) FPSO (Angola) Masela FLNG (Indonesia) Moho FPU (Congo) Mozambique FLNG (Mozambique) Scarborough FLNG (Australia)
Floaters
Argo Cluster (Italy) Browse Package 1 (Australia) Kepodang (Indonesia) Rota 3 (Brazil) Shah Deniz Stage 2 (Azerbaijan) South Stream
Pipelines
Dragon-Patao (Venezuela) Lucapa (Angola) South Ndola (Angola) Tangguh (Indonesia)
Fixed Facilities
Large number of identified E&C Offshore opportunities - examples

25
4th Refinery (Kuwait) CFP Refinery (Kuwait) EuroChem Fertilizer
(Russia) Refineries Upgrade
(Nigeria) STAR Refinery (Turkey) Yara Belle Plaine (Canada)
Dgs ffd (Iraq) Eastern Urengoy Gas PF
(Russia) Ebocha (Nigeria) Midyan Gas Plant (Saudi) Petrojunin CPF
(Venezuela) Rabab - Harweel
Integrated Gas Plant (Oman)
Rumaitha Phase 3 (UAE)
Browse LNG (Australia) Kitimat LNG (Canada) Mozambique LNG Plant
(Mozambique) Shtockman 2+3
(Russia) Tangguh LNG
(Indonesia) Yamal LNG (Russia)
Brass LNG (Nigeria) Browse LNG (Australia) Coastal Highway for La
Réunion (France)
LNG Onshore
Downstream
Upstream Onshore
Arrow Pipeline (Australia) Explotación Sulfuros
Radomiro Tomic – Ph. II (Chile)
Junin 5 Pipelines (Venezuela)
OPL 245 (Nigeria) Strategic Pipeline (Iraq)
Pipelines
Marine Works
Large number of identified E&C Onshore opportunities - examples

26
Drivers for recovery
Strengthening of the Oil&Gas market and growing number of opportunities
Increased focus on new contracts from a profitability rather than revenue point of view
Expected positive impact from the operational review
Saipem strong competitive position for attractive E&C bidding opportunities in high value areas
Continued sustained drilling fleet utilization coupled with new day rates benefiting from a strengthened market outlook
Saipem is very well positioned to build a high quality order backlog

Mon Tue Wed Thu Fri Sat Sun
28 29
30
31 1 2 3
4 5 6 7
8 9 10
11 12 13
14 15 16 17
18
19 London
Barclays 1:1s (UV, HOD, SG, SC)
20 London Barclays 1:1s (UV, HOD, SG, SC)
21
22 23 24
25
26
27
28
Saipem Meetings - February 2013

lun mar mer gio ven sab dom
1 2 3
4 5 6 7 8 9 10
11 12 13 14 15 Milan Equita 1-1s
16 17
18 Paris (afternoon) Citi 1-1s
19 Paris (afternoon) Citi 1-1s
20
21 London UBS Conference Presentation, 1-1s
22 23 24
25 NY Mediobanca 1-1s
26 NY Mediobanca 1-1s
27 Boston Morgan Stanley 1-1s
28
29 30 31
Saipem Meetings - March 2013