25 years of collaborations in ieee intelligent systemsqpzhang/paper/is25_2011_1.pdf25 years of...
TRANSCRIPT

November/December 2010 1541-1672/10/$26.00 © 2010 IEEE 67Published by the IEEE Computer Society
A n A l y s i s
25 Years of Collaborations in IEEE Intelligent SystemsQingpeng Zhang and Zhuo Feng, University of Arizona
Xin Li, City University of Hong Kong
Xiaolong Zheng, Chinese Academy of Sciences
Liu Zhang, National University of Defense Technology, China
This article looks
at IEEE Intelligent
Systems’ 25-year
history and studies
the evolution
of scientific
collaboration among
IS authors through
coauthorship
network analysis.
of international researchers. Previously, Daniel O’Leary examined the key contribu-tors of IS from 1998 to 2008.2 This article looks at the entire 25-year history and fo-cuses on studying the evolution of scientific collaboration among IS authors through co-authorship network analysis. The analyses are conducted at researcher, institution, and country levels.
Data Set and MethodologyWe downloaded the metadata for IS arti-cles from the Institute for Scientific Infor-mation (ISI) Web of Science, an online aca-demic citation index provided by Thomson Reuters (www.isiknowledge.com). Because this database did not record the IS articles published in 1986, we collected such pa-pers from IEEE Xplore (http://ieeexplore.ieee.org). Our data set covers articles from 1986 (vol. 1, issue 1) to 2010 (vol. 25, issue 2).
IS magazine covers a wide range of in-formation. To investigate scientific collab-orations among researchers, we used only research reports such as paper submissions from authors and recommended by confer-ences as well as special issue guest editor in-troductions (which usually review the special issue’s subject area). We did not include other articles, such as book, database, hardware, and software reviews; news; corrections; let-ters; interviews; notes; biographical items; and EIC editorials, in our analysis. The final data set contains 1,870 research articles.
We adopted a social network analy-sis approach and studied the collabora-tions among IS researchers via their coau-thorship networks. This approach has been widely used in previous studies on scientific collaboration.3–8 In this article, we exam-ine the collaborations at researcher, institu-tion, and country and territory levels. In the researcher-level coauthorship network, each
In the past 25 years, IEEE Intelligent Systems (also named IEEE Expert
from 1986 to 1997 and IEEE Intelligent Systems and Their Applications
from 1997 to 2000) has witnessed the change in AI research topics and the
rapid development of the field.1 These changes happened under a joint effort
IS-25-06-Analysis2.indd 67 12/11/10 4:15 PM
68 www.computer.org/intelligent Ieee INTeLLIGeNT SYSTemS
A n A l y s i s
node corresponds to an IS author, and each link between two authors rep-resents that they have coauthored in IS. To construct the institution- and country-and-territory-level coauthorship networks, we aggregated researcher-level coauthor relations. The link be-tween two nodes indicates researchers from the corresponding institutions (or countries and territories) have co-authored in IS. This study treated all networks as undirected graphs.
Twenty-five years is not a short time in the history of computer sci-ence and AI. In this research, we ex-amined the evolution of coauthorship networks by separating the data set into multiple time periods. Instead of arbitrarily choosing segmentations, we separated the data set according to the coherence of article topics. We used the Compendex Classification
Code provided by Engineering Vil-lage (www.engineeringvillage.com) as an abbreviated representation of the topics. We compiled time series vectors on the portion of articles for each classification code in each year. We applied two basic time series seg-mentation algorithms:
• the Nearest Neighbor Algorithm,9 which separates the time series at points with the largest topic differ-ences between consecutive years, and
• the Bottom-Up Algorithm,10 which iteratively combines consecutive time segments according to their difference.
Both methods suggested that the most significant topic changes happened between 1993–1994 and 2004–2005. Thus, we separated the data set into
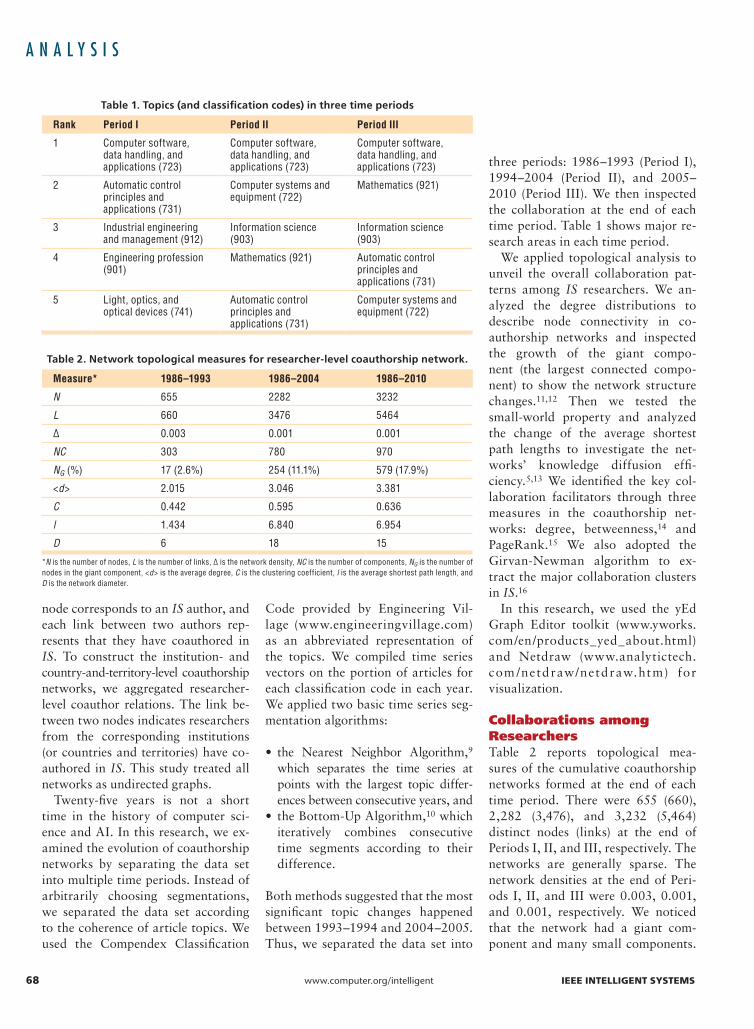
three periods: 1986–1993 (Period I), 1994–2004 (Period II), and 2005–2010 (Period III). We then inspected the collaboration at the end of each time period. Table 1 shows major re-search areas in each time period.
We applied topological analysis to unveil the overall collaboration pat-terns among IS researchers. We an-alyzed the degree distributions to describe node connectivity in co-authorship networks and inspected the growth of the giant compo-nent (the largest connected compo-nent) to show the network structure changes.11,12 Then we tested the small-world property and analyzed the change of the average shortest path lengths to investigate the net-works’ knowledge diffusion effi-ciency.5,13 We identified the key col-laboration facilitators through three measures in the coauthorship net-works: degree, betweenness,14 and PageRank.15 We also adopted the Girvan-Newman algorithm to ex-tract the major collaboration clusters in IS.16
In this research, we used the yEd Graph Editor toolkit (www.yworks.com/en/products_yed_about.html) and Netdraw (www.analytictech.com /netdraw/netdraw.htm) for visualization.
Collaborations among ResearchersTable 2 reports topological mea-sures of the cumulative coauthorship networks formed at the end of each time period. There were 655 (660), 2,282 (3,476), and 3,232 (5,464) distinct nodes (links) at the end of Periods I, II, and III, respectively. The networks are generally sparse. The network densities at the end of Peri-ods I, II, and III were 0.003, 0.001, and 0.001, respectively. We noticed that the network had a giant com-ponent and many small components.
Table 1. Topics (and classification codes) in three time periods
Rank Period I Period II Period III
1 Computer software, data handling, and applications (723)
Computer software, data handling, and applications (723)
Computer software, data handling, and applications (723)
2 Automatic control principles and applications (731)
Computer systems and equipment (722)
Mathematics (921)
3 Industrial engineering and management (912)
Information science (903)
Information science (903)
4 Engineering profession (901)
Mathematics (921) Automatic control principles and applications (731)
5 Light, optics, and optical devices (741)
Automatic control principles and applications (731)
Computer systems and equipment (722)
Table 2. Network topological measures for researcher-level coauthorship network.
Measure* 1986–1993 1986–2004 1986–2010
N 655 2282 3232
L 660 3476 5464
∆ 0.003 0.001 0.001
NC 303 780 970
NG (%) 17 (2.6%) 254 (11.1%) 579 (17.9%)
<d> 2.015 3.046 3.381
C 0.442 0.595 0.636
l 1.434 6.840 6.954
D 6 18 15
*N is the number of nodes, L is the number of links, ∆ is the network density, NC is the number of components, NG is the number of nodes in the giant component, <d> is the average degree, C is the clustering coefficient, l is the average shortest path length, and D is the network diameter.
IS-25-06-Analysis2.indd 68 12/11/10 4:15 PM
November/December 2010 www.computer.org/intelligent 69
The numbers of components NC were 303, 780, and 970, respectively. Because our research includes IS
articles, which cover a broad research area, it is not surprising to see sparse collaboration networks like these.
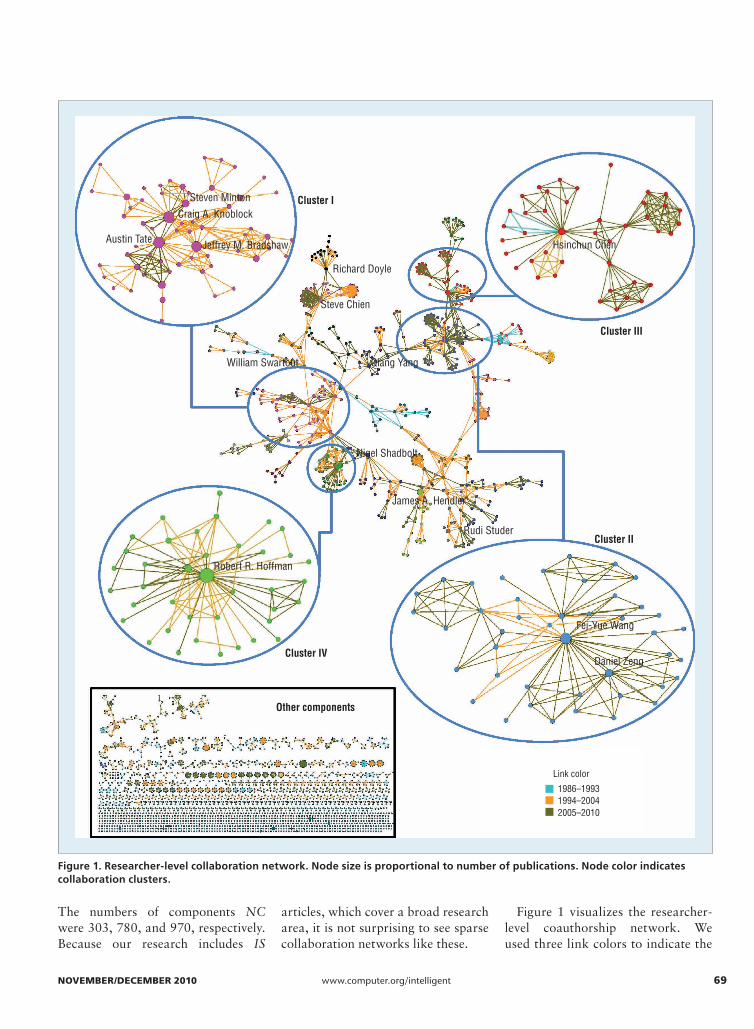
Figure 1 visualizes the researcher-level coauthorship network. We used three link colors to indicate the
Figure 1. Researcher-level collaboration network. Node size is proportional to number of publications. Node color indicates collaboration clusters.
Cluster III
Other components
Nigel Shadbolt
Qiang Yang
James A. Hendler
Steve Chien
Richard Doyle
William Swartout
Rudi Studer
Jeffrey M. Bradshaw
Craig A. Knoblock
Austin Tate
Steven Minton
Hsinchun Chen
Robert R. Hoffman
Cluster I
Cluster IV
Cluster II
Fei-Yue Wang
Daniel Zeng
Link color
1986–19931994–20042005–2010
IS-25-06-Analysis2.indd 69 12/11/10 4:15 PM
70 www.computer.org/intelligent Ieee INTeLLIGeNT SYSTemS
A n A l y s i s
collaborations that hap-pened in the three time periods: blue for Period I, orange for Period II, and olive green for Pe-riod III. Node size is pro-portional to the number of articles published by a corresponding author. The figure clearly shows the network change, es-pecially in the giant com-ponent. In Period I, col-laborations were sparse and nodes were dispersed into many small clusters. There were mainly small-scale collabora-tions. During Period II, a significant number of collaborations occurred, which connected small clusters to a chain structure. The major portion of the giant component was formed at this stage. After 2004 (Period III), more collaboration showed up and worked as shortcuts that further con-nect nodes in the giant component to a ring structure. The giant com-ponents contained 17, 254, and 579 nodes, which occupied 2.6, 11.1, and 17.9 percent of the entire network, respectively, for the networks at the end of the three time periods. This increasing trend shows that the inter-connections among IS authors were getting stronger. The IS research-ers were gradually forming a larger community.
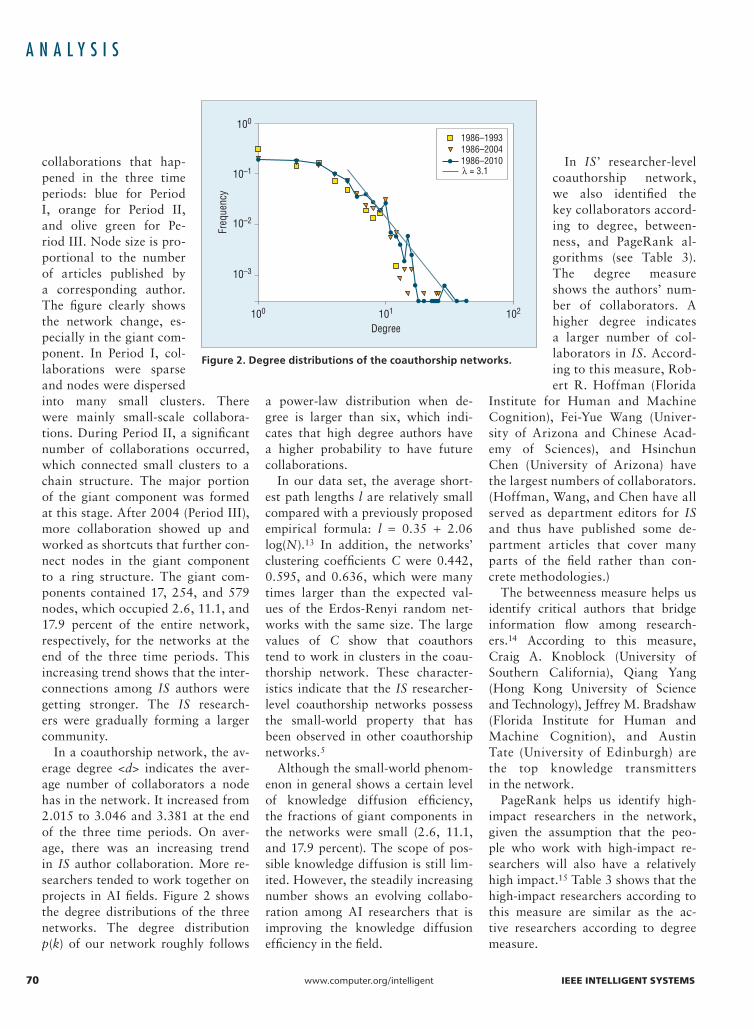
In a coauthorship network, the av-erage degree <d> indicates the aver-age number of collaborators a node has in the network. It increased from 2.015 to 3.046 and 3.381 at the end of the three time periods. On aver-age, there was an increasing trend in IS author collaboration. More re-searchers tended to work together on projects in AI fields. Figure 2 shows the degree distributions of the three networks. The degree distribution p(k) of our network roughly follows
a power-law distribution when de-gree is larger than six, which indi-cates that high degree authors have a higher probability to have future collaborations.
In our data set, the average short-est path lengths l are relatively small compared with a previously proposed empirical formula: l = 0.35 + 2.06 log(N).13 In addition, the networks’ clustering coefficients C were 0.442, 0.595, and 0.636, which were many times larger than the expected val-ues of the Erdos-Renyi random net-works with the same size. The large values of C show that coauthors tend to work in clusters in the coau-thorship network. These character-istics indicate that the IS researcher-level coauthorship networks possess the small-world property that has been observed in other coauthorship networks.5
Although the small-world phenom-enon in general shows a certain level of knowledge diffusion efficiency, the fractions of giant components in the networks were small (2.6, 11.1, and 17.9 percent). The scope of pos-sible knowledge diffusion is still lim-ited. However, the steadily increasing number shows an evolving collabo-ration among AI researchers that is improving the knowledge diffusion efficiency in the field.
In IS’ researcher-level coauthorship network, we also identified the key collaborators accord-ing to degree, between-ness, and PageRank al-gorithms (see Table 3). The degree measure shows the authors’ num-ber of collaborators. A higher degree indicates a larger number of col-laborators in IS. Accord-ing to this measure, Rob-ert R. Hoffman (Florida
Institute for Human and Machine Cognition), Fei-Yue Wang (Univer-sity of Arizona and Chinese Acad-emy of Sciences), and Hsinchun Chen (University of Arizona) have the largest numbers of collaborators. (Hoffman, Wang, and Chen have all served as department editors for IS and thus have published some de-partment articles that cover many parts of the field rather than con-crete methodologies.)
The betweenness measure helps us identify critical authors that bridge information flow among research-ers.14 According to this measure, Craig A. Knoblock (University of Southern California), Qiang Yang (Hong Kong University of Science and Technology), Jeffrey M. Bradshaw (Florida Institute for Human and Machine Cognition), and Austin Tate (University of Edinburgh) are the top knowledge transmitters in the network.
PageRank helps us identify high-impact researchers in the network, given the assumption that the peo-ple who work with high-impact re-searchers will also have a relatively high impact.15 Table 3 shows that the high-impact researchers according to this measure are similar as the ac-tive researchers according to degree measure.
Figure 2. Degree distributions of the coauthorship networks.
100
100 101
Degree102
10–1
10–2
10–3
Freq
uenc
y
1986–19931986–20041986–2010λ = 3.1
IS-25-06-Analysis2.indd 70 12/11/10 4:15 PM
November/December 2010 www.computer.org/intelligent 71
We adopted the Girvan-Newman algorithm to identify the major clus-ters (collaboration groups) in the IS coauthor network.16 Figure 1 shows clustering result using different node colors, and also the four biggest clusters.
The largest cluster (Cluster I in Figure 1) contains 60 nodes and has three hubs—Tate, Knoblock, and Bradshaw. They facilitate the knowl-edge diffusion between the US and Europe. Cluster II contains 43 nodes, including Fei-Yue Wang and his col-league Daniel Zeng (from the Univer-sity of Arizona and Chinese Academy of Sciences). Wang’s collaborators were mainly from the US and China. One unique characteristic of this clus-ter is that most collaboration happened after 2000, making it a relatively new collaboration group. Cluster III and IV contain 42 nodes and 39 nodes. They are centered by Hsinchun Chen and Robert R. Hoffman, respectively.
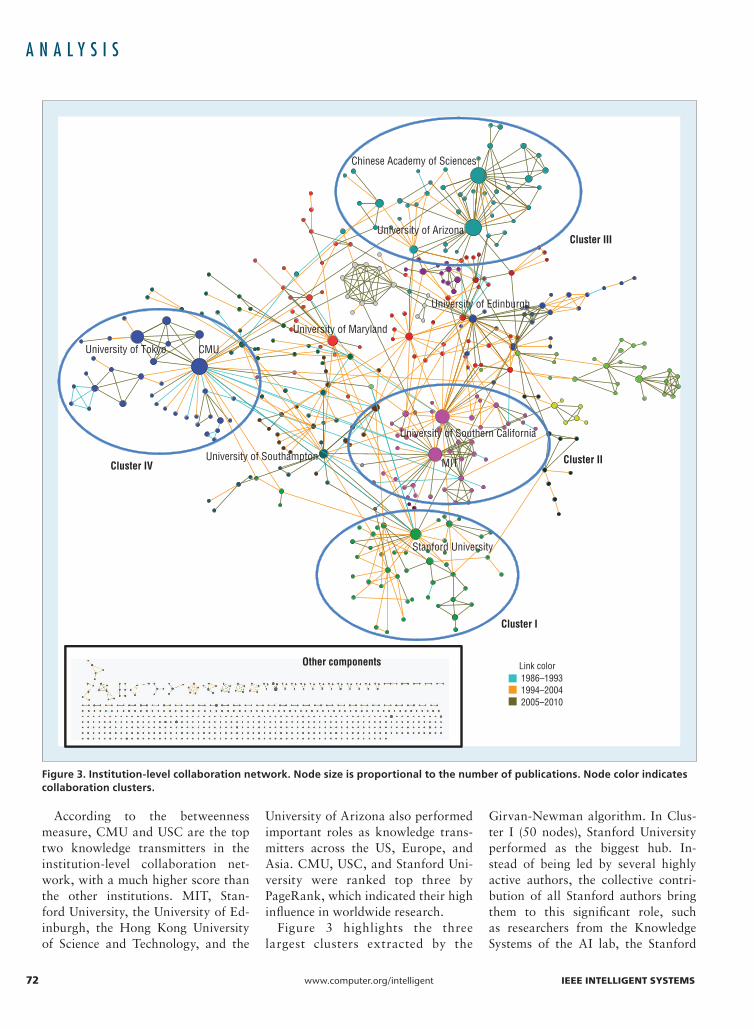
Collaborations between InstitutionsFigure 3 visualizes the institution-level collaboration network following the similar schema as the researcher-level network. Table 4 reports topo-logical measures of the networks. In institution level collaboration net-works, there were 246 (60), 664 (422) and 921 (867) distinct nodes (links) at the end of Period I, II, and III, respectively.
The networks are sparse, with the network densities close to 0.002 at the end of each time period. How-ever, the institution-level network shows a more interconnected pat-tern with a giant component occu-pying more than 40 percent of the nodes (until 2010). Similar to the researcher-level network, there were mainly local collaborations in Period I (nodes in the giant component were around Carnegie Mellon University). Starting from Period II, the giant component became much denser and bigger. The size of the giant compo-nent NG became 185. Several influ-ential institutions, such as the Uni-versity of Southampton, Chinese Academy of Sciences, University of West Florida (mainly contributed by Florida Institute for Human and Ma-chine Cognition, which became an independent institute in 2002), and Hong Kong University of Science and Technology, joined in at this time. In Period III, collaborations further en-forced the connections among exist-ing and new institutions, such as the collaborations among the University of Arizona, and many new Asian uni-versities. At the institution level, IS has been forming a close community in the past 25 years.
The average degree <d> of the institution-level network increased dramatically from 0.500 in Period I to 1.271 at the end of Period II. It continued to increase and reached
1.883 by the end of Period III. This observation further confirmed an increasing trend in interinstitution collaborations.
The institution-level networks also show a small-world phenomenon. They have small average shortest path lengths, 2.310, 4.506, and 4.575, respectively. The networks also have large clustering coefficients, 0.063, 0.205, and 0.279, respectively (compared to the expected values of the Erdos-Renyi random networks with the same sizes). The increasing trends of average degree and clus-tering coefficient indicate that the institution-level networks have be-come more clustered and the interin-stitution collaborations became much more frequent.
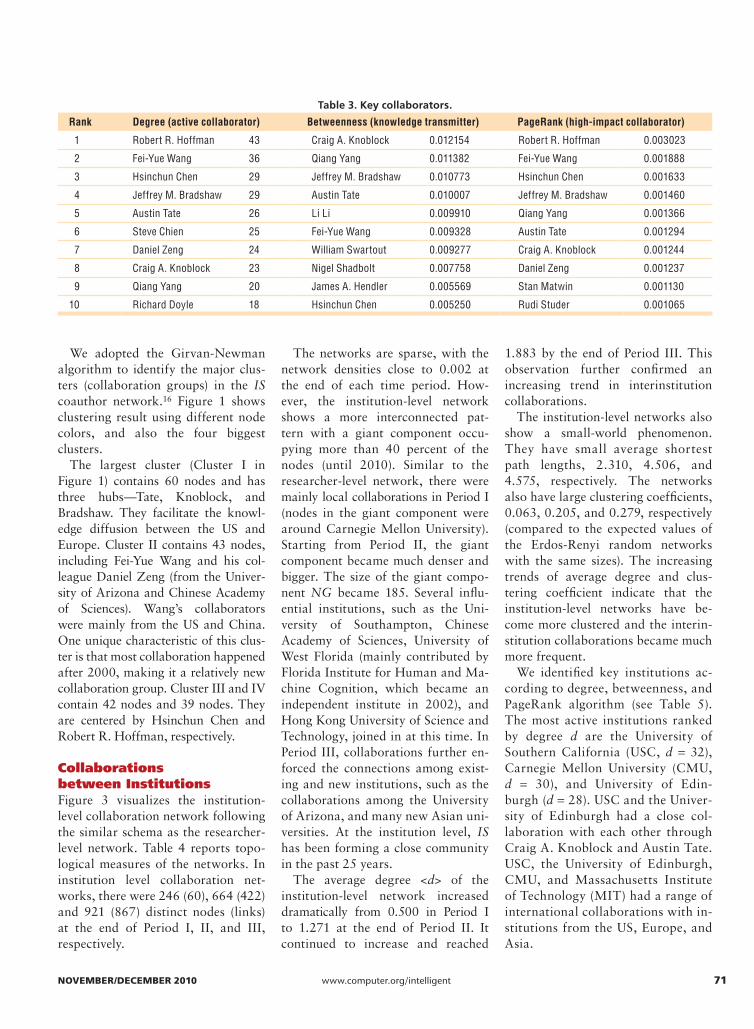
We identified key institutions ac-cording to degree, betweenness, and PageRank algorithm (see Table 5). The most active institutions ranked by degree d are the University of Southern California (USC, d = 32), Carnegie Mellon University (CMU, d = 30), and University of Edin-burgh (d = 28). USC and the Univer-sity of Edinburgh had a close col-laboration with each other through Craig A. Knoblock and Austin Tate. USC, the University of Edinburgh, CMU, and Massachusetts Institute of Technology (MIT) had a range of international collaborations with in-stitutions from the US, Europe, and Asia.
Table 3. Key collaborators.
Rank Degree (active collaborator) Betweenness (knowledge transmitter) PageRank (high-impact collaborator)
1 Robert R. Hoffman 43 Craig A. Knoblock 0.012154 Robert R. Hoffman 0.003023
2 Fei-Yue Wang 36 Qiang Yang 0.011382 Fei-Yue Wang 0.001888
3 Hsinchun Chen 29 Jeffrey M. Bradshaw 0.010773 Hsinchun Chen 0.001633
4 Jeffrey M. Bradshaw 29 Austin Tate 0.010007 Jeffrey M. Bradshaw 0.001460
5 Austin Tate 26 Li Li 0.009910 Qiang Yang 0.001366
6 Steve Chien 25 Fei-Yue Wang 0.009328 Austin Tate 0.001294
7 Daniel Zeng 24 William Swartout 0.009277 Craig A. Knoblock 0.001244
8 Craig A. Knoblock 23 Nigel Shadbolt 0.007758 Daniel Zeng 0.001237
9 Qiang Yang 20 James A. Hendler 0.005569 Stan Matwin 0.001130
10 Richard Doyle 18 Hsinchun Chen 0.005250 Rudi Studer 0.001065
IS-25-06-Analysis2.indd 71 12/11/10 4:15 PM
72 www.computer.org/intelligent Ieee INTeLLIGeNT SYSTemS
A n A l y s i s
According to the betweenness measure, CMU and USC are the top two knowledge transmitters in the institution-level collaboration net-work, with a much higher score than the other institutions. MIT, Stan-ford University, the University of Ed-inburgh, the Hong Kong University of Science and Technology, and the
University of Arizona also performed important roles as knowledge trans-mitters across the US, Europe, and Asia. CMU, USC, and Stanford Uni-versity were ranked top three by Page Rank, which indicated their high influence in worldwide research.
Figure 3 highlights the three largest clusters extracted by the
Girvan-Newman algorithm. In Clus-ter I (50 nodes), Stanford University performed as the biggest hub. In-stead of being led by several highly active authors, the collective contri-bution of all Stanford authors bring them to this significant role, such as researchers from the Knowledge Systems of the AI lab, the Stanford
Figure 3. Institution-level collaboration network. Node size is proportional to the number of publications. Node color indicates collaboration clusters.
CMUUniversity of Tokyo
University of Southern California
MIT
Stanford University
University of Southampton
University of Maryland
University of Arizona
Chinese Academy of Sciences
University of Edinburgh
Cluster I
Cluster IV
Other components
Cluster II
Cluster III
Link color1986–19931994–20042005–2010
IS-25-06-Analysis2.indd 72 12/11/10 4:15 PM

November/December 2010 www.computer.org/intelligent 73
Center for Biomedical Informatics Research, and many other labs and departments. In Cluster II (45 nodes), USC and MIT are major hubs with a large amount of international collab-orations across the world. Both Clus-ter III and Cluster IV have 34 nodes. In Cluster III, there are a number of Chinese institutions around the Uni-versity of Arizona and Chinese Acad-emy of Sciences. In Cluster III, CMU and the University of Tokyo acted as two key hubs. Both Cluster III and IV contain numerous American-Asian collaborations.
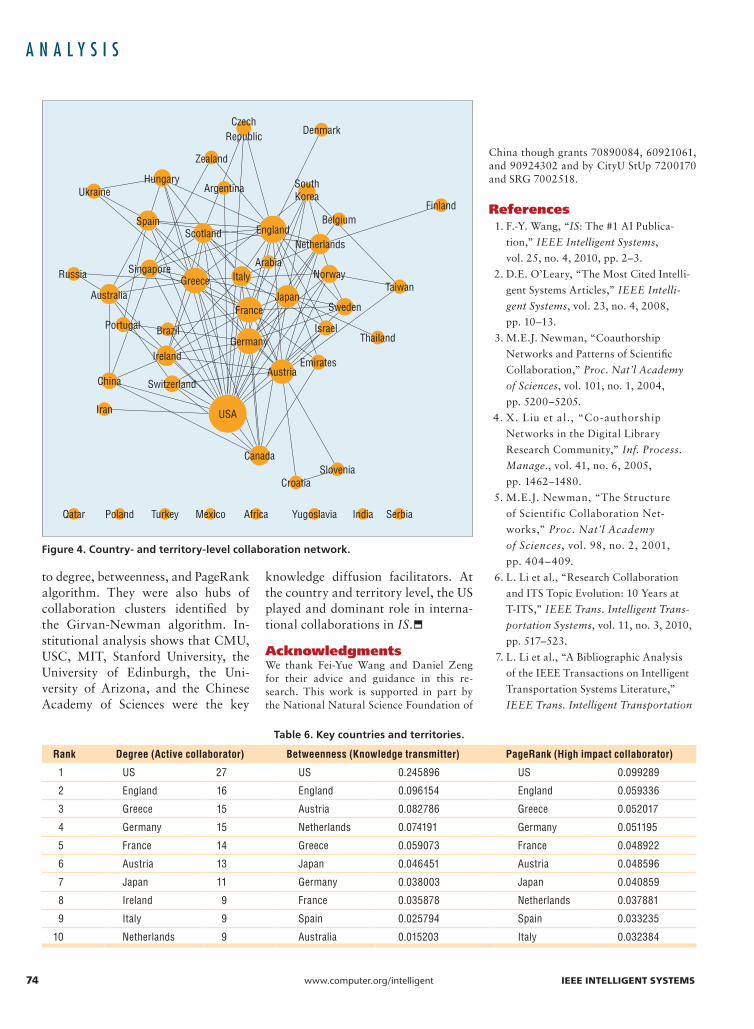
Collaborations across RegionsIn the past 25 years, researchers from 47 countries or territories have published in IS. Figure 4 visualized the country-and-territory-level col-laboration network until 2010. In this network, seven countries and territo-ries have a degree higher than 10: the US (27), England (16), Germany (15), Greece (15), France (14), Austria (13), and Japan (11). Most of the countries (39) are connected to the giant com-ponent. The small average shortest
path length l (2.108), diameter D (4), and large clustering coefficient C (0.424) show that it is a small-world network, which supports efficient knowledge transfer. Further inspec-tions show that most of the interna-tional collaborations appeared after 1994. After then, the average degree <d>, average shortest path length l, and clustering coefficient C increased significantly, indicating a fast growth of cross-country collaborations.
We ranked countries and territories according to degree, betweenness, and PageRank algorithm (see Table 6). The US holds an overwhelming lead according to all the measures, show-ing that the US dominated the AI research in IS in the past 25 years. Next, several other countries and
territories, such as England, Greece, Germany, Austria, and France, have similar scores, in different lists. They were the second batch of major knowledge diffusion facilitators in international AI research.
In this article, we analyzed the re-searcher-, institution-, and country-
and-territory-level collaboration networks in IS publications. We seg-mented the data into three time peri-ods according to the coherence of top-ics to study the network evolutions. We found that the collaborations have become denser over the past 25 years and there is a small-world prop-erty at all network levels. We identi-fied the key collaborators according
Table 5. Key institutions.
Rank Degree (active collaborator) Betweenness (knowledge transmitter) PageRank (high-impact collaborator)
1 University of Southern California (USC)
32 Carnegie Mellon University (CMU)
0.054917 CMU 0.011668
2 CMU 30 USC 0.053396 USC 0.010602
3 University of Edinburgh 28 Massachusetts Institute of Technology (MIT)
0.026234 Stanford University 0.009531
4 University of Arizona 25 Stanford University 0.023416 University of Arizona 0.009217
5 MIT 25 University of Edinburgh 0.023304 MIT 0.009071
6 Stanford University 23 Hong Kong University of Science and Technology
0.022065 University of Edinburgh 0.008697
7 Chinese Academy of Sciences
20 University of Arizona 0.02015 University of Southampton 0.007581
8 University of Southampton
18 University of Southampton 0.018265 University of Maryland 0.007141
9 University of West Florida
17 University of West Florida 0.017551 Stanford University 0.006953
10 University of Maryland 16 University of Maryland 0.016167 Chinese Academy of Sciences 0.006181
Table 4. Network topological measures for institution-level coauthorship network.
Measure 1986–1993 1986–2004 1986–2010
N 240 664 921
L 60 422 867
∆ 0.002 0.002 0.002
NC 190 378 421
NG (%) 16 (6.7%) 185 (27.9%) 380 (41.3%)
<d> 0.500 1.271 1.883
C 0.063 0.205 0.279
l 2.310 4.506 4.575
D 6 13 12
IS-25-06-Analysis2.indd 73 12/11/10 4:15 PM
74 www.computer.org/intelligent Ieee INTeLLIGeNT SYSTemS
A n A l y s i s
to degree, betweenness, and PageRank algorithm. They were also hubs of collaboration clusters identified by the Girvan-Newman algorithm. In-stitutional analysis shows that CMU, USC, MIT, Stanford University, the University of Edinburgh, the Uni-versity of Arizona, and the Chinese Academy of Sciences were the key
knowledge diffusion facilitators. At the country and territory level, the US played and dominant role in interna-tional collaborations in IS.
AcknowledgmentsWe thank Fei-Yue Wang and Daniel Zeng for their advice and guidance in this re-search. This work is supported in part by the National Natural Science Foundation of
China though grants 70890084, 60921061, and 90924302 and by CityU StUp 7200170 and SRG 7002518.
References1. F.-Y. Wang, “IS: The #1 AI Publica-
tion,” IEEE Intelligent Systems,
vol. 25, no. 4, 2010, pp. 2–3.
2. D.E. O’Leary, “The Most Cited Intelli-
gent Systems Articles,” IEEE Intelli-
gent Systems, vol. 23, no. 4, 2008,
pp. 10–13.
3. M.E.J. Newman, “Coauthorship
Networks and Patterns of Scientific
Collaboration,” Proc. Nat’l Academy
of Sciences, vol. 101, no. 1, 2004,
pp. 5200–5205.
4. X. Liu et al., “Co-authorship
Networks in the Digital Library
Research Community,” Inf. Process.
Manage., vol. 41, no. 6, 2005,
pp. 1462–1480.
5. M.E.J. Newman, “The Structure
of Scientific Collaboration Net-
works,” Proc. Nat’l Academy
of Sciences, vol. 98, no. 2, 2001,
pp. 404–409.
6. L. Li et al., “Research Collaboration
and ITS Topic Evolution: 10 Years at
T-ITS,” IEEE Trans. Intelligent Trans-
portation Systems, vol. 11, no. 3, 2010,
pp. 517–523.
7. L. Li et al., “A Bibliographic Analysis
of the IEEE Transactions on Intelligent
Transportation Systems Literature,”
IEEE Trans. Intelligent Transportation
Table 6. Key countries and territories.
Rank Degree (Active collaborator) Betweenness (Knowledge transmitter) PageRank (High impact collaborator)
1 US 27 US 0.245896 US 0.099289
2 England 16 England 0.096154 England 0.059336
3 Greece 15 Austria 0.082786 Greece 0.052017
4 Germany 15 Netherlands 0.074191 Germany 0.051195
5 France 14 Greece 0.059073 France 0.048922
6 Austria 13 Japan 0.046451 Austria 0.048596
7 Japan 11 Germany 0.038003 Japan 0.040859
8 Ireland 9 France 0.035878 Netherlands 0.037881
9 Italy 9 Spain 0.025794 Spain 0.033235
10 Netherlands 9 Australia 0.015203 Italy 0.032384
Figure 4. Country- and territory-level collaboration network.
CzechRepublic
Zealand
Argentina
EnglandScotland
HungaryUkraine
Spain
Russia
Australia
Portugal Brazil
Ireland
China
Iran
Qatar Poland Turkey Mexico Africa Yugoslavia India Serbia
USA
Canada
CroatiaSlovenia
EmiratesAustria
ThailandIsrael
Taiwan
Sweden
Norway
FinlandBelgium
Netherlands
Arabia
Japan
Germany
Switzerland
SingaporeGreece Italy
France
Denmark
SouthKorea
IS-25-06-Analysis2.indd 74 12/11/10 4:15 PM
November/December 2010 www.computer.org/intelligent 75
Systems, vol. 11, no. 2, 2010,
pp. 251–255.
8. B. Bringmann et al., “Learning and
Predicting the Evolution of Social
Networks,” IEEE Intelligent Systems,
vol. 25, no. 4, 2010, pp. 26–35.
9. V. Guralnik and J. Srivastava,
“Event Detection from Time Series
Data,” Proc. 5th ACM SIGKDD
(SIGKDD 99), ACM Press, 1999,
pp. 33–42.
10. E. Keogh et al., “Segmenting Time Series:
A Survey and Novel Approach,” Data
Mining in Time Series Databases, World
Scientific Publishing, 2003, pp. 1–21.
11. X. Shi et al., “Looking at the Blogo-
sphere Topology through Different
Lenses,” Proc. Int’l Conf. Weblogs and
Social Media (ICWSM 07), AAAI Press,
2007, pp. 153–160.
12. F.-Y. Wang et al., “A Study of the Human
Flesh Search Engine: Crowd-Powered
Expansion of Online Knowledge,”
Computer, vol. 43, no. 8, 2010,
pp. 45–53.
13. R. Albert et al., “The Diameter of the
World Wide Web,” Nature, vol. 401,
1999, pp. 130–131.
14. S. Wasserman and K. Faust, Social
Network Analysis: Methods and Ap-
plications, Cambridge University Press,
1994.
15. L. Page et al., The PageRank Citation
Ranking: Bringing Order to the Web,
Technical Report, Stanford Digital
Library Technologies Project, 1998.
16. M. Girvan and M.E.J. Newman,
“Community Structure in Social and
Biological Networks,” Proc. Nat’l
Academy of Sciences, vol. 99, no. 12,
2002, pp. 7821–7826.
T h e A u T h o r sQingpeng Zhang is a PhD student in the Department of Systems and Industrial Engineer-ing at the University of Arizona. Contact him at [email protected].
Zhuo Feng is a PhD student in the Department of Systems and Industrial Engineering at the University of Arizona. Contact him at [email protected].
Xin Li is an assistant professor in the Department of Information Systems at the City Uni-versity of Hong Kong. Contact him at [email protected].
Xiaolong Zheng is an assistant professor in the Chinese Academy of Sciences. Contact him at [email protected].
Liu Zhong is a professor in the College of Information Systems and Management at the National University of Defense Technology, China. Contact him at [email protected].
Selected CS articles and columns are also available for free at
http://ComputingNow.computer.org.
IS-25-06-Analysis2.indd 75 12/11/10 4:15 PM