2.510492a en mt-101 200 - frank's hospital workshop · h t s f o r s c h i l e r software on...
TRANSCRIPT

MT-101/MT-200
User Guide
Art.
no
.: 2.
5104
92 re
v.: b
*2.510492* For further information please visit our homepage
www.schiller.ch or send an e-mail to [email protected]
Part No. 2.100256
SCHILLER,CARDIOVIT,SPIROVIT,MIC
ROVI
T,SO
NO
VIT,
ARG
US,
SEM
Aa
nd
MIN
ISC
OPE
are
reg
iste
red
Tra
de
Ma
rks
and
Tra
de
Nam
es.
Allin
dus
trial a
ndcom
mercial p
ropertyrights for SCHILLER Software on this CD belong to SCHILLER
AG, Switzerland. A
ll rights
rese
rved. �
SCH
ILLER
AG
,C
H-6
341
Ba
ar,
Switze
rland
.Allo
thersta
tem
ents
and
tradenam
esbelongtotheirrespectiveholders.
SCHILLERS W I T Z E R L A N D
Version x.xx
SDS-200 2.01SDS-104 2.01SEMA-200 1.81SEMA-COMM 1.80MT-190/200 1.80MS-3 2.03BR-102 2.40Demo Sema-200Demo MT-200System SoftwareRelease NotesAcrobat Reader 4.0
ECG CHANNEL 1
SPEED x1 CHAN2
Microvit MT-101 Holter and MT-200 Evaluation Software

Headquarters AddressSCHILLER AG Phone: +41 (0) 41 766 42 42Altgasse 68 Fax: +41 (0) 41 761 08 80CH-6341 Baar, Switzerland E-mail: [email protected]: www.schiller.ch
Sales and Service InformationThe SCHILLER sales and service centre network is world-wide. For the addressof your local distributor, contact your nearest SCHILLER subsidiary. A completelist of all distributors and subsidiaries is provided on our Internet site: http://www.schiller.chSales information can also be obtained from: [email protected]
Article no.: 2.510492 rev.: bIssue date: 29.07.04

User Guide
Art.
no.:
2.51
0492
rev.
: b
MT-101/MT-200
Content1 General and Safety Notes ........................ 51.1 Physician's Responsibility ................................................. 51.2 Intended Use ......................................................................... 51.3 Organisational Measures..................................................... 51.4 Operational Precautions ...................................................... 61.5 Safety Equipment ................................................................. 61.6 Precautions for Operation with other Devices .................. 61.7 Maintenance.......................................................................... 61.8 Safety Symbols and Pictograms......................................... 7
2 Introduction .............................................. 82.1 MT-101/200 Range of Application ....................................... 82.2 MT-101 Components and Operation................................. 102.3 Operating and Display Elements ...................................... 112.3.1 Switching on..................................................................................... 112.3.2 Switching off..................................................................................... 112.3.3 Battery display.................................................................................. 112.3.4 Status display................................................................................... 112.4 MT-101 Menu Structure...................................................... 122.4.1 Menu Overview ................................................................................ 122.5 Initial Operation .................................................................. 132.5.1 Unpacking ........................................................................................ 132.5.2 Inserting/changing the battery.......................................................... 13
3 Preparing a Holter Recording ............... 143.1 Position of the Electrodes ................................................. 143.2 Commencing a Holter Recording...................................... 163.2.1 During the Recording and Patient Information ................................. 173.3 Taking an Extended Recording (Longer than 24 hours). 17
4 Transferring a Recording to the PC ...... 184.1 Data Transmission to PC from MT-101............................. 184.2 Data transmission to PC with Memory Card Reader....... 18
5 Displaying an ECG Signal ..................... 195.1 Starting a Recording from the MT-200 Program.............. 195.1.1 Pacemaker ....................................................................................... 215.2 Transmission Problems..................................................... 225.2.1 Checking the connection.................................................................. 23
6 Viewing and Editing a Recording ......... 246.1 Icons .................................................................................... 246.1.1 View icons ........................................................................................ 256.1.2 Function icons .................................................................................. 26
Page 1

User Guide
Art.
no.:
2.51
0492
rev.
: b
MT-101/MT-200
6.1.3 Tool icons in rhythm and zoom views .............................................. 276.2 Accessing and Opening Files ........................................... 286.3 Event & Zoom Views .......................................................... 296.4 Analysis Summary ............................................................. 316.5 Event Samples View........................................................... 336.6 ECG View............................................................................. 356.6.1 Selecting Channels for Display ........................................................ 366.6.2 Selecting Channels for Analysis....................................................... 366.6.3 Auto Scrolling ................................................................................... 366.7 Event Chart ......................................................................... 376.8 Heart Rate View .................................................................. 386.9 ST Trend View..................................................................... 396.10 Template Matching ............................................................. 416.10.1 Detailed Overview of the Template Classes .................................... 436.11 Pacemaker Templates........................................................ 456.11.1 Template classes ............................................................................. 466.12 Heart Rate Variability ......................................................... 496.13 Heart Rate Trend................................................................. 516.13.1 Jumping to the max/min Heart Rate or max/min NN Interval........... 516.13.2 Redefining the Max/Min Heart Rate and NN Interval ....................... 516.14 Reclassifying/Editing a QRS Complex ............................. 526.15 Analysing/Re-analysing the Recording............................ 546.16 Analysing Options.............................................................. 566.16.1 Arrhythmias ...................................................................................... 566.16.2 Manually Defining Arrhythmias ........................................................ 566.16.3 ST-episodes ..................................................................................... 576.16.4 Templates ........................................................................................ 576.16.5 Mode ................................................................................................ 576.17 Editing Patient Data/Recording......................................... 586.18 Printing ................................................................................ 616.18.1 Print preview / Printing a specific page ............................................ 616.18.2 Obtaining a printout:......................................................................... 626.18.3 Printing a selected half hour ECG segment ..................................... 62
7 Miscellaneous Functions ....................... 637.1 E-Mail and PDF Functions ................................................. 637.1.1 PDF files with Acrobat Reader ......................................................... 637.1.2 Editing PDF files............................................................................... 637.2 Saving a Recording ............................................................ 647.2.1 Saving a recording in MT-200 or PDF format .................................. 647.2.2 Sending a recording by e-mail ......................................................... 657.2.3 Importing recordings ........................................................................ 657.2.4 Exporting recordings ........................................................................ 657.3 Deleting a Recording.......................................................... 667.4 Accelerator Keys ................................................................ 67
8 System Settings and Options ............... 688.1 Print Formats ...................................................................... 688.1.1 Templates ........................................................................................ 688.1.2 Event samples.................................................................................. 698.1.3 Full disclosure (1, 2 or 3 channel) .................................................... 69
Page 2

User Guide
Art.
no.:
2.51
0492
rev.
: b
MT-101/MT-200
8.1.4 User-defined print formats................................................................ 708.2 Heart Rate Trend................................................................. 728.3 Amplitude/Speed ................................................................ 738.4 Pacemaker Templates........................................................ 748.5 System Settings.................................................................. 758.5.1 Print setup........................................................................................ 758.5.2 Units and language .......................................................................... 758.5.3 Directories ........................................................................................ 768.5.4 Data storage mode (auto delete) ..................................................... 768.5.5 USB / AT-card Connection and Test transmission Mode................. 768.5.6 GDT.................................................................................................. 778.5.7 Office Address.................................................................................. 778.6 User Identification .............................................................. 78
9 Maintenance ............................................ 799.1 Visual Inspection ................................................................ 799.2 Cleaning the device and cable assemblies...................... 809.2.1 Cleaning the device, electrode cable, and USB cable ..................... 80
10 Installation .............................................. 8110.1 System Requirements........................................................ 8110.2 Installation of MT-200 General Network License............. 8110.3 Network Licence Option .................................................... 8110.4 Unpacking ........................................................................... 8110.5 Installing the Hard-Lock Key ............................................. 8310.6 Installing the MT-200 Program from the CD..................... 8410.7 Installing a USB Driver....................................................... 84
11 Technical Data ........................................ 8511.1 Microvit MT-101 .................................................................. 8511.2 MT-200 Software ................................................................. 86
12 Options, Accessories and Disposables 8712.1 Complete Systems ............................................................. 8712.1.1 Software and Hardware Options ...................................................... 8712.1.2 Accessories ECG Holter system...................................................... 88
13 Patient Diary ........................................... 8913.1 Schiller CD .......................................................................... 89
14 Index ........................................................ 93
Page 3

Art.
no.:
2.51
0492
rev.
: b
MT-101/MT-200
Page 4

Art.
no.:
2.51
0492
rev.
: bGeneral and Safety Notes 1
User Guide Physician's Responsibility 1.1MT-101/MT-200
1 General and Safety Notes1.1 Physician's Responsibility
1.2 Intended Use
1.3 Organisational Measures
This Holter Recorder and PC program is provided for the exclusive use of qualified physicians or trained personnel under their direct supervision.The numerical and graphical results as well as any interpretation suggested by the device must be examined with respect to the patient's overall clinical condition and the quality of the recorded data.The responsibilities of the personnel for the operation and maintenance of the device must be specified.Make sure that the personnel have read and understood the user guide, and especially these safety notes.Damaged or missing parts must be replaced immediately.It is the owner's responsibility that the valid regulations for safety and prevention of accidents are observed.
The MT-101/MT-200 Holter and evaluation software is designed to record long-term electrocardiograms for the diagnosis of symptomatic and asymptomatic arrhythmias, i.e. bradycardia or tachycardia, and for patients after resuscitation or suffering from diseases such as cardiomyopathy, high blood pressure or long QT syndrome.There is no danger when using the device for a patient with a pacemaker fitted.Always observe the indicated technical data when operating the device.The device is not designed for sterile use.Do not use the device in areas where there is any danger of explosion or in the presence of flammable gases such as anaesthetic agents.
The device is CF classified. It is defibrillation protected when the original SCHILLER patient cable is used. However, as a safety precaution when possible, remove the electrodes before defibrillation.The device is not designed for direct cardiac application.
Before using the device, ensure that an introduction regarding its functions and the safety precautions has been provided by a product representative.Always store the user guide near the device. Make sure that the user guide is always complete and readable.Observe the safety notes for devices connected to the MT-101/MT-200.In addition to this user guide, also legal and other binding regulations for the prevention of accidents and for environment protection must be observed.
Page 5

1 General and Safety Notes1.4 Operational Precautions MT-101/MT-200
1.4 Operational Precautions
1.5 Safety Equipment
1.6 Precautions for Operation with other Devices
1.7 Maintenance
This user guide, and especially these safety notes, must be read and observed.Do not touch the unit casing during defibrillation.It must be ensured that neither the patient nor the electrodes come into contact with other persons or conducting objects (even if these are earthed).Changes, including operators behaviour, affecting safety must be immediately reported to the responsible person.
Operating this device without safety equipment or with damaged cables can endanger the health or life of the patient or the person operating the device! For this reason:
– Damaged cables and connections must immediately be replaced.
Use only accessories and other parts recommended or supplied by SCHILLER AG. The use of other than recommended or supplied parts may result in injury, inaccurate information and/or damage to the device.Accessory equipment connected to the analogue and digital interfaces must be certified according to the respective IEC standards (e.g. IEC/EN 60950 for data processing equipment and IEC/EN 60601-1 for medical equipment). Furthermore, all configurations shall comply with the valid version of the system standard IEC/EN 60601-1-1. Everyone who connects additional equipment to the signal input part or signal output part configures a medical system, and is therefore responsible that the system complies with the requirements of the valid version of the system standard IEC/EN 60601-1-1. If in doubt, consult the technical service department or your local representative.Special care must be exercised when the unit is used with high frequency equipment. To prevent the display of incorrect ECG signals, only use special SCHILLER ECG cables protected against high frequency radiation.There is no danger when using this device simultaneously with electrical stimulation equipment. However, the stimulation units should only be used at a sufficient distance from the electrodes. If in doubt, disconnect the patient from the recorder.
Do not use high temperature sterilisation processes (such as autoclaving). Do not use e-beam or gamma radiation sterilisation.Do not use aggressive or abrasive cleaners. Do not, under any circumstances, immerse the device or cable assemblies in liquid.
Page 6

Art.
no.:
2.51
0492
rev.
: bGeneral and Safety Notes 1
User Guide Safety Symbols and Pictograms 1.8MT-101/MT-200
1.8 Safety Symbols and Pictograms The safety level is classified according ANSI Z535.4. The following overview showsthe safety symbols and pictograms used in this handbook.
For a direct danger which could lead to severe personal injury or to death.
For a possibly dangerous situation, which could lead to bodily injury or to death.
For a possibly dangerous situation which could lead to personal injury. This symbol is also used to indicate possible damage to property.
For general safety notes as listed in this chapter. When this symbol is displayed on the unit, it means that the user should refer to the user guide.
Note for possible dangerous situations which could lead to damage to property or sys-tem failure. Important or helpful user information.
Reference to other guidelines.
Potential equalization.
CF symbol. This unit is classified safe for direct cardiac application. Only defibrillationprotected when used with the original SCHILLER patient cable.
The unit/component can be recycled.
Notified body of the CE certification (TÜV P.S.).
Is intended for infants weighing less then 10 kg.
Page 7

2 Introduction2.1 MT-101/200 Range of Application MT-101/MT-200
2 IntroductionThe SCHILLER Holter system comprises two main parts. The MT-101 Holter recorder and the MT-200 program. Recordings made by the MT-101 unit are downloaded to the MT-200 for display, storage and analysis.
2.1 MT-101/200 Range of ApplicationThe MICROVIT MT-101 Holter is designed to record long-term electrocardiograms for the diagnosis of symptomatic and asymptomatic arrhythmias, i.e. bradycardia and tachycardia, and for patients after resuscitation or suffering from diseases such as cardiomyopathy, high blood pressure or long QT syndrome.
The recording can also be used to help examine palpitations or syncopes and dizziness, to verify medical therapies, and to carry out subsequent treatments after a bypass operation or a PTCA. The ST segment analysis of an ECG recording allows the detection of a symptomatic or asymptomatic ischemia.
Good signal quality is vital for the success of a recording. The built-in Holter display, enables the ECG signal quality to be checked before starting, and the recording commenced directly from the device. This gives a high degree of reliability.
At the end of a recording, the data is transferred from the Holter recorder to a PC. The transfer of a recording typically only requires a few minutes.
The MT-200 is a PC based ECG evaluation program. An ECG is recorded using the SCHILLER MICROVIT MT-101 Holter. Two or 3-channel ECG recordings can be recorded over a period up to 72 hours. After the transfer of the recording data into the MT-200 program, the data can be displayed, saved, analysed and printed. The MT-200 program enables quick access to the recording data and displays the ECG and analysis data in a logical and understandable way for diagnosis.
For further information please visit our homepage
www.schiller.ch or send an e-mail to [email protected]
Part No. 2.100256
SCHILLER,CARDIOVIT,SPIROVIT,MIC
ROVI
T,SO
NO
VIT,
ARG
US,
SEM
Aa
nd
MIN
ISC
OPE
are
reg
iste
red
Tra
de
Ma
rks
and
Tra
de
Nam
es.
Allin
dus
trial a
ndcom
mercial p
ropertyrights for SCHILLER Software on this CD belong to SCHILLER
AG, Switzerland. A
ll rights
rese
rved. �
SCH
ILLER
AG
,C
H-6
341
Ba
ar,
Switze
rland
.Allo
thersta
tem
ents
and
tradenam
esbelongtotheirrespectiveholders.
SCHILLERS W I T Z E R L A N D
Version x.xx
SDS-200 2.01SDS-104 2.01SEMA-200 1.81SEMA-COMM 1.80MT-190/200 1.80MS-3 2.03BR-102 2.40Demo Sema-200Demo MT-200System SoftwareRelease NotesAcrobat Reader 4.0
Page 8

Art.
no.:
2.51
0492
rev.
: bIntroduction 2
User Guide MT-101/200 Range of Application 2.1MT-101/MT-200
The MT-200 includes analysis of the following:
Supraventricular Arrhythmias • supraventricular extrasystoles• couplets• triplets• chain of four or more SVES• (SV tach)• bigeminy• trigeminy
Sinus Rhythm Alterations • tachycardia• bradycardia• pause• abs. arrhythmias
Ventricular Arrhythmias • ventricular extrasystoles• couplets (VES chain)• triplets• chain of four or more VES • (V tach)• bigeminy• trigeminy• R on T
Heart Rate Trend • calculated over 4, 8 or 16 beats and• averaged over 1 to 10 minutes
ST Trend • setting of the distance from J-point for ST measurement (J-point + 10 to 100 ms)• episodes detected separately for channel 1, and/or channel 2, and/or channel 3
when ST level is exceeded (1 to 3 mm)
Pacemaker • 6 pacemaker templates• heart rate variability• tachograms and tabular presentation after analysis of the recording
Page 9
2 Introduction2.2 MT-101 Components and Operation MT-101/MT-200
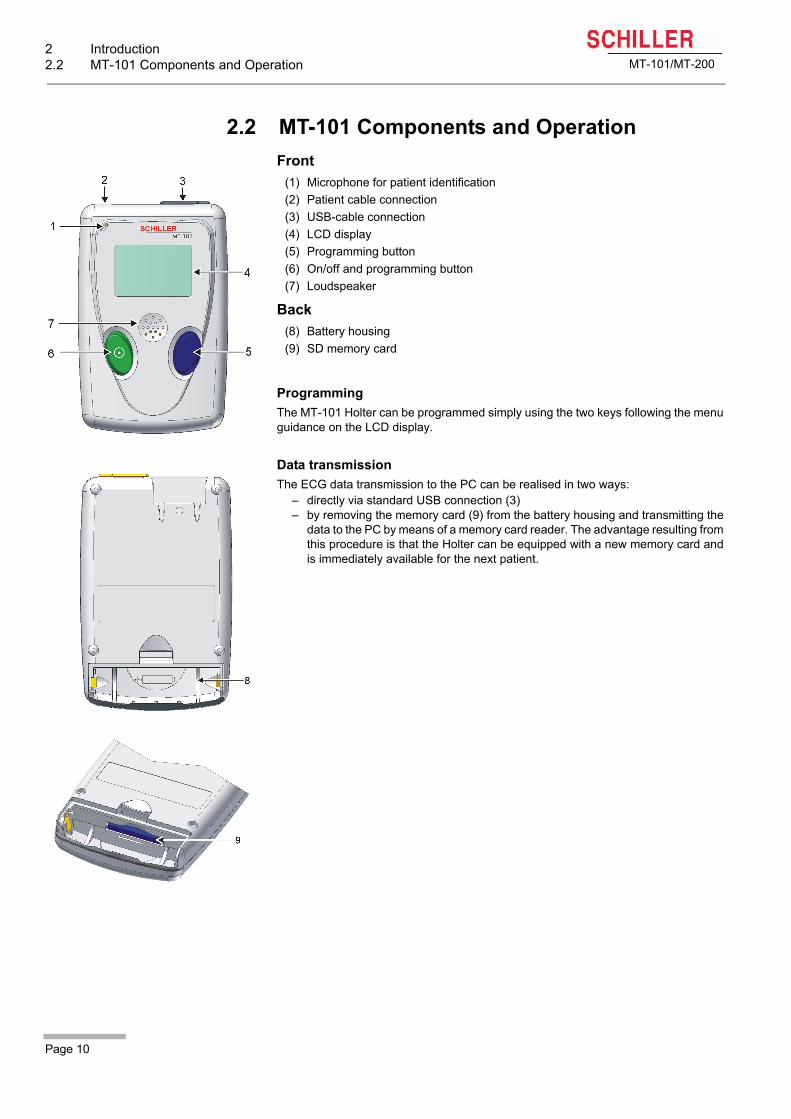
2.2 MT-101 Components and OperationFront
(1) Microphone for patient identification(2) Patient cable connection(3) USB-cable connection (4) LCD display(5) Programming button(6) On/off and programming button(7) Loudspeaker
Back(8) Battery housing(9) SD memory card
ProgrammingThe MT-101 Holter can be programmed simply using the two keys following the menuguidance on the LCD display.
Data transmissionThe ECG data transmission to the PC can be realised in two ways:
– directly via standard USB connection (3)– by removing the memory card (9) from the battery housing and transmitting the
data to the PC by means of a memory card reader. The advantage resulting fromthis procedure is that the Holter can be equipped with a new memory card andis immediately available for the next patient.
Page 10

Art.
no.:
2.51
0492
rev.
: bIntroduction 2
User Guide Operating and Display Elements 2.3MT-101/MT-200
2.3 Operating and Display ElementsThe Microvit MT-101 is operated with the two buttons and the menu guidance on theLCD. The green key with the switching-on symbol is used additionally to switch thedevice on and off.
2.3.1 Switching onPress the green button. The display shows the name and version number of the de-vice before the main menu is displayed.
2.3.2 Switching offKeep the green button pressed for five seconds. When the button is released, the de-vice is switched off. If an ECG recording is running, first stop it following the same pro-cedure.If no recording is running, the device will be switched off automatically after five min-utes.
2.3.3 Battery displayThe battery symbol indicates the battery's load status. If the battery is full, the symbolis solid - also see para. 2.5.2 Inserting/changing the battery, page 13.
2.3.4 Status displayThe operating status is displayed in the left upper corner of the LCD. REC for record-ing, USB if the MT-101 is connected to a PC, USB* for data transmission to a PC.
Status 15:45
Functions of the blue button:OKCHANGEEVENTYESCHANN2/3
NEXT OK
Functions green button:On/offNEXTEVENTSPEED 1x - 3xNO
Page 11
2 Introduction2.4 MT-101 Menu Structure MT-101/MT-200
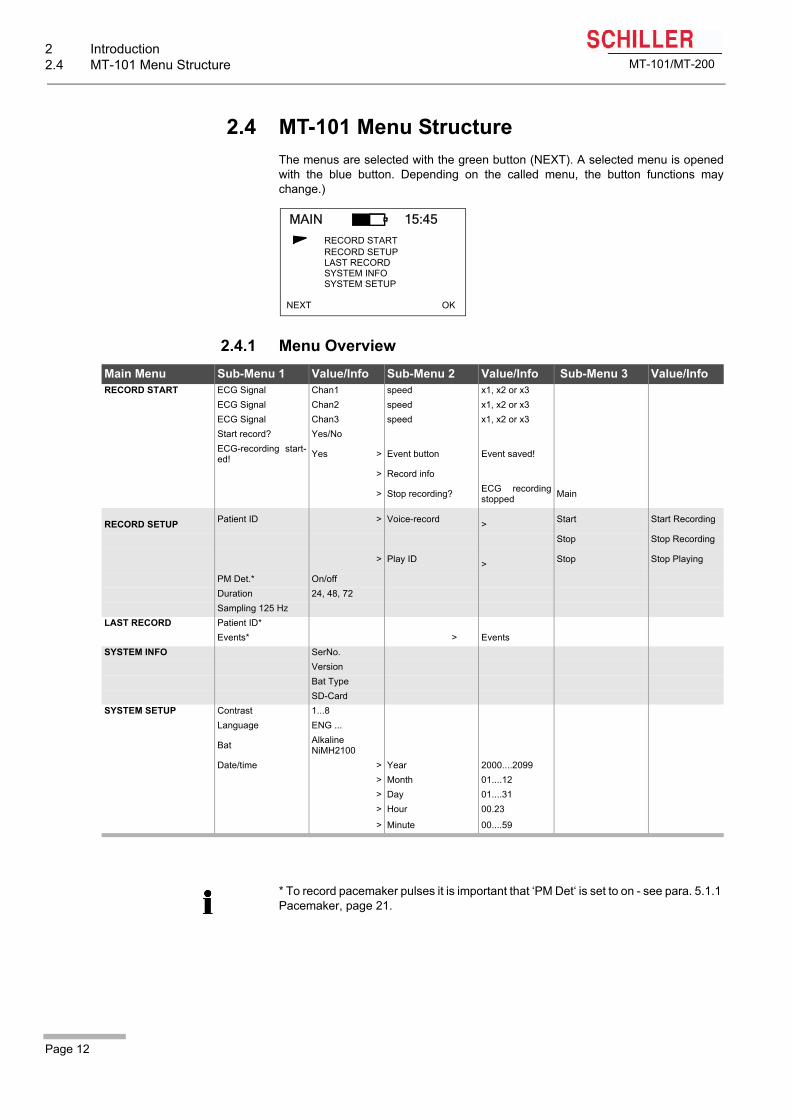
2.4 MT-101 Menu StructureThe menus are selected with the green button (NEXT). A selected menu is openedwith the blue button. Depending on the called menu, the button functions maychange.)
2.4.1 Menu Overview
MAIN 15:45
RECORD STARTRECORD SETUPLAST RECORDSYSTEM INFOSYSTEM SETUP
NEXT OK
Main Menu Sub-Menu 1 Value/Info Sub-Menu 2 Value/Info Sub-Menu 3 Value/InfoRECORD START ECG Signal Chan1 speed x1, x2 or x3
ECG Signal Chan2 speed x1, x2 or x3ECG Signal Chan3 speed x1, x2 or x3Start record? Yes/NoECG-recording start-ed! Yes > Event button Event saved!
> Record info
> Stop recording? ECG recordingstopped Main
RECORD SETUP Patient ID > Voice-record > Start Start Recording
Stop Stop Recording
> Play ID > Stop Stop Playing
PM Det.* On/offDuration 24, 48, 72Sampling 125 Hz
LAST RECORD Patient ID*Events* > Events
SYSTEM INFO SerNo.VersionBat TypeSD-Card
SYSTEM SETUP Contrast 1...8Language ENG ...
Bat AlkalineNiMH2100
Date/time > Year 2000....2099 > Month 01....12 > Day 01....31 > Hour 00.23
> Minute 00....59
* To record pacemaker pulses it is important that ‘PM Det‘ is set to on - see para. 5.1.1 Pacemaker, page 21.
Page 12

Art.
no.:
2.51
0492
rev.
: bIntroduction 2
User Guide Initial Operation 2.5MT-101/MT-200
2.5 Initial Operation
2.5.1 UnpackingCheck that all ordered items are present and free of shipping damage. Immediatelyreport any damage to SCHILLER AG.
2.5.2 Inserting/changing the battery
Switch on the device and check the battery charge capacity. The battery symbol must be fully black. This corresponds to a maximum recording time of 24 hours.
An audible and visual indication is given during recording when battery capacity is limited. The time will vary according to the type of battery installed (alkaline or NiMH2100) - but is normally between 1 and 2 hours. When the alarm is given and recording is to be continued, we recommend that the battery is replaced at the first opportunity - see para. 2.5.2 Inserting/changing the battery, page 13
When recording is stopped because of low battery capacity, and the battery is replaced within 5 hours of the unit switching off, the recording will continue - see para. 3.2.1 During the Recording and Patient Information, page 17.
Open the battery compartment and insert the supplied battery or accumulator. Ob-serve the polarity!
NoteThe delivered battery is of alkaline type AA/LR6. If you use an NiMH 2100 mAh accu-mulator, make sure that BAT NiHM is selected in the SYSTEM SETUP menu. If thewrong type is selected, the battery capacity will not be displayed correctly.
On closing the battery cover, pay attention that the two lugs (A) are inserted correctly.The cover is closed in the direction indicated by the arrow (B). In order to engage thecover, press it down (at position C) until it clicks in place.
Attention - danger of explosion Do not dispose of batteries by fire or incinera-tor.Attention - danger of acid burn Do not open the battery casing.
Only dispose of batteries in official recycling centres or municipally approved areas.
FullHalf fullEmpty
Page 13

3 Preparing a Holter Recording3.1 Position of the Electrodes MT-101/MT-200
3 Preparing a Holter Recording
3.1 Position of the ElectrodesTypical electrode position for a 4-lead cable (2-channel recording)The recommended electrode placement for a 2-channel recording is shown below.
Typical electrode placement for a 6-lead cable (3-channel recording)The recommended electrode placement for a 3-channel recording is shown below.
Channel 1 positive (K1+) = greenChannel 1 negative (K1-) = redChannel 2 positive (K2+) = whiteChannel 2 negative (K2-) = yellow
Channel 1 positive (K1+) = greenChannel 1 negative (K1-) = redChannel 2 positive (K2+) = whiteChannel 2 negative (K2-) = yellowChannel 3 positive (K3+) = orange (positioned on the patient’s back)Channel 3 negative (K3-) = blue
12345
12345
K2 +K2 +
K1 +
K2 -K2 -
K3 -
K3 +
K1-
Page 14

Art.
no.:
2.51
0492
rev.
: bPreparing a Holter Recording 3
User Guide Position of the Electrodes 3.1MT-101/MT-200
Electrode PlacementForm a stress loop in every cable and secure them with adhesive strips to relieve theelectrodes (strain relief). In order to ensure good data evaluation, the ECG amplitudesshould be examined in the sitting, lying and standing position of the patient.
Holter ECGs use a bipolar lead system (one positive and one negative lead) for eachchannel. Channel 1 approximates to modified lead V5, channel 2 approximates tomodified lead V2 and channel 3 approximates to modified lead V3.
Channel 1 Place the RED negative electrode under the clavicle on the right Sternal margin.Place the GREEN positive electrode in the fifth left intercostal space on the anterioraxillary line (position approximately equates to V5).
Channel 2 Place the YELLOW negative electrode under the clavicle on the left sternal margin.Place the WHITE positive electrode in the fourth left intercostal space on the anterioraxillary line (position approximately equates to V2).
Channel 3 Place the BLUE negative electrode in the fourth left intercostal space near the ster-num. Place the ORANGE positive electrode on the back in the fifth left intercostal space,between the spine and the scapula (position approximately equates to V3).
• The above electrode placement is suggested; other electrode configurations arepossible.
• Ensure that the QRS complex is bigger than the T wave. • Ensure that the trace is larger than 1mV. See 1mV reference (4) on following page.• To avoid artifacts in women patients, the red and white electrodes can be placed
lower if necessary.
Page 15

3 Preparing a Holter Recording3.2 Commencing a Holter Recording MT-101/MT-200
3.2 Commencing a Holter RecordingThe ECG recording can be started without the MT-200 PC software. The most impor-tant data can be entered in the MT-101 directly, and the ECG signal examined directlyon the LCD.
A recording can also be started from the MT-200 program where all channels can be viewed simultaneously before commencing - see para. 5.1 Starting a Recording from the MT-200 Program, page 19.
Preparing the patient1. Attach electrodes to patient.
Setting up the Holter MT-1012. Press button (1) to switch on MT-101. Check battery charge capacity. If the sym-
bol is only half filled out, change battery.3. Choose NEXT (1) to select RECORD SETUP menu to make recording settings:
– Patient ID - record patient ID using the microphone and playback facility– Select Pacemaker detection on or off - see para. 5.1.1 Pacemaker, page 21– Define period of recording - 24, 48 or 72 hours
Checking the ECG signal4. Connect patient cable to MT-101 (3).5. Confirm RECORD START menu with “OK” (2) and check ECG signal Channel 1.
Press CHAN2/3 to select and check channel 2/3. Press “OK” (2) to accessSTART RECORDING panel.
The signal's max. amplitude corresponds to the height of the moving line (5). The 1mVamplitude reference is the vertical line on the left (4). Ensure the signal amplitude isgreater than 1mV.
Starting an ECG recording6. Confirm the start of the recording with YES (2).
Stopping the ECG recording7. Press and hold button (1) for 5 seconds. You will be prompted if you wish to stop
the recording. Confirm with YES (2). NOTE: If no confirmation is received to cease recording (button (2) pressed), within 15 seconds, the unit returns to recording mode.
Switching off the MT-1018. If the unit is recording, first stop the recording step (7). 9. Ensure the main menu is displayed and that the cursor is at the RECORD START
position. 10. Press and hold button (1) for 5 seconds to switch the device off.
ECG
SPEED x1
3
4
5
1 2
Page 16
Art.
no.:
2.51
0492
rev.
: bPreparing a Holter Recording 3
User Guide Taking an Extended Recording (Longer than 24 hours) 3.3MT-101/MT-200
3.2.1 During the Recording and Patient InformationInform the patient about the use of the MT-101.
Event record• Every event should be entered in the diary, together with the time, the activities at
the time of occurrence and the symptoms.• Instruct the patient to press the EVENT button at any time during the recording to
register an event as follows:1. Press button (1 or 2).2. Record event in the patient diary.Note:The template for the patient diary is stored on the software CD as Word or pdf file. An example is given at the end of the book - see para. 13 Patient Diary, page 89.
No ECG signal or lead-off1. Check cable connection on device. 2. Check cable connection on electrodes.3. Re-attach electrodes to body.
General informationThe device is not waterproof. The patient should be advised not to take a bath or shower during the recording.
3.3 Taking an Extended Recording (Longer than 24 hours)The MT-101 can record up to 72 hours of Holter data if required. To make a recording longer than 24 hours, the battery in the MT-101 must be changed as detailed above. An audible alarm and visual indication will be given when the battery must be changed.
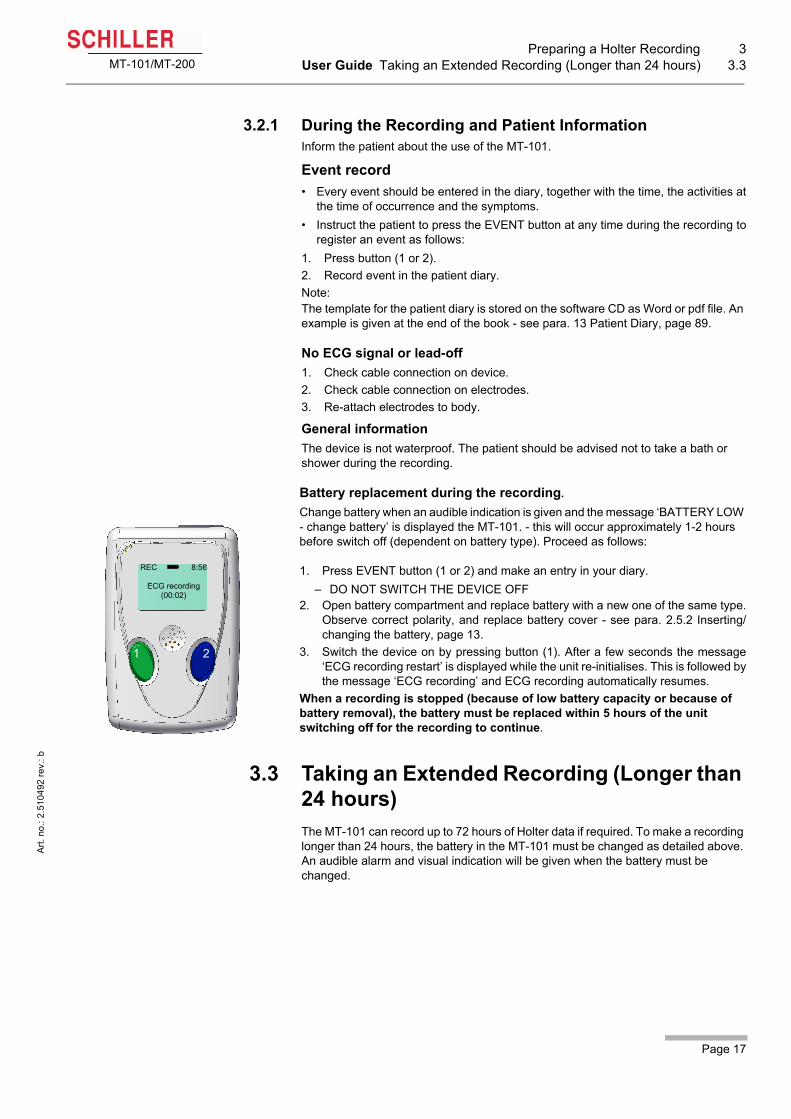
Battery replacement during the recording.
Change battery when an audible indication is given and the message ‘BATTERY LOW - change battery’ is displayed the MT-101. - this will occur approximately 1-2 hours before switch off (dependent on battery type). Proceed as follows:
1. Press EVENT button (1 or 2) and make an entry in your diary.– DO NOT SWITCH THE DEVICE OFF
2. Open battery compartment and replace battery with a new one of the same type.Observe correct polarity, and replace battery cover - see para. 2.5.2 Inserting/changing the battery, page 13.
3. Switch the device on by pressing button (1). After a few seconds the message‘ECG recording restart’ is displayed while the unit re-initialises. This is followed bythe message ‘ECG recording’ and ECG recording automatically resumes.
When a recording is stopped (because of low battery capacity or because of battery removal), the battery must be replaced within 5 hours of the unit switching off for the recording to continue.
1 2
REC 8:56
ECG recording(00:02)
Page 17

4 Transferring a Recording to the PC4.1 Data Transmission to PC from MT-101 MT-101/MT-200
4 Transferring a Recording to the PC
4.1 Data Transmission to PC from MT-101
4.2 Data transmission to PC with Memory Card Reader
1. Connect the USB cable between the MT-101 and PC (see picture below - the rub-ber cover on the MT-101 must be removed - the message "MT-101 connected toPC" appears.
2. Start MT-200 software on PC.3. Click on the data transfer icon and select "Request Holter Data". The dialogue box
shows the transferred data in per cent. The data is stored automatically. If no patient data is entered, the file will be saved withthe date and time.
1. Connect the card reader to the USB. The memory card reader appears as a phys-ical drive on your desktop.
2. The path name for this drive must be entered in the menu Option/System/Path/SD-Card path - see para. 8.5.3 Directories, page 76.
3. Insert the memory card in the card reader or PCMCIA adapter. 4. Execute the function “Read SD-Card”. The data is read into the indicated path (for
path location see point 2)
Data can also be imported from an SD card - see para. 7.2.3 Importing recordings, page 65
Page 18

Art.
no.:
2.51
0492
rev.
: bDisplaying an ECG Signal 5
User Guide Starting a Recording from the MT-200 Program 5.1MT-101/MT-200
5 Displaying an ECG Signal
5.1 Starting a Recording from the MT-200 Program1. Start the MT-200 program on your PC /CS-200. The welcome page is displayed.
2. Click on the “New recording” icon (1). The patient data screen is displayed:
3. Enter the patient data and confirm with the "OK" button. To enter the data, clickwith the mouse cursor into the fields or jump from entry field to entry field usingthe tab key.
4. If pacemaker detection is required check the pacemaker box (1) - see para. 5.1.1 Pacemaker, page 21 for notes on pacemaker detection
1
1
Page 19

5 Displaying an ECG Signal5.1 Starting a Recording from the MT-200 Program MT-101/MT-200
5. When the patient data has been entered and Ok is clicked, enter the duration of the recording
Note: The data displayed or entered on the other pages of patient information - selected by clicking on the tabs at the top of this window (Recording data, Assignment etc.) - are only available after a recording has been made.
6. Place the electrodes as indicated in the dialogue box.
7. Check the signal and re-apply the electrodes if necessary.
If a 4-lead patient cable was used for the Holter recording, only two channels will bedisplayed in the MT-200.
Page 20

Art.
no.:
2.51
0492
rev.
: bDisplaying an ECG Signal 5
User Guide Starting a Recording from the MT-200 Program 5.1MT-101/MT-200
8. Click on START RECORDING to commence the recording. The dialogue box re-minds you to check the battery load capacity.
The recording has now commenced. The LCD of the MT-101 indicates that ECG re-cording has been started.Remove the USB from the MT-101 Holter recorder and close the connector again with the protective cover.
5.1.1 PacemakerThe MT-200 cannot determine pacemaker spikes itself and it is not possible to detectpacemaker signals by later analysing the recording in the program if the pacemakerdetection function was not enabled during the original recording. So that the MT-200can detect pacemaker spikes, pacemaker detection must be activated before the startof the recording.
Activating Pacemaker DetectionPacemaker detection can be activated in either the MT-200 program or the MT-101:
Detection and Recording of Pacemaker SpikesThe MT-101 only detects pacemaker signals in long-term ECG recordings when the slopes and amplitudes of the signal exceed the preset limits and when pacemaker detection is enabled. As the MT-101 uses a sampling frequency of 500 Hz for a recording (i.e. a digitalisation interval of 2 ms), complete digital processing is impossible due to the short duration of some pacemaker signals (less than 1 ms). Therefore, analogue processing of the ECG signals is applied by the MT-101 for pacemaker detection.
Analogue Pacemaker Detection in Channel 1Analogue pacemaker detection is confined to the first channel of the MT-101. It istherefore optimal when the amplitude of the pacemaker signal for the first ECG chan-nel is greater than that for the second channel. In some instances, this is not the case.In this case, it is recommended that the real-time ECG traces are viewed on thescreen before starting the long-term recording. Pacemaker detection is automaticallyenabled on the real-time display. The pacemaker signals, however, are not alwaysdetected. If this is the case and the amplitude of the pulse is greater in the secondchannel, simply exchange the electrodes of channels 1 and 2. After the real-time dis-play, pacemaker detection must be enabled for long-term recording in the MT-200!
Evaluation and Display of Pacemaker Spikes in the MT-200 ProgramPacemaker signals are marked in the MT-200 program by vertical lines in the ECGafter evaluation of the recording. Note that these lines are correctly positioned in re-lation to time but are not proportional in either amplitude (voltage) or duration of thepacemaker pulse, nor do they indicate the polarity. The pacemaker representation isalways positive but the actual pacemaker spike may be positive or negative.
If the recording is started from the MT-200 program, then pacemaker activation can be carried out in the MT-200 by ticking the pacemaker box in the patient data window - see para. 5 Displaying an ECG Signal, page 19.If the recording is started from the MT-101 itself, then pacemaker activation must be carried out in the MT-101 menu > RECORD SETUP > PM Detection > ON, - see para. 2.4.1 Menu Overview, page 12.
Page 21

5 Displaying an ECG Signal5.2 Transmission Problems MT-101/MT-200
5.2 Transmission ProblemsIf an error message appears either before starting a recording or when attempting totransfer a recording from the MT-101 to the PC, possible causes are as follows:
Error Cause Remedy
• The USB cable assembly is not inserted correctly in either the MT-101 or the PC.
• The SCHILLER USB driver has not been installed
Check that both the cable connectors are securely placed.Install USB driver (on SCHILLER soft-ware CD.
Communication Error (error message displayed)
• The device is not connected.• The SD memory card is not inserted.• Unit not switched on• Battery exhausted.
Connect the device.Check the memory card.Switch unit onChange batteries
• Another device is connected to the USB. Disconnect the device and connect the MT-101.
Display of DEMO VERSION • The hard-lock key is not present or incor-rectly inserted.
• There is no license.
Check the hard-lock key on the PC.Contact SCHILLER for network license
No error message. The program cannot find the Holter.
• With an USB installation, the program can occasionally "hang" and not recognise the USB connection.
1. Close the MT-200 program.2. Disconnect the USB connector to your
PC. Wait circa three seconds and re-place the connector.
3. Open the MT-200 program again.
Page 22
Art.
no.:
2.51
0492
rev.
: bDisplaying an ECG Signal 5
User Guide Transmission Problems 5.2MT-101/MT-200
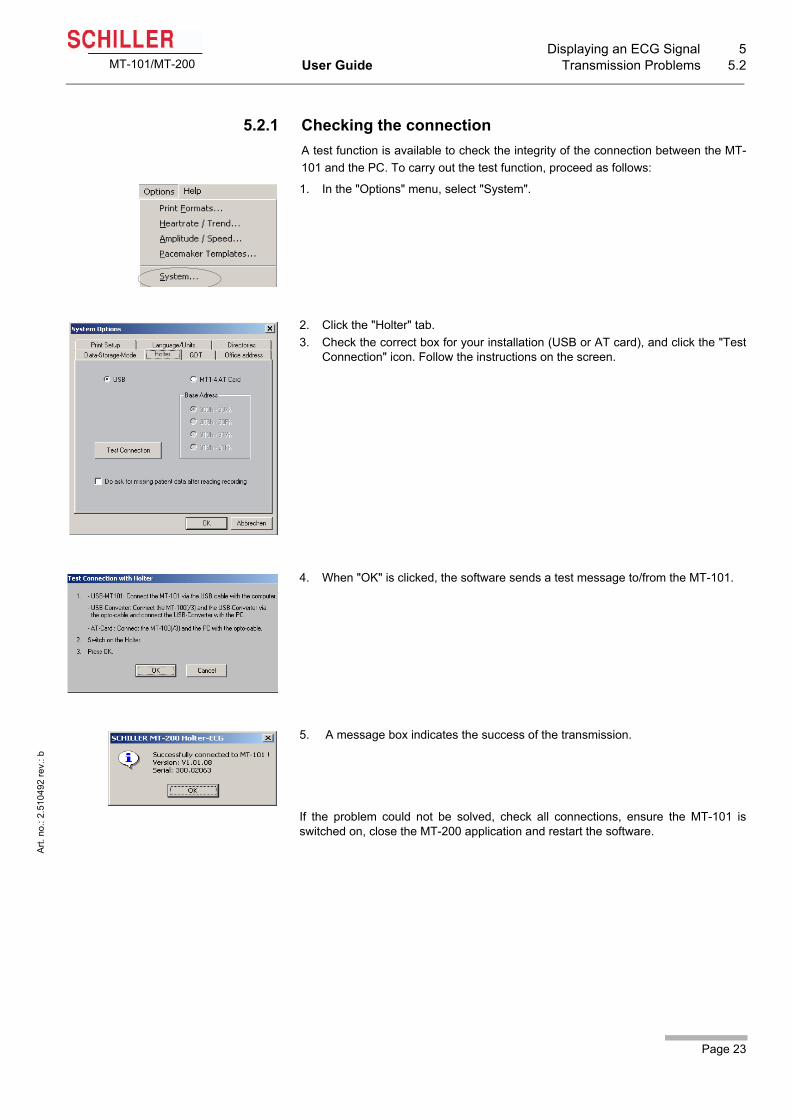
5.2.1 Checking the connectionA test function is available to check the integrity of the connection between the MT-101 and the PC. To carry out the test function, proceed as follows:
1. In the "Options" menu, select "System".
2. Click the "Holter" tab.3. Check the correct box for your installation (USB or AT card), and click the "Test
Connection" icon. Follow the instructions on the screen.
4. When "OK" is clicked, the software sends a test message to/from the MT-101.
5. A message box indicates the success of the transmission.
If the problem could not be solved, check all connections, ensure the MT-101 isswitched on, close the MT-200 application and restart the software.
Page 23

6 Viewing and Editing a Recording6.1 Icons MT-101/MT-200
6 Viewing and Editing a Recording
6.1 IconsThe MT-200 program gives different views for the presentation of a Holter recording. Every view offers various data and analytical information. Besides display icons, the toolbar contains additional function icons enabling the quick and easy activation of the most frequently used functions. All icons can be activated any time and in any view. In the ECG and zoom views, additional function icons are given to the left of the screen to change the size of the traces and/or the time segment of the recording.
All icons are selected by mouse-click (position the cursor on the icon and click with the left mouse button).
When an icon is dimmed, it means that this function is not available for the currently displayed screen and cannot be selected. For example, the zoom function is not available in the ST view so the "Zoom" icon is dimmed. The patient name is always displayed at the top of the page when an ECG recording is displayed.
Function and View icons
Function and View icons in the ECG overview
Page 24
Art.
no.:
2.51
0492
rev.
: bViewing and Editing a Recording 6
User Guide Icons 6.1MT-101/MT-200
r ct
nt d. r
G
g.
e
e
.
e
g s
at
s
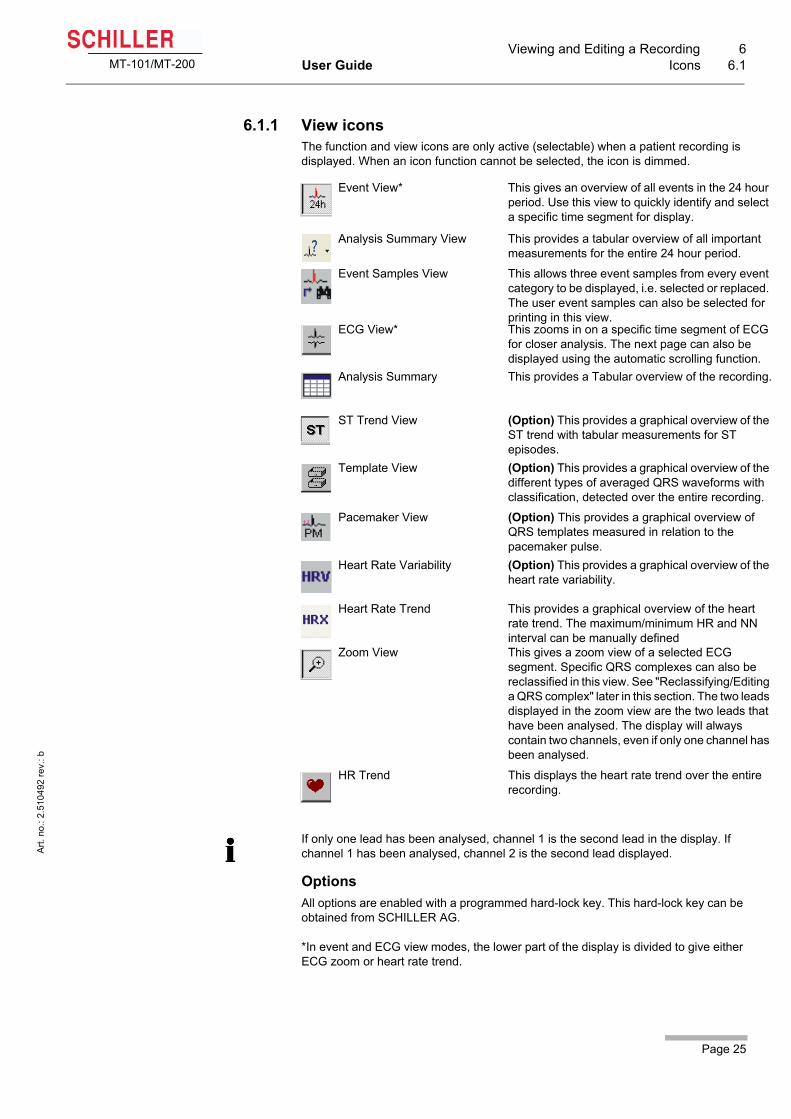
6.1.1 View iconsThe function and view icons are only active (selectable) when a patient recording is displayed. When an icon function cannot be selected, the icon is dimmed.
OptionsAll options are enabled with a programmed hard-lock key. This hard-lock key can be obtained from SCHILLER AG.
*In event and ECG view modes, the lower part of the display is divided to give either ECG zoom or heart rate trend.
Event View* This gives an overview of all events in the 24 houperiod. Use this view to quickly identify and selea specific time segment for display.
Analysis Summary View This provides a tabular overview of all importantmeasurements for the entire 24 hour period.
Event Samples View This allows three event samples from every evecategory to be displayed, i.e. selected or replaceThe user event samples can also be selected foprinting in this view.
ECG View* This zooms in on a specific time segment of ECfor closer analysis. The next page can also be displayed using the automatic scrolling function.
Analysis Summary This provides a Tabular overview of the recordin
ST Trend View (Option) This provides a graphical overview of thST trend with tabular measurements for ST episodes.
Template View (Option) This provides a graphical overview of thdifferent types of averaged QRS waveforms withclassification, detected over the entire recording
Pacemaker View (Option) This provides a graphical overview of QRS templates measured in relation to the pacemaker pulse.
Heart Rate Variability (Option) This provides a graphical overview of thheart rate variability.
Heart Rate Trend This provides a graphical overview of the heart rate trend. The maximum/minimum HR and NN interval can be manually defined
Zoom View This gives a zoom view of a selected ECG segment. Specific QRS complexes can also be reclassified in this view. See "Reclassifying/Editina QRS complex" later in this section. The two leaddisplayed in the zoom view are the two leads thhave been analysed. The display will always contain two channels, even if only one channel habeen analysed.
HR Trend This displays the heart rate trend over the entirerecording.
If only one lead has been analysed, channel 1 is the second lead in the display. If channel 1 has been analysed, channel 2 is the second lead displayed.
Page 25

6 Viewing and Editing a Recording6.1 Icons MT-101/MT-200
6.1.2 Function iconsThe following function icons are available when a patient recording is viewed:
Open Recording Open a recording. Click the icon to list all available files.Click the arrow to the right of the icon, to list the last four opened recordings.
New Recording Enter the data of a new patient and start a new recording.
Save Recording Save the current recording. Click the arrow to the right of the icon, to display further options to save as a pdf file. If saved as PDF file, it is possible to delete the original if desired.
E-Mail Send the currently displayed recording by e-mail. Click the arrow to the right of the icon, to give further options to send as a pdf file. If “Send EMail as PDF File” is selected, a pdf is generated and automatically attached to the e-mail.
Patient and Recording Data
View / edit patient and recording data. View analysis settings and diagnosis. General recording settings and options.
Print Preview Select and display the pages to be printed (before printing)
Print Print (user defined) recording data. Click the arrow to the right of the icon to select specific data for print.
Request Holter Data Load data from the connected MT-101 Holter recorder or via a memory card reader by selecting "Read SD Card". In Win 95/98, a third function is available to load data from a tape.
Analyse Click the Analyse icon to analyse the currently displayed recording to the defined analysis parameters. Click the arrow to the right of the icon to analyse multiple recordings.
Scroll Back Scroll backwards (in time) of the zoom ECG currently displayed.
Scroll Forward Scroll forwards (in time) of the zoom ECG currently displayed.
Scroll Event Back Go to previous event.
Scroll Event Forward Go to next event.
Time Scale for View Display 3, 6, 12, 24 hours of analysed data or, for recordings longer than 24 hours, all the data. When 3, 6, 12, or 24 hour is selected, the arrow icons at the side of the box, enable the user to jump to the next time segment.
Page 26
Art.
no.:
2.51
0492
rev.
: bViewing and Editing a Recording 6
User Guide Icons 6.1MT-101/MT-200
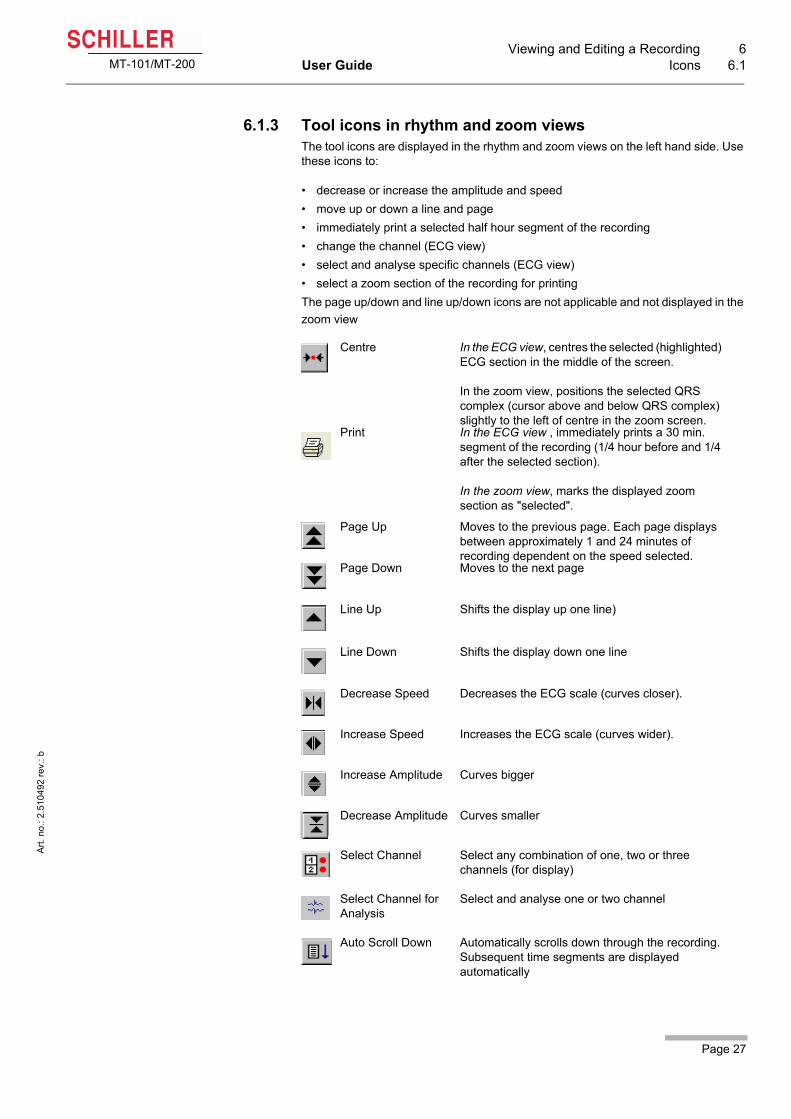
6.1.3 Tool icons in rhythm and zoom viewsThe tool icons are displayed in the rhythm and zoom views on the left hand side. Use these icons to:
• decrease or increase the amplitude and speed• move up or down a line and page• immediately print a selected half hour segment of the recording• change the channel (ECG view)• select and analyse specific channels (ECG view)• select a zoom section of the recording for printingThe page up/down and line up/down icons are not applicable and not displayed in the zoom view
Centre In the ECG view, centres the selected (highlighted) ECG section in the middle of the screen.
In the zoom view, positions the selected QRS complex (cursor above and below QRS complex) slightly to the left of centre in the zoom screen.
Print In the ECG view , immediately prints a 30 min. segment of the recording (1/4 hour before and 1/4 after the selected section).
In the zoom view, marks the displayed zoom section as "selected".
Page Up Moves to the previous page. Each page displays between approximately 1 and 24 minutes of recording dependent on the speed selected.
Page Down Moves to the next page
Line Up Shifts the display up one line)
Line Down Shifts the display down one line
Decrease Speed Decreases the ECG scale (curves closer).
Increase Speed Increases the ECG scale (curves wider).
Increase Amplitude Curves bigger
Decrease Amplitude Curves smaller
Select Channel Select any combination of one, two or three channels (for display)
Select Channel for Analysis
Select and analyse one or two channel
Auto Scroll Down Automatically scrolls down through the recording. Subsequent time segments are displayed automatically
Page 27

6 Viewing and Editing a Recording6.2 Accessing and Opening Files MT-101/MT-200
6.2 Accessing and Opening Files
This lists all files (and subdirectories) in the last folder selected (usually ‘ data’. Click on the desired file to open it.
The "V" and the "E" columns indicate if the recording has been validated or exported.
If you wish to display only all validated/non-validated or all exported/not exported recordings, click on the arrow at the side of the "Files of type" field to define.
Use the open file icon to:
• Open a file• Review stored files• Show all exported/not exported or validated/not validated recordings
To display (and select) the last four viewed recordings, click on the arrow by the side of the icon.
Page 28

Art.
no.:
2.51
0492
rev.
: bViewing and Editing a Recording 6
User Guide Event & Zoom Views 6.3MT-101/MT-200
6.3 Event & Zoom Views
Event ViewThe time duration of the event view is selected (1) between 3, 6 12, 24 (hours), or all. When a section is displayed and earlier/later data is available, the left/right arrows are active to go to the previous/next time segment or first/last time segment of the recording.
The time bar (2) shows the position in the recording. The first figure gives the hour and the second figure the day.
NOTE: When the next/previous time section is selected (1), the displayed section (2) will overlap the one before by an hour.
Click anywhere in the event view. A vertical cursor line is displayed and a zoom view (or HR trend) for the selected recording section is displayed in the bottom part of the screen. To view another section, move the cursor line by clicking on another point in the event table. The vertical line is repositioned and the zoom ECG view (or HR trend) in the bottom part of the screen displays the ECG at the selected time.
The heart rate trend can be displayed instead of the ECG zoom display in the bottom window (see “Heart Rate View”).
The numbers at the right of the event table give the total number of specific events detected in the entire recording
Click on the "Event view" icon.
3 4 5
1
2
Page 29

6 Viewing and Editing a Recording6.3 Event & Zoom Views MT-101/MT-200
Zoom ViewTwo blue measurement lines (4) are displayed in the zoom view when the measurement box, in the bottom left (3) of the zoom screen, is checked. The amplitudes of the two channels and the time can be measured by moving the measurement lines. A small window gives the differences between the values of the two lines. Reposition the lines by moving with the cursor. The measurement values will change instantly.
Both measurement lines (4) can be moved together to maintain the same time interval. To do this, press the control key while moving the cursor.
The “ms“ and/or “min“ boxes in the bottom left of the zoom screen display the measured time and/or heart rate when checked and indicate:
• the time in milliseconds between respective heart beats • the heart rate calculated beat to beat.
When a file is opened, the event view is given. This screen displays all the events in the entire recording. The time scale of the recording is displayed below the events.
.
ECG editing and reclassification is carried out in the zoom view - see para. 6.14 Reclassifying/Editing a QRS Complex, page 52.
Lowest/Highest Heart Rate; Minimum/Maximum RR IntervalThe black up and down pointing arrows positioned in the bradycardia and tachycardia events indicate the lowest and highest heart rates (with reference to time) measured in the complete recording.
To display the zoom view of the respective ECG sections, select the corresponding option in the "View" menu:
2/3-Channel Analysis IndicationsThe number of channels recorded, and the channels that have been analysed, are indicated in every view in the bottom right of the display (5). The indication states the number of channels recorded, followed by the channels that have been analysed. The following combinations are possible:
• 2 channels: analysed (1) Channel 1 analysed: Zoom displays channels 1 + 2• 2 channels: analysed (2) Channel 2 analysed: Zoom displays channels 1 + 2• 2 channels: analysed (1) + (2) Channel 1 + 2 analysed: Zoom displays channels 1
+ 2• 3 channels: analysed (1) Channel 1 analysed: Zoom displays channels 1 + 2• 3 channels: analysed (2) Channel 2 analysed: Zoom displays channels 2 + 3• 3 channels: analysed (3) Channel 3 analysed: Zoom displays channels 1 + 3• 3 channels: analysed (1) + (2) Channels 1 + 2 analysed: Zoom displays channels
1 + 2 (or 1 + 3 or 2 + 3)
Selection of channels for analysis and display are detailed later in this book, see para. 6.6 ECG View, page 35. For analysis options see para. 6.15 Analysing/Re-analysing the Recording, page 54.
Page 30

Art.
no.:
2.51
0492
rev.
: bViewing and Editing a Recording 6
User Guide Analysis Summary 6.4MT-101/MT-200
6.4 Analysis SummaryClick on the "Analysis summary" icon.
1
2
3
Page 31
6 Viewing and Editing a Recording6.4 Analysis Summary MT-101/MT-200
In the ‘Heartrate / VES‘ view and the ‘VES/signal quality‘ view, the analysis summary can be displayed for day 1, 2, 3 or all (3).
An analysis summary of all important data over the entire Holter recording is given over three pages.
To display one page, click on the respective "Holter Report", "Heartrate/SVES" or "VES/Signal Quality" tab at the lower edge of the table. In the table, click on any of the categories (1) highlighted blue (e.g. HR [/min]). The zoom view of the desired ECG section is immediately displayed.Click on the arrows on the scroll bar (2) to the right to display the upper or lower part of the table.Click on the arrows on the scroll bar at the bottom to move the table further to the right or left.
ECG editing and reclassification is carried out in the zoom view - see para. 6.14 Reclassifying/Editing a QRS Complex, page 52.
Page 32

Art.
no.:
2.51
0492
rev.
: bViewing and Editing a Recording 6
User Guide Event Samples View 6.5MT-101/MT-200
6.5 Event Samples ViewClick on the Event samples icon.
1 2 3
4
Event 1
Event 2
Event 3
Page 33

6 Viewing and Editing a Recording6.5 Event Samples View MT-101/MT-200
Up to three event samples can be selected for every event category. After the analysis of a recording, the three event samples are automatically displayed (the first event within an eight-hour cycle, respectively):
All events in the selected category are indicated by a vertical line. Click on any event (2) on this line to display a zoom view of the selected segment.
Click on an event sample (4) to display the sequence in the zoom window.
Event 1: first detected event in the recording
Event 2: first detected event after eight hours
Event 3: first detected event after 16 hours
If three or less events in a category are detected, then all of the events detected are displayed, regardless of where in the recording they occurred. The event samples given here are also the samples given on the printout when the event samples box is checked in the print menu. The event categories are selected by clicking on the arrow (1) next to the type indication in the top right of the screen.
To display the next or previous event in the zoom window, click on the icons (3) in the toolbar.
ECG editing and reclassification is carried out in the zoom view - see para. 6.14 Reclassifying/Editing a QRS Complex, page 52.
Page 34

Art.
no.:
2.51
0492
rev.
: bViewing and Editing a Recording 6
User Guide ECG View 6.6MT-101/MT-200
6.6 ECG View
To zoom in on a particular segment of the displayed ECG, move the zoom cursor to the required ECG area in the upper screen and click with the left mouse button. The area highlighted on the upper screen is then shown in zoom mode in the bottom section.
Click on the "ECG View" icon.
12
The time of the ECG recording is displayed on the left of each ECG line. In the upper window, you can see a frame showing an ECG segment. This framed segment is zoomed in the lower window. When the cursor is positioned in the ECG view (in the upper screen), it changes to a zoom cursor.
3
The maximum time span for a page in ECG view is approximately 60 minutes of ECG recording. If you wish to jump hours, it is easier to go into the event view, select the time segment and then return to the ECG view.
Page 35

6 Viewing and Editing a Recording6.6 ECG View MT-101/MT-200
6.6.1 Selecting Channels for Display
6.6.2 Selecting Channels for Analysis
6.6.3 Auto Scrolling
Zoom
Pause
Click on the "Channel number" icon (1) to display the required channel(s). In the case of:
• a 2-channel recording, the fol-lowing window is displayed:
• a 3-channel recording, the fol-lowing window is displayed:
Click on the "Analyse channels" icon (2) to define the channels to be analysed. The channel(s) for analysis are the same the options above
Click on the “Auto page down” icon to automatically page scroll through the Holter recording. When Selected, a speed setting (3) is displayed to define the scrolling speed.
To zoom in on a selected section during the scrolling, click with the zoom cursor. This displays the zoom view of the selected section.
If you click on "Pause" during the automatic scrolling, manual page up and page down is possible with the "Page up" and "Page down" icons.
Page 36

Art.
no.:
2.51
0492
rev.
: bViewing and Editing a Recording 6
User Guide Event Chart 6.7MT-101/MT-200
6.7 Event Chart
This display mode provides an overview of all events in the 24 hour recording in the form of bar charts. The X axis gives the period from the beginning to the end of the recording. The height of the bars (along the Y axis) corresponds to the frequency of events at a certain point in time. The Y axis is automatically adapted to the number of events.
V Ventricular arrhythmia - Displaying graphs for VES, couplet, triplet, Vtach.,bigeminy, trigeminy
S Supraventricular arrhythmia - Displaying graphs for SVES, couplet, triplet,SVtach., bigeminy, trigeminy
M Miscellaneous - Displaying graphs for marker (event button pressed duringrecording), lead-off, artifact, pause, bradycardia, tachycardia
Click on the "Event-chart view" icon.
1
Page 37

6 Viewing and Editing a Recording6.8 Heart Rate View MT-101/MT-200
6.8 Heart Rate View
Click on the cursor line (1) with the left mouse button to move the line.The heart rate for the entire recording time is displayed in the lower half of the screen. In the bottom line, you can find the time axis.
The heart rate is averaged over 1, 2, 5 or 10 minutes (for settings, refer to section see para. 8.2 Heart Rate Trend, page 72). The red line gives the maximum heart rate, the black line the average and the blue line the lowest heart rate.
When the heart rate trend is displayed in the ECG view, the time segment is indicated in the upper window which corresponds to the current position of the vertical cursor line in the HR trend view. When the vertical cursor line is moved in the HR trend view, the corresponding ECG segment is changed in the upper window. To move the cursor line, click on any point in the HR trend view with the left mouse button.
Click on the "Heartrate trend" icon.The heart rate view gives the heart rate trend over the entire recording.
Note that the heart rate view can only be displayed from the ECG or event view
1
Return to the zoom view by clicking on the zoom icon.
Page 38

Art.
no.:
2.51
0492
rev.
: bViewing and Editing a Recording 6
User Guide ST Trend View 6.9MT-101/MT-200
6.9 ST Trend View
The measurements table (2) indicates the measured values belonging to the current position of the vertical line (1) in the upper window. However, these values are ONLY displayed when the vertical line is positioned on an ST event (as in the ST-Episode 1 line in the above example). Click on "Begin", "Max ST" or "End" in the measurements table to display the corresponding section in the zoom view with the respective measured values.
Click on the "ST trend" icon.
1
2
Page 39
6 Viewing and Editing a Recording6.9 ST Trend View MT-101/MT-200
ST Episodes The top section (1) gives the incidents of artifacts and ST episodes for each of the two channels (any combination of the three channels - see page 36, “Selecting channels for analysis”)
ST Trend The middle section gives a graphical representation of the ST trends for both channels. The ST level is measured in mm and the slope is measured in mV/s (taken at the point (J-point + 10 to 100 ms) defined in the menu option “Analysing Options” - see para. 6.16 Analysing Options, page 56).
The scale of the level (mm) and slope (mV/s) are given on the left hand side of the trend graph.
The thicker line (in the example: +1, +2 or +3 mm) indicates the limits defined for ST episode detection in the analysis options.
The ST values are coloured green in channel 1 and pink in channel 2. The ST level is the thicker line; the ST slope is the thinner line for both channels. Any of these four trends can be displayed or removed by checking the boxes to the right of the ST trend graph (level 1, slope 1 and level 2, slope 2).
Heart Rate Trend See previous page.
Zoom This zooms in the time segment corresponding to the current position of the vertical pointer in the trend graph view (ST and HR). Move within the zoom view with the left and right keyboard arrow keys, or the forward/backward scroll icons in the toolbar.
ST Measurement Table (2) The "ST-Episode-Properties" table (2) is displayed in the bottom right corner. When the vertical pointer (line) is positioned at a point where an ST episode occurred, the table gives the following measured values:
• the start and end times when the ST values exceeded the user defined value• the ST value in mm at the start and the end of the ST episode sequence and the
highest ST level • the ST slope in mV/s at the start and the end of the ST episode sequence• the heart rate at the start and the end of the ST episode sequence and the highest
heart rate• the duration of the ST episode sequence
Moving the vertical pointer:
Position the cursor on any spot in the HR graph, the ST trend graph or on an ST event in the upper part of the screen and click with the left mouse button. The vertical pointer will move to the new cursor position.
The limits for ST event detection and the measurement point where the ST values are measured is defined in the “Analysing Options” menu option - see para. 6.16 Analysing Options, page 56.
Page 40

Art.
no.:
2.51
0492
rev.
: bViewing and Editing a Recording 6
User Guide Template Matching 6.10MT-101/MT-200
6.10 Template Matching
It is also possible to select a classified QRS complex ("N", "V", "S" etc.) in the ECG zoom view and to open the template view via right mouse click. The template class of the selected complex is highlighted.
When an ECG is measured over several hours, differences will naturally occur in the QRS complexes. QRS complexes with similar shapes can be grouped as one class (or template). There can be several classes in which the QRS complex is considered normal, several classes with an abnormal QRS complex (ventricular extrasystoles: VES classes) and also classes with disturbed QRS complexes. This gives the user a direct overview of the different kinds of electrical activity in the heart. It is also possible to immediately reclassify a complete group of QRS complexes that are considered to be incorrectly classified.
The SCHILLER software can differentiate between twelve normal templates, a maximum of 300 abnormal VES templates, one artifact template and up to twelve supraventricular templates. The templates are shown in frequency (number of occurrences) order. The number of occurrences is displayed in the shaded box in the bottom right of the template. The first templates displayed are the twelve normal templates, followed by the VES templates. If less than twelve normal QRS forms fit the templates, then only those measured are displayed .
Click on the "template" icon.
1
23
Page 41

6 Viewing and Editing a Recording6.10 Template Matching MT-101/MT-200
Disturbed QRS Complexes Disturbed complexes that are still considered to be normal and complexes that do not fit into any other templates are collected under "Normal Various". When the user manually reclassifies a QRS complex as normal, it is shown in the template as "Normal Manual".
Template Matching The SCHILLER template matching function subdivides the QRS complexes recognised as normal or SVES into different subgroups. This very exact analysis differentiates the normal QRS complexes when relatively small shape differences appear. This enables the reclassification of abnormal complexes that appear very similar to the normal QRS complexes and may therefore be incorrectly labelled as normal by the algorithm. They can be reclassified as VES in one group, using a single command.
Highly Disturbed QRS Complexes QRS complexes which have such extreme disturbances that no clear allocation as normal or VES is possible are collected in the artifact template.
Reclassifying Templates Using the right mouse button, each template class can be reclassified as normal, supraventricular (SVES), VES or artifact. A template class can also be deleted.
Merging Templates When two templates are assessed to be equal, one template can be "dragged and dropped" into the other. Hold the left mouse button on the template to be merged. Still holding the mouse button, move the mouse to position the QRS in the template area of the similar template. Release the mouse button to merge the two templates. The following special icons are associated with template matching on the left of the template view:
Change the screens with the Page icons on the left of the screen. Including (from the top:
previous / next page of templates (last or first page of templates) (1)Increase / decrease speedIncrease / decrease amplitude Increase/ decrease distance between the two leads shown on each templatedisplay 16 / 24 templates per page (2)
To limit the number of VES templates after evaluation, click on the `limit VES` template icon (3). The templates which are no longer required are collected under the templates `VES Diverse`. Note that the default number of VES templates is set in the analysis menu - see para. 6.16 Analysing Options, page 56.
Page 42

Art.
no.:
2.51
0492
rev.
: bViewing and Editing a Recording 6
User Guide Template Matching 6.10MT-101/MT-200
6.10.1 Detailed Overview of the Template ClassesTo obtain a detailed view (2) of the template classes click on the number of occurrences box (1) at the bottom of the templates.
A reference QRS complex of the template group is displayed in the bottom left (3). In this way, the zoomed QRS complex can be visually compared with the reference complex of the template. The reference complex number is displayed in the bottom right corner of each template. To select a previous or subsequent complex, click on the right or left arrow (4). When the template view is exited, the same reference complex is set on re-entering.
1
4
2
5
3
Page 43

6 Viewing and Editing a Recording6.10 Template Matching MT-101/MT-200
Overview of QRS Complexes in the Upper Screen
The upper part of the screen displays all complexes of the selected template. A maximum of 100 QRS complexes can be shown on one page. Select the next/previous page(s) with the icons on the left (see previous page).
Zoom View of QRS Complexes in the Lower Screen
A zoom view of any QRS complex is displayed in the bottom section. To select another zoom view, position the cursor on any complex in the top section of the screen and click. The selected section is zoomed in the bottom section.
Reclassifying a QRS Complex (4) The selected QRS complex in either the top section of the screen or the zoom view can be reclassified as normal, SVES, VES or artifact or deleted by clicking with the right mouse button. It can also be reclassified/deleted directly using the keys “N“, “V“, “S“, "A", or “D“ (delete).
To reclassify the whole template, position the mouse on the reference QRS complex (or template class in the template overview), and click with the right mouse button to display the reclassify window.
All events (couplet, triplet, bigeminy etc.) that have been reclassified manually are automatically rearranged when the template view is exited and re-entered.
"Measure" Field (5) A measurement box is displayed in the zoom view when the “Measure” box (5) in the bottom left of the zoom screen is checked. This gives the difference between the two horizontal blue lines. These values indicate the differences (amplitude and time) between the two blue lines. The two blue lines can be positioned anywhere on the zoom view by moving the cursor. The measurement values change instantly (see section see para. 6.3 Event & Zoom Views, page 29).
The two settings (5) below the "Measure" field - in the bottom left of the zoom screen - display the measured time and heart rate when checked. They indicate, depending on the respective selection:
• the time in milliseconds between the respective heart beats.• the heart rate calculated beat to beat.
Classifying Multiple or Contiguous ComplexesTo select multiple complexes press the Control key on your computer (CTRL), and select the complexes with the mouse.
To select contiguous complexes press the Shift key on your computer (), and select the complexes with the mouse.
When the complexes have been selected, they can be classified as described. Note however that cannot be deleted.
Page 44

Art.
no.:
2.51
0492
rev.
: bViewing and Editing a Recording 6
User Guide Pacemaker Templates 6.11MT-101/MT-200
6.11 Pacemaker Templates
I
individual PM templates or the complete class of PM template can be moved into another PM template using the right mouse key
Click on the “Pacemaker View” icon. The pacemaker templates are displayed:
User defined names can be defined for all pacemaker templates (see para. 8.4 Pacemaker Templates, page 74.)
Page 45

6 Viewing and Editing a Recording6.11 Pacemaker Templates MT-101/MT-200
6.11.1 Template classesThe pacemaker template option provides an evaluation of the pacemaker impulses with presentation in several so-called pacemaker templates. Eight different pacemaker templates are defined:
Template 1: Two pacemaker pulses, P1 and P2, are detected. The distance between the two PM actions is greater than 100 ms and less than 220 ms. The QRS trigger T is after the second PM pulse P2.
Template 2: One pacemaker pulse P1 is detected, and the QRS trigger T is after P1. The distance between PM pulse and QRS trigger is greater than 150 ms and less than 350 ms.
Template 3: One pacemaker pulse P1 is detected, and the QRS trigger T is after P1. The distance between PM pulse and QRS trigger is less than 150 ms.
P1
Trigger
P2
Template 1a
P1
Trigger
P2
Template 1b
P1
T
Template 2c
P1
TTemplate 2b
P1
TTemplate 2a
P1
TTemplate 3aP1
TTemplate 3b
Page 46

Art.
no.:
2.51
0492
rev.
: bViewing and Editing a Recording 6
User Guide Pacemaker Templates 6.11MT-101/MT-200
Template 4: Two pacemaker pulses, P1 and P2, are detected. The first PM pulse P1 is before the QRS trigger T (their distance is greater than 150 ms and less than 350 ms), and the second PM pulse P2 is after the QRS trigger (at a distance of max. 0.35 times the average heart rate).
.
Template 5: A pacemaker pulse P1 is detected after the QRS trigger T at a distance of up to 0.35 times the average heart rate (in the ST segment).
P1
TTemplate 4a
P2 P1
TTemplate 4c
P2P1
TTemplate 4b
P2
P1
TTemplate 5a
P1
TTemplate 5b
Page 47

6 Viewing and Editing a Recording6.11 Pacemaker Templates MT-101/MT-200
Template 6: Pacemaker pulse(s) detected between two QRS triggers: the distance of the PM pulse to the previous QRS trigger is greater than 350 ms and the distance to the next RS trigger is greater than 0.35 times the average heart rate.
Template PM Rest This template contains all the pacemaker pulses that could not yet be assigned to any of the other PM templates.
Template Artifact The user can assign here all triggers in which a pacemaker action was incorrectly recognised by the system due to artifacts.
P1
T1Template 6 T2
Pacemaker settings and options are described in the settings section - see para. 8 System Settings and Options, page 68.
Page 48

Art.
no.:
2.51
0492
rev.
: bViewing and Editing a Recording 6
User Guide Heart Rate Variability 6.12MT-101/MT-200
6.12 Heart Rate Variability
Select between three different graphical representations of the HRV. Choose one of the three top icons in the left toolbar (1) as shown below
Click on the "HRV" icon.
1
32
4
1. NN/dNN Tachogram Distribution over the entire recording of absolute and rela-tive intervals
2. SDANN/SDNNidx Graph Distribution over the entire recording3. NN Distribution Bar graph showing the percentage of NN beats against the
percentage deviation from the mean4. Update of the graphical representation after, for example, changing a setting5. Scaling of the X-axis6. Scaling of the Y-axis7. Move to the point in the recording of the minimum (shortest) NN interval8. Move to the point in the program of the next longer NN interval9. Move to the point in the recording of the maximum (longest) NN interval10. Move to the point in the program of the next shorter NN interval
12
3
4
5
6
7
8
9
10
Page 49

6 Viewing and Editing a Recording6.12 Heart Rate Variability MT-101/MT-200
Heart Rate Variability Analysis NotesThe following parameters are analysed in tabular form for the entire recording (day 1, 2, 3 or all (4), and separately for day and night time (2). The night time is also shaded on the distribution charts (3). The night time can be individually defined for every patient - see para. 6.17 Editing Patient Data/Recording, page 58.
• The RR intervals before and after a VES are not considered for the calculation ofthe heart rate variability. Only time intervals between normal QRS complexes, i.e.so-called NN intervals, are used.
• The recording is subdivided into five-minute intervals for the HRV analysis. Whena compliance ratio is less than 80% of NN intervals within a five-minute interval,this time interval is not used for the calculation.
• When an absolute arrhythmia is detected, the QRS complexes during this absolutearrhythmia are not accepted for HRV analysis.
• For a correct evaluation, it is important that no normal QRS complexes are over-looked (falsely recognised as abnormal beats). Also, disturbances or VES shouldnot be incorrectly designated as normal QRS complexes (falsely recognised asnormal beats).
• To enable the user to check this, the following functions are provided in the screendisplay: maximum NN interval, subsequent maximum NN interval, minimum NN in-terval, subsequent minimum NN interval.
Valid NN The percentage of valid NN used in the analysis.
Mean NN The average value of all intervals between consecutive normal QRS complexes within the entire ECG recording (also specifically for day and night).
SDNN (standard deviation of mean NN) The standard deviation of all intervals between consecutive normal QRS complexes within the entire ECG recording (also specifically for day and night).
SDANN (standard average deviation of NN)
The standard deviation of calculated average values. After splitting up the entire recording into 5-minute segments, the average values of the intervals between consecutive normal QRS complexes within these 5-minute segments are calculated.
SDNNidx (standard deviation of NN in-tervals)
After splitting up the entire recording into 5-minute segments, the standard deviations of the intervals between consecutive normal QRS complexes within these 5-minute segments are calculated. The average value of these standard deviations is referred to as SDNNidx.
rMSSD (root mean square of succes-sive differences)
All differences between consecutive NN intervals are raised to the power of 2 and summed up, and the sum is normalised to the number of actual differences. The square root taken from this value gives the rMSSD.
*Parameters analysed according to: Standards of Measurement, Physiological Inter-pretation, and Clinical Use of Heart Rate Variability; Task Force of The European So-ciety of Cardiology and The North American Society of Pacing and Electrophysiology,Confidential Draft, July 1994.
NN50 The sum of all congruent NN with variations greater than 50 ms. The intervals between consecutive normal QRS complexes are determined from the entire ECG recording (NN interval). The differences between successive NN intervals are calculated and all differences greater than 50 ms summed to give the NN50 value.
pNN50 (proportion of adjacent NN-in-tervals with more than 50 ms differ-ence)
Proportion (percentage) of adjacent NN intervals with variations greater than 50 ms calculated against the total number of NN intervals.
NN100/NN200 Same as NN50 but with a time difference greater than 100 ms and 200 ms respectively.
Page 50

Art.
no.:
2.51
0492
rev.
: bViewing and Editing a Recording 6
User Guide Heart Rate Trend 6.13MT-101/MT-200
6.13 Heart Rate Trend
The following screen is displayed:
The screen shows the HR trend over the selected time period. When the mouse key is clicked (in the trend view), the instantaneous HR values are displayed (1), and the HR segment is displayed in the zoom view.
6.13.1 Jumping to the max/min Heart Rate or max/min NN IntervalTo jump to the maximum or minimum HR or NN interval, click on the appropriate icon (2).
To go the ‘next’ highest or next lowest HR or NN interval, click the relevant icons (Abs >> HR, Abs << HR, Abs >> NN, Abs << NN).
6.13.2 Redefining the Max/Min Heart Rate and NN IntervalThe maximum and minimum heart rate, and the maximum and minimum NN interval, can be manually set. To do this, position the cursor (1) and click the relevant icon (set max HR, set min HR, set max NN, set min NN). When the Maximum and minimum HR is manually set, the Max and Min HR indication (3) are reset.
Click on the "HRX" icon.
12
3
The edited maximum / minimum values are taken over in all other screens e.g tem-plates, event view etc. If the recording is re-analysed, the edited values are lost and replaced by the analysis program values.
Page 51

6 Viewing and Editing a Recording6.14 Reclassifying/Editing a QRS Complex MT-101/MT-200
6.14 Reclassifying/Editing a QRS ComplexIn the zoom view (which can be selected when in rhythm view and event view and is always displayed in ST trend and event samples view), it is possible to reclassify a QRS complex. A complex can be selected by means of two horizontal thick blue lines that are positioned in the zoom view above and below the two channels. To reclassify an individual complex, proceed as follows:
1
1. In the zoom view, click on the QRS complex you want to reclassify. The position is marked by blue horizontal lines (1) above and below.
2. Choose from one of the following :– double click with the left mouse button to display this screen – or – display the "Classify" menu by clicking the right mouse button or opening the
"Classify" menu in the main menu bar.3. Select the classification applying to the selected complex.4. The reclassification is carried out immediately, i.e. the colour will be changed and
the complex will be assigned to the new class.
Page 52
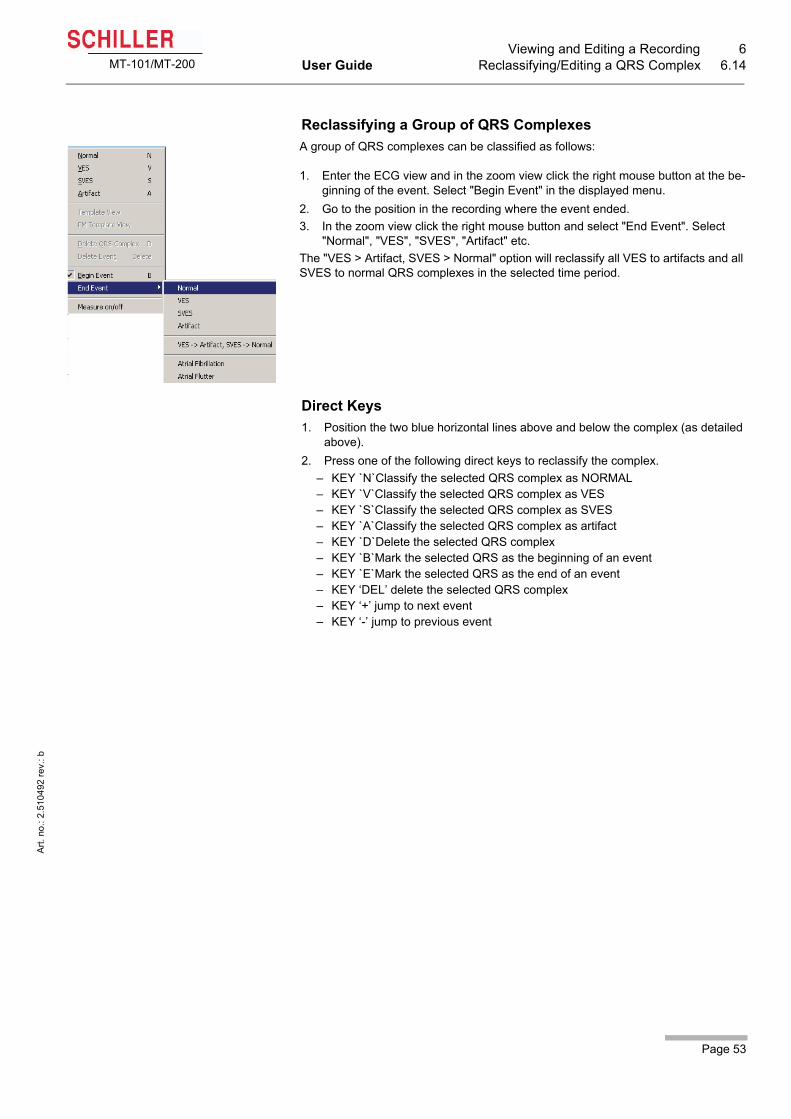
Art.
no.:
2.51
0492
rev.
: bViewing and Editing a Recording 6
User Guide Reclassifying/Editing a QRS Complex 6.14MT-101/MT-200
Reclassifying a Group of QRS Complexes
Direct Keys1. Position the two blue horizontal lines above and below the complex (as detailed
above).2. Press one of the following direct keys to reclassify the complex.
– KEY `N`Classify the selected QRS complex as NORMAL– KEY `V`Classify the selected QRS complex as VES– KEY `S`Classify the selected QRS complex as SVES– KEY `A`Classify the selected QRS complex as artifact– KEY `D`Delete the selected QRS complex– KEY `B`Mark the selected QRS as the beginning of an event– KEY `E`Mark the selected QRS as the end of an event– KEY ‘DEL’ delete the selected QRS complex– KEY ‘+’ jump to next event– KEY ‘-’ jump to previous event
A group of QRS complexes can be classified as follows:
1. Enter the ECG view and in the zoom view click the right mouse button at the be-ginning of the event. Select "Begin Event" in the displayed menu.
2. Go to the position in the recording where the event ended.3. In the zoom view click the right mouse button and select "End Event". Select
"Normal", "VES", "SVES", "Artifact" etc. The "VES > Artifact, SVES > Normal" option will reclassify all VES to artifacts and all SVES to normal QRS complexes in the selected time period.
Page 53

6 Viewing and Editing a Recording6.15 Analysing/Re-analysing the Recording MT-101/MT-200
6.15 Analysing/Re-analysing the Recording
Further analysing options are given in the "Analyse" menu
.
Analyse ECG Select this option to analyse a new recording or to re-analyse the current file after changing any settings. The analysis of a complete recording may take several minutes. During analysis a progress bar is displayed
Analyse ECG-Events Select this option to recalculate all event information based on the defined analysis parameters. Selecting this analysing option is quicker than the analysis of the complete ECG. QRS complexes which have been manually reclassified remain unchanged.
Analyse ST-Trends/Episodes Select this option to recalculate all ST-trend data (levels and slopes) and episodes. Selecting this analysing option is quicker than the analysis of the complete ECG
Analyse Multiple Recordings This option gives you the possibility of analysing selected recordings using the same analysis settings. When this menu option is selected, all patients in the MT-200 directory are displayed. Check all recordings that you wish to analyse. At the end of the analysis, a report is displayed with information about the number of successful recording analysed.
Analysis is initiated with the "Analyse" icon.
Analysis is only possible on one or two channels - see para. 6.6 ECG View, page 35.
When ‘Analyse ECG’ is selected manually edited complexes are lost. When ‘analyse ECG events or ‘analyse ST-trends/episode’ are selected, manually edited complexes remain.
Page 54
Art.
no.:
2.51
0492
rev.
: bViewing and Editing a Recording 6
User Guide Analysing/Re-analysing the Recording 6.15MT-101/MT-200
Analysis of a single recording can take many minutes. The multiple analyse option can be used therefore, to analyse many recordings at quiet times e.g overnight
Page 55

6 Viewing and Editing a Recording6.16 Analysing Options MT-101/MT-200
6.16 Analysing OptionsWhen ‘Analyse Options‘ is selected from the Analyse menu (previous page), the options are displayed which define the calculation analysis parameters used for all new recordings, and when re-analysing a previous recording. Settings are given for arrhythmia analysis options, for ST episodes and for the number of VES templates that will be generated.
6.16.1 ArrhythmiasThe following arrhythmia analysis options can be set:
Heart rateDefine the settings for the detection of bradycardias, tachycardias and pauses. The program detects a bradycardia when the heart rate falls below a set value. It detects a tachycardia when the heart rate lies above a set value. The program detects a pause when the set time interval is exceeded.
Abs. Arrhythmia
Absolute arrhythmia - Enable absolute arrhythmia detection by checking the "Detection" box. The percentage difference of the RR intervals can be set in the range from 15 % to 50%.
Minimal Duration - The time duration above which absolute arrhythmia will be classified. The minimal duration can be set from 10s to 10 minutes.
Supraventricular ArrhythmiasSupraventricular arrhythmia detection is enabled when the “Detection” box is checked. The percentage difference at which a supraventricular arrhythmia is defined is set in the range of 15% to 50%.
6.16.2 Manually Defining Arrhythmias
Absolute Arrhythmia can be an indication of atrial flutter or atrial fibrillation.When absolute arrhythmia detection and supraventricular detection is required, the percentage setting must be the same for both.
ImportantWhen absolute arrhythmia is detected by the evaluation software, this can be a sign of atrial fibrillation or flutter.
Arrhythmias can be defined as atrial flutter or atrial fibrillation as follows. Events can also be deleted at any time
1. Enter the ECG view and in the zoom view click the right mouse button at the be-ginning of the arrhythmia. In the displayed menu, select "Begin Event".
2. Go to the position in the recording where the arrhythmia ends.3. In the zoom view click the right mouse button. In the displayed menu select "End
Event". A number of classification options are available. Select "Atrial Flutter" or "Atrial Fibrillation" as required.
4. Select "Delete Event" to delete the event.
Page 56

Art.
no.:
2.51
0492
rev.
: bViewing and Editing a Recording 6
User Guide Analysing Options 6.16MT-101/MT-200
6.16.3 ST-episodes
6.16.4 Templates
6.16.5 Mode
The following analysis options are available for ST episodes:
• ST-Point• ST-Episodes Ch.1• ST-Episodes Ch.2• ST-Episodes Ch.3The ST point and ST-level limit can only be defined for the selected channels. As channels 2 and 3 have been analysed in the figure to the right, the option is not active for channel 1.
Note: In the MT-200 analysis software, the J-point is located 56 ms after the trigger point (the point in the QRS complex at which the slope is greatest). The ST-point is located x ms after the J-point, where x is a value in the range of 10 ms to 100 ms (see above). Thus, when the heart rate changes significantly, correct values of ST-segment shifts can only be obtained with an adaptation of the ST measurement point (the higher the heart rate, the smaller the value x ms after the J-point).
The number of templates to be defined are set here.
The SAM program is currently under test and this option is only displayed when the SAM dll file is installed.
This defines the analyse program used for analysing a recording. The Monec program is the older program and the SAM the newer program currently under development. Using either program will make no difference to the analysed data. However at the current time the Monec software is the only authorised analysis software and must be selected.
Page 57

6 Viewing and Editing a Recording6.17 Editing Patient Data/Recording MT-101/MT-200
6.17 Editing Patient Data/Recording
Patient dat In this screen the patient details at the time of the recording can be viewed, entered or edited
– Last name, first name– Pat. number– Date of birth*– Gender– Height, weight– Pacemaker - fitted or not]– Station– Address and telephone number
The play button (1) is active when the patient ID has been entered before the recording was commenced. Click the button to hear the recorded ID.
• * If the year is entered using two digits only, the program calculates the date of birthautomatically based on the current PC date settings. The patient's age is in thiscase always between 1 and 99 years.
Enter the "Patient/Recording Data" window to carry out the following:
• Enter or edit patient data - name, weight, height, DOB etc.• Enter the date/time of the recording• View the settings that were used for the analysis of the current recording • Enter medication, diagnosis, comments etc.To view the above data, select in the "Patient" menu the option "Patient/Recording Data".
Six entry options for editing patient data are available in the window, as shown on the following pages.
1
If pacemaker pulses are to be displayed in the recording, the “Pacemaker” box must be checked before the recording is made - see para. 5.1.1 Pacemaker, page 21.
Page 58

Art.
no.:
2.51
0492
rev.
: bViewing and Editing a Recording 6
User Guide Editing Patient Data/Recording 6.17MT-101/MT-200
• If the year is entered using four digits, patients can be 100 years or older. In both cases, the program stores the date of birth as a four digit value.
Recording data In this screen, you can enter/edit the date and time of the recording. On the right hand side, you can also see the analysis settings for the recording analysis.
Assignment In this screen, you can enter/edit referral details and medication.
Diagnosis This gives a text entry field for entry of diagnostic analysis and/or comments. When a printout of the analysis summary is obtained, the diagnosis and comments are included on the same page.
HRV Day/Night This defines the start of the day and night periods for HRV analysis.
Page 59

6 Viewing and Editing a Recording6.17 Editing Patient Data/Recording MT-101/MT-200
Cover Letters This defines the recipients and addresses of the cover letter and the information categories to be included in the letter. Note that the office address printed with the cover letter, is entered in system setting - see para. 8.5 System Settings, page 75
Page 60

Art.
no.:
2.51
0492
rev.
: bViewing and Editing a Recording 6
User Guide Printing 6.18MT-101/MT-200
6.18 Printing
6.18.1 Print preview / Printing a specific pageThis function enables the display of the entire printout page by page before printing it.
Click on the "Print Preview " icon or select in the "Patient" menu the option "Print Preview (User-defined)"
Select the required data and click on "OK" The selected data can then be viewed page by page in printout format.
For other printout options, see para. 8.1 Print Formats, page 68For a description of the printout data see para. 8.1.4 User-defined print formats, page 70.
Page 61

6 Viewing and Editing a Recording6.18 Printing MT-101/MT-200
6.18.2 Obtaining a printout:
Several print settings are available depending on the installed printer drivers. The MT-200 program adopts the driver print settings. The various options are mostly self explanatory and are fully explained in the handbook for your computer or operating system.
6.18.3 Printing a selected half hour ECG segment1. In the ECG view, use the mouse to highlight an ECG segment (1). 2. First click on the Centre icon (2), and then on the Print direct (1/2 h) icon (3). A half hour segment of the ECG recording is printed with the segment selected in the middle of the printed page; i.e. approximately a 1/4 hour on either side of the selected segment is printed
To obtain a printout of the displayed recording,
Click on the "Print" icon or select in the "Patient" menu the option "Print"
The printout will contain all data defined as standard. The standard printout settings are defined in the menu “Options” > “Print Formats” see para. 8.1 Print Formats, page 68). There is also a preview option for all print layouts for individual selection before printing. This function is called “Show print-formats before printing” and when checked enables individual selection of data before printing.
1
2
3
Page 62

Art.
no.:
2.51
0492
rev.
: bMiscellaneous Functions 7
User Guide E-Mail and PDF Functions 7.1MT-101/MT-200
7 Miscellaneous Functions7.1 E-Mail and PDF Functions
7.1.1 PDF files with Acrobat ReaderThe MT-200 pdf function will only work with Acrobat Reader version 4.0 or later. This is available on the SCHILLER software CD and must be installed before pdf files can be generated or viewed. If an earlier version of Acrobat Reader is installed on your computer, it must first be uninstalled before installing V4.0 Proceed as follows:
1. Access the Windows uninstall program under Desktop/My computer/control pan-el/ > add/remove programs.
2. In the list, select Acrobat and click the "add/remove" icon. You will be prompted to confirm deletion.
3. When the old version has been uninstalled, the new version can be installed from the SCHILLER CD-ROM in the required language.
7.1.2 Editing PDF filesPDF files generated with the MT-200 program can be edited with Adobe Acrobat (version 4.0). To do this, the pdf file must be opened in Adobe Acrobat. Close the file again in Adobe Acrobat before opening the MT-200 program. If Adobe Acrobat is opened when using the MT-200 software, it is not possible to open the pdf files in the MT-200 software.
Page 63

7 Miscellaneous Functions7.2 Saving a Recording MT-101/MT-200
7.2 Saving a Recording
7.2.1 Saving a recording in MT-200 or PDF formatRecordings can be saved in original MT-200 or in pdf format. The advantage of pdf format is that it is compressed and therefore the stored recordings take significantly less space on the harddisk than normally stored recordings.
Three methods are available to store a recording as follows:
1. With the mouse click on the "Save recording" icon.Clicking on the icon itself saves the recording in original MT-200 format. Clicking on the arrow to the right gives you the options of "Save" (in original MT-200 format) and "Save as a PDF File".
2. Open the "Patient" menu with the mouse and click on "Save" or "Save as PDF File".
3. Or hold the Control key pressed and press the "S" key on your keyboard. This saves the files in original MT-200 format.
When a recording is saved as a pdf file, you are prompted to select specific data for saving.
The Adobe Acrobat program is opened automatically and the recording is saved as a pdf file. You are then prompted to discard the original file if required.
Page 64

Art.
no.:
2.51
0492
rev.
: bMiscellaneous Functions 7
User Guide Saving a Recording 7.2MT-101/MT-200
7.2.2 Sending a recording by e-mail
7.2.3 Importing recordings Recordings can be imported from floppy disk, CD-ROM, network drives etc. Select ‘Import‘ (see above), to import the data from the source to the target directory. The target directory is defined under "Options/System/Directories".
Select "Import/MT-101 RAW - Data Files" to import the files from the SD card.
7.2.4 Exporting recordingsRecordings can be exported to SD card, CD-ROM, network drives, or any other storage medium. Select the "Export" option in the "Patient" menu. There are three different export options: "Current recording", "Not yet exported recordings" and "Select recordings". The data is exported to the drive and directory defined under "Options > System > Directories > Export Directory.
When the option "Export/RR distances" is selected, a text file containing the numerical values of the RR distance is exported.
When the option "Export/Enabled cover letters" is selected, the cover letter can be exported as an rtf file and processed in a word processing system.
Recordings (original MT-200 or pdf format) can be sent over the Internet by e-mail. The compressed pdf files are much smaller and can therefore be sent in less time. Only the currently displayed recording can be sent by e-mail. Click on ‘Send EMail‘ (original MT-200 file) or "Send EMail as PDF File" in the Patient menu. You are then prompted to enter the recipient's address. Click on "OK" to send.
Page 65

7 Miscellaneous Functions7.3 Deleting a Recording MT-101/MT-200
7.3 Deleting a Recording
A complete 3-channel 24 hour recording requires approximately 16 Mbytes of storage space on the harddisk. This means that your harddisk can quickly fill if recordings are not deleted when no longer required.
For every recording, there are three files (*.cmp, *.qrs and *.bak). All files have to be deleted. Proceed as follows:
1. Open Windows Explorer.2. Go to “Folders“ and search for the MT-200 folder. Open the "Data" sub-folder
containing the patient data. (If you have specified another location for the storage or recordings, open that folder).
3. Select in turn the *.cmp, *.qrs and *.bak files of the recording you wish to delete.4. Press the right mouse button to display the Explorer menu. 5. Select the "Delete" option and click with the right mouse button. 6. If you are sure you no longer need the recording, click on "Yes". Empty the
Recycle Bin.
Recordings can be automatically deleted when between 5 and 100 have been stored. The auto deletion function is detailed in the settings section - see para. 8.5.4 Data storage mode (auto delete), page 76.
Page 66

Art.
no.:
2.51
0492
rev.
: bMiscellaneous Functions 7
User Guide Accelerator Keys 7.4MT-101/MT-200
7.4 Accelerator KeysA number of keys and key sequences exist to enable you to quickly carry out commonly used program functions. An overview of these keys is given below:
Key FunctionCtrl + N New patient - entry of patient dataCtrl + O Opening the list of saved recordingsCtrl + S Save of the currently displayed recordingCtrl + G Move to the beginning of the recordingF8 Move to previous event.F9 Move to next event.Arrow Scrolling back/forward in the recording (right/left keys)F5 Display of event viewF6 ECG (24 h) viewF7 Display of event chart (graph) view
Ctrl + F11 Move to the segment in which the minimum sinus HR has been de-tected
Ctrl + F12 Move to the segment in which the maximum sinus HR has been de-tected
Alt + F12 Move to the segment in which the minimum NN interval has been de-tected
Alt + F11 Move to the segment in which the maximum NN interval has been de-tected
Shift + F11 Move to the segment in which the minimum HR has been detectedShift + F12 Move to the segment in which the maximum HR has been detected
F12 Move to the segment in which the minimum RR interval has been de-tected
F11 Move to the segment in which the maximum RR interval has been de-tected
N Classification of the selected QRS complex as normal V Classification of the selected QRS complex as VES S Classification of the selected QRS complex as SVES A Classification of the selected QRS complex as artifact B Identification of the highlighted complex as the beginning of an event E Identification of the highlighted complex as the end of an event + Jump to next event- Jump to previous event
Page 67
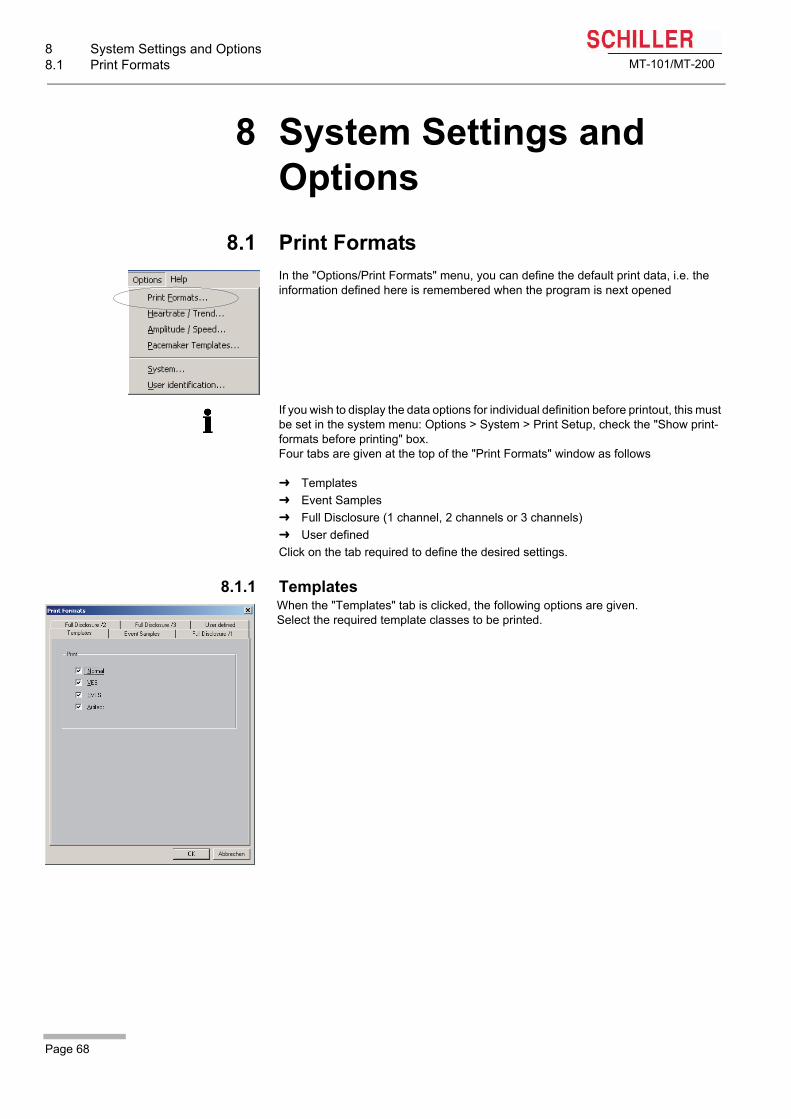
8 System Settings and Options8.1 Print Formats MT-101/MT-200
8 System Settings and Options
8.1 Print FormatsIn the "Options/Print Formats" menu, you can define the default print data, i.e. the information defined here is remembered when the program is next opened
Four tabs are given at the top of the "Print Formats" window as follows
TemplatesEvent SamplesFull Disclosure (1 channel, 2 channels or 3 channels) User defined
Click on the tab required to define the desired settings.
8.1.1 Templates
If you wish to display the data options for individual definition before printout, this must be set in the system menu: Options > System > Print Setup, check the "Show print-formats before printing" box.
When the "Templates" tab is clicked, the following options are given. Select the required template classes to be printed.
Page 68

Art.
no.:
2.51
0492
rev.
: bSystem Settings and Options 8
User Guide Print Formats 8.1MT-101/MT-200
8.1.2 Event samples
8.1.3 Full disclosure (1, 2 or 3 channel)
In this window, event categories are defined for sample event printing.
A maximum of three events per category can be printed. If more than three events have been recorded for an event category, the first recorded event of every eight-hour cycle will be printed. Event-samples selected by the user (in the event-samples view) are printed as defined.
Check the relevant boxes. The amplitude and speed refer to the print size. If “Auto” is selected for the amplitude, the program automatically selects the optimal setting.
Here you can select to print the complete 24 hour recording or selected segments.
Click on "Whole Recording" or on "Selected periods of time". With the latter selection, the half hour segments to be printed can be selected.
NoteThe recorded half hour segments apply to the currently displayed ECG. When no Holter recording is displayed, no time segments can be selected.
In the "Channels" box at the bottom right, you can select channel 1, channel 2 or both channels for the ECG full disclosure.
Page 69

8 System Settings and Options8.1 Print Formats MT-101/MT-200
8.1.4 User-defined print formats
The following data can be selected for print:
Cover Letter The cover letter see para. 3.2.1 During the Recording and Patient Information, page 17.
Holter report This gives a statistical overview of the recording and includes:
• Name, sex, date of birth, age, weight and height of the patient• Start/stop time and duration of the recording• Summary of the heart rate analysis: Total number of beats; max., average and min.
heart rate with time of occurrence; total number, duration and time of the respectivebradycardia, tachycardia and pause; number of min. and max. RR intervals withtime of occurrence
• Sinus rhythm analysis: time of occurrence of the max. and min. heart rate • SVES analysis (SVES, SV tachycardia): total number and max. number in one
hour and other statistical data; occurrence and duration of the longest and highestSV tachycardia
• VES analysis (couplet, triplet, V tachycardia, bigeminy, trigeminy): total numberand max. number in one hour and other statistical data; occurrence and durationof the longest and highest V tachycardia, bigeminy, trigeminy.
• Manually entered diagnosis and assignment information (see section see para.6.17 Editing Patient Data/Recording, page 58.
• HR Trend/EventsThis page corresponds to the event view and gives:
• An overview of all recorded events of the 24 hour recording in tabular form• The heart rate trend over the entire recording giving the max., min. and average
heart rates
Analysis Summary Statistical overview for every hour of the recording for:
• Heart rate - total number of beats, min./max. rate, number of tachycardias, brady-cardias and pauses
• Supraventricular arrhythmias - number of couplets, triplets, SV tachycardias,bigem. and trigem.
• Ventricular arrhythmias - number of couplets, triplets, SV tachycardias, bigem. andtrigem., R on T
In this window, the data sections to be printed are defined.
NoteA header is given on every printed page, giving the following information:
• User identification - entered in the "Options" menu"• Date and time of the recording• Patient name and number
Page 70

Art.
no.:
2.51
0492
rev.
: bSystem Settings and Options 8
User Guide Print Formats 8.1MT-101/MT-200
• Manual event recording/lead-off/artifacts - number
Event Chart Report Graphical view for all event categories giving the number of events in every hour of the recording
Min/Max HR/RR Zoom views of the recording segments in which the max. and min. heart rates as well as the max. and min. RR intervals were detected
Event Samples For each event category, up to three events are printed. If more than three events have been recorded for an event category, the first recorded event of every eight-hour cycle will be printed. Event-samples selected by the user (in the event samples view) are printed as defined.
As many or as few event categories can be printed as required according to the definitions for event samples (see "Event Samples" on previous pages).
User Selected Zoom print of a section of the recording that has been selected by the user.
The user selection is made:
Full Disclosure Printout of the complete recording or of selected 30 minute sections (one page per 30 minutes).
You can select channel 1, 2 or 3 or any combination.
ST Analysis Overview and Trend The following information will be printed:
• Measurement table of all ST episodes• Trend of the ST amplitude and ST slope for channels 1 and 2• Heart rate trend (max., min. and average HR)
ST Episode Samples The four ST episodes with the highest recorded ST levels are given (with the highest recorded ST level printed first). Each sample gives the maximum level reached during the episode, and the slope, the heart rate and the time of occurrence.
Marker Prints all manual markers (set during the recording when the patient presses the event button on the MT-101).
• in the "Edit" menu - "Select User Sample" or • in the zoom view, by positioning the cursor on the desired complex and clicking on
the "Select" (print) icon.To undo the selection, click on the menu "Edit/Delete all user samples".
Page 71

8 System Settings and Options8.2 Heart Rate Trend MT-101/MT-200
8.2 Heart Rate Trend
The heart rate is calculated as follows:
• The heart rate is calculated (as beats/minute) over either 4, 8 or 16 contiguous con-tinuously averaged heart beats as shown in the example below.
• The calculated maximum and minimum of these averaged heart rates are given asthe highest and lowest heart rates measured over 1, 2, 5 or 10 minutes in the HRtrend diagram.
• The average heart rate is calculated from the individual heart rates in the trendgraph.
ExampleThe heart rate setting is 8; the average setting is 2 minutes:
The heart rate is calculated over 4, 8 or 16 beats and averaged over 1, 2, 5 or 10 minutes. To define the corresponding settings, select the "Heart Rate/Trend" option in the "Options" menu.
1. Select the relevant settings. 2. Click "OK" to confirm, or "Cancel" to keep the current settings. The definitions for the calculation are applied to the entire recording.
Page 72

Art.
no.:
2.51
0492
rev.
: bSystem Settings and Options 8
User Guide Amplitude/Speed 8.3MT-101/MT-200
8.3 Amplitude/Speed
Event samples
ECG window
Zoom window
Live data
At the top of the window are four icons which select sub screens for data entry:
This refers to the event samples view. Three different speeds and three different amplitudes are available.
This refers to the ECG view.
Four different speeds and three different amplitudes are available. Note that the larger two amplitudes (2.5 & 5 mm/mV) can only be set when one of the two higher speeds is set (i.e. 6.25 or 12.5 mm/s). Similarly, the smaller two amplitudes (1.25 and 2.5 mm/mV) can only be set when a speed of 3 mm/s or 4 mm/s is selected.
This refers to the Zoom view
Three different speeds and three amplitudes are available.
This refers to the monitor screen displayed when the Holter unit is connected to the PC before commencing a 24 hour recording. Only two amplitudes can be set.
Page 73

8 System Settings and Options8.4 Pacemaker Templates MT-101/MT-200
8.4 Pacemaker TemplatesHere the user can define more meaningful individual names to the pacemaker templates in place of the defaults, such as "DDD pacemaker template" instead of "PM Template 1 A". Any title up to 20 characters can be defined for each template.
Page 74

Art.
no.:
2.51
0492
rev.
: bSystem Settings and Options 8
User Guide System Settings 8.5MT-101/MT-200
8.5 System Settings
Seven tabs are given at the top of the System window as follows
Print SetupLanguage/ UnitsDirectoriesData Storage ModeHolterGDTOffice Address
Click on the tab required to defined the desired settings.
8.5.1 Print setup
8.5.2 Units and language
Access the system options by clicking on "System" in the "Options" menu.
Also see see para. 8.5.1 Print setup, page 75.
"Print Setup" gives the following options:
Margins Here, the free space between the top of the page and the top ofthe printing and between the left margin of the page and the leftmargin of the printing can be defined.
Font Size Set to your preference. The actual print size depends on yourprinter. Some experiment may be necessary to determine yourpreference. The font size defined here does not affect the sizeof the data printout.
Show print formats Check the ‘Show print-formats before printing‘ box to display theprint format dialogue before printing. When the box is checked,the user can select the data groups to be printed before everyprintout.
Use this screen to define the units that you wish to use in the MT-200 program for patient data. The language setting refers to the printout and program.
Units Select between cm/kg or ins/lbs. Language Select the desired languageCable set Select the correct patient cable
Page 75

8 System Settings and Options8.5 System Settings MT-101/MT-200
8.5.3 Directories
8.5.4 Data storage mode (auto delete)
8.5.5 USB / AT-card Connection and Test transmission Mode
Use the directories screen to define the directory/folder where you wish to store recordings and where you want to export recording data. You can of course select SD card or any another storage medium if required. Enter the new directory paths as required.
A complete 3-channel 24 hour recording requires approximately 16 Mbytes of storage space which is stored automatically after downloading. This means that your harddisk can quickly fill if recordings are not deleted when they are no longer required. The auto delete function allows the number of saved recordings to be automatically limited (in the range of 5 to 100). When the set limit (of e.g. 20) has been reached and a new recording is made, the oldest saved recording is deleted automatically.
Check the "Auto-Delete" box and select the number of recordings that you wish to have stored on your system before overwriting.
The type of installation (USB converter or AT card) is defined on installation see para. 10 Installation, page 81. The address of the AT card is also defined on installation. Use this screen to check the setting and redefine if necessary.
Checking the Connection between the Holter and PCEnsure that the correct box is checked for the type of installation (USB Converter or AT card), and click the `Test Connection` tab to check the integrity of the opto cable transmission. Follow the instruction on the screen.
Page 76

Art.
no.:
2.51
0492
rev.
: bSystem Settings and Options 8
User Guide System Settings 8.5MT-101/MT-200
8.5.6 GDT
8.5.7 Office Address
Use the GDT screen to define the default directory where you wish to store recordings and export recordings when in a GDT network. Check the “GDT Directory” box, and enter the directory and abbreviations.
Define the address that will be printed on the cover letter
Page 77

8 System Settings and Options8.6 User Identification MT-101/MT-200
8.6 User IdentificationThe user identification is printed at the top of every page. This can be the name of the physician, the user, the department etc.
1. Select "User identification" in the "Options" menu. 2. Enter the desired user identification.3. Click "OK" to confirm, or "Cancel" to keep the current settings.
Page 78

Art.
no.:
2.51
0492
rev.
: bMaintenance 9
User Guide Visual Inspection 9.1MT-101/MT-200
9 Maintenance
9.1 Visual Inspection Visually inspect the unit and cable assemblies for the following:
Device casing not broken or crackedLCD screen not broken or crackedElectrode cable sheathing and connectors undamaged. No kinks in the cable.USB cable sheathing and connectors undamaged. No kinks in the cable.Input/output connector undamaged.
In addition, at the same time as the visual inspection, the MT-101 should be switched on, the menu scrolled through, and some sample functions tested - see para. 2.4.1 Menu Overview, page 12. This will:
provide a basic software integrity checkcheck the LCD displayensure correct operation of the two control keys
All maintenance work must be carried out by a qualified technician authorised bySCHILLER AG. Only maintenance procedures given in this book, for example bat-tery replacement, visual inspection, etc., may be carried out by the user.
The following table indicates the maintenance intervals, the maintenance require-ment, and the person authorised to carry out the procedure.
Interval Maintenance ResponsibleEvery 6 months • Visual inspection of the unit and cables (see below) User
Every 12 months
• All maintenance work performed at the six month interval.• Function inspections according to the test instructions P300-01.• Safety test according to EN 60601-1 (1990), clause 20 according to the test
instructions P300-02.
Service staff author-ised by SCHILLER AG
Every 24 months• All maintenance work performed at the twelve month interval.• All measurement inspections and calibration according to the test instruc-
tions.
Service staff author-ised by SCHILLER AG
Defective units or damaged cables must be replaced immediately.
Page 79

9 Maintenance9.2 Cleaning the device and cable assemblies MT-101/MT-200
9.2 Cleaning the device and cable assemblies
9.2.1 Cleaning the device, electrode cable, and USB cableWipe with a dampened cloth and a mild cleaning solution. The manufacturer recommends a 70% alcohol solution.
Do not immerse the unit or the cable and sensors in liquid.Do not use aggressive cleaners.
Page 80
Art.
no.:
2.51
0492
rev.
: bInstallation 10
User Guide System Requirements 10.1MT-101/MT-200
10 Installation
10.1 System RequirementsTo install the MT-200 program, the system must fulfil the following minimum requirements:
• BM-PC or compatible system (800 MHz or more) and at least 256 MB RAM.• At least 1 GB of free disk space.• XGA 1024 x 786 resolution or higher.• USB port version 1.1.• Windows® 95 operating system or newer version.
The MT-200 program package comprises the following:• MT-200 CD-ROM• Hard-lock key (special code connector that must be connected to the parallel port
for the program to work)
10.2 Installation of MT-200 General Network License• The general network license enables full use of the program. A demo version of
the software is installed when the MT-200 program is installed without the licensenumber or hardlock key.
• The installation of MT-200 licenses is possible under Windows 98, Windows 2000and Windows XP for MT-200 software version 1.52 (or above). A correct installa-tion requires an installed Internet Explorer version 4.0 (or above).
• First install the MT-200 software (on each PC). After this, install the MT-200 gen-eral license on each PC of the network, from the special general license disk.
• The general license number is given in the menu "Help" > "About MT-200". Addi-tionally, it is indicated on the bottom of each page of print previews and printouts.
10.3 Network Licence Option• The software for the second user works like the complete MT-200 Holter version.
However, the software network license cannot read data from the MT-101 Holterrecorder.
10.4 Unpacking
This section is only applicable for initial installation. If the MT-200 program is already installed on the CS-200 diagnosis system or on your computer, skip this section.
Refer to the software license agreement. By opening the package, you accept the content of the agreement.
Page 81

10 Installation10.4 Unpacking MT-101/MT-200
1. Remove the hard-lock key from the box.2. Remove the antistatic protection cover.3. Put the package material back into the box and keep it at a safe place. If you have to return the CD-ROM or the hard-lock key to SCHILLER, the original package must be used as otherwise, the warranty will be void.
4. Examine the CD-ROM and the hard-lock key for visible failings. Report any damage immediately to your SCHILLER representative.
To prevent any damage of the hard-lock key caused by electrostatic charge, neutralise the static of your body before removing the card from its cover by:
• touching the computer's metal casing or • wearing around your wrist a special band connected with the computer casing for
isolation against the earth.
Page 82

Art.
no.:
2.51
0492
rev.
: bInstallation 10
User Guide Installing the Hard-Lock Key 10.5MT-101/MT-200
10.5 Installing the Hard-Lock KeyThe hard-lock key is a plug which contains a code to enable the program to be used. It is connected to the parallel port of your computer. The hard-lock key can be inserted at any time but we recommend that it is inserted before installing the program.
Before switching your computer on, insert the hard-lock key in the parallel port of your computer (on the back panel).
The picture given is an example only. For the exact location of the parallel port connector on your computer, refer to the computer's handbook.
If your printer is connected to the parallel port, the hard-lock key is inserted between the computer's printer connector and the printer cable.
Page 83

10 Installation10.6 Installing the MT-200 Program from the CD MT-101/MT-200
10.6 Installing the MT-200 Program from the CD1. Insert the CD into the CD-ROM drive.2. On the CD open the MT-200 program folder and ‘double click‘ elect the start
program MT-200_x_xx.exe. (where x is the software release)3. Follow the instructions on the screen to install the program
10.7 Installing a USB DriverWhen the MT-101 is first connected to a computer, the operating system will automatically detect the connection and open the installation program.
1. Turn on the computer.2. Switch on the MT-101 Holter and connect the USB cable to the USB connector.
The dialogue assistant for new hardware is displayed.3. Check the "Search for a suitable driver..." box and confirm with "Next".4. Check the "Specify a location" box and select the file "UBcMt100" in the folder
"MT-200/982k" on the CD and confirm. The driver will be copied to your PC.
If you work with an MT-101 Holter, check "USB". MT1-4 AT Card is only selected if you install this software as an update of a PC with a previous version.When the computer reopens, the MT-200 icon appears on the desktop.Double click on the icon. The system only requires a few seconds to open the program.To enable the connection of the MT-101 to the USB, the required driver must be installed from the CD. See next section.
Page 84

Art.
no.:
2.51
0492
rev.
: bTechnical Data 11
User Guide Microvit MT-101 11.1MT-101/MT-200
11 Technical Data11.1 Microvit MT-101
Manufacturer SCHILLER AG
Device name Microvit MT-101 Holter
Dimensions 94 x 61 x 20 mm
Weight 110 grams (with battery)
Battery type 1 x AA/LR6 alkaline 1.5 V or 1 x accumulator NiMH 1.2 V, > 2100 mAh
Power consumption 95 mW (recording)
Data acquisition Simultaneous sampling of two or three channels, differential
Data transmission Built-in USB1.1 interface
Memory medium SD memory card 64 MB
Environmental conditions Temperature, operating: 10 °C to 40 °CTemperature, storage: 10 °C to 50° Relative humidity: 25 % to 95% (non condensing)Atmospheric pressure: 700 hPa to 1060 hPa
ECG patient cable 2-channel: 4 electrodes, 3-channel: 6 electrodes
ECG amplifier Sampling frequency: 500 HzDigital resolution: 2.5 µV 12 bitDynamic range: ±5.12 mV ACMax. electrode potential: ±300 mV DCFrequency response: 0.05 to 150 Hz (-3 dB)Input impedance: >10 MOhmsPacemaker detection ± 2...200 mV/0.1...2 msCommon mode rejection: >80 dB
Display LCD 98 x 64 dots
Display speed 12.5/20/35 mm/s
Max. displayed amplitude 5 mVpp
Dialogue language German, English, French, Italian, Spanish, Portuguese, Russian, Swedish
Patient input protection Fully floating and isolated, defibrillation protection 5 KV
Safety standard EC/EN 60601-1, CF classified (with internal power supply) IEC/EN 60601-2-25
EMC EC/EN 60601-1-2
Conformity CE according the directive 93/42/EEC, class IIa
Page 85

11 Technical Data11.2 MT-200 Software MT-101/MT-200
11.2 MT-200 SoftwareRequirements on the PC
Operating system WINDOWS 95, 98 SE, 2000 or XP
Processor Pentium 800 MHz or higher
Harddisk capacity Min. 4 GB (10 GB recommended)
Memory space for software 10 MB free memory
Memory space for recordings One record needs 64 MB of free memory
RAM 128 MB (256 MB recommended)
Monitor resolution XGA 1024 x 768
Page 86
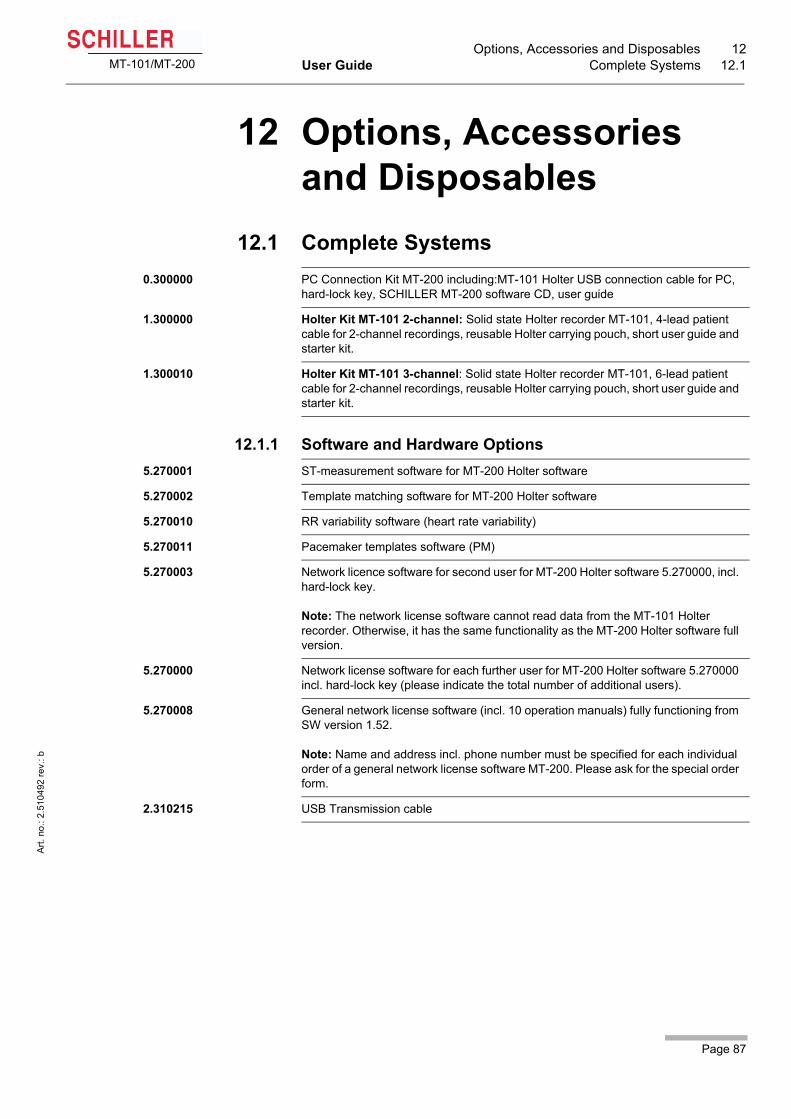
Art.
no.:
2.51
0492
rev.
: bOptions, Accessories and Disposables 12
User Guide Complete Systems 12.1MT-101/MT-200
12 Options, Accessories and Disposables
12.1 Complete Systems
12.1.1 Software and Hardware Options
0.300000 PC Connection Kit MT-200 including:MT-101 Holter USB connection cable for PC, hard-lock key, SCHILLER MT-200 software CD, user guide
1.300000 Holter Kit MT-101 2-channel: Solid state Holter recorder MT-101, 4-lead patient cable for 2-channel recordings, reusable Holter carrying pouch, short user guide and starter kit.
1.300010 Holter Kit MT-101 3-channel: Solid state Holter recorder MT-101, 6-lead patient cable for 2-channel recordings, reusable Holter carrying pouch, short user guide and starter kit.
5.270001 ST-measurement software for MT-200 Holter software
5.270002 Template matching software for MT-200 Holter software
5.270010 RR variability software (heart rate variability)
5.270011 Pacemaker templates software (PM)
5.270003 Network licence software for second user for MT-200 Holter software 5.270000, incl. hard-lock key.
Note: The network license software cannot read data from the MT-101 Holter recorder. Otherwise, it has the same functionality as the MT-200 Holter software full version.
5.270000 Network license software for each further user for MT-200 Holter software 5.270000 incl. hard-lock key (please indicate the total number of additional users).
5.270008 General network license software (incl. 10 operation manuals) fully functioning from SW version 1.52.
Note: Name and address incl. phone number must be specified for each individual order of a general network license software MT-200. Please ask for the special order form.
2.310215 USB Transmission cable
Page 87

12 Options, Accessories and Disposables12.1 Complete Systems MT-101/MT-200
12.1.2 Accessories ECG Holter system2.100534 Holter Hook-up Kit MT-101, including: Alcohol prep pads (2), surgical prop razor
(1), electrodes (12), abrasive pads (1).
2.100850 Battery AA, 1.5 V alkaline
2.400103 4-lead patient cable for 2-channel recordings
2.400102 6-lead patient cable for 3-channel recordings
2.156025 Reusable Holter carrying pouch including belt
2.310215 USB transmission cable from MT-101 to PC
2.155054 Blue Sensor Holter electrodes VL-00-S/25 in set of 25
Page 88

Art.
no.:
2.51
0492
rev.
: bPatient Diary 13
User Guide Schiller CD 13.1MT-101/MT-200
13 Patient Diary13.1 Schiller CD
A copy of the patient diary is given on the following pages. The patient should fill in the diary with all details as required.
The original of this diary is provided on the SCHILLER CD (Art. No. 2.100256) in word and pdf format for editing and printing as required
Page 89

13 Patient Diary13.1 Schiller CD MT-101/MT-200
.
Patient Diary
MT-101
Art. No.: 2.510490b EN
Name: ........................................ Surname: .......................................................................
Date: ...................................................... Start Time: ......................................................
General• The unit is not waterproof. Do not take a bath or shower during the recording.• Please make a diary entry at least every two hours while awake.
Event recording• Press either of the event keys (1) or (2) to record an event.• Confirmation is given that the event is being saved.• Always make an entry in the diary when the event key is pressed.
When to register an event• Pain, Discomfort, Dizziness, Light-headedness, Palpitations , etc.,
When to make a diary entry• Every time an event is registered, stressful activities for example, going
up stairs, carrying groceries, bicycling etc., all meals and medications,bowel movement and urination. Also describe your dominant sleepposition, e.g. back, right side etc.
Changing the battery during a 48/72 hour recording• Change battery when an audible beep is heard and the message
‘BATTERY LOW - change battery’ is displayed.• Press button (1) or (2), and make an entry into your diary. DO NOT
SWITCH THE DEVICE OFF.• Open battery compartment.• Replace battery with a new one of the same type. Observe correct
polarity! Insert the lugs (A), close cover (B) and firmly press down (Pos. C)until cover clicks in place.
• ECG recording is automatically resumed by pressing button (1). After afew seconds the message ‘ECG recording restart’ is displayed while theunit re-initialises. This is followed by the message ECG recording’.
• The battery must be replaced within 5 hours for the recording to continue.
Replacing the electrodes during a 48/72 hour recording• The electrode body pads should not need
replacing during the recording, however, thecable electrodes can be removed temporarilyduring a 48 or 72 hour recording to enable youto wash.
• Do not get the electrodes or device wet.• Remove cable electrodes but not the electrode
pads.• Re-attach the electrode cables to the body
pads and secure the leads in position withtape.
• Recording resumes when the electrodes are replaced.
12345
12345
WHITE 2+
GREEN 1+
YELLOW 2-
BLUE 3-
ORANGE 3+
RED 1-
6-LEAD CABLE
12345
12345
WHITE 2+
GREEN 1+
RED 1- YELLOW 2-
4-LEAD CABLE
1 2
REC 12:00Key pressedSaving event!
Page 90

Art.
no.:
2.51
0492
rev.
: bPatient Diary 13
User Guide Schiller CD 13.1MT-101/MT-200
MT-101
Time Activity Symptoms
Page 91

13 Patient Diary13.1 Schiller CD MT-101/MT-200
Page 92

Index 14User Guide
Art.
no.:
2.51
0492
rev.
: b
MT-101/MT-200
14 IndexAAccelerator Keys ................................... 67Accessing and Opening Files ................ 28Amplitude
ECG Window .................................... 73Event Samples ................................. 69Live Data .......................................... 73Zoom Window .................................. 73
Amplitude/Speed ................................... 73Analysis Summary ................................. 31Analyze ECG-Events ............................. 54Analyzing/re-analyzing the Recording ... 54Arrhythmias (analysis options) .............. 56
BBar chart ................................................ 37Battery
State ................................................. 13Status Display .................................. 11Type ................................................. 13
CChecking the ECG signal ...................... 16Commencing a Holter Recording .......... 16
DDeleting a Recording ............................. 66Diagnosis ............................................... 59Direct keys ................................... 44, 53
EECG View .............................................. 35Editing PDF Files ................................... 63Event & Zoom Views ............................. 29Event Chart ........................................... 37Event Samples View ............................. 33Exporting Recordings ............................ 65
FFull Disclosure ....................................... 69Function icons ....................................... 24
GGeneral Network License ...................... 81
HHeart rate evaluation parameters .......... 50Heart Rate Trend ................................... 72Heart Rate Variability .................. 49, 51Heart Rate View .................................... 38
IInserting/Changing the Battery .............. 13Installation
Hard-lock key ................................... 83Program ........................................... 84System Requirements ...................... 81
PPacemaker Templates ................ 45, 74PDF
Sending a Recording by E-Mail ........ 65Pictograms .............................................. 7Print
Define margins ................................. 75Font size ........................................... 75
Print Formats ......................................... 68Print Setup ............................................ 75
RReclassifying/Editing a QRS Complex .. 52Recycling ............................................... 13
SSafety Symbols ....................................... 7Saving a Recording ............................... 64Speed
ECG Window .................................... 73Event Samples ................................. 69Live Data .......................................... 73Zoom Window .................................. 73
ST Measurement Table ......................... 40ST Trend View ...................................... 39Start recording via MT-101 .................... 16Start recording via MT-200 .................... 21System Settings .................................... 75
Directory ........................................... 76Print Setup ....................................... 75Units and Language ......................... 75
TTemplate Matching ................................ 41
UUser identification .................................. 70User-Defined Print Formats .................. 70
VViewing a Recording ............................. 24
Page 93

Index 14User Guide
Art.
no.:
2.51
0492
rev.
: b
MT-101/MT-200
Page 94