260 experimental study of transient nitric oxide, smoke...
TRANSCRIPT

Experimental study of transient nitric oxide, smoke, andcombustion noise emissions during acceleration of anautomotive turbocharged diesel engineC D Rakopoulos*, A M Dimaratos, and E G Giakoumis
Internal Combustion Engines Laboratory, Department of Thermal Engineering, School of Mechanical Engineering,
National Technical University of Athens, Athens, Greece
The manuscript was received on 19 January 2010 and was accepted after revision for publication on 30 July 2010.
DOI: 10.1243/09544070JAUTO1493
Abstract: The control of transient emissions from turbocharged diesel engines is an impor-tant objective for automotive manufacturers, since newly produced engines must meet thestringent criteria concerning exhaust emissions levels as dictated by the legislated Transient CyclesCertification. In the current study, experimental tests are conducted on an automotive, turbo-charged diesel engine in order to investigate the formation mechanism of nitric oxide, smoke, andcombustion noise emissions under various acceleration schedules experienced during dailydriving conditions. To this aim, a fully instrumented test bed was set up in order to capture thedevelopment of key engine and turbocharger variables during the transient events. Analyticaldiagrams are provided to explain the behaviour of emissions development in conjunction withturbocharger and governor/fuel pump response. Turbocharger lag was found to be the main causefor the emission spikes during all test cases examined, with the engine calibration playing a vitalrole. The analysis was extended with a quasi-steady approximation of transient emissions usingsteady-state maps, in order to highlight the effect of dynamic engine operation on pollutants andcombustion noise emissions.
Keywords: transient emissions, nitric oxide, smoke, combustion noise, acceleration,automotive diesel engine
1 INTRODUCTION
The turbocharged diesel engine is currently the pre-
ferred powertrain system in medium and medium-
large unit applications (trucks, land traction, ship
propulsion, electricity generation, etc.). Moreover, it
continuously increases its share in the highly compe-
titive automotive market, having already ensured a
market share comparable to the one of the gasoline
engine [1]. The most attractive feature of the diesel
engine is its very good fuel efficiency, which can
surpass a value of 40 per cent in vehicular applica-
tions and even 50 per cent in large, two-stroke units
used for marine propulsion or electricity generation.
Consequently, diesel-engined vehicles achieve much
lower fuel consumption and reduced carbon dioxide
emissions than their similarly rated spark ignition
counterparts over the entire operating range and for
their whole lifetime.
Traditionally, the study of diesel engine operation
has focused on the steady-state performance, with
much less attention paid to their transient operation.
However, the majority of daily driving schedules in-
volve transient conditions with only a very small
portion of a vehicle’s operating pattern being truly
steady state, e.g. when cruising on a motorway. Thus,
the experimental and modelling investigation of diesel
engine transient operation has turned out to be an
important objective for engine manufacturers, inten-
sified by the fact of significant deviations experienced
when comparing instantaneous transient emissions
with their quasi-steady counterparts [2–6]. Acknowl-
*Corresponding author: Internal Combustion Engines Labora-
tory, Department of Thermal Engineering, School of Mechanical
Engineering, National Technical University of Athens, 9 Heroon
Polytechniou St, Zografou Campus, 15780, Athens, Greece.
email: [email protected]
260
Proc. IMechE Vol. 225 Part D: J. Automobile Engineering

edging the previously mentioned findings, various
legislative directives in the European Union, Japan,
and the US, have drawn the attention of manufacturers
and researchers from all over the world to the transient
operation of diesel engines in the form of Transient
Cycles Certification for new vehicles [7–9].
The fundamental aspect of transient conditions lies
in its operating discrepancies compared to the res-
pective steady-state ones (i.e. operation at the same
engine rotational speed and fuel pump rack position).
While during steady-state operation engine speed and
fuelling and so, consequently, all the other engine and
turbocharger properties remain practically constant,
under transient conditions both the engine speed and
fuel supply change continuously. Consequently, the
available exhaust gas energy varies, affecting turbine
enthalpy drop and, through the turbocharger shaft
torque balance, the boost pressure and the air supply
to the engine cylinders are influenced. However, due
to various dynamic, thermal, and fluid delays in the
system (mainly originating in the turbocharger mo-
ment of inertia – turbocharger lag), combustion air
supply is delayed compared to fuelling, thus adversely
affecting torque build-up and emissions [2].
It is the turbocharger’s mass moment of inertia that
proves to be the most significant delay decisively
influencing engine performance and emissions. The
importance of various other transient discrepancies
compared to steady-state operation, can be evaluated
through a qualitative order-of-magnitude analysis, a
technique widely applied in unsteady computations in
turbomachinery [10, 11]. Thus, after the turbocharger
inertia, it is the cylinder and the exhaust manifold wall
temperature, the flow inertia in filling the manifolds,
and the in-cylinder trapped exhaust gas (as a result of
the high back pressure combined with low boost
pressure) that play a vital role in the engine’s transient
performance, contributing to the emission peaks expe-
rienced under dynamic conditions.
However, this vital issue of emissions overshoot
during transients has not been investigated adequately
but rather segmentally, owing to the difficulties that
both the modelling and experimental approaches
encounter. For the simulation procedure, a multi-
zone (or at least a two-zone) combustion model is
needed for the prediction of exhaust emissions. Such
models require careful estimation of a large number of
calibrated constants for each sub-model developed,
which forms a tremendous task. Furthermore, a
plethora of detailed engine data (turbocharger maps,
governor/fuel pump curves, valve train and piston
assembly characteristics etc.), which are usually un-
available, are required for a successful simulation of
transient processes. On the other hand, the experi-
mental investigation of transient emissions demands
highly complicated, sophisticated, and costly experi-
mental equipment, such as a fully automated test bed
with electronically controlled dynamometer and fast
response exhaust gas analysers.
As a result, relatively few experimental works have
been conducted so far (see, for example, [3, 12–16]),
while simulation studies are even more scarce [17–
20] with sometimes questionable results. In particu-
lar, as regards the transient numerical simulations,
two-zone and multi-zone combustion models have
been occasionally developed in the past, often with
only partial experimental validation mainly by rela-
tively simple and ‘slow’ response analysing techni-
ques (signal reconstruction, sampling method), a fact
that has limited the reliability of their results. Un-
surprisingly, alternative modelling approaches have
been proposed for predicting (diesel engine) transient
emissions, e.g. based on steady-state mapping and
applying correction factors to account for transient
discrepancies [21–23], or by reconstructing the mea-
sured signal recorded by conventional slow response
analysers [24, 25].
The aim of this study is to expand on the experi-
mental investigation of transient vehicular diesel
engine operation, and shed more light on the relevant
complex phenomena and underlying mechanisms of
emissions formation with respect to engine perfor-
mance. To this aim, an extended set of experimental
tests has been conducted on a medium-duty, turbo-
charged and after-cooled, direct injection, automotive/
truck diesel engine using ultra-fast response analysers,
in order to capture the instantaneous emissions during
each transient event. The investigation concerns cases
of transient operation experienced in daily vehicle
driving, i.e. acceleration with simultaneous load in-
crease as well as complex transients such as load
(resistance) increase followed by vehicle acceleration,
e.g. gear change during climbing up a hill.
The experimental investigation carried out here
focused on the measurement of the two most sig-
nificant diesel engine pollutants, i.e. nitric oxide (NO)
and smoke, but it was also extended to another
important (and often neglected) emission, namely
combustion noise. Diesel engine noise radiation has
received increasing attention in recent years [26–28],
since it is associated with passengers’ and pedestrians’
comfort levels. The primary sources of noise genera-
tion in a diesel engine are gas flow in the exhaust
system (usually limited using mufflers (silencers) along
the exhaust pipe), mechanical processes (e.g. valve
train, gears), and combustion. The latter (otherwise
Experimental study of transient nitric oxide, smoke, and combustion noise emissions 261
Proc. IMechE Vol. 225 Part D: J. Automobile Engineering

stated as ‘combustion roughness’) prevails over other,
mechanically originated, noise radiation [2], and this is
why only this source of noise was studied in the
current work. By including this measurement in the
investigation, it was made possible to derive some
useful conclusions regarding the underlying common
mechanisms between the three examined emissions.
2 DESCRIPTION OF THE EXPERIMENTALINSTALLATION
A general layout of the test bed installation, the ins-
trumentation used, and the data acquisition system is
illustrated in Fig. 1. A brief description of the individual
components will be given in the following sections.
2.1 Engine under study
The engine used in this study was a Mercedes-Benz
OM 366 LA, turbocharged and after-cooled, direct
injection diesel engine, following the Euro II emis-
sions standard. It is widely used to power mini-buses
and small/medium trucks. Its basic technical data are
given in Table 1. Two notable features of the engine
are, on the one hand its retarded fuel injection timing
in order to achieve low NO emissions and, on the
other hand, the fuel-limiter (cut-off) function in order
to limit the exhaust smoke level during demanding
conditions such as transients or low-speed, high-load
steady-state operations. The engine was coupled to a
hydraulic dynamometer, which allowed a good simu-
lation of a vehicle’s acceleration as will be explained
later in the text.
2.2 Emissions measurement
2.2.1 NO measurement
For the continuous measurement of NO emission,
the ultra-fast response analyser CLD500 by Cambus-
tion Ltd [29] was employed. This is a chemilumi-
nescent detector used for measuring NO and NOx (in
the latter case incorporating a NO2 to NO converter)
concentration in the exhaust gas with a 90–10 per
cent response time of approximately 2 ms for NO
and 10 ms for NOx [30]. These very short response
times were achieved by locating the detectors in
remote sample heads, which were positioned very
close to the sample point in the engine, and by
conveying the sample gas to the detectors under the
influence of a vacuum through narrow heated capill-
aries. The linearity of the analyser is less than ¡1 per
cent FSO (full scale output) and its drift less than ¡1
per cent FSO per hour.
The CLD500 equipment has two remote sampling
heads controlled by a mains control unit and it is
capable of simultaneous sampling at two different
locations. For the current study, the two sampling
(head) positions are shown in Fig. 1. The first head
was located exactly after the exhaust valve of cylinder
1 (this is the same cylinder from which the indicator
diagrams were measured) capturing the individual
cylinder’s NO concentration, and the second head
was located downstream of the turbocharger captur-
ing total NO emission concentration. Both heads were
used during steady-state experiments, whereas dur-
ing transient testing only the second sampling head
was used owing to data acquisition card limitations.
2.2.2 Opacity measurement
The exhaust gas (smoke) opacity was measured con-
tinuously with an AVL 439 partial flow opacimeter. This
is a device particularly suitable for dynamic testing
measurements with the exhaust gas sample flowing
continuously through the opacimeter with a constant
flowrate. The response time of the opacimeter is less
than 0.1 s and its accuracy is 0.1 per cent opacity. The
opacity of the sample is determined from the measure-
ment of the attenuation of visible light by the smoke in
the exhaust gas sample located between the (light)
Table 1 Engine and turbocharger specifications
Engine model and type‘Mercedes Benz’, OM 366 LA, 6 cylinder, in-line, 4 stroke, compression ignition,direct injection, water-cooled, turbocharged, after-cooled, with bowl-in-piston
Emissions standard Euro IISpeed range 800–2600 rpmMaximum power 177 kW at 2600 rpmMaximum torque 840 Nm at 1250–1500 rpmEngine total displacement 5958 cm3
Bore/stroke 97.5 mm/133 mmCompression ratio 18:1Fuel pump ‘Bosch’ PE-S series, in-line, 6 cylinder with fuel limiterStatic injection timing 5 ¡ 1u crank angle before top dead centre (at full load)Turbocharger model ‘Garrett’ TBP 418-1 with internal waste-gateAftercooler Air-to-air
262 C D Rakopoulos, A M Dimaratos, and E G Giakoumis
Proc. IMechE Vol. 225 Part D: J. Automobile Engineering

source and the detector unit [31]. The opacimeter
outputs the measurement either in terms of opacity
values N (0–100 per cent), as in the case of the present
study, or absorption coefficient values k (0–10 m–1). Its
technical characteristics comply with legal require-
ments such as ECE R24, SAE J 1667, and the ELR Test
Cycle, with the respective filter algorithms pre-pro-
grammed into the opacimeter. In this study, no filter
algorithm was applied (‘raw’ signal) in order to capture
successfully all the smoke emission peaks. The location
of sampling and return lines, as can be seen in Fig. 1,
was downstream of the turbocharger.
2.2.3 Combustion noise measurement
The origin of combustion noise in a diesel engine
(the characteristic diesel combustion ‘knock’) origi-
nates in the high rate of cylinder pressure rise dp/dQ,
mainly during the premixed phase of combustion
after the ignition delay. Combustion noise measure-
ment was achieved using the AVL 450 Combustion
Noise Meter. Its operating principle is based on the
analysis of the cylinder pressure diagrams in the
frequency domain, and applying a series of filters to
it [32], such as U-filter, selectable low-pass filters,
and A-filter. The produced output signal was further
processed by root mean square conversion to loga-
rithmic d.c. values. The total error of the meter is less
than ¡1 dB. In the present work, the combustion
noise meter was placed after the cylinder pressure
signal amplifier, as shown in Fig. 1, and was operat-
ed without any low-pass filter.
2.3 Measurement of engine and turbochargeroperating parameters
The engine and turbocharger operating parameters
measured and recorded continuously were the engine
speed, cylinder pressure, fuel pump rack position,
boost pressure, and turbocharger speed. The location
of each measuring device on the experimental test
bed installation is shown in Fig. 1. Table 2 provides a
brief list of the various measuring devices; a more
detailed description can be found in [16]. A custom
made ‘stop’ with various adjustable positions, each
one corresponding to a specific engine speed, was
fitted on the (accelerator) pedal in order to ensure a
constant pedal position at the end of each accelera-
tion test as well as repeatability of the accelerations.
Exhaust pressures and temperatures at various loc-
ations were also measured during steady-state con-
ditions with conventional analogue devices. Addi-
Fig. 1 Schematic arrangement of the test bed installation, instrumentation, and data acquisitionsystem
Experimental study of transient nitric oxide, smoke, and combustion noise emissions 263
Proc. IMechE Vol. 225 Part D: J. Automobile Engineering

tionally, fuel consumption measurements were un-
dertaken during steady-state operation with the use
of a gravimetric fuel tank.
2.4 Data acquisition and processing system
All the previously mentioned signals from the mea-
suring devices and instruments were fed to the input
of the data acquisition module, which was a Keithley
KUSB 3102 ADC card connected to a Pentium Dual
Core PC via a USB interface. The specific card has a
maximum sampling rate of 100 ksamples/s, with a 12-
bit resolution for its eight differential analogue inputs.
For the present study and during transient measure-
ments, the inputs were used as follows. 1: engine
speed; 2: fuel pump rack position; 3: cylinder pressure;
4: turbocharger speed; 5: boost pressure; 6: combus-
tion noise; 7: (smoke) opacity; and 8: NO emission.
Following the storage of the recorded measurements
into files, the data were processed using an in-house
developed computer code.
3 POST-PROCESSING OF THE EXPERIMENTALDATA
3.1 Calculation of the brake mean effectivepressure, the brake specific fuelconsumption, and the brake thermalefficiency
For the mapping of engine performance and emissions
during steady-state operating conditions (needed for
the quasi-steady approximation in section 6), three
basic parameters were calculated, namely the brake
mean effective pressure (bmep), the brake specific fuel
consumption (bsfc), and the brake thermal efficiency
(bte). The first one can be calculated by
bmep~4pMt
VH|10{5 ð1Þ
where Mt is the engine brake torque as indicated on
the dynamometer and VH~z pD2�
4� �
s is the total en-
gine displacement volume, with z being the num-
ber of cylinders, and D, s the cylinder bore and piston
stroke, respectively. Then, engine brake power can be
calculated as
P~Mt|2pn
60ð2Þ
where n is the engine rotational speed. After that, bsfc
and bte can be found by
bsfc~Vfc|rf
P|3:6|109
bte~P
Vfc|rf|Hð3Þ
where Vfc is the volumetric fuel consumption rate, rf
is the fuel density, and H the lower calorific value of
the fuel.
3.2 NO measurement processing
The measured concentration values of NO during
transient testing were converted into mass values
(mg/cycle) using the following relationship
mNO~CNO
1000|
MWNO
MWeg|meg ð4Þ
where CNO is the measured NO concentration, MWNO
and MWeg are the NO and exhaust gas molecular
weights, respectively, and meg is the exhaust gas mass
per engine cycle. The latter includes both air and fuel
mass. The in-cylinder trapped air mass was calculated
by applying the perfect gas equation of state at the
inlet valve closure, using the measured values of boost
pressure and temperature. For the calculation of to-
tal air mass, an estimation of the trapping efficiency
(0.85–0.90) was needed. On the other hand, the fuel
mass supply during each cycle of the transient event
was found using the steady-state fuel pump operating
curves for the instantaneous measured rack position.
3.3 Opacity measurement processing
In order to calculate the total soot mass emitted during
the tests, the following procedure was applied [33]. Ini-
tially, the absorption coefficient was calculated from
the opacity value
k~{ln 1{ N=100ð Þ½ �
Lð5Þ
Table 2 Measuring devices for engine and turbochargeroperating parameters
Parameter Measuring device
Engine speed ‘Kistler’ shaft encoderCylinder pressure ‘Kistler’ miniature piezoelectric transducer,
combined with ‘Kistler’ charge amplifierFuel pump rack
positionLinear variable differential transducer
(LVDT)Boost pressure ‘Wika’ pressure transmitterTurbocharger
speed‘Garrett’ turbo speed sensor (including
gauge)
264 C D Rakopoulos, A M Dimaratos, and E G Giakoumis
Proc. IMechE Vol. 225 Part D: J. Automobile Engineering

and then soot density (SD) was derived by
SD~106|1000|k
Spð6Þ
where Sp is a constant depending on the temperature
of the sample inside the opacimeter [33].
The soot density could be converted into the soot
mass concentration (SMC) in the exhaust gas by divi-
ding it with the exhaust gas density inside the mea-
suring chamber of the opacimeter
SMC~SD
reg
~SD.
peg|MWeg
� �.Rm|Tð Þ
h ið7Þ
where peg is the sample pressure in the opacimeter
(usually equal to atmospheric pressure). Finally, soot
mass could be found by multiplying SMC with the
exhaust gas mass
msoot~SMC|meg ð8Þ
For the case of the AVL opacimeter 439 used in
this study, the optical path length L is 43 cm and the
sample temperature T is 373 K.
4 EXPERIMENTAL PROCEDURE
The first task of the test bed installation was the
investigation of the steady-state performance and
emissions characteristics of the examined engine. To
this aim, an extended series of steady-state trials were
conducted, as detailed in Table 3, covering the whole
engine speed and load operating range. Between two
consecutive measurements, a time interval was allow-
ed in order for the engine to stabilize at the new
conditions. The criterion used here was the stabiliza-
tion of the exhaust gas temperature.
The main task of the experimental procedure was
to study the engine transient response and emissions
development during accelerations. Since the engine
was coupled to a hydraulic dynamometer, during all
acceleration cases the brake load (resistance) in-
creased accordingly. This is actually the case when a
vehicle accelerates in real-world driving; the increase
in engine/vehicle speed results in an increase of both
tyre rolling and aerodynamic resistance. In all test
cases, the engine was allowed to stabilize at the initial
steady-state condition and then the pedal was pushed
to the end of the adjustable custom made ‘stop’ to
accelerate the engine.
The acceleration tests were performed for various
combinations of initial engine rotational speeds and
loads, mimicking vehicle real acceleration under dif-
ferent (vehicle) speed and gear; the details are given in
Table 4. Also, Fig. 2 provides an illustration of the
initial and final conditions of each test in a speed–
load graph. A more detailed description of each test is
given in the corresponding results section. It is should
be noted that a good repeatability of the results was
confirmed, with the emission values being reproduci-
ble, after repetition of some tests under the same con-
ditions.
5 RESULTS AND DISCUSSION
5.1 Steady-state results
Figures 3 and 4 illustrate the results of the performed
steady-state tests. Only the results from four engine
speeds are given here in order for the diagrams to be
clear and easily understood. These figures build up the
Table 3 Tabulation of test conditions for steady-statetests
Engine speed(rpm)
1000, 1200, 1400, 1600, 1800, 2000, 2200
Load (%) 10, 30, 50, 70, 80 (or 90)
Table 4 Tabulation of test conditions for accelerationtests
Test
Initial conditions Final conditions
Speed (rpm) Load (%) Speed (rpm) Load (%)
1 1016 10 1880 152 1420 30 1845 523 1825 30 2022 774 1035 10 1670 12
Fig. 2 Initial–final conditions of each transient test
Experimental study of transient nitric oxide, smoke, and combustion noise emissions 265
Proc. IMechE Vol. 225 Part D: J. Automobile Engineering

map of the engine operating parameters and emis-
sions. The bsfc, bmep, and bte were calculated as
detailed in section 3.1. At the lowest speed, the engine
produces relatively low power and so all operating
values are low, except, of course, for bsfc that is
adversely affected by loading.
As regards the emissions (Fig. 4), the intriguing
finding is the high NO values at the 1800 rpm engine
speed. A somewhat similar trend can be observed for
the combustion noise at the same engine speed; the
latter suggests high cylinder pressure gradients result-
ing from intense premixed combustion, which in turn
Fig. 3 Steady-state operating parameters and performance map
266 C D Rakopoulos, A M Dimaratos, and E G Giakoumis
Proc. IMechE Vol. 225 Part D: J. Automobile Engineering

favours NO formation. However, this is only a first
qualitative explanation, since there are various para-
meters that affect the very complex process of NO
formation inside the cylinder. For example, the injec-
tion timing calibration of the engine plays an im-
portant role through its effect on ignition delay, and
thus, on premixed combustion phase. From Fig. 4 it
can also be observed that for both combustion noise
and NO emissions there is a peak observed at roughly
50 per cent engine load for most rotational speeds.
This is also attributed to the engine injection calibra-
tion, which aims at reducing NO emissions at high
loads (see section 2.1 and Table 1). As expected,
turbocharger speed and boost pressure develop in a
similar manner over the whole engine operating range.
For the smoke emission, it is mainly the loading
that plays a significant role. As the load increases,
more fuel is injected into the cylinders, increasing the
temperature in the fuel-rich zones. Moreover, the
duration of diffusion combustion is increased favour-
ing soot formation, whereas the remaining time after
combustion as well as the availability of oxygen – both
of which enhance the soot oxidation process – de-
creases; thus, the production of soot (and smoke) is
favoured. As will be discussed later, the main mech-
anism of transient smoke emission is largely based on
this key behaviour. As is usually the case with tur-
bocharged diesel engines, high opacity values are
noticed for low-speed, high-load engine operation
(despite the application of the fuel limiter), due to the
limited inlet air supply as the turbocharger compres-
sor produces low boost. This is the case for the
1400 rpm curve in Fig. 4, where smoke opacity peaks
at high engine loads.
5.2 Acceleration tests results
5.2.1 Test 1
The results of transient test 1 are presented in Figs 5
and 6. Here, acceleration from an initial engine speed
of 1016 rpm and 10 per cent load to a final speed of
1880 rpm and 15 per cent load was conducted in two
different modes. The first one was a one-step accel-
eration, whereas the second one was a multi-step
speed increase, with the engine allowed to partly
stabilize at two intermediate speeds, i.e. 1491 rpm and
1668 rpm, forming in that way a three-step accelera-
tion. These steps can be identified in the curves of fuel
pump rack position and engine speed in Fig. 5. More
specifically, the rack position assumes three peak
values (in cycles 24, 119, and 159) reaching its final
steady-state position after 225 engine cycles (approxi-
mately at t 5 16 s). On the other hand, during the
single-step acceleration, the rack shifts instantly to its
maximum fuel supply position after the pedal is
pushed and the acceleration concludes much faster
(in ‘just’ 5 s). The direct impact of rack movement on
engine speed is illustrated in Fig. 5 too, with the
turbocharger speed and boost pressure values affected
accordingly.
The development of the maximum cylinder pres-
sure follows closely the rack movement profile, but it
Fig. 4 Steady-state pollutants and combustion noiseemissions map
Experimental study of transient nitric oxide, smoke, and combustion noise emissions 267
Proc. IMechE Vol. 225 Part D: J. Automobile Engineering

Fig. 5 Development of engine and turbocharger parameters and emissions response duringsingle-step and multi-step acceleration
268 C D Rakopoulos, A M Dimaratos, and E G Giakoumis
Proc. IMechE Vol. 225 Part D: J. Automobile Engineering

also incorporates the influence of the relative boost
pressure increase and the injection timing change.
During the single-step acceleration, maximum cylin-
der pressure instantaneously assumes a first peak
following the shift of the fuel pump rack to its maxi-
mum position and then decreases as the rack moves
backwards to sustain the achieved engine speed. The
subsequent gradual increase of the cylinder pressure
(after approximately cycle 50) is attributed to the
respective boost pressure development. The same
comments apply for every stage of the multi-step
acceleration, where the concurrence between max-
imum cylinder pressure and fuel pump rack move-
ment is evident.
As far as emissions are concerned, major differences
are observed between the two studied acceleration
cases, with the smoke opacity values presenting the
greatest deviations between the two examined tran-
sients. Excessive opacity values (Fig. 5 upper right-
hand side sub-diagram) are experienced during the
single-step acceleration, clearly attributed to the har-
der turbocharger lag period. The abrupt increase in
fuelling combined with the still low (practically un-
changed) air supply during the early cycles of this test
case result in high values of fuel–air equivalence ratio.
Moreover, the very low boost pressure leads to low in-
cylinder pressures at the fuel injection timing, resulting
in increased fuel spray penetration, wall impingement,
and consequently elevated soot emission. The opacity
ultimately stabilizes to its final equilibrium value after
the rack has shifted to lower fuellings, and the boost
pressure has increased adequately.
During the multi-step acceleration, things run quite
smoothly, since each individual step involves accel-
eration between narrower engine speed limits, hence
peak fuellings are lower, and there is sufficient time
for boost pressure to develop. Thus, fuel spray pene-
tration and wall impingement are reduced and much
lower opacity values are observed (up to four times
lower compared with the values during the single-
step acceleration). It is interesting to note that in-
stantaneous soot emission spikes, although of much
lower magnitude, do occur during the second and
third step of this acceleration between the 100th and
the 200th cycle (‘zoomed’ in the small figure in the
opacity sub-diagram).
As is expected, cumulative soot mass is higher
during the single-step acceleration compared to the
multi-step case. The difference, illustrated in Fig. 6,
is of the order of 56 per cent. For the values shown in
Fig. 6, opacity has been converted into mass per
engine cycle following the procedure described in
section 3.3, and the summation is executed until the
multi-step case equilibrates.
Fig. 6 Total NO and soot mass emitted during single-step and multi-step acceleration
Experimental study of transient nitric oxide, smoke, and combustion noise emissions 269
Proc. IMechE Vol. 225 Part D: J. Automobile Engineering

NO emission is also strongly influenced by the lag
between increased fuelling and the response of the air-
charging system discussed earlier, resulting in in-
creased emissions as shown in Fig. 5. Since the main
parameter affecting NO formation is the burned gas
temperature, local high temperatures due to close to
stoichiometric fuel–air mixtures (formed because of
the still low air-supply) are expected to increase NO
during the turbocharger lag cycles. The well known
dependence of NO formation on gas temperature can
be documented in Fig. 5 by the similarity in the de-
velopment histories between NO and maximum cylin-
der pressure in both acceleration cases. In particular
during the multi-step acceleration, many local NO
peaks occur before the final stabilization is achieved.
These peaks are directly related to the respective peaks
of maximum cylinder pressure (Fig. 5), which in turn
are reflected in gas temperature peaks. The synergistic
effect of greater spikes and faster recovery period
during the single-step acceleration produces elevated
cumulative NO mass (Fig. 6), with the difference
reaching 67 per cent compared with the multi-step
transient.
The last class of emission studied here is combus-
tion noise, which is closely related to cylinder pressure
[34]. In fact, its measuring principle is based on the
processing of the measured indicator diagrams. In
both test cases illustrated in Fig. 5, combustion noise
emission seems to develop in accordance with the
maximum cylinder pressure profile. Especially during
the multi-step case, combustion noise seems to follow
every maximum cylinder pressure local peak as well as
its overall trend. However, this is not exactly the case,
since combustion noise is influenced primarily by the
rate of cylinder pressure increase (i.e. its gradient with
respect to crank angle/time) during the engine cycle
[35, 36]. This rate is affected by a variety of parameters,
including injection timing and ignition delay. During
acceleration (or load increase) both parameters behave
differently compared with the respective steady-state
conditions (especially for the turbocharger lag cycles).
5.2.2 Test 2
An important parameter that significantly affects
engine and turbocharger response as well as emis-
sions development during acceleration is the rate of
the (accelerator) pedal movement from the initial to
its final position. In real-world driving, this represents
the aggressiveness of the driver. Its impact on engine
performance and emissions is studied in Figs 7 and 8.
Here, an acceleration test from 1420 to 1845 rpm was
performed twice, once in ‘fast’ and the second in
‘slow’ mode. The time needed for the fuel pump rack
to shift to its maximum position can be used as an in-
dex of the time over which the pedal position change
took place. This period was 1 s for the ‘fast’ and 5 s for
the ‘slow’ mode.
From Fig. 7 it is obvious that the difference in the
acceleration rate can be quite dramatic and the qua-
litative remarks that follow may be applicable on a
general basis. The repeatability of the test was en-
sured by the adjustable custom made ‘stop’, which
was fitted on the pedal (described in section 2.3). This
is also confirmed by the initial and final values of
all engine and turbocharger variables being practi-
cally the same for both acceleration modes. Thus, the
only parameter affected by the rate of the pedal
movement is the development profile of the mea-
sured variables, as has been previously reported in the
literature [3, 37].
As illustrated in Fig. 7, the most important differ-
ence between the two acceleration modes is observed
in the fuel pump rack position development. In the
case of the rapid pedal push, the rack is forced to travel
almost instantaneously to its maximum position
before gradually settling down to its final steady-state
value, corresponding to the desired engine speed.
However, the fuel pump rack responds in two stages;
initially a rapid shift to a first peak position is observed,
followed by a smoother movement to the maximum
position. The latter behaviour highlights, in the most
explicit way, the fuel limiter operating principle that
does not allow sharp fuelling increases when the boost
pressure is still low. On the contrary, when the pedal is
pushed slowly (‘slow’ transient), the rack shifts at a
much smoother rate (no fuel limiter action needed
here), causing lower acceleration rates and slowing
down the whole transient event. As a result, all the
other interesting operating parameters (most signifi-
cantly pollutant and noise emissions) also develop in a
smoother way.
It is the opacity that assumes considerably higher
peak values during the ‘fast’ acceleration test. The
difference in maximum opacity values for the specific
test is up to 60 per cent between the two acceleration
modes. This is attributed to the greater impact the
turbocharger lag effect has, the faster the application
of the new fuelling is. During the fast acceleration,
boost pressure builds-up slowly causing a worse mis-
match with fuelling. Thus, even more fuel is injected
into a, practically, unchanged air-environment, re-
sulting in greater fuel spray penetration and wall
impingement. The heterogeneity of the mixture is
increased, with more fuel-rich regions forming inside
the cylinder and eventually resulting in greater soot
emission spikes.
270 C D Rakopoulos, A M Dimaratos, and E G Giakoumis
Proc. IMechE Vol. 225 Part D: J. Automobile Engineering

Fig. 7 Development of engine and turbocharger parameters and emissions response during fastand slow acceleration
Experimental study of transient nitric oxide, smoke, and combustion noise emissions 271
Proc. IMechE Vol. 225 Part D: J. Automobile Engineering

The behaviour of the other two emissions, NO and
combustion noise, do not seem to be significantly
influenced by the rate of speed increase compared to
its effect on the opacity. The main difference noticed
here is a delay in their development. Again, the NO
profile closely follows the maximum cylinder pressure
profile (as discussed earlier). During the ‘fast’ transi-
ent, NO reaches its final steady-state value faster
compared with the ‘slow’ transient but the higher peak
values result also in greater cumulative NO mass
emitted. Similar remarks hold for the combustion
noise radiation, which needs even more engine cycles
to reach its final steady-state value during the ‘slow’
acceleration case.
Cumulative NO and soot mass values for accelera-
tion test 2 are presented in Fig. 8. It should be noted
that the summation of NO and soot mass for the
calculation of their cumulative values during the
transient event is performed until the point where
final equilibrium has been reached for the ‘slow’ case.
A longer period with high opacity values (also with
greater spikes as depicted in Fig. 7) is the main reason
for higher total mass values for soot and NO during
the ‘fast’ acceleration case. The difference in cumu-
lative mass between the two acceleration modes
studied here is 39 per cent for NO and 41 per cent for
soot.
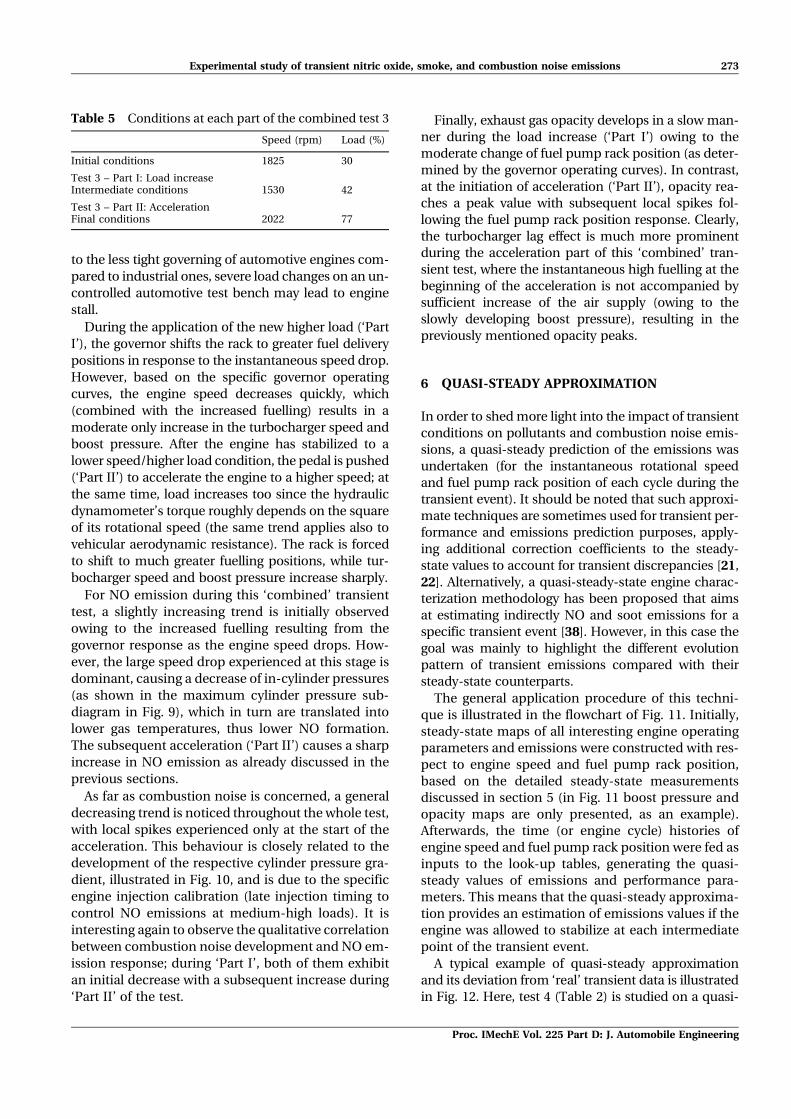
5.2.3 Test 3
During daily driving, automotive diesel engines ex-
perience quite a few ‘combined’ transient schedules. A
typical case is when a vehicle starts climbing a hill
(load increase) and the driver shifts to a lower gear and
pushes the pedal in order to accelerate the engine,
which in turn offers higher torque to the driving wheels
to overcome the increased resistance. Such a transient
schedule is studied in test 3, characterized by a simul-
taneous load (resistance) and speed increase. The con-
ditions at each stage of this test are given in Table 5.
The development of various operating parameters and
emissions during this test is presented in Fig. 9.
During the first part of this test, a (rather slow)
movement of the brake control lever was initiated to-
wards the direction of increased loading (load in-
crease) without change of the engine accelerator pedal
position. It should be noted here that while automotive
engines do encounter load increase transients they are
not as pronounced as the ones experienced by indus-
trial or marine engines. The most significant factor that
determines the engine response after a load increase is
the governor operating curves [2]. For the specific case
used in this test, the application of the new higher load
caused a decrease in engine speed of about 300 rpm,
which influenced the whole system response during
the first part of the test. It is worth mentioning that due
Fig. 8 Total NO and soot mass emitted during fast and slow acceleration
272 C D Rakopoulos, A M Dimaratos, and E G Giakoumis
Proc. IMechE Vol. 225 Part D: J. Automobile Engineering
to the less tight governing of automotive engines com-
pared to industrial ones, severe load changes on an un-
controlled automotive test bench may lead to engine
stall.
During the application of the new higher load (‘Part
I’), the governor shifts the rack to greater fuel delivery
positions in response to the instantaneous speed drop.
However, based on the specific governor operating
curves, the engine speed decreases quickly, which
(combined with the increased fuelling) results in a
moderate only increase in the turbocharger speed and
boost pressure. After the engine has stabilized to a
lower speed/higher load condition, the pedal is pushed
(‘Part II’) to accelerate the engine to a higher speed; at
the same time, load increases too since the hydraulic
dynamometer’s torque roughly depends on the square
of its rotational speed (the same trend applies also to
vehicular aerodynamic resistance). The rack is forced
to shift to much greater fuelling positions, while tur-
bocharger speed and boost pressure increase sharply.
For NO emission during this ‘combined’ transient
test, a slightly increasing trend is initially observed
owing to the increased fuelling resulting from the
governor response as the engine speed drops. How-
ever, the large speed drop experienced at this stage is
dominant, causing a decrease of in-cylinder pressures
(as shown in the maximum cylinder pressure sub-
diagram in Fig. 9), which in turn are translated into
lower gas temperatures, thus lower NO formation.
The subsequent acceleration (‘Part II’) causes a sharp
increase in NO emission as already discussed in the
previous sections.
As far as combustion noise is concerned, a general
decreasing trend is noticed throughout the whole test,
with local spikes experienced only at the start of the
acceleration. This behaviour is closely related to the
development of the respective cylinder pressure gra-
dient, illustrated in Fig. 10, and is due to the specific
engine injection calibration (late injection timing to
control NO emissions at medium-high loads). It is
interesting again to observe the qualitative correlation
between combustion noise development and NO em-
ission response; during ‘Part I’, both of them exhibit
an initial decrease with a subsequent increase during
‘Part II’ of the test.
Finally, exhaust gas opacity develops in a slow man-
ner during the load increase (‘Part I’) owing to the
moderate change of fuel pump rack position (as deter-
mined by the governor operating curves). In contrast,
at the initiation of acceleration (‘Part II’), opacity rea-
ches a peak value with subsequent local spikes fol-
lowing the fuel pump rack position response. Clearly,
the turbocharger lag effect is much more prominent
during the acceleration part of this ‘combined’ tran-
sient test, where the instantaneous high fuelling at the
beginning of the acceleration is not accompanied by
sufficient increase of the air supply (owing to the
slowly developing boost pressure), resulting in the
previously mentioned opacity peaks.
6 QUASI-STEADY APPROXIMATION
In order to shed more light into the impact of transient
conditions on pollutants and combustion noise emis-
sions, a quasi-steady prediction of the emissions was
undertaken (for the instantaneous rotational speed
and fuel pump rack position of each cycle during the
transient event). It should be noted that such approxi-
mate techniques are sometimes used for transient per-
formance and emissions prediction purposes, apply-
ing additional correction coefficients to the steady-
state values to account for transient discrepancies [21,
22]. Alternatively, a quasi-steady-state engine charac-
terization methodology has been proposed that aims
at estimating indirectly NO and soot emissions for a
specific transient event [38]. However, in this case the
goal was mainly to highlight the different evolution
pattern of transient emissions compared with their
steady-state counterparts.
The general application procedure of this techni-
que is illustrated in the flowchart of Fig. 11. Initially,
steady-state maps of all interesting engine operating
parameters and emissions were constructed with res-
pect to engine speed and fuel pump rack position,
based on the detailed steady-state measurements
discussed in section 5 (in Fig. 11 boost pressure and
opacity maps are only presented, as an example).
Afterwards, the time (or engine cycle) histories of
engine speed and fuel pump rack position were fed as
inputs to the look-up tables, generating the quasi-
steady values of emissions and performance para-
meters. This means that the quasi-steady approxima-
tion provides an estimation of emissions values if the
engine was allowed to stabilize at each intermediate
point of the transient event.
A typical example of quasi-steady approximation
and its deviation from ‘real’ transient data is illustrated
in Fig. 12. Here, test 4 (Table 2) is studied on a quasi-
Table 5 Conditions at each part of the combined test 3
Speed (rpm) Load (%)
Initial conditions 1825 30
Test 3 – Part I: Load increaseIntermediate conditions 1530 42
Test 3 – Part II: AccelerationFinal conditions 2022 77
Experimental study of transient nitric oxide, smoke, and combustion noise emissions 273
Proc. IMechE Vol. 225 Part D: J. Automobile Engineering

steady basis and compared with the experimental tran-
sient measurements. The development profiles of boost
pressure, soot, NO, and combustion noise emissions
are presented, together with the engine speed, rack
position, and maximum cylinder pressure responses.
The major observations concern on the one hand the
absolute values of (peak) emissions, and on the other
hand the timing at which these occur.
Fig. 9 Development of engine and turbocharger parameters and emissions response duringacceleration after load increase (gear shift)
274 C D Rakopoulos, A M Dimaratos, and E G Giakoumis
Proc. IMechE Vol. 225 Part D: J. Automobile Engineering

It is the opacity values that highlight in the most
explicit way the different evolution profile between real
(transient) and quasi-steady development. As is ap-
parent from Fig. 12, transient soot assumes dramati-
cally higher peak values than its quasi-steady counter-
part. For the specific test case, this difference reaches
up to 4.4 times the quasi-steady peak value, with even
higher discrepancies experienced for other ‘harder’
acceleration cases. On the other hand, transient peak
soot exhibits a small delay of about four engine cycles
compared with the quasi-steady values; this is primar-
ily attributed to the distance the gas has to travel until
it reaches the measuring location.
The three basic reasons that explain the serious
discrepancy between quasi-steady and experimental
transient opacity values can be described as follows.
1. The air mass flowrate develops during the tran-
sient event at a much different (slower) rate owing
to turbocharger lag (the greater the differences the
higher the acceleration or the faster the accelerator
pedal change); the boost pressure development in
Fig. 12 clearly highlights this behaviour.
2. Fuel delivery to the cylinders is also differentiated,
owing to the injection timing alteration during
transients; the developing value of residual pres-
sure in the fuel injection line [2] and the instan-
taneous torsional deformations in the driving sys-
tem of the (mechanical) fuel injection pump [39]
cause rapid and considerable changes to the dyna-
mic injection and fuelling.
3. Cylinder wall temperature develops more slowly
during acceleration, owing to the thermal inertia
of the cylinder-wall–coolant system. Lubrication
oil temperature, which also plays an important
role through its impact on engine friction, devel-
ops more slowly during transients compared with
steady-state conditions [4].
As far as NO emission is concerned, the trend is,
however, different. Quasi-steady peak values were
actually found to be higher than their transient coun-
terparts, with the same remark also applying to the
final values. The difference in the maximum values
may be caused by the injection timing alteration dis-
cussed previously, the complete worsening of fuel–air
mixing (for example, oxygen shortage is experienced
due to low boost pressures during the turbocharger lag
cycles diminishing the transient NO production rate),
as well as by the slowly developing thermal transient,
which leads to higher thermal losses to the cylinder
walls and decreases the gas temperature. The latter is
also responsible for the difference observed between
the final quasi-steady and transient values. Again, the
delay in the peak values between the real transient
measurement and the quasi-steady approximation is
attributed both to the completely different operating
conditions, as well as to the distance the gas has to
travel until it reaches the measuring location.
Another notable effect that significantly affects both
smoke and NO emissions during transient operation is
the internal exhaust gas recirculation. During the first
cycles of the transient event, the boost pressure re-
mains practically unchanged or develops in a very slow
rate, while (maximum) cylinder pressure rises quickly
(due to greater fuel mass injected), as shown in Fig. 12.
As a result, the engine exhaust back pressure increases
(i.e. the ratio of back to boost pressure is higher), thus
the exhaust gas backflow during the valve overlap pe-
riod is more intense and the amount of residual gas in
the cylinder becomes larger [40] compared with its
steady-state counterpart. This results in lower NO
values, due to the thermal effect of residual gas, which
limits maximum combustion temperature (and thus
NO); however, higher soot values are experienced since
the above phenomenon causes a further decrease in
the air–fuel ratio (i.e. more fuel-rich regions in the
cylinder), as the residual gas replaces oxygen [2, 41].
Finally, combustion noise radiation is higher dur-
ing the transient event (especially during the turbo-
charger lag cycles) compared with the quasi-steady
operation, confirming the results of previous research
[26]. The main mechanism behind the increase in
combustion noise radiation during transients lies in
the operating principles of a transient event. During
the first cycles after a speed (or load) increase, the
injected fuel quantity has already increased substan-
Fig. 10 Development of maximum cylinder pressuregradient (rate of cylinder pressure increase)with respect to crank angle for test 3
Experimental study of transient nitric oxide, smoke, and combustion noise emissions 275
Proc. IMechE Vol. 225 Part D: J. Automobile Engineering

tially cooling down the charge-air temperature; how-
ever, the cylinder wall temperature is still low (up to
100 uC lower than the corresponding steady-state co-
nditions) as the thermal transient proceeds at a much
slower rate due to the cylinder wall thermal inertia
[42]. The combination of increased fuelling with the
still low cylinder wall temperature and ‘cooled’ ch-
arge-air temperature results in longer ignition delay,
hence more intense premixed combustion periods
leading to steeper cylinder pressure gradients and,
consequently, higher combustion noise levels [2, 26].
The arguments introduced previously highlight, on
the one hand, the importance of transient operation
study and, on the other hand, its complexity and its
completely different evolution pattern compared with
steady-state operation, requiring careful and syste-
matic experimental and simulation analysis. Clearly,
transient turbocharged diesel engine operation can-
not be considered as a series of steady-state operating
points, nor can the engine be assumed to behave in a
quasi-steady manner during transients.
7 CONCLUSIONS
A fully instrumented test bed installation has been
developed in order to study the transient perfor-
mance and emissions of an automotive/truck turbo-
charged diesel engine. Fast response analysers were
employed for measuring NO, smoke opacity, and
combustion noise emissions for a variety of accelera-
tion tests experienced during daily driving conditions.
Furthermore, a quasi-steady approximation was un-
dertaken in order to highlight the completely different
evolution pattern of transient conditions compared
with steady-state operation. The basic conclusions
derived from the current investigation, for the specific
engine–hydraulic-brake configuration, can be sum-
marized as follows.
Fig. 11 Flowchart showing the methodology for the quasi-steady approximation of emissions
276 C D Rakopoulos, A M Dimaratos, and E G Giakoumis
Proc. IMechE Vol. 225 Part D: J. Automobile Engineering

1. As expected, turbocharger lag was found to be the
most notable contributor for all the examined tran-
sient test cases, and the major cause for high values
of NO, smoke, and combustion noise emissions.
2. Fuel limiter action, governing, turbocharger char-
acteristics, engine injection timing calibration, and
individual specifications of each test were found to
strongly affect the speed response as well as the
profile and cumulative values of all pollutants.
3. Combustion noise is directly influenced by the in-
cylinder pressure gradient, and may be affected by
the specific engine calibration (for the particular
engine this consists of retarded injection timing for
the purpose of NO emission limitation).
4. Turbocharger lag effects were much less promi-
nent during multi-step, or slow acceleration, re-
sulting in much lower opacity spikes. NO and co-
mbustion noise emissions are also lower during
such transients.
5. The rate of the accelerator pedal ‘push’ affected on-
ly the development profile of all operating param-
eters and emissions, with the final steady-state va-
lues being the same in both ‘fast’ and ‘slow’ modes.
Also, a considerable difference in cumulative NO
and soot mass was observed.
6. Load increases of an automotive engine on an
uncontrolled test bench are strongly influenced by
the ‘loose’ governing, leading to considerable speed
Fig. 12 Quasi-steady approximation of emissions during acceleration test 4 (Table 2) and com-parison with actual transient measurements
Experimental study of transient nitric oxide, smoke, and combustion noise emissions 277
Proc. IMechE Vol. 225 Part D: J. Automobile Engineering

drops and so affecting accordingly the whole sys-
tem response and emissions development.
7. Transient emissions develop in a completely diff-
erent manner compared with their steady-state co-
unterparts, owing to the off-design phenomena ex-
perienced during dynamic engine operation.
It is believed that the present study has contributed
towards a deeper understanding of the complex phe-
nomena experienced during diesel engine transient
operation, particularly as regards NO, smoke, and co-
mbustion noise emissions development. It can form a
basis for deeper research in this challenging field, ex-
tending into the investigation of complex transient
events and legislated Transient Cycles.
ACKNOWLEDGEMENTS
The authors would like to thank Cambustion Ltd(Cambridge, UK) for the loan of the CLD500 NOanalyser and, particularly, Dr M. Peckham for his con-tinuous support during the experimental investiga-tion of the engine. Special thanks are due to TurboHellas Trading Ltd for the donation of the turbochar-ger speed sensor kit used in the experiments.
F Authors 2011
REFERENCES
1 European Automobile Manufacturers’ Association(ACEA), available from http://www.acea.be (accessed20 December 2009).
2 Rakopoulos, C. D. and Giakoumis, E. G. Diesel enginetransient operation, 2009 (Springer, London, UK).
3 Hagena, J. R., Filipi, Z. S., and Assanis, D. N.Transient diesel emissions: analysis of engine ope-ration during a tip-in. SAE paper 2006-01-1151, 2006.
4 Rakopoulos, C. D. and Giakoumis, E. G. Review ofthermodynamic diesel engine simulations under tran-sient operating conditions. SAE paper 2006-01-0884,2006.
5 Gullett, B. K., Touati, A., Oudejans, L., and Ryan,S. P. Real-time emissions characterisation of orga-nic air toxic pollutants during steady-state and tran-sient operation of a medium duty diesel engine.Atmos. Environ., 2006, 40, 4037–4047.
6 Wijetunge, R. S., Brace, C. J., Hawley, J. G.,Vaughan, N. D., Horrocks, R. W., and Bird, G. L.Dynamic behaviour of a high speed direct injectiondiesel engine. SAE paper 1999-01-0829, 1999.
7 Automotive section: directives and regulations onmotor vehicles, available from http://ec.europa.eu/enterprise/sectors/automotive/documents/directives/motor-vehicles/ (accessed 20 December2009).
8 European transient cycle (ETC), available fromhttp://www.dieselnet.com/standards/cycles/etc.html(accessed 20 December 2009).
9 Dynamometer driver’s aid, available from http://www.epa.gov/nvfel/testing/dynamometer.htm#engcycles (accessed 20 December 2009).
10 Korakianitis, T., Papagiannidis, P., and Vlacho-poulos, N. E. Unsteady flow/quasi-steady heattransfer computations on a turbine rotor and com-parison with experiments. Trans. ASME, J. Turbo-machinery, 2002, 124, 152–159.
11 Korakianitis, T., Vlachopoulos, N. E., and Zou, D.Models for the prediction of transients in closed re-generative gas turbine cycles with centrifugal im-pellers. Trans. ASME, J. Engineering for Gas Tur-bines and Power, 2005, 127, 505–513.
12 Kang, H. and Farell, P. V. Experimental investiga-tion of transient emissions (HC and NOx) in a highspeed direct injection (HSDI) diesel engine. SAEpaper 2005-01-3883, 2005.
13 Black, J., Eastwood, P. G., Tufail, K., Winstanley,T., Hardalupas, Y., and Taylor, A. M. K. P. Dieselengine transient control and emissions responseduring a European extra-urban drive cycle (EUDC).SAE paper 2007-01-1938, 2007.
14 Campbell, B., Peckham, M., Symonds, J., Parkin-son, J., and Finch, A. Transient gaseous andparticulate emissions measurements on a dieselpassenger car including a DPF regeneration event.SAE paper 2006-01-1079, 2006.
15 Armas, O., Cardenas, M. D., and Mata, C. Smokeopacity and NOx emissions from a bioethanol-diesel blend during engine transient operation. SAEpaper 2007-24-0131, 2007.
16 Rakopoulos, C. D., Dimaratos, A. M., Giakoumis,E. G., and Peckham, M. S. Experimental assess-ment of turbocharged diesel engine transientemissions during acceleration, load change andstarting. SAE paper 2010-01-1287, 2010.
17 Cui, Y., Deng, K., and Wu, J. A modelling andexperimental study of transient NOx emissions inturbocharged direct injection diesel engines. Proc.IMechE, Part D: J. Automobile Engineering, 2004,218(5), 535–541. DOI: 10.1243/095440704774061183.
18 Bazari, Z. Diesel exhaust emissions predictionunder transient operating conditions. SAE paper940666, 1994.
19 Chan, S. H., He, Y., and Sun, J. H. Prediction oftransient nitric oxides in diesel exhaust. Proc. IMechE,Part D: J. Automobile Engineering, 1999, 213(4), 327–339. DOI: 10.1243/0954407991526892.
20 Rakopoulos, C. D., Dimaratos, A. M., Giakoumis,E. G., and Rakopoulos, D. C. Exhaust emissionsestimation during transient turbocharged dieselengine operation using a two-zone combustionmodel. Int. J. Veh. Des., 2009, 49, 125–149.
21 Ericson, C., Westerberg, B., and Egnell, R. Tran-sient emission predictions with quasi stationarymodels. SAE paper 2005-01-3852, 2005.
22 Giakoumis, E. G. and Alafouzos, A. I. Study ofdiesel engine performance and emissions during a
278 C D Rakopoulos, A M Dimaratos, and E G Giakoumis
Proc. IMechE Vol. 225 Part D: J. Automobile Engineering

transient cycle applying an engine mapping-basedmethodology. Appl. Energy, 2010, 87, 1358–1365.
23 Hauberger, S., Ivanisin, M., and Riemersma, I. J.Modelling of transient influences on HDV emis-sions. SAE paper 2001-24-0076, 2001.
24 Beaumont, A. J., Noble, A. D., and Pilley, A. D.Signal reconstruction techniques for improvedmeasurement of transient emissions. SAE paper900233, 1990.
25 Chan, S. H., Chen, X. S., and Arcoumanis, C.Measurement and signal reconstruction of transi-ent nitric oxide emissions in the exhaust of aturbocharged diesel engine. Trans. ASME, J. Dy-namic Systems, Measurement and Control, 1997,119, 620–630.
26 Dhaenens, M., van der Linden, G., Nehl, J., andThiele, R. Analysis of transient noise behaviour of atruck diesel engine. SAE paper 2001-01-1566, 2001.
27 Commission Directive 96/20/EC of 27 March 1996adapting to technical progress Council Directive70/15/EEC relating to the permissible sound leveland the exhaust system of motor vehicles, OfficialJournal L 092, April 1996.
28 Torregrosa, A. J., Broatch, A., Martı́n, J., andMonelletta, L. Combustion noise level assessmentin direct injection diesel engines by means of in-cylinder pressure components. Meas. Sci. Technol.,2007, 18, 2131–2142.
29 Cambustion Ltd, available from http://www.cambustion.co.uk (accessed 10 January 2010).
30 CLD500 Fast NOx Measurement System, UserManual (version 2.2), Cambustion Ltd., 2008.
31 AVL 439 Opacimeter, Operating Manual, AVL, Novem-ber 2006.
32 AVL 450 Combustion Noise Meter. Operating Man-ual, AVL, August 2000.
33 DieselNet Technical Data Sheets, Smoke OpacityPaper, available from http://www.dieselnet.com/calculator/smoke1.html (accessed 10 January 2010).
34 Taylor, C. F. The internal combustion engine intheory and practice, volume 2, 1985 (MIT Press,Cambridge, Massachusetts).
35 Anderton, D. Relation between combustion systemand noise. SAE paper 790270, 1979.
36 Osawa, H. and Nakada, T. Pseudo cylinder pres-sure excitation for analysing the noise character-istics of the engine structure. JSAE Rev., 1999, 20,67–72.
37 Rakopoulos, C. D., Dimaratos, A. M., Giakoumis,E. G., and Rakopoulos, D. C. Evaluation of theeffect of engine, load and turbocharger parameterson transient emissions of diesel engine. EnergyConvers. Mgmnt, 2009, 50, 2381–2393.
38 Eastwood, P. G., Tufail, K., Winstanley, T.,Darlington, A., Karagiorgis, S., Hardalupas, Y.,and Taylor, A. M. K. P. Estimation of deviations inNO and soot emissions between steady-state andEUDC transient operation of a common-rail dieselengine. SAE paper 2009-24-0147, 2009.
39 Murayama, T., Miyamoto, N., Tsuda, T., Suzuki,M., and Hasegawa, S. Combustion behaviours
under accelerating operation of an IDI diesel eng-ine. SAE paper 800966, 1980.
40 Filipi, Z., Hagena, J., and Fathy, H. Investigatingthe impact of in-vehicle transients on diesel sootemissions. Thermal Sci., 2008, 12(1), 53–72.
41 Yokomura, H., Kouketsu, S., Kotooka, S., andAkao, Y. Transient EGR control for a turbochargedheavy duty diesel engine. SAE paper 2004-01-0120,2004.
42 Rakopoulos, C. D. and Mavropoulos, G. C. Effectsof transient diesel engine operation on its cyclic heattransfer: an experimental assessment. Proc. IMechE,Part D: J. Automobile Engineering, 2009, 223(11),1373–1394. DOI: 10.1243/09544070JAUTO1223.
APPENDIX
Notation
bmep brake mean effective pressure (bar)
bsfc brake specific fuel consumption
(g/kWh)
bte brake thermal efficiency
C concentration (ppm)
D cylinder bore (m)
k absorption coefficient (m21 or cm21)
L optical path length (m or cm)
m mass (kg or g)
Mt engine brake torque (N m)
MW molecular weight (kg/kmol)
n engine speed (rpm)
N opacity (%)
p pressure (N/m2)
P engine brake power (W)
Rm universal gas constant
(5 8314.3 J/kmol K)
s piston stroke (m)
SD soot density (mg/m3)
SMC soot mass concentration (mg/kg)
T temperature (K)
V volume (m3)
Vfc volumetric fuel consumption rate
(m3/s)
z number of engine cylinders
H lower calorific value of fuel (kJ/kg)
r density (kg/m3)
Subscripts
eg exhaust gas
f fuel
NO nitric oxide
Experimental study of transient nitric oxide, smoke, and combustion noise emissions 279
Proc. IMechE Vol. 225 Part D: J. Automobile Engineering