270 volt direct current generator ... 270 volt direct current generator performance evaluation...
TRANSCRIPT

Report No. NADC-91003-60
AD-A236 946
270 VOLT DIRECT CURRENT GENERATORPERFORMANCE EVALUATION
Jenifer M. ShannonAir Vehicle and Crew Systems Technology Department (Code 6012)NAVAL AIR DEVELOPMENT CENTERWarminster, PA 18774-5000
DECEMBER 1990
FINAL REPORTPeriod Covering June 1990 to August 1990Task No. W1355000AProject No. 0Work Unit No. MV900Program Element No. 0604268N D T ICApproved for Public Release: Distribution is Unlimited E L E CT E
JUN'20 1591 3
Prepared forNAVAL AIR SYSTEMS COMMANDDepartment of the NavyWashington, DC 20361-0001
91-02430

NOTICES
REPORT NUMBERING SYSTEM - The numbering of technical project reports Issued by theNaval Air Development Center is arranged for specific Identification purposes. Eachnumber consists of the Center acronym, the calendar year in which the number wasassigned, the sequence number of the report within the specific calendar year, and theofficial 2-digit correspondence code of the Command Officer or the Functional Departmentresponsible for the report. For example: Report No. NADC-88020-60 Indicates the twentiethCenter report for the year 1988 and prepared by the Air Vehicle and Crew SystemsTechnology Deartment. The numerical codes are as follows:
CODE OFFICE OR DEPARTMENT
00 Commander, Naval Air Development Center
01 Technical Director, Naval Air Development Center
05 Computer Department10 AntiSubmarine Warfare Systems Department
20 Tactical Air Systems Department
30 Warfare Systems Analysis Department
40 Communication Navigation Technology Department
50 Mission Avionics Technology Department
60 Air Vehicle & Crew Systems Technology Department
70 Systems & Software Technology Department
80 Engineering Support Group
90 Test & Evaluation Group
PRODUCT ENDORSEMENT - The discussion or instructions concerning commercialproducts herein do not constitute an endorsement by the Government nor do they conveyor imply the license or right to use such products.
Reviewed By: Z Date:
Reviewed By: Date: /- /9?Division Head
Approved By: / Date: /DirectorlDeputy Director

NADC-91 003-60
CONTENT S
SUBJECT.PG
Figures .. . . . . . . . .. . . . . . . . . .. . . . . . . . :
Tables.........................................................1ii;
Abbreviations...................................................i
Backar-ound....................................................
General Performance............................................. 2
Ripple Measurements............................................. 4
Distortion Spectrum Measurements...............................-
Tran ien Tes ing .... ... .... ... .... ... .... ... .... ..
Trnclsin Tet................................................... I
Referensi ..................................................... lE -
Appendix A Excerpts from a White Paper by Mr. E. Speck.......A-I
Appendix B Distortion Spectrum Graphs.......................B-1
Accession For
NTIS GRA&I
DTIC TABUn n C J: Ce (4 ElJufn 111f c.tt, I
~ I Distributit).u/.7 Availability Codes
Dist Special

UnclassifiedSEC.r - C.ASS C , - -
Fz'n- 4ppro~cdREPORT DOCUMENTATION PAGE OMBi'No 0704-0788
la REPORT SECA TY C_4SS -CA-iON lo RES-RC71vE MARP. %GS
Unclassified2a SECLJR;Y CLASSFCA' 0' AJ.-.OR TV 3 D'STR djThO% 'AVA LAB.,,TY O, REDGOZ
____________________________________ Approved for Public Release;
2o DECLASS,C;AON DOAV\C~D NC SCH-E) LE Distribution is Unlimited
4 PERFORYMNG ORGAN ZA7.O'. REPORT NuMBER,S 5 M1ON.TORAG ORGANIATiON REPOP,7j/~
NALDC-9 100 3-60
A'. 0: C. N~~ a AM: Or N ' ORiC O C41. C'
Air Vehicle and-Crew Systems (I appoicaot,
Technology DepartmentI
6c AL)D> -- 3 (City State, and ZIP Code) 7:. ADDIE SS (City Sta-E and 'IP Cc,,-.
NAVAL AIR DEVELOPMENT CENTERWarminster, PA 18974-5000
8a NANVE Or ;uNDiNG SPONSOR 'C8-n O F C: SYVBQO 9 POCiRE:N- NS-R~Jw DiX ,A c;. N%ORGANiZtA ON (if applicable)
NAVAL AIR SYSTEMS COMMAND IATR-53633
8c ADDRESS(City State and ZIP Codc) "SO-!RCE Or FD' '
Washington, DC 20361-0001 PROG-': PR.O C- 'LSE.EVENT No %0 %15-o -CC ESS O% NC
0604268N - 35- A mv 900E,_ (include Security Classification)
270 Volt Direct Current Generator Performance EvaluationPERSONA, AJ7HOR.S
Jenifer M. ShannonIa P: Or R;POP- [3,) 7J C0EREC) .4DAE OF REPOR' (Year Month Day )
Final I' TOB-VO 1 1990 December1E SjPPEVMEN-4- NOT47O'.
'7 COSL' COD;S 18 SUBJECT TERVS (Continue on reverse of necessary and identify by block number)
FiELD GROjr SLUB-ROu,
'9 AbS-RACT (Continue on reverse if necessary and identify by block number)
This docment presents the results of the testing of a 45KW, 270 VDC generator.Parameters measured include line voltage, field current, peak-to-peak ripple voltage,distortion spectrum, and transient: due to both load application and load removal. Thepurpose of this testing was to provide a baseline of 270 VDC generator performance. Thebaseline data will be used as an input of the revision of MIL-STD-704D, the aircraftpower quality specification. The performance of the generator under test exceededexpectations. The conclusion of this testing is that no significant problems should beencountered by generator vendors in their efforts to meet the new 270 VDC requirementsset forth in MIL-STD-704E.
*/~ 3~ ~'.) . A.22o TELEPHONE (include Area Code) ' i
Je-ifer X. Shannon 215 441-7216 601DD Form 1473, JUN 86 Pre vious edhions are Obsolete ___$C> (CA$ S.'''
S/1,' r,102-LF-01,-6603 Unclassified

NADC-91003-60
FIGURES
Figure 1. Effect of Speed & Load on Line Voltage ............... 3
Figure 2. Effect of Speed & Load on Field Current .............. 3
Figure 3. Peak-to-Peak Ripple Voltage ............................ 4
Figure 4. R i e at No Load .................................... C
Figure 5. Ripple at 25% Load ................................... C
Figure 6. Ripple at 50% Load ................................... -
Figure 7. Ripple at 75% Load ................................... 7
Figure 8. Example Plot of Transient Line Voltages .............. i2
TABLES
Pace
Table 1. Distortion Factor ................................... E
Table 2. Data from Load Application Transients ...............
Table 3. Data from Load Removal Transients ................... !
Table 4. Data from Incremental Load Application ............... 14
Table 5. Data from Incremental Load Removal .................. 15
iii

NADC-91003-60
ABBREVIATIONS
AC Alternating Current
DC Direct Current
dB Decibels
GCU Generator Control Unit
Hz Hertz (cycles per second)
kHz Kilohertz (xl000 cycle per second)
NADC Naval Air Development Center
pf/ft Picofarads/foot
rms root mean square
rp m Revolutions per minute
%7 Volts
V p-p Volts peak-to-peak
VDC Volts Direct Current
iv
NADC-91003-60
270 VOLT DIRECT CURRENT GENERATORPERFORMANCE EVALUATION
Background
Single channel testing was performed on the Lucas Aerospace
270 Volt DC generator #101 with Generator Control Unit (GCU) #103,
during the second half of FY90. This testing was conducted in the
George Tsaparas Laboratory at the Naval Air Development Center
(NADC) by personnel from the Electrical and Flight Control Branch.
Generator parameters recorded include line voltage, field current,
peak-to-peak ripple voltage, distortion spectrum, and transients
due to both load application and load removal. The load bank used
in the testing was purely resistive.
The purpose of this testing was to provide a general insight
tc the capabilities of 270 Volt DC generators. MIL-STD-704D,
reference (1), is a specification which defines aircraft power
quality; this specification is currently being revised. The majcor
changes in the 270 Volt DC section of this specification involve
voltage ripple, distortion, and voltage transients. The new ripple
and distortion criteria that will be incorporated into MIL-STD-704
were derived from theoretical calculations and experimental
measurements. The derivation of this criteria is described in a
white paper by Mr. Eric Speck from the Naval Air Test Center who
Ls directly involved with the revision of MIL-STD-704. Excerpts
from this paper describing the criteria are included in Appendix
A. The new transient limits being considered are defined in AS-
1831, reference (2) . The distortion and ripple measurements taken
during this testing were compared to the criteria established in
Appendix A, and the transient measurements were compared to the
limits of reference (2). Analysis of the test results will
provide verification that 270 Volt DC generators will be capable
of meeting the criteria of MIL-STD-704E.
The Lucas generator was a prototype model developed under
contract #N62269-79-C-0226 for NADC per NADC-60-TS-7803, reference
(2) . The 45 KW aenerator is an oil-cooled, brushless machine with
a:. internal full wave bridae rectifier. This generatcr does not

NADC-91003-60
represent current state-of-the-art 270 Volt DC generator
capabilities. Many advances in generator design, stronger
magnetic materials, and new GCU and rectifier components have
improved 270 Volt DC system performance since the Lucas generator
was built. However, the performance of the Lucas generator can
provide a baseline for comparison to present day generators. The
overall performance of the Lucas generator was commendable; in
many instances, its performance exceeded the requirements called
out in the references.
General Performance
During all tests, the steady state line voltage of the
generator was recorded. Steady state occurs after a sufficient
period of time has passed following any transient that has
occurred due to load switching or a change in generator speed.
Steady state voltage is defined for 270 VDC by ML-ST-704 as
between 250 and 280 VDC. In Figure (1) the effect of speet and
load on the line voltage is shown. The line voltage is well
regulated (between 268 V and 270 V) with a load present. urina
the no load condition, regulation is still good, but the line
voltage is higher than when a load is connected. At no load an-
increasing generator speed, the line voltage also increases. At
25% load, the line voltage followed the same pattern as it did
with no load but at 2 to 3 volts less. At every other load
condition (50%, 75%, 100%), during minimum generator speed, the
liie voltage was at its maximum; however, as the speed was
increased to 13,000 rpm, the line voltage drops and then remains
approximately the same for the remainder of the speed range.
The field current was also recorded throughout all testing.
In Figure (2) the effect of speed and load on field current Is
shown. The field current consistently increases as the load is
increased. As generator speed is increased, the field required tc
achieve output power is smaller; therefore, the field current
jecreases.
2

NADC-91 003-60
273
.LJ 272
C
~-No Load
~ 270'~. 0 75% Load>.... .... 100% Load
S 269 -.
268 -o
2678000 10000 12000 14000 16000 18000 20CD0
Generator Speed (rpm)
Figure 1. Effect of Speed &Load on Line Voltage
28-_ _ _ _ _
E a. No Load26-* 255% Load
* 50% LoadC 4 75% Load
* ~100% Load-, 22 *' .
V4.
18
14
8000 10000 12000 14000 16000 18000 200C
Generator Speed (rpm)
Figure 2. Effect of Speed & Load on Field Current

NADC-91003-60
Ripple Measurements
Peak-to-peak ripple was measured at no load, 25%, 50%, 75%
and 100% loads over the operating speed range of the generator.
Approximately 10 peak-to-peak measurements were taken at each test
condition; these numbers were then averaged to yield a more
accurate representation of ripple. The mean ripple voltages are
plotted in Figure (3) versus generator speed. For most test
conditions, the ripple voltage was between 4.5 and 5.5 volts peak-
to-peak. The worst case ripple, 7.7 V p-p, occurred at 75% load
and 18,000 rpm. The overall average ripple was 4.7 V p-p.
7
4 4 -. _-- ...---------- _ _ __...0,0 No Load
_ _ _ _ __ 25% Load3. - 50% Load
.. 75% Load2 100% Load
10000 12000 14000 16000 18000
Generator Speed (rpm)
Figure 3. Peak-to-Peak Ripple Voltage
A separate test was performed to determine the effect of flat
bus cable on power quality. Ripple measurements were recorded
while a 50 foot No. 6 flat cable was connected to the generator
output. It should be noted that the cable and connector were not
flight qualified hardware. The flat bus used ir this test
4

NADC-91003-60
consisted of two thin insulated copper strips layered together.
Some of the advantages of using flat bus over round wire in power
systems include decreased inductance, increased capacitance and an
inherent fault isolation property. The inherent fault isolation
property is due to the magnetic field generated by the layered
geometry of flat bus. During a fault, this magnetic field causes
the conductors to separate at the point of a fault. The increased
capacitance property is an effective means of reducing the ripple
on the power bus. The specified capacitance of the flat cc-o...e
8000 pf/ft. Therefore, the approximate capacitance cf the cable
used in this test is 0.4 microfarads.
In comoarino the ripple measurements taken with the f t bstc those taken without the flat bus, a significan. ripple voltacereduction is observed. At no load, the flat bus has nc
appreciable effect on ripple, since the ripple is already fairly
low (See Fiaure 4) . However, by attaching the flat bus to the
generator, the ripple was reduced on the average by 18%. Ficures
(5) through (7) show the difference in ripple voltage with and
without the flat bus under generator loaded conditions.
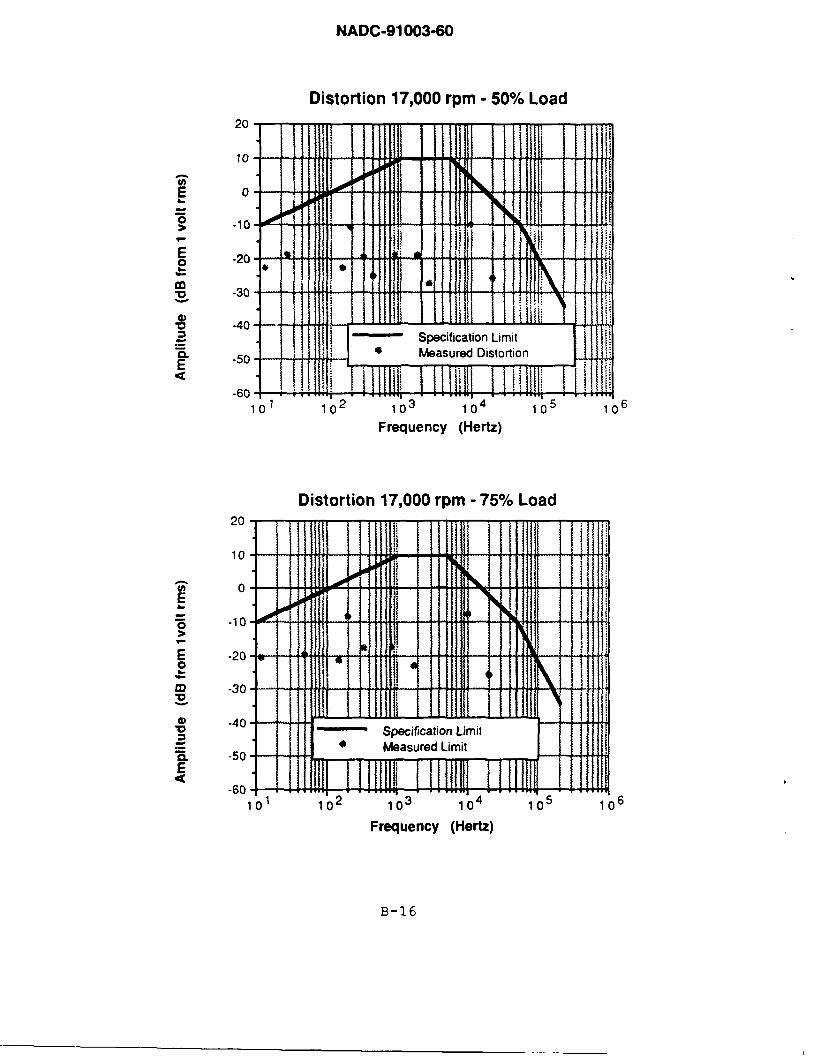
Distortion Spectrum Measurements
DC distortion is the superimposed alternating voltages on the
generator's DC output. This distortion was measured from 10 Hz to500 kHz at generator speeds from 10,000 to 18,000 rpm at 1000 rpr
increments at no load, 25%, 50%, and 75% loads. The distortion
spectrum was observed on a Norland oscilloscope that converted the
generator output waveform into the frequency domain by taking the
Fast Fourier Transform of the time domain. At each test conditio.,
the highest amplitude pcints and the frequencies that they
occurred at were recorded. All distortion measurements were taken
without the flat bus cble connected in order to assess the worst
case distortion. Measurements of distortion with flat bus were
nct taken due to time and funding constraints. However, from the
res.l.ts of the ripple measurements, it is believed that the flat

NADC-91 003-60
o with Flat Bus> 6 H Without Flat Bus
2
IC 11 12 13 14 15 16 7 18
Generator Speed (x 1000 rpmr)
Figure 4. Ripple at No Load
7 -7
CP 0 with Flat Bus~ Without Flat Bus
c 6
>,
0t
iC 11 12 13 14 15 16 17 1
Generator Speed (x 1000 rrns)
Figure 5. Ripple at 25% Load
E

NADC-91003-7)
8T
L With Flat BusU) whot F Bus
0 ... .
>
10 11 12 13 14 15 16 17 18
Generator Speed (x 1000 rpm)
Figure 6. Ripple at 50% Load
0
0>
0 With Flat Bus" Without Flat Bus
10 11 12 13 14 15 16 17 18
Generator Speed (x 1000 rpm)
Figure 7. Ripple at 75% Load

NADC-91003-60
cable would suppress distortion. The measured distortion
amplitudes were plotted along with the distortion curve from
Appendix A for each test condition. These plots are included in
Appe-.iix B. At every test condition, the distortion amplitude was
well below the limits specified in Appendix A. The distortion
factor was calculated for each test condition with the worst case
dc distortion. In every case, the distortion factor is well below
the recommended limit of 0.010 from Appendix A. Table (I) lists
the distortion factor for each condition. The worst distortion
factor for each load condition is emphasized in bold print. The
overall worst distortion (0.0021) occurred at minimum spee!
(10,000 rpm) and maximum load (75%).
Table 1. Distortion Factor
Speed
(rpm) No Load 25% Load 50% Load 75% Load
10,000 0.0009 0.0017 0.0019 0.0021
11,000 0.0006 0.0013 0.0010 0.0018
12,000 0.0005 0.0009 0.0010 0.0014
13,000 0.0004 0.0011 0.0010 0.0019
14,000 0.0004 0.0011 0.0014 0.0019
15,000 0.0006 0.0010 0.0013 0.0021
16,000 0.0006 0.0008 0.0011 0.0016
17,000 0.0011 0.0010 0.0012 0.0015
18,000 0.0006 0.0008 0.0006 0.0015
8
NADC-91003-60
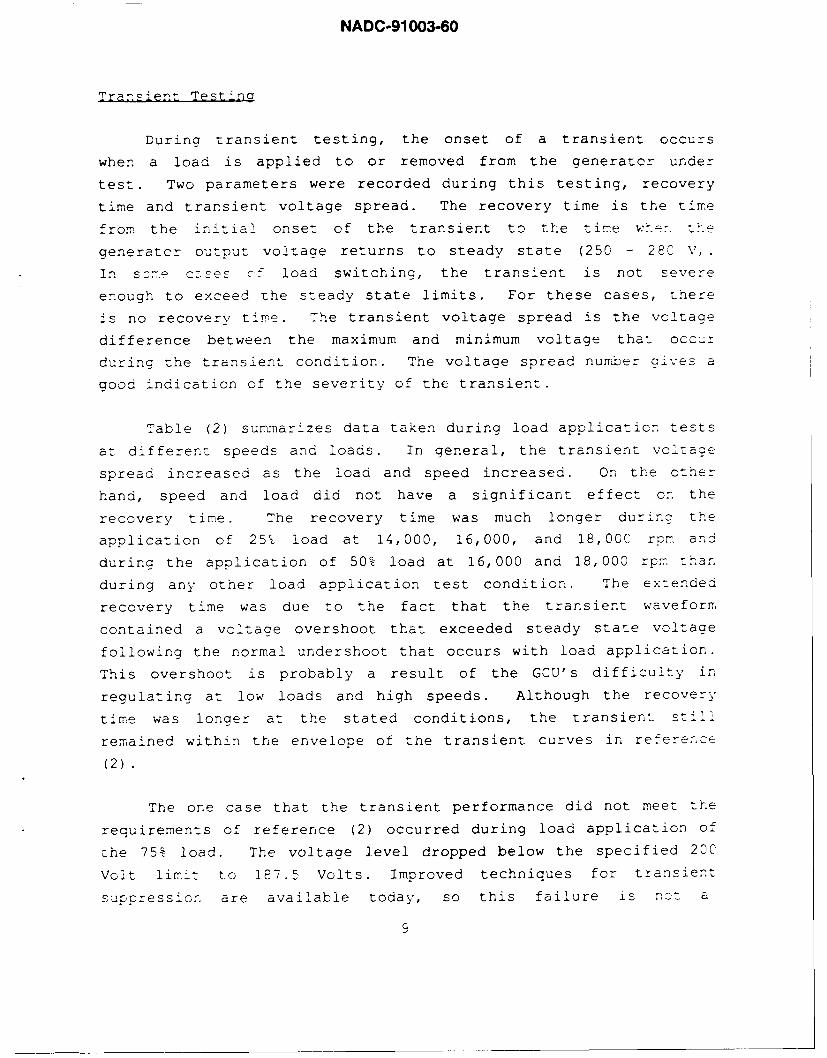
Transient Testina
Durina transient testing, the onset of a transient occurs
when a load is applied to or removed from the generator under
test. Two parameters were recorded during this testing, recovery
time and transient voltage spread. The recovery time is the time
from the initial onset of the transient to the time whe. the
generator output voltaae returns to steady state (250 - 260 V) .
In sc.e csses cf load switching, the transient is not severe
enough to exceed the steady state limits. For these cases, there
's no recovery time. The transient voltage spread is the voltage
difference between the maximum and minimum voltage that occur
during the transient condition. The voltage spread number gives a
good indication of the severity of the transient.
Table (2) summarizes data taken during load application tests
at different speeds and loads. In general, the transient voltace
spread increased as the load and speed increased. On the other
hand, speed and load did not have a significant effect on the
recovery time. The recovery time was much longer durino the
application of 25% load at 14,000, 16,000, and 18,00C rom and
during the application of 50% load at 16,000 and 18,000 ron than
during any other load application test condition. The extended
recovery time was due to the fact that the transient waveform
contained a voltaae overshoot that exceeded steady state voltaae
following the normal undershoot that occurs with load application.
This overshoot is probably a result of the GCU's difficulty in
regulating at low loads and high speeds. Although the recovery
time was longer at the stated conditions, the transient still
remained within the envelope of the transient curves in reference
(2).
The one case that the transient performance did not meet the
requirements of reference (2) occurred during load application of
the 75% load. The voltage level dropped below the specified 200
Volt limit to 187.5 Volts. Improved techniques for transient
suppression are available today, so this failure is not a
9

NADC-91003-60
Table 2. Data from Load Application Transients
Load Generator Recovery Voltage
Applied Speed Time Spread% ) (rpm) (ms) (volts)
25 10,000 0.5 46.9
25 12,000 0.6 50.8
25 14,000 14.2 62.5
25 16,cK-C 18.0 70.3
25 18,000 19.7 82.0
50 10,000 1.9 54.7
50 12,000 1.9 70.3
50 14,000 3.0 70.3
50 16,000 6.6 78.1
50 18,000 8.9 78.175 10,000 4.4 85.9
75 12,000 3.5 85.9
75 14,000 3.3 89.8
75 16,000 3.3 93.8
75 18,000 3.0 89.8
significant problem.
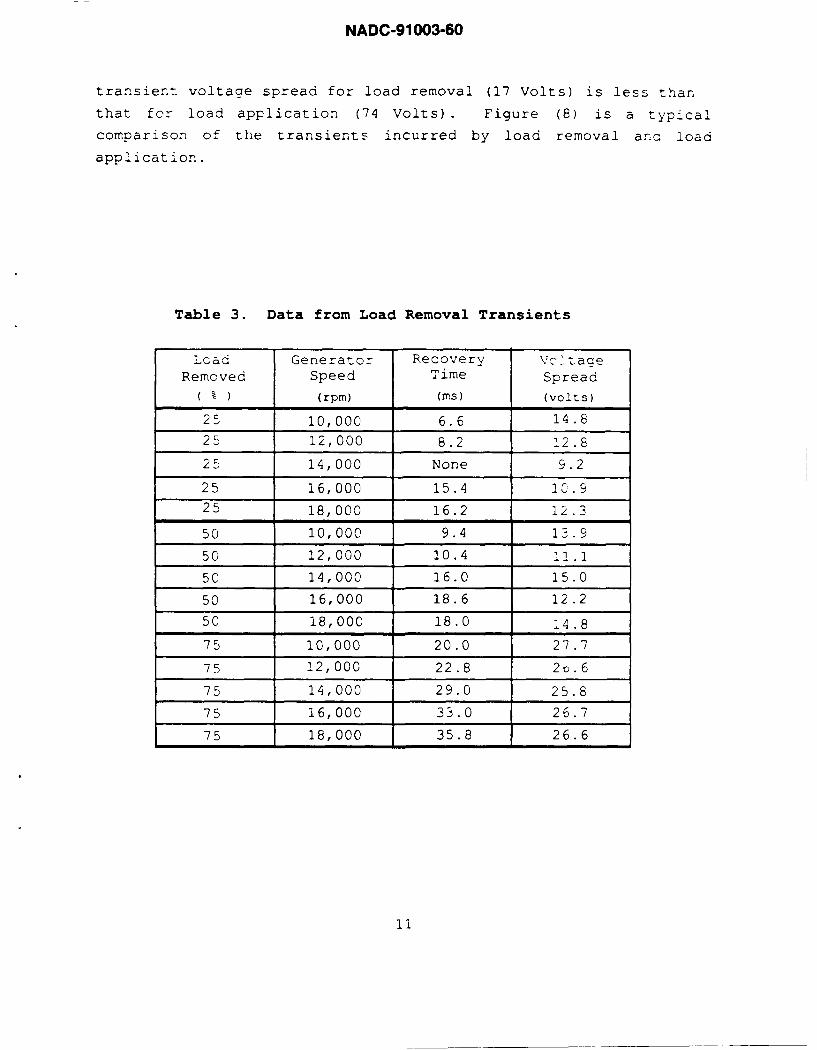
Table (3) summarizes data recorded during load removal at
different speeds and loads. Here, the recovery time does seem to
depend upon the speed of the generator and the amount of the load
being removed. The recovery time is longer for faster speeds and
higher loads. The voltage spread generally increased with
increasing load, but there was no significant effect of speed or.
the voltage spread.
The average recovery time for load removal is 18.5 ms while
the average recovery time for load application is only 6 ms. In
general, it takes about 3 times longer to recover from a load
removal than from a load application at the same percentage load
and the same generator speed. On the other hand, the average
10
NADC-91003-60
transient voltage spread for load removal (17 Volts) is less than
that for load application (74 Volts) . Figure (8) is a typical
comparison of the transients incurred by load removal ana load
application.
Table 3. Data from Load Removal Transients
Load Generator Recovery Vv1:ageRemoved Speed Time Spread
% ) (rpm) (ms) (volts)
25 10,000 6. 6 14.8
25 12,000 8.2 12.8
25 14,000 None 9.2
25 16,000 15.4 10.9
25 18,000 16.2 12.3
50 10,000 9.4 13.9
50 12,000 10.4 11.1
50 14,000 16.0 15.0
50 16,000 18.6 12.2
50 18,000 18.0 14.8
75 10,000 20.0 27.7
75 12,000 22.8 2c.6
75 14,000 29.0 25.8
75 16,000 33.0 26.7
75 18,000 35.8 26.6
11

NADC-91 003-60
340
330
320
310 -- 75% Load Removal
300at1,0rp
290
280
c 270'
0> 260
250
S 2400
> _175% Load ApplicationT, 230at1,0rp
22
210
200
190
180
170 AS-1831
10.02 .04 .06 .08 .10 .12
Time (seconds)
Figure 8. Example Plot of Transient Line Voltages
12

NADC-91003-60
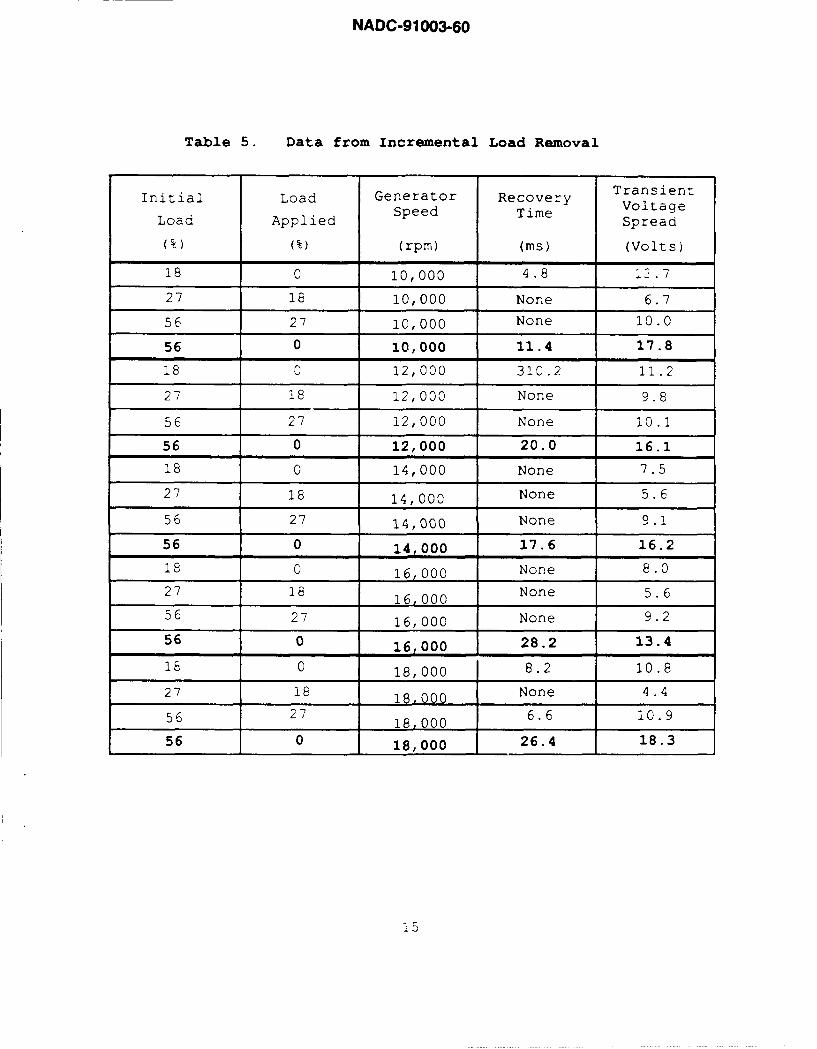
In order to decrease the severity of voltage transients, a
method of stepped load application and removal has been
investigated. The load was stepped up from no load to 18% to 27%
to 56%. Transient voltage spreads and recovery time were recorded
for each step up and also for a direct turn-on from no load to 56%irn Table (4). Table (5) provides similar data for load removal.
The voltage spreads for stepped loading were much less severe than
for direct loading. Also the recovery times were shorter or even
non-existent for stepped loading.
Since the transients from incremental loading were much
smaller than the transients from direct loading, they had to be
measured using the A.C. mode of the oscilloscope. The A.C. mode
of t e scooe could not capture transients from direct loading
greater than 56 load. So, rather than switch to D.C. mode tomeasure the larger transients and riskino inconsistent
measuremnents, the incremental loading testing was limited to 561
!caodna. The direct loading transients were measured using :e
-.C. mode of the oscilloscope. For this reason Tables (2) E (& )
should no: be compared to Tables (4) & (5).
13

NADC-91003-60
Table 4. Data from Incremental Load Application
Initial Load Generator Recovery Transient
Speed Time Voltage
Load Applied Spread
() (%) (rpm) (ms) (Volts)
0 18 10,000 0.45 35.9
18 27 10,000 0.90 11.7
27 56 10,000 0.40 28.1
0 56 10,000 3.10 43.8
C, 18 12,000 0.45 4 .E
i8 27 12,000 None 11.7
27 56 12,000 0.40 28.9
0 56 12,000 2.75 58.6
0 18 14,000 0.45 50.8
16 27 14,000 None ! 3 .
27 56 14, 000 0.40 28.1
0 56 14,000 2.35 65.6
0 18 16,000 0.55 57.t
18 27 16,000 None 26.
27 56 16,000 0.40 29.7
0 56 16,000 2.15 69.5
18 18,000 0.45 63.3
18 27 18,000 None 16.4
27 56 18,000 0.35 31.3
0 56 18,000 2.05 69.5
14

NADC-91003-60
Every test performed on the Lucas generator exceeded
expectations. Not only did the generator perform up to the
standards specified in the type specification that it was designed
to, but it also met the tighter requirements of MIL-STD-704D,
Appendix A, and AS-1831. The only exception was the transient
drop below 200 Volts during the 75% load application.
The general operating performance of the generator was
established by the measurements of line voltage and field current.
The line voltage was properly regulated and well within the MVL-
STD-704D limits for steady state operation during all speeds and
load conditions. The ripple measurements yielded an average
ripple of 4.7 V p-p which is considerably below the limit cf 12 V
p-p stated in MIL-STD-704D, and it is also below the 9.E V p-p
linit called ot in Appendix A. It has also been shown that tne
use of flat brs cable reduces ripple. Further inVestiaaticn into
this area is recommended. The results of the distortion
measurements clearly indicate that a 270 VDC aenerator can meet
the criteria outlined by the distortion spectrum in Appendix A.
The transient measurements were the only limiting factor of
the 270 VDC generator. In most cases, the generator performed
satisfactorily; however, under large load applications, the
-enerator had difficulty suppressing the transient as required by
AS-1831. Transient suppression circuits are available today to
combat this problem. Another alternative is stepped loading which
was proven in this paper to be an effective means of reducing
transient severity.
Based on this generator, which is over ten years behind
today's state-of-the-art, it can be concluded that no significant
problems should be encountered by generator vendors in their
efforts to meet the new 270 VDC requirements set forth in M!L-STD-
704E.
16
NADC-91003-60
Table 5. Data from Incremental Load Removal
TransientInitial Load Generator Recovery Voltage
Load Applied Speed Time Spread
(%) (%) (rpm) (ms) (Volts)
18 0 10,000 4.8 - .7
27 18 10,000 None 6.7
56 27 10,000 None 10.0
56 0 10,000 11.4 17.8
18 0 12,000 310.2 11.2
27 i8 12,000 None 9.8
56 27 12,000 None 10.1
56 0 12,000 20.0 16.1
18 0 14,000 None 7.5
27 18 14,000 None 5.6
56 27 14,000 None 9.1
56 0 14,000 17.6 16.2
18 0 16,000 None 8.0
27 18 16,000 None 5.6
56 27 16,000 None 9.2
56 0 16,000 28.2 13.4
18 0 18,000 8.2 10.8
27 18 18,000 None 4.4
56 27 18,000 6.6 10.9
56 0 18,000 26.4 18.3
15

NADC-91 003-60
REFERENCES
(1) MIL-STD-704D, Aircraft Electric Power Characteristics, 30
September 1980.
(2) AS-1831, Characteristics and Utilization of Aircraft Hiah
Vsitage Direct Current Electric Power, April 198C.
(3) NADC-60-TS-7803, Generator System, 270 Volts Direct
Current, Oil Cooled, Aircraft, General Specificat :n
for, S January 1978.
17

NADC-91 003-60
Appendix A
Excerpts from White Paper by Mr. Eric Speck

NADC-91 003-60
2 2,
- CL
- C)
-4
C 4:0
-- .C
_ _ _ _3 co_ apn_ o __duN
7.-A-1

NADC-91003-60
Table A-1. Recommended riole amplitude, distortion factor and distortionspectrum for MIL-STD-704.
28 Volt DC 270 Volt DC
Ripple amplitude 1.5 volts 6.0 volts
Distortion factor .035 .015
Distortion spectrum see below and Fig. 9a see below and Fig. 9b
at 10 hertz -20 dBVrms -10 dBVrms10 - 1,000 hertz +10 dB/decade slope +10 dB/decade slope
1,000 - 5,000 0 dBVrms +10 dBVrms5,000 - 50,000 -20 dB/decade slope -20 dB/decade slope
at 50,000 hertz -20 dBVrms -10 dBVrms50,000 - 200,000 -40 dB/decade slope -40 dB/decade slope
at 200,000 hertz -44.08 dBVrms -34.08 dBVrs
Table A-2 Recommended ripple amplitude, distortion factor and distortionspectrum for dc generator and converter specifications,
28 Volt DC 270 Volt DC
Ripple amplitude 1.2 volts 4.8 volts
Distortion factor .025 .010Distortion spectrum same as MIL-STD-704 same as MIL-STD-704
A-2
NADC-91 003-60
Appendix B
Distortion Spectrum Graphs

NADC-91 003-60
Distortion 10,000 rpm - No Load
10
E -20
0
E--2
= - Specification Limit
-50MesrdDsotnE
Frequency (Hertz)
Distortion 10,000 rpm - 25% Load
10
0
I-2
B-ii

NADC-91 003-60
Distortion 10,000 rpm - 50% Load
20
10
U-Mesrdisoto
30-
it,: Specification Limit
-50-- -IIH M II !1E
Frequency (Hertz)
2B--

NADC-91 003-60
Distortion 11,000 rpm - No Load
0
-30-
0. Measured DistortionE
4
-60 01 12 - 3 0 0Frequency (Hertz)
Distortion 11,000 rpm - 25% Load
20 - -----
10 -20
0-3-
-40 - Specification Limit
* Measured Distortion
-60 4
Frequency (Hertz)
B- 3

NADC-91 003-60
Distortion 11,000 rpm - 50% Load
20
10-
-300
E -
0a-0
Measured DistortionE
101 12 1 io4 105 16
Frequency (Hertz)
Ditoton1100 pm-75 La

NADC-91 003-60
Distortion 12,000 rpm - No Load
0 0
Mesue DIstrtio
05 -to-
E -0
0
30
E06-
Frequency (Hertz)
2B-S

NADC-91 003-60
Distortion 12,000 rpm - 50% Load20 -
-10
E 0a-oo .2
00
-40- Specification Limit
E 50Measured Distortion
io~ ~ o2 Frequency (Hertz
Distortion 12,000 rpm - 75% Load
140:00
E -
0 V
V -3
Specification Limit0. Measured Distortion
Frequency (Hertz)
B-6

NADC-91 003-60
Distortion 13,000 rpm - No Load20-
10 IN 1101 I 1i~
00
01
E
-30-
Specification Limit
Distotion 3,000rpm 25% oad
E
06
Frequency (Hertz)
Ditoton1300 pm-25-La

NADC-91 003-60
Distortion 13,000 rpm - 50% Load
10-
-10
0
0) -40- -
-Measured Distortion I
E-60
Frequency (Hertz)
Distortion 13,000 rpm - 75% Load
00
a-o
a)~11111 14 -!1:fiain ii00
0 MesuedDstrto
E -0
Freque Hetrtn
B- 8

NADC-91 003-60
Distortion 14,000 rpm - No Load
10-
I--
03
E -30
Feqsurenc (Hetrtz)
-sB-9

NADC-91 003-60
Distortion 14,000 rpm - 50% Load
E 0
0000 .I
4) -40-Specification LimitMaured Distortion
E
Frequency (Hertz)
Distortion 14,000 rpm - 75% Load
10-
E 0-
E
-40--50 IISpecification Limit
E -50-Measured Distortion
- 0 1 '23 "104 "1 010
Frequency (Hertz)
B-10

NADC-91 003-60
Distortion 15,000 rpm - No Load
00-
110
E00
05 -50 Mesued isor
06
Ditortion fictio 1500irmit25 La
.55
-60--Frequency (Hertz)
2B-l

NADC-91 003-60
Distortion 15,000 rpm - 50% Load
E 2010
E -0
0
CL -50 -Measured DistortionE
Frequency (Hertz)
101

NADC-91 003-60
Distortion 16,000 rpm - No Load
20
10
-4 0 -- peifcaio-Lmi
0 -5-Mas re-Dstrto
-40
101 102 103 10 0 106
Frequency (Hertz)
Distortion 16,000 rpm - 25% Load
E
00
0
V -40Specification Limita Measured Distort;'on
E W
101 10,2 10 0 105 10,6
Frequency (Hertz)
B- 13

iWADC-91 003-60
Distortion 16,000 rpm - 50% Load
-10
(0no -100
00
E06
Distortione16,00erpm ist75%tLoa
a-5
EI-6
Frequency (Hertz)
10-1

NADC-91 003-60
Distortion 17,000 rpm - No Load
10-
00
20
0 -20-
:2-
040-40 Specification Limit-50 Measured Distortion
E
Frequency (Hertz)
Ditoton1700B pm-25iLa
NADC-91 003-60
Distortion 17,000 rpm - 50% Load
20
00
E 0
L0.
20
1--0 -
V -40
-40 Specification LimitMeasured i ist otna -50-
E
-60 I I 1
Frequency (Hertz)
1B- M6

NADC-91 003-60
Distortion 18,000 rpm - No Load
20-10-1
-10-00,
E020
E Measured Distortion
Frequency (Hertz)
Distortion 18,000 rpm - 25% Load
(00
Eb.0
-1017

NADC-91 003.60
Distortion 18,000 rpm - 50% Load
p20
01
0a -5
.20-
E
0-40-
E -50
Frequency (Hertz)
B-01