27th seismic research review: ground-based nuclear ... · objective this work represents a...
TRANSCRIPT

RESEARCH IN REGIONAL SEISMIC MONITORING
F. Ringdal1, S. J. Gibbons1, T. Kvaerna1, V. Asming2, Yu. Vinogradov2, S. Mykkeltveit1, and J. Schweitzer1
NORSAR1 and Kola Regional Seismological Center2
Sponsored by Air Force Technical Applications Center
Contract No. F08650-01-C-0055
ABSTRACT
This project represents a continuing research effort aimed at improving seismic monitoring tools at regional distances, with emphasis on the Barents/Kara Sea region, which includes the former Novaya Zemlya test site. The tasks comprise development and improvement of detection, location and discrimination algorithms as well as experimental on-line monitoring using tools such as regional generalized beamforming and Threshold Monitoring (TM). It also includes special studies of mining events, for which detailed ground truth information is being provided by the Kola Regional Seismological Centre (KRSC). These studies are documented in the NORSAR Semiannual Technical Summaries. In this paper, we present three of these investigations in more detail.
The first topic is the use of the large-aperture NORSAR array for automatic processing of regional phases. Such processing is notoriously difficult, due to the low coherency across the large array of the high-frequency regional phases, and has not been successfully implemented in the past. We have recently completed a new processing system for incorporating regional seismic phases detected by the large NORSAR array into the generalized beamforming process currently in use at NORSAR for on-line automatic detection and location of seismic events in the European Arctic. The system employs a multitaper method to calculate continuous spectra of the waveforms and detects changes in spectral content consistent with regional phases propagating across the array. It represents a significant improvement over previous processing systems for this large array, and opens up interesting possibilities for improved automatic detection and location using local or regional networks.
The second topic is a continued study of combining seismic and infrasonic recordings for detection and characterization of seismic events at local and regional distances. We present results from an analysis of several recent surface explosions in the Kola peninsula near the Norwegian border. These explosions were carried out for the purpose of destroying old ammunition, and generated unusually strong infrasonic signals in addition to seismic signals. Not unexpectedly, the infrasonic signals were well recorded on the infrasound array in Apatity, but more interestingly, they were also clearly recorded on the seismic sensors at the ARCES and Apatity arrays (both at about 250 km distance from the source area). We used the recordings to make a location estimate based upon the infrasonic detections (on the seismic sensors) at these two arrays, and found that the locations matched closely the locations obtained through standard seismic data analysis. This indicates an interesting potential for joint two-array infrasonic processing, and this concept will be further developed once the International Monitoring Station (IMS) infrasound array near ARCES has been established (expected in 2006).
The third topic concerns an initial investigation of the potential of obtaining improved detection of small seismic events by the use of waveform correlation in conjunction with array processing. We present examples on the power of the array-based correlation technique, demonstrating that waveform correlation could be used to detect the small aftershock (mb=2.5) following the 16 August 1997 Kara Sea event, not only at the Spitsbergen array (distance 1100 km), but even at the large NORSAR array situated more than 2300 km from the epicenter. We also discuss some other potential applications of this technique, which we will develop further over the next three years in a separate joint research project with Lawrence Livermore National Laboratory (LLNL).
423
27th Seismic Research Review: Ground-Based Nuclear Explosion Monitoring Technologies

OBJECTIVE
This work represents a continued effort in seismic and infrasonic monitoring, with emphasis on studying earthquakes and explosions in the Barents/Kara Sea region, which includes the former Russian nuclear test site at Novaya Zemlya. The overall objective is to characterize the seismicity of this region, to investigate the detection and location capability of regional seismic networks and to study various methods for screening and identifying seismic events in order to improve nuclear explosion monitoring capability. Another objective is to carry out special studies of mining events, for which detailed ground truth information is being provided by the Kola Regional Seismological Centre (KRSC).
RESEARCH ACCOMPLISHED
Introduction
NORSAR and the Kola Regional Seismological Centre (KRSC) of the Russian Academy of Sciences have for many years cooperated in the continuous monitoring of seismic events in North-West Russia and adjacent sea areas. The research has been based on data from a network of sensitive regional arrays in northern Europe. This regional network, which comprises stations in Fennoscandia, Spitsbergen and NW Russia provides a detection capability for the Barents/Kara Sea region that is close to mb = 2.5 (Ringdal, 1997).
The research carried out during this effort is documented in detail in several contributions contained in the NORSAR Semiannual Technical Summaries. In the present paper we will limit the discussions to some recent results of interest in the general context of regional monitoring of seismic events in the European Arctic.
Developing NORSARs regional processing system
NORSAR has for a number of years carried out processing and analysis of seismic events in the European Arctic, using the regional array network in Fennoscandia and NW Russia. The regional processing system at the NORSAR Data Center comprises the following steps:
• Automatic single array processing, using a suite of bandpass filters in parallel and a beam deployment that covers both P- and S-type phases for the region of interest.
• An STA/LTA detector applied independently to each beam, with broadband f-k analysis for each detected phase in order to estimate azimuth and phase velocity.
• Single-array phase association for initial location of seismic events, and also for the purpose of chaining together phases belonging to the same event, so as to prepare for the subsequent multiarray processing.
• Multi-array event detection, using the generalized beamforming approach (Ringdal and Kværna, 1989) to associ-ate phases from all stations in the regional network
• Interactive analysis of selected events, resulting in a reviewed regional seismic bulletin, which includes hypocen-tral information, magnitudes and selected waveform plots.
Until recently, the large aperture NORSAR array in southern Norway has not been incorporated in this process, since a sufficiently reliable regional processing system has not been available for an array this size. The NORSAR array was designed in the late 1960s to detect low-yield underground nuclear explosions at teleseismic distances (Bungum et. al., 1971). The instruments, covering an aperture of approximately 100 km, were spaced to minimize the coherency of microseisms and thus provide an optimal signal-to-noise (SNR) gain for teleseismic signals between 0.5 and 2.0 Hz using classical beamforming with suitable steering parameters. After 1980, the focus in nuclear explosion monitoring turned towards the observation and interpretation of regional seismic phases and this motivated the development of the NORES regional seismic array and numerous subsequent arrays based upon this design (Mykkeltveit et al., 1990). The generalized beamforming system provides fully automatic event locations by the association of phase detections made by the network of regional seismic arrays in Fennoscandia and Spitsbergen and
424
27th Seismic Research Review: Ground-Based Nuclear Explosion Monitoring Technologies
the absence of detections from the NORES array (since June 2002) has led to a substantially worse detection and location capability for southern and western Norway.
A spatial reconfiguration of the NORSAR array to facilitate the processing of high-frequency regional phases using traditional regional array processing methods has been deemed undesirable because of the exciting possibilities which the large aperture NORSAR array represents in terms of detection of low-magnitude events using full waveform methods and because of the unique opportunity to study the variation of site effects over this large heterogeneous region. The vast majority of underground nuclear explosions occurred before most of the regional arrays were built and the 35 year long database of high quality digital seismic data from the NORSAR array provides a unique and invaluable reference.
Traditional array processing methods are entirely inadequate to process high-frequency regional phases over the NORSAR array due to the signal incoherence. The low attenuation in Fennoscandia means that many regional signals are best observed at high frequencies; signals become incoherent over the NORSAR subarrays (aperture of the order 10 km) above approximately 3 Hz. It was noted many years ago by Ringdal et al., 1972, however, that high-frequency signals could be detected with a high SNR over the NORSAR array despite the incoherence of the actual waveforms by forming incoherent beams with the envelopes of filtered waveforms.
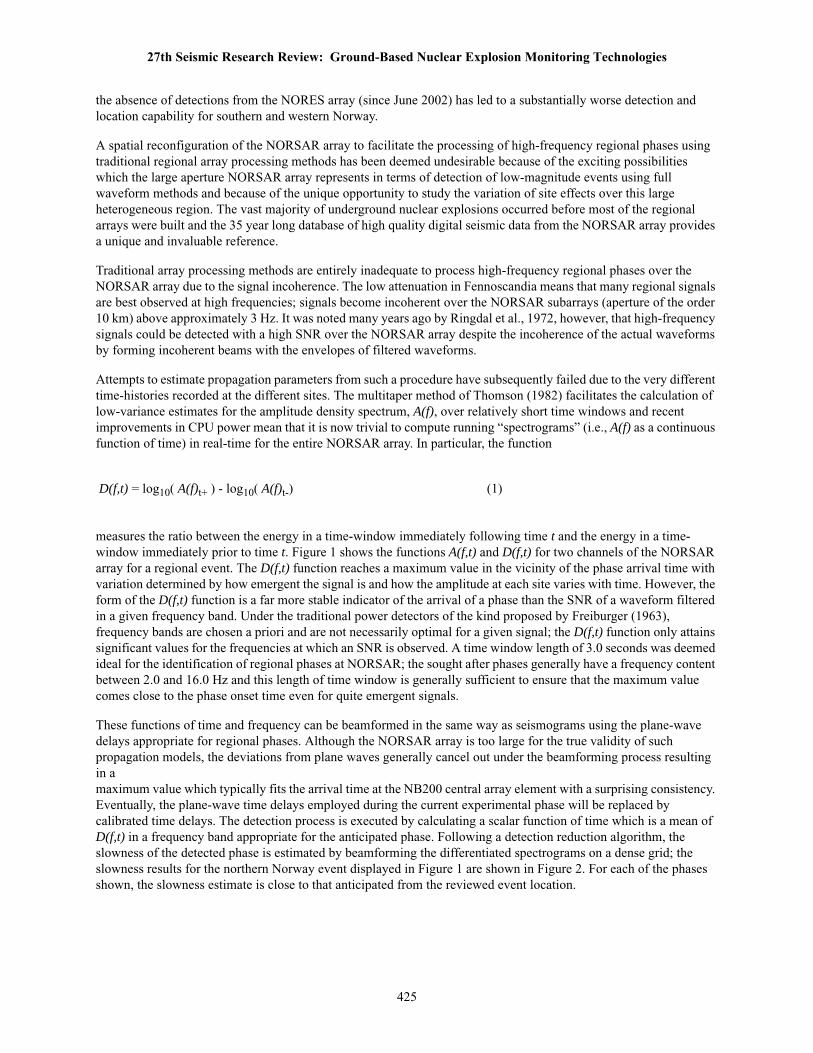
Attempts to estimate propagation parameters from such a procedure have subsequently failed due to the very different time-histories recorded at the different sites. The multitaper method of Thomson (1982) facilitates the calculation of low-variance estimates for the amplitude density spectrum, A(f), over relatively short time windows and recent improvements in CPU power mean that it is now trivial to compute running “spectrograms” (i.e., A(f) as a continuous function of time) in real-time for the entire NORSAR array. In particular, the function
D(f,t) = log10( A(f)t+ ) - log10( A(f)t-) (1)
measures the ratio between the energy in a time-window immediately following time t and the energy in a time-window immediately prior to time t. Figure 1 shows the functions A(f,t) and D(f,t) for two channels of the NORSAR array for a regional event. The D(f,t) function reaches a maximum value in the vicinity of the phase arrival time with variation determined by how emergent the signal is and how the amplitude at each site varies with time. However, the form of the D(f,t) function is a far more stable indicator of the arrival of a phase than the SNR of a waveform filtered in a given frequency band. Under the traditional power detectors of the kind proposed by Freiburger (1963), frequency bands are chosen a priori and are not necessarily optimal for a given signal; the D(f,t) function only attains significant values for the frequencies at which an SNR is observed. A time window length of 3.0 seconds was deemed ideal for the identification of regional phases at NORSAR; the sought after phases generally have a frequency content between 2.0 and 16.0 Hz and this length of time window is generally sufficient to ensure that the maximum value comes close to the phase onset time even for quite emergent signals.
These functions of time and frequency can be beamformed in the same way as seismograms using the plane-wave delays appropriate for regional phases. Although the NORSAR array is too large for the true validity of such propagation models, the deviations from plane waves generally cancel out under the beamforming process resulting in a maximum value which typically fits the arrival time at the NB200 central array element with a surprising consistency. Eventually, the plane-wave time delays employed during the current experimental phase will be replaced by calibrated time delays. The detection process is executed by calculating a scalar function of time which is a mean of D(f,t) in a frequency band appropriate for the anticipated phase. Following a detection reduction algorithm, the slowness of the detected phase is estimated by beamforming the differentiated spectrograms on a dense grid; the slowness results for the northern Norway event displayed in Figure 1 are shown in Figure 2. For each of the phases shown, the slowness estimate is close to that anticipated from the reviewed event location.
425
27th Seismic Research Review: Ground-Based Nuclear Explosion Monitoring Technologies
Figure 1. Seismograms from two elements of the NORSAR array (top panel) for an earthquake in northern Norway (distance approximately 610 km) with corresponding spectrograms, A(f,t), (center panel) and the function D(f,t) = log10( A(f)t+ ) - log10( A(f)t-) (lower panel). The secondary phases exhibit relatively poor spectral contrast on single channel spectrograms. This contrast is improved greatly by beamforming these functions using the appropriate delay times. The large number of array sites and large intersite distances mean that features which are not observed at a majority of sites at the appropriate times are rarely detected.
NC602_sz
NB200_sz
NC602_sz
NB200_sz
Differencedlogarithmicspectrograms
densityspectral Amplitude
Sn Lg
Pn
Pn
Lg
Pn
Lg
Lg
Pn
Sn
Sn
Sn
426
27th Seismic Research Review: Ground-Based Nuclear Explosion Monitoring Technologies

Figure 2. Slowness estimates from the large aperture NORSAR array for the Pn, Sn, and Lg phases from the North Norway event on June 24th 2005, using spectrogram beamforming at the times indicated. The automatic location estimate incorporating these phase detections, together with detections from the regional arrays in Fennoscandia, is found on http://www.norsar.no/NDC/bulletins/gbf/2005/GBF05175.html
Such detections from the NORSAR array have been incorporated in the generalized beamforming system since March 16, 2005, and, despite the unconventional method employed, have contributed significantly to the automatic detection capability in this region and have reduced considerably the analyst workload. Since operations began, an average of 40 detections per day have been registered for regional, far regional and some teleseismic events. Most teleseismic events are missed since the waveforms are bandpass filtered above 1.8 Hz; such signals are captured by the traditional processing of the NORSAR array. Although the number of detections made is far smaller than for the regional arrays, the large aperture of the array, combined with a conservative detection threshold, ensures that almost all detections are the result of genuine regional phases and the vast majority are subsequently associated with phases from the regional arrays. Local Rg detections which can often dominate the detection lists from the other arrays are not made since such phases would not excite all seven subarrays at times consistent with regional body waves or Lg phases. Given that the energy contrast is so low for many coda phases, few are detected using this process; beamforming with the appropriate steering parameters on a coherent array is required to achieve a sufficient SNR for detection. This is regrettable in that the rich information available to a regional array is lost, but, for the multi-array phase association (generalized beamforming), the absence of many coda detections has meant that the NORSAR array contributions have in many cases provided the best constraints on the solution since the detections made are almost inevitably the first P- and first S- phases at these sites.
Combined seismic-infrasonic processing
We have continued our studies of combining seismic and infrasonic recordings for detection and characterization of seismic events at local and regional distances, following up the work of Vinogradov and Ringdal (2003). We present results from an analysis of five recent surface explosions in the Kola Peninsula near the Norwegian border. These co-located explosions were carried out for the purpose of destroying old ammunition, and generated unusually strong infrasonic signals in addition to seismic signals. Not unexpectedly, the infrasonic signals were well recorded on the infrasound array in Apatity, but more interestingly, they were also clearly recorded on the seismic sensors at the ARCES and Apatity arrays (both at about 250 km distance from the source area). Figure 3 shows selected seismometer recordings from the ARCES array for one of the explosions, with the seismic waves and the sound waves indicated on the figure.
SxSxSxPn : 2005-175:04.27.03.0 Sn : 2005-175:04.28.05.8 Lg : 2005-175:04.28.29.1
Sy
427
27th Seismic Research Review: Ground-Based Nuclear Explosion Monitoring Technologies

Figure 3. ARCES waveforms for one of the explosions discussed in the text. Note the clear recording of both the seismic P and S waves and the sound waves, which appear about 14 minutes later.
Figure 4. The map shows results from locating the five explosions described in the text. The triangles are locations based on standard interactive analysis of the seismic data from the ARCES and APATITY arrays, whereas the crosses are locations obtained using only the estimated azimuths of the sound waves recorded by the two arrays.
Sound wavesSeismic waves
ARCES seismic sensors
20˚
25˚ 30˚
67˚ 30'
70˚ 00'
ARCES
APATITY
Seismic locations (triangles) and infrasonic locations (crosses)
Norway
Finland
Russia
428
27th Seismic Research Review: Ground-Based Nuclear Explosion Monitoring Technologies

Although we do not know the exact coordinates of the explosion site, we used this opportunity to investigate the stability of azimuth estimates of sound waves, using various subconfigurations of the ARCES array. It turned out that the estimates were very stable, even for the smallest subset of the array (the four-element A-ring, with a diameter of about 300 m). The estimates ranged from 82 to 86 degrees, with no significant change in the stability with the size of the selected array subset. For the 3-element APATITY infrasound array, (diameter 300 m), the estimates were likewise stable, ranging from 346 to 351 degrees.
We used the estimated azimuths (from the infrasonic waves) for the two arrays to locate the five events, and compared the recordings to those obtained using standard seismic analysis. As can be seen from Figure 4, the locations match quite closely. This indicates an interesting potential for joint two-array infrasonic processing, and this concept will be further developed once the IMS infrasound array near ARCES has been established (expected in 2006).
Array-based waveform correlation
We have carried out an initial investigation of the potential of obtaining improved detection of small seismic events by the use of waveform correlation in conjunction with array processing. As an example of the power of using arrays in the waveform correlation process, we describe briefly some results from detecting an aftershock of the well known Kara Sea event of 16 August 1997. This small aftershock (mb=2.5), occurred about 4 hours after the main event, and was detected by only one IMS station (the Spitsbergen array) by conventional processing (see map in Figure 5). This array is situated about 1280 km from the event, and had several P-phase detections with a relatively low SNR, but no S-phase detection. The event could therefore not be located automatically, and was identified as an aftershock through careful analyst inspection.
Figure 5. The location of the NORSAR and Spitsbergen arrays in relation to the site of the 16 August 1997 Kara Sea events (main shock of mb=3.5 and aftershock of mb=2.5).
20o
20o
40o
40o
60o
60o
60 o 60o
65 o 65o
70 o 70o
75 o 75o
80 o 80o
SPI
NORSAR
2320 km
1300 km
429
27th Seismic Research Review: Ground-Based Nuclear Explosion Monitoring Technologies

Figure 6. Detection of an aftershock from the 16 August 1997 Kara Sea event using waveform correlation on the short period vertical channels of the Spitsbergen array. Each channel was bandpass filtered between 4.0 and 8.0 Hz and a 60 second long data segment was extracted from the master event signal (shown in red for SPA0 sz) with the first master event data segment beginning at 1997-228:02.13.44.913. The data containing the presumed aftershock was filtered in the same band (shown in blue for SPA0) and a trace of fully normalized correlation coefficients was calculated for each channel. The green channel is the summation of the 9 correlation coefficient traces. A clear peak is observed on the correlation beam at a time 1997-228:06.21.55.815. The lower panel is a zoom-in of the upper panel.
SPA0_szCorrelation
SPA1_szCorrelation
SPA2_szCorrelation
Trace BeamCorrelation
SPA0_sz
4.0 8.0 Hz
SUM OVER ALL SPITZBERGEN CORRELATION COEFFICIENT CHANNELS
DATA FROM MASTER EVENT
SPA0_sz
905.2308
0.646027
0.648021
0.665923
109.0976
0.615767
Starting time 1997-228:02.13.41.100Starting time 1997-228:06.21.52.000
Correlation
SPA2_szCorrelation
Trace BeamCorrelation
SPA0_sz
SPA0_sz
Starting time 1997-228:06.20.00.000 Starting time 1997-228:02.11.49.100
SPA1_sz
4.0 8.0 Hz
20.00 21.00 22.00 23.00 24.00 25.00 26.00 27.00 28.00
0.646027
0.648021
0.665923
110.1171
0.615767
SPA0_szCorrelation
905.2308
430
27th Seismic Research Review: Ground-Based Nuclear Explosion Monitoring Technologies

Figure 7. Detection of the Kara Sea event aftershock by waveform correlation using the NORSAR array. The frequency band applied in this calculation is 2.5 - 8.0 Hz. The 60 second long time windows containing the master event signal are staggered by several seconds to account for the significant time delays across the array; the first master event time-window begins at 1997-228:02.15.39.087 for instrument NC301. The signal at this far more distant array is buried in the noise to a far greater extent than at SPI and in no filter band could this signal be detected with a conventional STA/LTA detector. While the SPI signal is very coherent over the array in the frequency band for which the SNR is optimal facilitating a reasonable SNR gain by conventional beamforming; this is not the case for the NOA signal. In contrast to the correlation displayed in Figure 3, the individual sensor correlation traces do not indicate clear simultaneous maxima. However, the beam (formed by applying the appropriate time-shifts to the individual correlation traces) displays a clear peak at time 1997-228:06.23.49.999.
NC602_szCorrelation
NAO00_szCorrelation
NC301_szCorrelation
Trace BeamCorrelation
NC602_sz
NC602_sz
389.2602
0.160092
0.128313
0.140286
113.0443
0.085951
Starting time 1997-228:06.23.45.000 Starting time 1997-228:02.15.34.100
NC602_sz
NC602_sz
389.2602
0.174367
0.212223
0.206846
169.9278
0.085951
Starting time 1997-228:06.20.00.000 Starting time 1997-228:02.11.49.100
Correlation
2.5 8.0 Hz
20.00 21.00 22.00 23.00 24.00 25.00 26.00 27.00 28.00
NC602_szCorrelation
NAO00_szCorrelation
NC301_szCorrelation
Trace Beam
DATA FROM MASTER EVENT
CORRELATION SUM OVER NORSAR ARRAY
2.5 8.0 Hz
431
27th Seismic Research Review: Ground-Based Nuclear Explosion Monitoring Technologies

We applied an array correlation procedure to both the small-aperture Spitsbergen array and the large-aperture NORSAR array (at a distance of more than 2300 km), using the main event as a master waveform. The results for the small aftershock are shown in Figures 6 and 7. Both figures show very distinct correlation peaks for the aftershock, and thee timing of these peaks is indicative of two co-located events. The Spitsbergen array (Figure 6) has clear peaks both for the individual sensors and on the beam. The results from the large NORSAR array (Figure 7) are even more impressive, and illustrate one of the main strengths of the correlation/beamforming process; the individual correlation traces are coherent across the array even when the actual waveforms are not. The correlation/beamforming process therefore provides an SNR gain far greater than that achieved by conventional beamforming. In fact, the event cannot even be seen on the NORSAR individual sensor correlation traces, whereas it is clearly visible on the beam of these traces.
CONCLUSIONS AND RECOMMENDATIONS
We have implemented a new processing system for incorporating regional seismic phases detected by the large NORSAR array into the generalized beamforming process currently in use at NORSAR for on-line automatic detection and location of seismic events in the European Arctic. The system represents a significant improvement over previous processing systems for large arrays, and we recommend that this method be further developed for improving automatic detection and location using local or regional networks.
We have obtained some interesting results when comparing location estimates based on seismic and infrasonic recordings of surface explosions at local and regional distances. Using ARCES and Apatity array recordings of a set of explosions near the Norwegian-Russian border, we have found that the infrasonic locations (using azimuths only) match closely the locations obtained through standard seismic data analysis. This indicates an interesting potential for joint two-array infrasonic processing, and we recommend that this concept be further developed once the IMS infrasound array near ARCES has been established (expected in 2006).
We have documented a significant potential of obtaining improved detection of small seismic events by the use of waveform correlation in conjunction with array processing. We have demonstrated that waveform correlation could be used to detect the small aftershock (mb=2.5) following the 16 August 1997 Kara Sea event, not only at the Spitsbergen array (distance 1100 km), but even at the large NORSAR array situated more than 2300 km from the epicenter. We recommend that further studies be undertaken on potential applications of this technique, which we will develop further over the next three years in a separate joint research project with LLNL
REFERENCES
Bungum, H., E. S. Husebye and F. Ringdal (1971). The NORSAR array and preliminary results of data analysis, Geo-phys. J. R. Astr. Soc. 25: 115-126.
Freiburger, W. F.(1963). An approximation method in signal detection, Quart. J. App. Math. 20: 373-378.
Mykkeltveit, S., F. Ringdal, T. Kværna and R. W. Alewine (1990). Application of regional arrays in seismic verifica-tion research, Bull. Seism. Soc. Am. 80: 1777-1800.
Ringdal, F. (1997): Study of low-magnitude seismic events near the Novaya Zemlya nuclear test site, Bull. Seism. Soc. Am. 87: No. 6, 1563-1575.
Ringdal, F. and T. Kværna (1989). A multichannel processing approach to real time network detection, phase associ-ation and threshold monitoring, Bull. Seism. Soc. Am. 79: 1927-1940.
Ringdal, F., E. S. Husebye and A. Dahle (1972). Event detection problems using a partially coherent seismic array, NORSAR Tech. Rep. 45, Kjeller, Norway.
Thomson, D. J. (1982). Spectrum Estimation and Harmonic Analysis, Proc. IEEE, 70: 1055-1096.
Vinogradov, Yu. and F. Ringdal (2003). Analysis of infrasound data recorded at the Apatity array, Semiannual Techni-cal Summary 1 July - 31 December 2002, NORSAR Sci. Rep. 1-2003, Kjeller, Norway.
432
27th Seismic Research Review: Ground-Based Nuclear Explosion Monitoring Technologies