2.8 multi-dimensional fission-barrier calculations from se
TRANSCRIPT
JAERI-Conf 2003-017JP0450183
2.8 Multi-dimensional Fission-Barrier Calculations from Se to the SHE; from the Protonto the Neutron Drip Lines.
Peter MOLLER1*, Arnold J. SIERK1, Ragnar BENGTSSON 2, and Akira IWAMOTO3
1 Theoretical Division, Los Alamos National Laboratory. Los Alamos. New Mexico 87545, USA2 Department of Mathematical Physics, Lund Institute of Technology, P. 0. Box 118, Sweden
3 Department of Materials Science. Japan Atomic Energy Research Institute, Tokai-mura, Naka-gun, Ibaraki, 319-1195 Japan
We present fission-barrier-height calculations for nuclei throughout the periodic system based on a realistic theoret-ical model of the multi-dimensional potential-energy surface of a fissioning nucleus. This surface guides the nuclearshape evolution from the ground state, over inner and outer saddle points, to the final configurations of separated fis-sion fragments. We have previously shown that our macroscopic-microscopic nuclear potential-energy model yieldscalculated "outer" fission-barrier heights (EB) for even-even nuclei throughout the periodic system that agree with ex-perimental data to within about 1.0 MeV. We present final results of this work. Just recently we have enhanced ourmacroscopic-microscopic nuclear potential-energy model to also allow the consideration of axially asymmetric shapes.This shape degree of freedom has a substantial effect on the calculated height ( £ A ) of the inner peak of some aclinidefission barriers. We present examples of fission-barrier calculations by use of this model with its redetermined con-stants. Finally we discuss what the model now tells us about fission barriers at the end of the r-process nucleosynthesispath.
KEYWORDS: nuclear fission, fission barrier, multi-mode fission
1. Introduction
In nuclear fission the nucleus evolves from a single ground-state shape into two separated fission fragments. During theshape and configuration changes that occur during this processthe total energy of the system intially increases up to a max-ium, the fission-barrier height, then decreases. The transitionconfiguration between a single shape and two separated frag-ments is the scission configuration. At this configuration the'"neck" radius is zero. Beyond the scission configuration theseparated fragments are accelerated by their mutual Coulumbrepulsion and reach kinetic energies in the range 150-200MeV for actinide fission.
Calculations of fission barriers involve the determination ofthe total nuclear potential energy for different nuclear shapes.Such a calculation defines an energy landscape as a functionof a number of shape coordinates. The fission barrier heightis given by the energy relative to the ground state of the mostfavorable saddle point that has to be traversed when the shapeevolves from a single shape to separated fragments. Theselandscapes are often displayed in terms of energy contour dia-grams versus two shape coordinates with one shape coordiatecorresponding to elongation and the other to the nuclear neckdimension, for example. However, in contrast to a geograph-ical landscape the fission-energy landscape needs to be anal-ysed in terms of more than two coordinates. It is a diffcultproblem to identify the relevant saddle points in these multi-dimensional spaces, and many incorrect approaches have ap-peared and do still appear in the literature. We use here atechnique borrowed from the area of geographical topogra-phy studies, namely imaginary water flow,'21 to determine thestructure of the multidimensional fission-energy landscapes.
* Corresponding author, Tel. +I-5O5-665-22IO, Fax. +1- 505-667-1931, E-mail: [email protected]
A number of models for the total nuclear potential energyexist. We use here the FRLDM macroscopic-microscopicmodel to calculate fission and fusion potential-energy land-scapes. At first sight it may seem that a preferred modelshould be selfconsistent and based on effective two-bodyforces, for example some type of Hartree-Fock model. How-ever with such models at least two problems are unresolved.First there exisits no effective force which is proven to giveboth realistic masses and realistic fission barriers over the en-tire nuclear chart. Second, even if a realistic force were tobe determined, it is inherently difficult and in practice prob-ably impossible to determine correct saddle point shapes andheights in a Hartree-Fock model, as we discuss in the nextsection.
II. Saddle-Point Determination
It is a common misconception that constrained self-consistent calculations, for example HF or HFB calculationswith Skyrme or Gogny forces-1"5' automatically take into ac-count all non-constrained variables. For the application tosaddle-point determination this is incorrect.
In HF calculations the energy is obtained in successive iter-ations that end when self-consistency is achieved between thepotential and density. It is assumed that the shape and energyof the corresponding configuration corresponds to a local min-imum in the vicinity of the starting configuration. To obtainfission barriers external constraints are imposed, for examplea single quadrupole moment (Q2) constraint. The energy isthen calculated for successive values of this constraint, andthe fission-barrier height is taken to be the maximum on thiscurve. However, this maximum does not correspond to thesaddle point in a higher-dimensional space, as is discussedin several publications.li6'7' For example it is often observedthat when the energy obtained in constrained calculations is
- 29 -

JAERI-Conf 2003-017
plotted versus Q2 the curve exhibits discontinous cusps. Thismeans that a discontinous transition occured in the higher-dimensional space from one valley to another. The true saddlepoint is usually lower than the maximum on the discontinouscurve. In other cases a continous curve m'ay be obtained inconstrained calculation, and it is then assumed that there is"no problem" because the energy curve is continous and theshape of the nucleus evolves continously.
Figure 1 illustrates, in two dimensions, some of the dif-ficulties that may occur in constrained HF calculation of therelevant fission-threshold saddle points. It also illustrates whatmay occur in a macroscopic-microscopic calculation of a mul-tidimensional potential-energy landscape when the energy isdisplayed versus two shape coordinates and in which the en-ergy in each point in the displayed two-dimensional diagramhas been minimized with respect to additional shape degreesof freedom. Let 0 represent a coordinate in the fission direc-tion and a all other coordinates and furthermore let the bluearea at 0 = —100 and a = 6.0 represent the second minimumin the fission potential-energy surface. And let the blue area tothe right represent the valley of separated fission fragments. Inmany calculations based on "minimizations" with respect toadditional coordinates the procedure would now be to increasethe fission coordinate 0 by some increment, which for claritywe choose to be as large as 40, while keeping the additionalshape-degrees of freedom fixed. This would take us alongthe initial part of the thin horizontal line to © = —60 and<v = 6.0. Starting from this position the energy would now beminimized for fixed 0 = -60. This would take us down tothe large black dot on the dot-dashed line. The process wouldthen be repeated with the result that the energy would be ob-tained for the succession of black dots on the dot-dashed line.In our example here all the shape coordinates along this tra-jiTiory would vary continuously and no suspicion may arisethai the saddle point found, in the region of the red arrow, ismil 1 he true saddle point, that is, it is not the lowest pass lead-in;; to the fission valley of separated fragments to the right inthe figure. A minimum-energy trajectory should instead takeus over the saddle-points identified by the green arrows in thefigure. We can easily "see" this in a two-dimensional case asthe example here, but in a higher-dimensional space it takes aclever algorithm to identify all of the relevant structure. Thisrequirement led to the water-flow algorithm.
A numerical algorithm that locates the saddle points by thecriteria that all first derivatives be zero and that the secondderivatives have the appropriate signs would locate the saddlesmarked by crossed lines in the upper part of the figure in ad-dition to the saddles we have already discussed. It would thenbe difficult to determine which of these represented the low-est mountain pass between the second minimum and the blueiirea to the right representing the fission valley of separatedfragments. However, the water-flow method simply bypassesthese saddle points.
The technique we use here to investigate the structure ofthe multidimensional surface is to employ imaginary waterMows1'8' in the calculated 5-dimensional potential-energy sur-face. For example, we imagine that we stepwise flood, in in-
10
a 0
--5
Saddle Search Strategies Illustrated
100 - £ > 0
Fig. I Maxima (+), minima (-), and saddle points (arrows orcrossed lines) of a two-dimensional function. As dis-cussed in the text it is not possible to obtain a lower-dimensional representation of this surface by "minimiz-ing" with respect to the "additional" a shape-degree offreedom.
tervals of 1 MeV, the second minimum with water. During theflooding process we check at what water level a preselected"exit" grid point that is clearly in the fission valley near scis-sion gets "wet". When this happens, then the water level haspassed the threshold energy level for fission. We can deter-mine the saddle-point energy to desired accuracy by repeatingthe filling procedure with successively smaller stepwise in-creases of the water level. The saddle-point shape can also beobtained from this procedure.
III. Model
Our potential-energy model is the macroscopic-microscopic finite-range liquid-drop model (FRLDM) asdefined in Ref.9) with shape-dependent Wigner and A0 termsas defined in Ref.10) In fission-barrier calculations it isessential to formulate the model so that the energy obtainedfor the configuration of two touching spherical nuclei isthe same whether the energy is calculated as that of a verydeformed compound system or as that of two separate nucleiwith appropriate Coulomb and nuclear interaction energies.By introducing shape dependences for the Wigner and A0
terms in the macroscopic part of the model and implementingother features in the microscopic part, we have assured thatthe model has the required properties. These issues arediscussed in further detail in Refs.10'1" It is not possible toformulate the droplet model satisfactorily in the limit of thetouching configuration; for this reason we use the FRLDMversion in our calculations instead of the FRDM. In Fig. 2 weshow that when appropriate shape dependencies are includedfor the Wigner and A0 terms then we obtain approximatecontinuity at touching: almost the same energy is obtained
- 30 -
JAERI-Conf 2003-017
CD
COCD
O
'!3u.c_o
ICDX
25
20
15
10
5
0
- 5
208Hg 2B6110
Total fusionMacroscopic /
fusion ,'<a>
(a): W, A° shape-dependent | o(b): W, A' shape-independent "
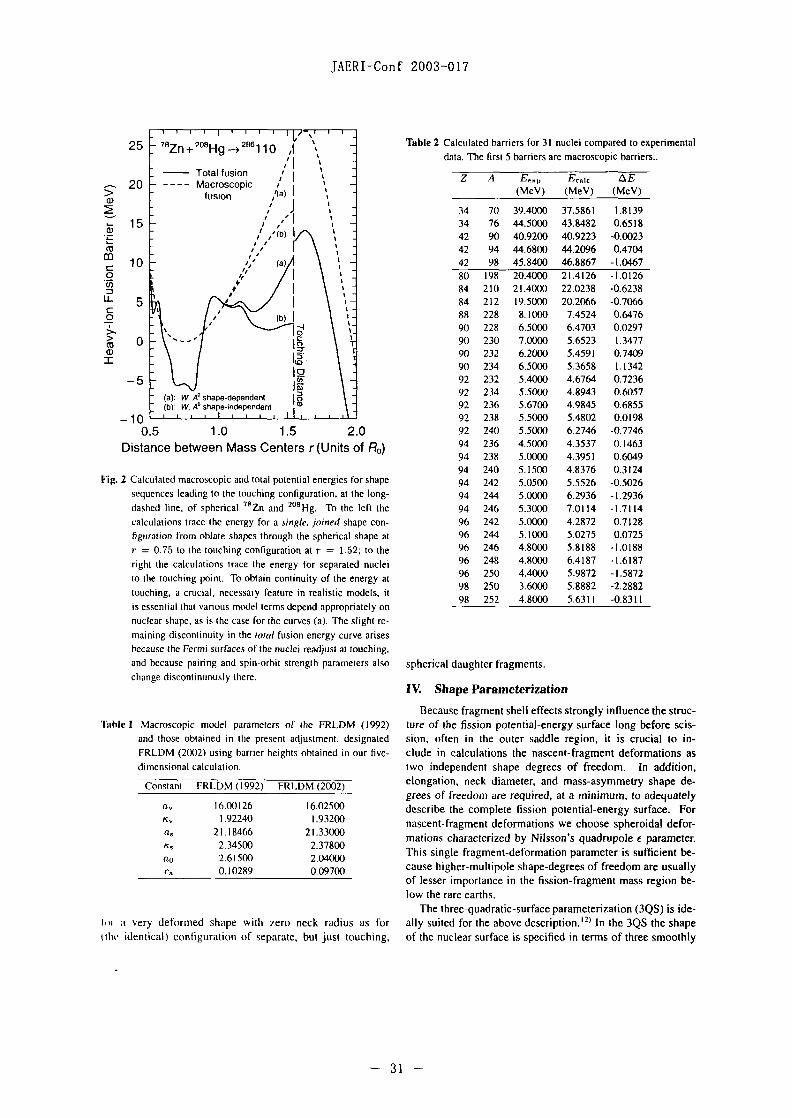
Table 2 Calculated barriers for 31 nuclei compared to experimentaldata. The first 5 barriers are macroscopic barriers..
0.5 1.0 1.5 2.0Distance between Mass Centers r (Units of Ro)
Fig. 2 Calculated macroscopic and total potential energies for shapesequences leading to the touching configuration, at the long-dashed line, of spherical 78Zn and 208Hg. To the left thecalculations trace the energy for a single, joined shape con-figuration from oblate shapes through the spherical shape atr = 0.75 lo the touching configuration at r = 1.52; to theright the calculations trace the energy for separated nucleilo the touching point. To obtain continuity of the energy attouching, a crucial, necessary feature in realistic models, itis essential thai various model terms depend appropriately onnuclear shape, as is the case for the curves (a). The slight re-maining discontinuity in the total fusion energy curve arisesbecause the Fermi surfaces of the nuclei readjust at touching,and because pairing and spin-orbit strength parameters alsochange discontinuously there.
I'sihle 1 Macroscopic model parameters of the FRLDM (1992)and those obtained in ihe present adjustment, designatedFRLDM (2002) using barrier heights obtained in our five-dimensional calculation.
Constant FRLDM (1992) FRLDM (2002)
asK,
ao<?a
16.00126
1.92240
21.18466
2.34500
2.61500
0.10289
16.02500
1.93200
21.33000
2.37800
2.04000
0.09700
Z
34344242428084848890909090929292929294949494949496969696969898
A
7076909498198210212228228230232234232234236238240236238240242244246242244246248250250252
(MeV)
39.4000
44.5000
40.9200
44.6800
45.8400
20.4000
21.4000
19.5000
8.1000
6.5000
7.0000
6.2000
6.5000
5.4000
5.5000
5.6700
5.5000
5.5000
4.5000
5.0000
5.1500
5.0500
5.0000
5.3000
5.0000
5.1000
4.8000
4.8000
4.4000
3.6000
4.8000
(MeV)
37.5861
43.8482
40.9223
44.2096
46.8867
21.4126
22.0238
20.2066
7.4524
6.4703
5.6523
5.4591
5.3658
4.6764
4.8943
4.9845
5.4802
6.2746
4.3537
4.3951
4.8376
5.5526
6.2936
7.0114
4.2872
5.0275
5.8188
6.4187
5.9872
5.8882
5.6311
AE(MeV)
1.8139
0.6518
-0.0023
0.4704
-1.0467
-1.0126
-0.6238
-0.7066
0.6476
0.0297
1.3477
0.7409
1.1342
0.7236
0.6057
0.6855
0.0198
-0.7746
0.1463
0.6049
0.3124
-0.5026
-1.2936
-1.7114
0.7128
0.0725
-1.0188
-1.6187
-1.5872
-2.2882
-0.8311
Im a very deformed shape with zero neck radius as for(tin1 identical) configuration of separate, but jusl touching.
spherical daughter fragments.
IV. Shape Parameterization
Because fragment shell effects strongly influence the struc-ture of Ihe fission potential-energy surface long before scis-sion, often in the outer saddle region, it is crucial to in-clude in calculations the nascent-fragment deformations astwo independent shape degrees of freedom. In addition,elongation, neck diameter, and mass-asymmetry shape de-grees of freedom are required, at a minimum, to adequatelydescribe the complete fission potential-energy surface. Fornascent-fragment deformations we choose spheroidal defor-mations characterized by Nilsson's quadrupole e parameter.This single fragment-deformation parameter is sufficient be-cause higher-multipole shape-degrees of freedom are usuallyof lesser importance in the fission-fragment mass region be-low the rare earths.
The three-quadratic-surface parameterization (3QS) is ide-ally suited for the above description.12' In the 3QS the shapeof the nuclear surface is specified in terms of three smoothly
- 31 -
JAERI-Conf 2003-017
! Essential Fission Shape Coordinates
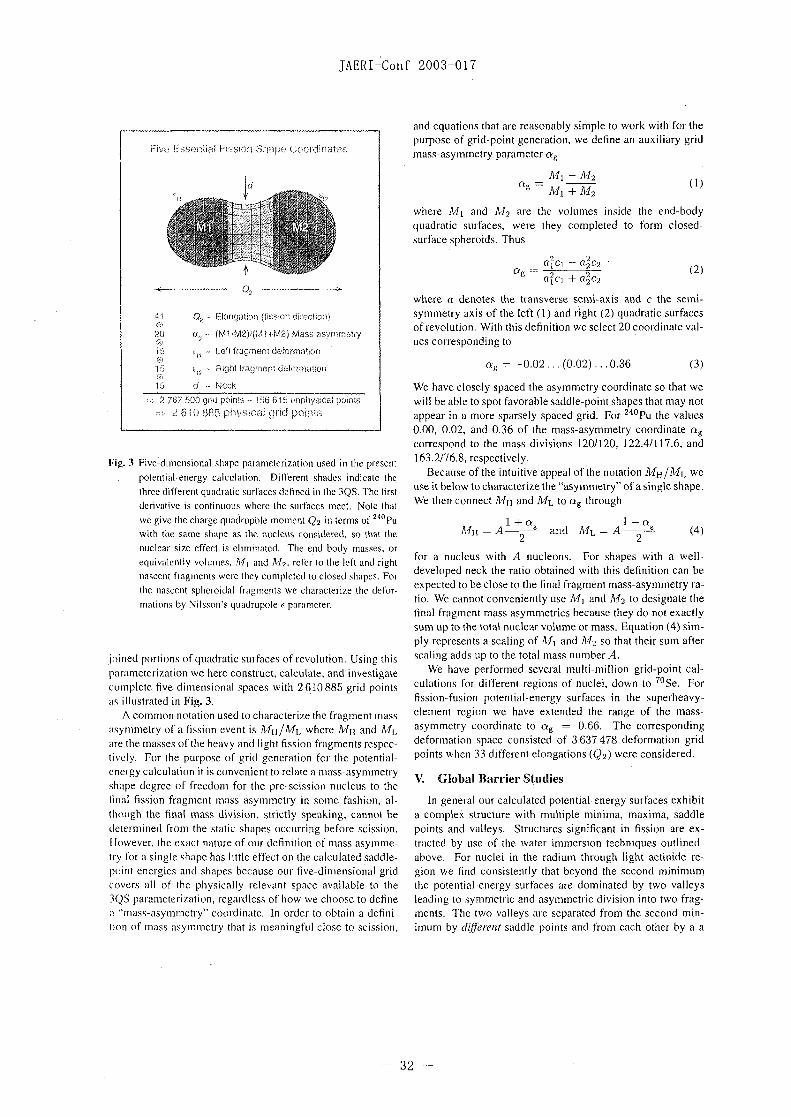
Qf ~ Elongation (fission direction)
a,. - (M1-M2)/(M1+M2) Mass asymmetry
r(1 ~ Left fragment deformation
?,, - Right fragment deformation
15 d - Neck
s 2 787 500 grid points- 156 615 unphysical points-;- 2 610 885 physical grid points
41@20€>1S
15
Fig. 3 Five-dimensional shape parameterization used in the presentpotential-energy calculation. Different shades indicate thethree different quadratic surfaces defined in the 3QS. The firstderivative is continuous where the surfaces meet. Note thatwe give the charge quadrupOle moment Q2 in terms of 240Puwith the same shape as the nucleus considered, so that thenuclear size effect is eliminated. The end body masses, orequivalently volumes, Mi and M2, refer to the left and rightnascent fragments were they completed to closed shapes. Forthe nascent spheroidal fragments we characterize the defor-mations by Nilsson's quadrupole e parameter.
joined portions of quadratic surfaces of revolution. Using thisparameterization we here construct, calculate, and investigatecomplete five-dimensional spaces with 2 610 885 grid pointsas illustrated in Fig. 3.
A common notation used to characterize the fragment massasymmetry of a fission event is M H / M L where A/H and MLare the masses of the heavy and light fission fragments respec-tively. For the purpose of grid generation for the potential-energy calculation it is convenient to relate a mass-asymmetryshape degree of freedom for the pre-scission nucleus to thefinal fission-fragment mass asymmetry in some fashion, al-though the final mass division, strictly speaking, cannot bedetermined from the static shapes occurring before scission.1 lowever, the exact nature of our definition of mass asymme-try for a single shape has little effect on the calculated saddle-point energies and shapes because our five-dimensional gridcovers all of the physically relevant space available to the3QS parameterization, regardless of how we choose to definea "mass-asymmetry" coordinate. In order to obtain a defini-tion of mass asymmetry that is meaningful close to scission,
and equations that are reasonably simple to work with for thepurpose of grid-point generation, we define an auxiliary gridmass-asymmetry parameter ag
Mi - M-2
Mi + M2(1)
where Mi and M2 are the volumes inside the end-bodyquadratic surfaces, were they completed to form closed-surface spheroids. Thus
a\c\ -d\c\
(2)
where a denotes the transverse semi-axis and c the semi-symmetry axis of the left (1) and right (2) quadratic surfacesof revolution. With this definition we select 20 coordinate val-ues corresponding to
a% = - 0 . 02 . . . (0.02)... 0.36 (3)
We have closely spaced the asymmetry coordinate so that wewill be able to spot favorable saddle-point shapes that may notappear in a more sparsely spaced grid. For 240Pu the values0.00, 0.02, and 0.36 of the mass-asymmetry coordinate ag
correspond to the mass divisions 120/120, 122.4/117.6, and163.2/76.8, respectively.
Because of the intuitive appeal of the notation M H / M L weuse it below to characterize the "asymmetry" of a single shape.We then connect M}\ and ML to ag through
M,i = A- and ML = A- (4)
for a nucleus with A nucleons. For shapes with a well-developed neck the ratio obtained with this definition can beexpected to be close to the final fragment mass-asymmetry ra-tio. We cannot conveniently use M\ and Mi to designate thefinal fragment mass asymmetries because they do not exactlysum up to the total nuclear volume or mass. Equation (4) sim-ply represents a scaling of M\ and Mi so that their sum afterscaling adds up to the total mass number A.
We have performed several multi-million grid-point cal-culations for different regions of nuclei, down to 70Se. Forfission-fusion potential-energy surfaces in the superheavy-element region we have extended the range of the mass-asymmetry coordinate to ag = 0.66. The correspondingdeformation space consisted of 3 637478 deformation gridpoints when 33 different elongations (Qi) were considered.
V. Global Barrier Studies
In general our calculated potential-energy surfaces exhibita complex structure with multiple minima, maxima, saddlepoints and valleys. Structures significant in fission are ex-tracted by use of the water immersion techniques outlinedabove. For nuclei in the radium through light actinide re-gion we find consistently that beyond the second minimumthe potential-energy surfaces are dominated by two valleysleading to symmetric and asymmetric division into two frag-ments. The two valleys are separated from the second min-imum by different saddle points and from each other by a a
- 32 -
JAERI-Conf 2003-017
> \
\ Experimental
1 /X
; Calculated
: Discrepancy (Exp- * - • i-
| rms =1.00 MeVin I M M M I I I I M M H M I I M I I I
iii|iimnii|imiui
FRLDM
-Catc.)
l l l l lMMIUf l f f lH I I I
I1"""11!' *
(2002) \
\ \
*<• - i
1IIf 1 [ IM111 r11[11 [f
50
40
30
20
^ 10
i5 50/0X0 40
1 30
I 20iT 10
10/0
0
- 1 00 20 40 60 80 100 120 140 160
Neutron Number N
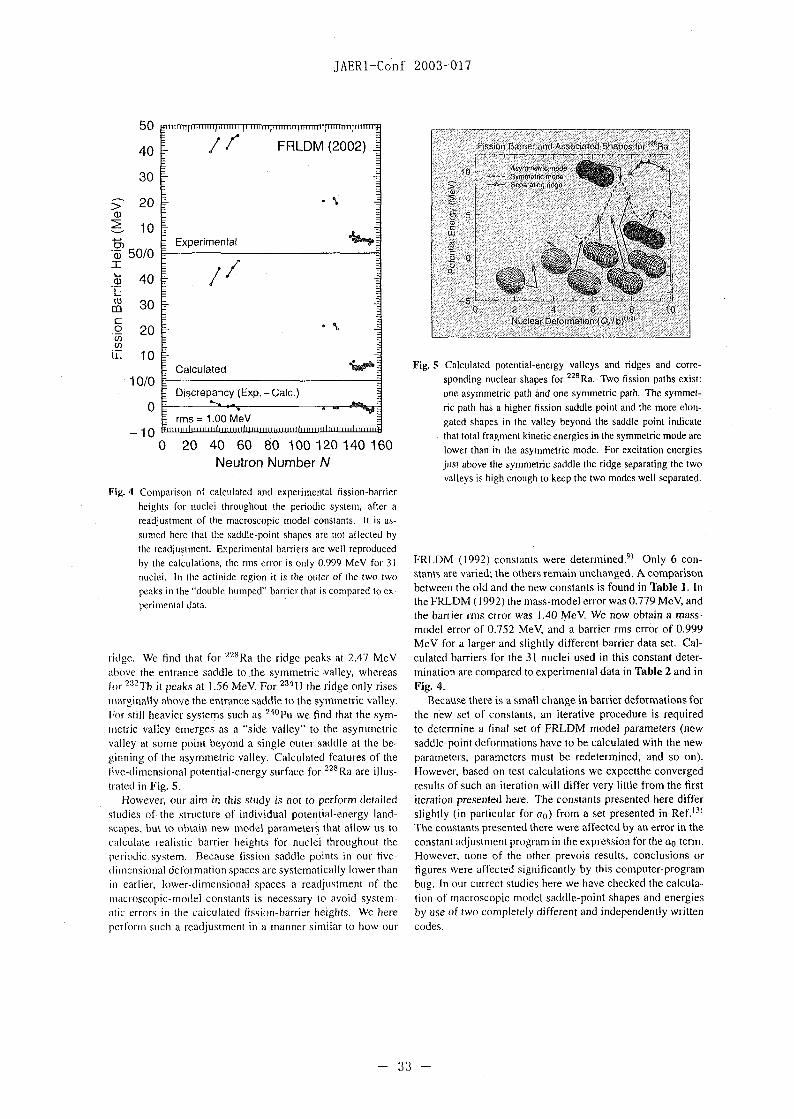
Fig. 4 Comparison of calculated and experimental fission-barrierheights for nuclei throughout the periodic system, after areadjustment of the macroscopic model constants. It is as-sumed here that the saddle-point shapes are not affected bythe readjustment. Experimental barriers are well reproducedby the calculations, the rms error is only 0.999 MeV for 31nuclei. In the actinide region it is the outer of the two twopeaks in the "double-humped" barrier that is compared to ex-perimental data.
ridge. We find that for 228Ra the ridge peaks at 2.47 MeVabove the entrance saddle to the symmetric valley, whereasfor 232Th it peaks at 1.56 MeV. For 234U the ridge only risesmarginally above the entrance saddle to the symmetric valley.Tor still heavier systems such as 240Pu we find that the sym-metric valley emerges as a "side valley" to the asymmetricvalley at some point beyond a single outer saddle at the be-ginning of the asymmetric valley. Calculated features of thefive-dimensional potential-energy surface for 228Ra are illus-trated in Fig. 5.
However, our aim in this study is not to perform detailedstudies of the structure of individual potential-energy land-scapes, but to obtain new model parameters that allow us tocalculate realistic barrier heights for nuclei throughout theperiodic system. Because fission saddle points in our five-dimensional deformation spaces are systematically lower thanin earlier, lower-dimensional spaces a readjustment of themacroscopic-model constants is necessary to avoid system-atic errors in the calculated fission-barrier heights. We hereperform such a readjustment in a manner similar to how our
Fission Barrier and Associated Shapes forJ
0 2 4 6' 8 10Nuclear Detormation (C72/b}!"sl
Fig. 5 Calculated potential-energy valleys and ridges and corre-sponding nuclear shapes for 228Ra. Two fission paths exist:one asymmetric path and one symmetric path. The symmet-ric path has a higher fission saddle point and the more elon-gated shapes in the valley beyond the saddle point indicatethat total fragment kinetic energies in the symmetric mode arelower than in the asymmetric mode. For excitation energiesjust above the symmetric saddle the ridge separating the twovalleys is high enough to keep the two modes well separated.
FRLDM (1992) constants were determined.9' Only 6 con-stants are varied; the others remain unchanged. A comparisonbetween the old and the new constants is found in Table 1. Inthe FRLDM (1992) the mass-model error was 0.779 MeV, andthe barrier rms error was 1.40 MeV. We now obtain a mass-model error of 0.752 MeV, and a barrier rms error of 0.999MeV for a larger and slightly different barrier data set. Cal-culated barriers for the 31 nuclei used in this constant deter-mination are compared to experimental data in Table 2 and inFig. 4.
Because there is a small change in barrier deformations forthe new set of constants, an iterative procedure is requiredto determine a final set of FRLDM model parameters (newsaddle-point deformations have to be calculated with the newparameters, parameters must be redetermined, and so on).However, based on test calculations we expectthe convergedresults of such an iteration will differ very little from the firstiteration presented here. The constants presented here differslightly (in particular for a0) from a set presented in Ref.'3)
The constants presented there were affected by an error in theconstant adjustment program in the expression for the an term.However, none of the other prevois results, conclusions orfigures were affected significantly by this computer-programbug. In our currect studies here we have checked the calcula-tion of macroscopic model saddle-point shapes and energiesby use of two completely different and independently writtencodes.
33 -
JAERI-Conf 2003-017
Potential Energy forS46,-,
Scale 0,20 (MeV)
0.1 0 ? 0 3 0 J OSSpheroidal DcfoTridtion c/
0.6
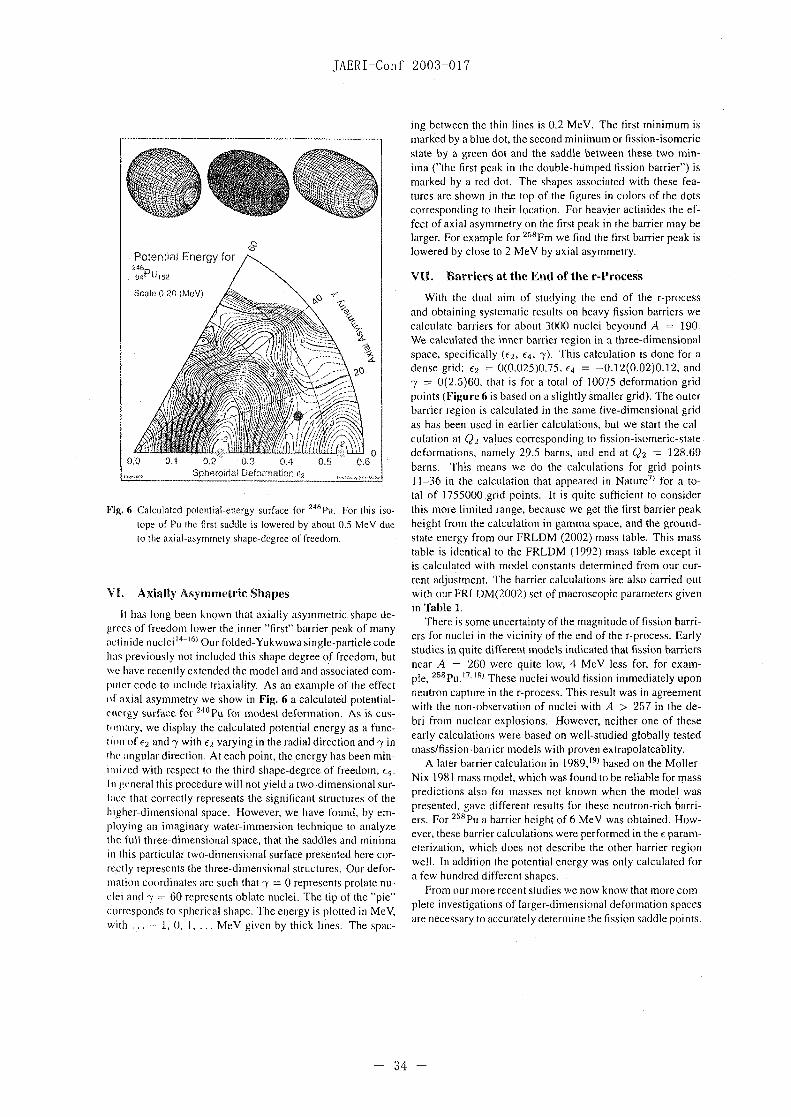
Fig. 6 Calculated potential-energy surface for 246Pu. For this iso-tope of Pu the first saddle is lowered by about 0.5 MeV dueto the axial-asymmety shape-degree of freedom.
VI. Axially Asymmetric Shapes
It has long been known that axially asymmetric shape de-grees of freedom lower the inner "first" barrier peak of manynclinide nuclei I 4 I 6 ) Our folded-Yukwawa single-particle codehas previously not included this shape degree of freedom, butwe have recently extended the model and and associated com-puter code to include triaxiality. As an example of the effect(if axial asymmetry we show in Fig. 6 a calculated potential-energy surface for 2/10Pu for modest deformation. As is cus-tiunary, we display the calculated potential energy as a func-tion of g2 and 7 with €2 varying in the radial direction and 7 intin- angular direction. At each point, the energy has been min-inii/i'd with respect to the third shape-degree of freedom, e4.In general this procedure will not yield a two-dimensional sur-laee that correctly represents the significant structures of thehigher-dimensional space. However, we have found, by em-ploying an imaginary water-immersion technique to analyzethe full three-dimensional space, that the saddles and minimain this particular two-dimensional surface presented here cor-rectly represents the three-dimensional structures. Our defor-mation coordinates are such that 7 = 0 represents prolate nu-clei and 7 — 60 represents oblate nuclei. The tip of the "pie"corresponds to spherical shape. The energy is plotted in MeV,with . . . - 1, 0, I, . . . MeV given by thick lines. The spac-
ing between the thin lines is 0.2 MeV. The first minimum ismarked by a blue dot, the second minimum or fission-isomericstate by a green dot and the saddle between these two min-ima ("the first peak in the double-humped fission barrier") ismarked by a red dot. The shapes associated with these fea-tures are shown in the top of the figures in colors of the dotscorresponding to their location. For heavier actinides the ef-fect of axial asymmetry on the first peak in the barrier may belarger. For example for 258Fm we find the first barrier peak islowered by close to 2 MeV by axial asymmetry.
VII. Barriers at the End of the r-Process
With the dual aim of studying the end of the r-processand obtaining systematic results on heavy fission barriers wecalculate barriers for about 3000 nuclei beyound A ~ 190.We calculated the inner barrier region in a three-dimensionalspace, specifically (e-2, £4, 7). This calculation is done for adense grid: e2 = 0(0.025)0.75, eA = -0.12(0.02)0.12, and7 = 0(2.5)60, that is for a total of 10075 deformation gridpoints (Figure 6 is based on a slightly smaller grid). The outerbarrier region is calculated in the saine (ive-dimensional gridas has been used in earlier calculations, but we start the cal-culation at Q2 values corresponding to fission-isomeric-statedeformations, namely 29.5 barns, and end at Q2 = 128.69barns. This means we do the calculations for grid points11-36 in the calculation that appeared in Nature7' for a to-tal of 1755000 grid points. It is quite sufficient to considerthis more limited range, because we get the first barrier peakheight from the calculation in gamma space, and the ground-state energy from our FRLDM (2002) mass table. This masstable is identical to the FRLDM (1992) mass table except itis calculated with model constants determined from our cur-rent adjustment. The barrier calculations are also carried outwith our FRLDM(2002) set of macroscopic parameters givenin Table 1.
There is some uncertainty of the magnitude of fission barri-ers for nuclei in the vicinity of the end of the r-process. Earlystudies in quite different models indicated that fission barriersnear A = 260 were quite low, 4 MeV less for, for exam-ple, 2SSPu.17'IS) These nuclei would fission immediately uponneutron capture in the r-process. This result was in agreementwith the non-observation of nuclei with A > 257 in the de-bri from nuclear explosions. However, neither one of theseearly calculations were based on well-studied globally testedmass/fission-barrier models with proven extrapolateablity.
A later barrier calculation in 1989,l9) based on the Moller-Nix 198) mass model, which was found to be reliable for masspredictions also for masses not known when the model waspresented, gave different results for these neutron-rich barri-ers. For 258Pu a barrier height of 6 MeV was obtained. How-ever, these barrier calculations were performed in the e param-eterization, which does not describe the other barrier regionwell. In addition the potential energy was only calculated fora few hundred different shapes.
From our more recent studies we now know that more com-plete investigations of larger-dimensional deformation spacesare necessary to accurately determine the fission saddle points.
- 34 -

JAERI-Conf 2003-017
Tolal tusionMacroscopic
fusionTotal fission
J i.._t_ I. .-i...i....i i—:_LJ L _
0:5 1.0 1.5 2.0Distance between Mass Centers r (Units of Ro)
u
- - 50)
Ep-10ajcUJ
"TO - 1 5
3'Sa. -20
• • . : ^ '
: - ^ ' • • ^ "
: V •>.: \
—*— Ridge- - • - - Cold-Fusion Valley—•— Symmetric Valley
, i i i 1
\
X
1
1
278 1 1 2 --
-
\ :
\
\
V :
6 7 8 9Nuclear Deformation Q2"
2 (b1'2)10
Fig. 8 Valleys in ihe calculated 5D poiential-energy surface of thecompound system 2781I2 and the separating rigde. Thetouching configuration of spherical 70Zn with spherical 20RPbcorresponds to Q\/2 = 6.6. See further discussion in thetext.
Fig. 7 Calculated fusion barriers for a cold-fusion reaction leading to278112. The fission barrier for the compound system is alsoshown. The arrow indicates the incident energy correspond-ing to Ihe maximum evaporation-residue.cross section.
This requires that the potential energy is calculated for severalmillion different shapes and can lead to 3 MeV or so lowersaddles for some nuclei relative to calculations in more re-stricted deformation spaces.7'8) In our current calculations weperform the calculations in such large deformations spaces, inthe FRLDM (2002) model with its redetermined parameters.We have do not yet have results for all 3000 nuclei beyondA = 190. However, for 208Pu we calculate that the height ofthe first barrier peak is 4.11 MeV and the height of the secondbarrier peak is 4.30 MeV. Thus, it again seems that the barriersin this region are low enough to end the r-process. In contrastto earlier calculations of fission barriers in this region, thesenew results are the first that are otbained in models that havebeen globally tested both for fission barriers and ground-statemasses. More complete results will be forthcoming.
VIII. 5D Potential-Energy Surfaces for Super-Heavy Elements.
In Fig. 7 we show calculated fusion and fission barriersfor a cold-fusion reaction leading to 278112. In the calculationthe fusion barrier outside touching is calculated for sphericaltarget and projectile. The discontinuity at touching occurs be-cause the Z/N ratio is different in target and pojectile andis assumed to instantaneously adjust to a common ratio aftertouching. Inside touching the fusion barriers are calculated fora prescribed sequence of shapes for which the ends are kept
spherical and the the mass asymmetry between the left andright portions of the system is retained. In contrast the fission-barrier curve is based on mimima and saddle points obtainedin a full five-dimensional calculation with several million gridpoints. The arrow in the figure indicates approximately theenergy chosen in this experiment.20' This energy is substan-tially below the calculated value of the "Coulomb'barrier" be-tween the spherical target and projectile. We will elsewhereargue that we feel that in actual collisions shape polarizationwill considerably lower this static barrier.
We are able to make more detailed studies of the "fu-sion barrier" inside the toching point by analyzing our five-dimensional potential-energy landscapes. For the compoundsystem 27S 112 we find only two valleys of significance in theouter barrier region. For details how the valleys are identifiedand the definition of the elongation coordinate Qi see Ref.7)
In the cold-fusion valley the shapes of the partial fragmentsare almost independent of Q2. We find that M\\ = 206,and ML = 72 and that the spheroidal deformation coordi-nate corresponding to the heavy fragment is en = —0.10 andto the light fragment e^ = 0.35. The touching configura-tion of spherical 208Pb and 70Zn corresponds to Q2 = 43.The fusion valley we see in the five-dimensional calculationis much lower than the fusion barrier corresponding to thefrozen spherical configurations studied in Fig. 8 as would beexpected. A more extensive study of heavy-element fusion isin progress and will be published elsewhere.
IX. Summary
To model fission potential-energy surfaces over a widerange of shapes, and in particular for shapes with small neckswe have to select the FRLDM over the FRDM.7-9' In theFRLDM model we are now able to calculate fission-barrier
~ 35

JAERI-Conf 2003-017
heights from the lightest measured system around A — 70to some of the heaviest known Cf isotopes with an rms errorof only 0.999 MeV. Simultaneously we can in the FRDLMmodel calculate nuclear masses from 16O to the super-heavyregion, with a model error of 0.75 MeV, for a 1989 dataset.3" Because of the proven reliability for regions of newdniii for the mass application of the model, we are now un-dci inking a large-scale study of barriers of 3000 heavy nucleibeyound A = 190. A particular aim of this calculation isto provide barrier input to astrophysical studies of the end ofthe rapid-neutron-capture nucleo-synthesis process in the uni-verse. We are currently also applying the model to studies ofsupcrheavy-ejement formation.
References1) A. Mamdouh, J. M. Pearson, M. Rayet, and F. Tondeur,
Nucl. Phys. A644 (1998) 389.2) B.Hayes, Am. Sci. 88(2000)481.3) S. Aberg, H. Flocard, and W. Nazarewicz, Ann. Rev.
Nucl. Sci. 40(1990)439.4) J. L. Egido, L. M. Robledo, and R. R. Chasman, Phys.
Lett. B393, (1997) 13.5) J. F. Berger, M. Girod, and D. Gogny, Nucl. Phys. AS02
(1989)c85.6) W. D. Myers and W. J. Swiatecki, Nucl. Phys. A601
(1996)141.7) P. Moller, D. G. Madland, A. J. Sierk, and A. Iwamoto,
Nature 409 (2001) 785.8) P. Moller and A. Iwamoto, Phys. Rev. C 6104 (2000)
7602.9) P. Moller, J. R. Nix, W. D. Myers, and W. J. Swiatecki,
Atomic Data Nucl. Data Tables 59 (1995) 185.10) P. Moller, J. R. Nix, and W. J. Swiatecki, Nucl. Phys.
A492 (1989) 349. •11) P. Moller and J. R. Nix, Nucl. Phys. A281 (1977) 354.12) J. R. Nix, Nucl. Phys. A130 (1969) 241.13) Peter Moller, D. G. Madland, A. J. Sierk, and A.
Iwamoto, Proc. International Conference on NuclearData for Science and Technology (ND2001), October7-12, Tsukuba International Congress Center, Tsukuba,Japan , Journal of Nuclear Science and Technology, Sup-plement 2, (2002) p. 703-708, (Los Alamos Preprint LA-UR-01-4851):
14) V. V. Pashkevich, Nucl. Phys. A133 (1969)400.15) S. E. Larsson, S. G. Nilsson, and I. Ragnarsson, Phys.
Lett. 38B( 1972) 269.16) U. Gotz, H. C. Pauli, and K. Junker, Phys. Lett. 39B
(1972)436.17) W. M. Howard and J. R. Nix, Proc. Third IAEA Symp.
on the physics and chemistry of fission, Rochester, 1973,vol. I (IAEA, Vienna, 1974) p. 145.
18) W. M. Howard and P. Moller, Atomic Data Nucl. DataTables 25 (1980) 219.
19) P. Moller, J. R. Nix and W. J. Swiatecki, Proc. 50 Yearswith Nuclear Fission, Gaithersburg, 1989 (American Nu-clear Society, La Grange Park, 1989) p. 153.
20) S. Hofmann, F. P. Hessberger, D. Ackermann, G.
Miinzenberg, S. Antalic, P. Cagarda, B. Kindler, J. Ko-jouharova, M. Leino, B. Lommel, R. Mann, A.G. Popeko,S. Reshitko, S. Saro, J. Uusitalo, A.V. Yeremin, Eur.Phys.J. A. 14, (2002) 147.
21) G. Audi, Midstream atomic mass evaluation, privatecommunication (1989), with four revisions.
- 36 -