286. transgenic plants: 264. protein arrays: 285. cell ... · 286. transgenic plants: methods and...
TRANSCRIPT

METHODS IN MOLECULAR BIOLOC Y™
John M. Walker, SERIES EDITOR
286. Transgenic Plants: Methods and Protocols, 264. Protein Arrays: Methods and Protocols, edited by Leandro Pena, 2004 edited by Eric Fung, 2004
285. Cell Cycle Control and Dysregulation 263. Flow Cytometry, Second Edition, edited by Protocols: Cyclins, Cyclin-Dependent Kinases, Teresa S. Hawley and Robert G. Hawley, 2004 and Other Factors, edited by Antonio Giordano 262. Genetic Recombination Protocols, edited by and Gaetano Romano, 2004 Alan S Waldman, 2004
284. Signal Transduction Protocols, Second Edition, 261. Protein-Protein Interactions: Methods and edited by Robert C. Dickson and Michael D. Applications, edited by Haian Fu, 2004 Mendenhall, 2004 260. Mobile Genetic Elements: Protocols and
283. Biconjugation Protocols, edited by Christof Genomic Applications, edited by Wolfgang J. M. Niemeyer, 2004 Miller and Pierre Copy, 2004
282. Apoptosis Methods and Protocols, edited by 259. Receptor Signal Transduction Protocols, Hugh J. M. Brady, 2004 Second Edition, edited by Gary B. Willars
281. Checkpoint Controls and Cancer, Volume 2: and R. A. John Challiss, 2004 Activation and Regulation Protocols, edited by 258. Gene Expression Profiling: Methods and Axel H. Schonthal, 2004 Protocols, edited by Richard A. Shimkets, 2004
280. Checkpoint Controls and Cancer, Volume 1: 257. mRNA Processing and Metabolism: Methods and Reviews and Model Systems, edited by Axel H. Protocols, edited by Daniel R. Schoenberg, 2004 Schonthal, 2004 256 Bacterial Artifical Chromosomes, Volume 2:
279. Nitric Oxide Protocols, Second Edition, edited Functional Studies, edited by Shaying Zhao by Aviv Hassid, 2004 and Marvin Stodolsky, 2004
278. Protein NMR Techniques, Second Edition, 255. Bacterial Artifical Chromosomes, Volume 1: edited by A. Kristina Downing, 2004 Library Construction, Physical Mapping, and
277. Trinucleotide Repeat Protocols, edited by Sequencing, edited by Shaying Zhao and Yoshinori Kohwi, 2004 Marvin Stodolsky, 2004
276. Capillary Electrophoresis of Proteins and 254. Germ Cell Protocols, Volume 2: Molecular Peptides, edited by Mark A. Strege and Embryo Analysis, Live Imaging, Transgenesis, Avinash L. Lagu, 2004 and Cloning, edited by Heide Schatten, 2004
275. Chemoinformatics, edited by Jttrgen Bajorath, 2004 253. Germ Cell Protocols, Volume 1: Sperm and 274. Photosynthesis Research Protocols, edited by oocyteAnalysis, edited by Heide Schatten, 2004
Robert Carpentier, 2004 252. Ribozymes and siRNA Protocols, Second 273. Platelets and Megakaryocytes, Volume 2: Per- Edition, edited by Mouldy Sioud, 2004
spectives and Techniques, edited by Jonathan 251. HPLC of Peptides and Proteins: Methods and M. Gibbins and Martyn P. Mahaut-Smith, 2004 Protocols, edited by Marie-Isabel Aguilar, 2004
272. Platelets and Megakaryocytes, Volume 1: 250. MAP Kinase Signaling Protocols, edited by Functional Assays, edited by Jonathan M. Rony Seger, 2004 Gibbins and Martyn P. Mahaut-Smith, 2004 249. Cytokine Protocols, edited by Marc De Ley, 2004
271. Β Cell Protocols, edited by Hua Gu and Klaus 248. Antibody Engineering: Methods and Protocols, Rajewsky, 2004 edited by Benny K. C. Lo, 2004
270. Parasite Genomics Protocols, edited by Sara 247. Drosophila Cytogenetics Protocols, edited by E. Melville, 2004 Daryl S. Henderson, 2004
269. Vaccina Virus and Poxvirology: Methods and 246. Gene Delivery to Mammalian Cells: Volume Protocols,edited by Stuart N. Isaacs, 2004 2: Viral Gene Transfer Techniques, edited by
268. Public Health Microbiology: Methods and William C. Reiser, 2004 Protocols, edited by John F. T. Spencer and 245. Gene Delivery to Mammalian Cells: Volume Alicia L. Ragout de Spencer, 2004 1: Nonviral Gene Transfer Techniques, edited
267. Recombinant Gene Expression: Reviews and by William C. Reiser, 2004 Protocols, Second Edition, edited by Paulina 244. Protein Purification Protocols, Second Edi- Balbas and Argelia Johnson, 2004 tion, edited by Paul Cutler, 2004
266. Genomics, Proteomics, and Clinical 243. Chiral Separations: Methods and Protocols, Bacteriology: Methods and Reviews, edited by edited by Gerald Giibitz and Martin G. Schmid, 2004 Neil Woodford and Alan Johnson, 2004 242. Atomic Force Microscopy: Biomedical
265. RNA Interference, Editing, and Methods and Applications, edited by Pier Modification: Methods and Protocols, edited Carlo Braga and Davide Ricci, 2004 by Jonatha M. Gott, 2004
Mobile Genetic Elements
Protocols and Genomic Applications Edited
by
Wolfgang J. Miller
AG General Genetics, Institute of Medical Biology, University of Vienna, Vienna, Austria
and
Pierre Capy
Laboratoire Populations, Genetique et Evolution, CNRS, Gif-sur-Yvette, France
HUMANA PRESS TOTOWA, NEW JERSEY

© 2004 Humana Press Inc. 999 Riverview Drive, Suite 208 Totowa, New Jersey 07512 humanapress.com All rights reserved. No part of this book may be reproduced, stored in a retrieval system, or transmitted in any form or by any means, electronic, mechanical, photocopying, microfilming, recording, or otherwise without written permission from the Publisher. Methods in Molecular Biology™ is a trademark of The Humana Press Inc. All papers, comments, opinions, conclusions, or recommendatoins are those of the author(s), and do not necessarily reflect the views of the publisher.
This publication is printed on acid-free paper. CS5 ANSI Z39.48-1984 (American Standards Institute) Permanence of Paper for Printed Library Materials. Cover illustration: See Fig. 1 from Chapter 2, "Detection of Transposable Elements in Drosophila Salivary Gland Polytene Chromosomes by In Situ Hybridization," by Christian Biemont, Laurence Monti-Dedieu, and Francoise Lemeunier. Production Editor: Wendy S. Kopf. Cover design by Patricia F. Cleary. For additional copies, pricing for bulk purchases, and/or information about other Humana titles, contact Humana at the above address or at any of the following numbers: Tel.: 973-256-1699; Fax: 973-256-8341; E-mail: [email protected]; or visit our Website: www.humanapress.com Photocopy Authorization Policy: Authorization to photocopy items for internal or personal use, or the internal or personal use of specific clients, is granted by Humana Press Inc., provided that the base fee of US $25.00 per copy is paid directly to the Copyright Clearance Center at 222 Rosewood Drive, Danvers, MA 01923. For those organizations that have been granted a photocopy license from the CCC, a separate system of payment has been arranged and is acceptable to Humana Press Inc. The fee code for users of the Transactional Reporting Service is: [1-58829-007-7/04 $25.00 ].
Library of Congress Cataloging-in-Publication Data e-ISBN: 1-592259-755-6 Mobile genetic elements : protocols and genomic applications / edited by Wolfgang J. Miller and Pierre Capy.
p. ; cm. - (Methods in molecular biology ; 260) Includes bibliographical references and index. ISBN 1-58829-007-7 (alk. paper) ISSN: 1064-3745 1. Mobile genetic elements-Laboratory manuals. [DNLM: 1. Interspersed Repetitive Sequences-Laboratory Manuals. 2.
Genomics—methods—Laboratory Manuals. 3. Molecular Biology—methods—Laboratory Manuals. 4. Sequence Analysis-methods-Laboratory Manuals. QU 25 M687 2004] I. Miller, Wolfgang J. II. Capy, Pierre. III. Methods in molecular biology (Totowa, N.J.) ; v. 260. QH452.3.M645 2004 572.8'6-dc22
2003018232
Preface
Mobile Genetic Elements: Protocols and Genomic Applications brings together a wide array of transposon-based protocols and stategies for studying genome structure, function, and evolution into a highly practical, single-source volume. Such transposable element (TE)-derived techniques have been applied success-fully for a variety of purposes ranging from mutagenesis, gene silencing, transgenesis, and their use as polymorphic marker systems. To our knowledge no such synthesis has been presented before.
Chapters 2-A provide a series of DNA hybridization techniques for analyz-ing the distribution and dynamics of mobile DNAs at the hosts' genomic level. With the current revolution in genomics and the availability of complete genome sequences, computational analyses provide an extremely powerful tool for iso-lating and investigating TEs at the in silico level (Chapter 5). For the analyses of transpositional mechanisms at the biochemical level Chapter 6 provides a detailed protocol for LTR retrotransposons in heterologous host systems. Chap-ters 7-10 are focused on TE-based mutagenesis protocols for studying gene functions in a broad range of organisms. Based on their ubiquitous nature and their activity in creating genomic diversity by integrating novel DNA segments into genomes, TEs provide highly informative sets of polymorphic markers (Chapters 11-13). Finally, the last two chapters are dedicated to their technical applications during transgenesis in arthropods and vertebrates.
We hope that Mobile Genetic Elements: Protocols and Genomic Applica-tions will appeal to those scientists and students intending to use transposable elements as genetic tools for dissecting the function of a specific gene and elaborating on the mechanisms leading to genetic change and diversity, as well as to those studying the evolutionary impact of mobile DNA on the biology and evolution of organisms.
Wolfgang J. Miller Pierre Capy

x Contents
13 Retroposon Mapping in Molecular Systematics Norihiro Okada, Andrew M. Shedlock, and Masato Nikaido ........... 189
14 Transformation Systems in Insects David A. O'Brochta and Peter W. Atkinson....................................... 227
15 Transposable Elements for Transgenesis and Insertional Mutagenesis in Vertebrates: A Contemporary Review of Experimental Strategies
Zoltan Ivies and Zsuzsanna Izsvak...................................................... 255 Index............................................................................... ………………………..277
Contributors
PETER W. ATKINSON · Entomology Department, University of California, Riverside, CA ANDREAS BACHMAIR · Max Planck Institute for Plant
Breeding Research, Cologne, Germany CHRISTIAN BIEMONT · Biometrie et Biologic
Evolutive, Universite Lyon 1, Lyon, France NATHAN J. BOWEN · Section on Eukaryotic
Transposable Elements, National Institute of Child Health and Human Development, National Institutes of Health, Bethesda, MD PIERRE CAPY ·
Laboratoire Populations, Genetique et Evolution, CNRS, Gifsur Yvette, France ALEXANDRA M. CASA · Institute for Genomic
Diversity and Department of Plant Breeding, Cornell University, Ithaca, NY PATRIZIO
DIMITRI · Dipartimento di Genetica e Biologia Molecolare, Universita "La Sapienza", Roma, Italy Τ. Η. NOEL ELLIS · Department of
Crop Genetics, The John Innes Centre, Colney Lane, Norwich, UK ANDREW J. FLAVELL · Plant Research
Unit, The University of Dundee at SCRI, Dundee, Scotland, UK
KARIN CAREER · Institutfur Botanik, Universitat Wien, Vienna, Austria TOM GERATS · Department of Experimental Botany, Plant Genetics, University
of Nijmegen, The Netherlands GREGORY B. GLOOR · Department of Biochemistry, The University of Western
Ontario, London, Ontario, Canada IGOR Y. GORYSHIN · Department of Biochemistry, University of Wisconsin,
Madison, WI HIROHIKO HIROCHIKA · Department of Molecular Genetics, National Institute
of Agrobiological Resources, Tsukuba, Ibaraki, Japan ZOLTAN Ivies · Max Delbriick Center for Molecular Medicine, Berlin, Germany ZSUZSANNA IZSVAK · Max Delbriick Center for Molecular Medicine, Berlin,
Germany JERRY J. JENDRISAK · Epicentre Technologies, Madison, WI I. KING JORDAN · National Center for Biotechnology Information, National
Library of Medicine, National Institutes of Health, Bethesda, MD NIKOLAJ JUNAKOVIC · Istituto di Biologia e Patologia Molecolari CNR,
Universita "La Sapienza", Roma, Italy
XI
xii Contributors
TETSUJI KAKUTANI · National Institute of Genetics, Mishima, Shizuoka, Japan Francoise LEMEUNIER · Laboratoire Populations, Genetique et Evolution,
Centre National de la Recherche Scientifique, Gif-sur-Yvette Cedex, France WOLFGANG J. MILLER · AG General Genetics, Institute of Medical Biology,
University of Vienna, Vienna, Austria MARY K. MONTGOMERY · Biology Department, Macalester College, St. Paul, MN LAURENCE MONONTI-DEDIEU · Laboratoire Populations, Genetique et Evolution,
Centre National de la Recherche Scientifique, Gif-sur-Yvette Cedex, France ALEXANDER NAGEL · Department of Botany, University of Georgia, Athens, GA MASATO NIKAIDO · Faculty of Bioscience and Biotechnology, Tokyo Institute
of Technology, Nagatsuta-cho, Yokohama 4259, Kanagawa, Japan DAVID O'BROCHTA · Center for Agricultural Biotechnology, University
of Maryland, Biotechnology Institute, MD NORIHIRO OKADA · Faculty ofBioscience and Biotechnology, Tokyo Institute
of Technology, Yokohama, Japan WILLIAM S. REZNIKOFF · Department of Biochemistry, University of Wisconsin,
Madison, WI ALAN H. SCHULMAN · MTT/BI Plant Genomics Laboratory, Institute
of Biotechnology, University of Helsinki, Helsinki, Finland and MTT Agrifood Research, Plant Production Research, Jokioinen, Finland
ANDREW M. SHEDLOCK 'Department of Zoology, University of Washington, Seattle, WA KAZUHIKO SUGIMOTO · Department of Molecular Genetics,
National Institute of Agrobiological Resources, Tsukuba, Ibaraki, Japan SHIN TAKEDA ·
Department of Molecular Genetics, National Institute of Agrobiological Resources, Tsukuba, Ibaraki, Japan MICHIEL
VANDENBUSSCHE · Department of Plant Systems Biology, Gent University, Gent, Belgium SUSAN R. WESSLER · Department of Botany,
University of Georgia, Athens, GA
1
Mobile Genetic Elements as Natural Tools for Genome Evolution
Wolfgang J. Miller and Pierre Capy
Summary Transposable elements (TEs) are ubiquitous components of all living organisms, and in the
course of their coexistence with their respective host genomes, these parasitic DNAs have played important roles in the evolution of complex genetic networks. The interaction between mobile DNAs and their host genomes are quite diverse, ranging from modifications of gene structure and regulation to alterations in general genome architecture. Thus over evolutionary time these elements can be regarded as natural molecular tools in shaping the organization, structure, and function of eukaryotic genes and genomes. Based on their intrinsic properties and features, mobile DNAs are widely applied at present as a technical "toolbox," essential for studying a diverse spectrum of biological questions. In this chapter we aim to review both the evolutionary impact of TEs on genome evolution and their valuable and diverse methodologi-cal applications as the molecular tools presented in this book.
Key Words: Transposable elements; selfish DNAs; genome evolution; neogene formation; heterochromatin; stress induction; molecular tools.
1. Introduction Many organisms contain far more repetitive DNA sequences than single-
copy sequences. Repetitive sequences include mobile genetic DNAs that are universal components of all living genomes. Transposable elements (TEs) are gene-sized segments of DNA with the special ability to move between differ-ent chromosomal locations in their hosts' genome. Today the genomes of vir-tually all eukaryotic and prokaryotic species are known to contain significant numbers of TEs.
1.1. Occurrence and Classification
In some bacterial species, up to 10% of the genome is composed of insertion sequences (IS elements), while in eukaryotes these elements can make up more
From: Methods in Molecular Biology, vol. 260: Mobile Genetic Elements Edited by: W. J. Miller and P. Capy © Humana Press Inc., Totowa, NJ
1

144 Montgomery
39. Subramaniam, K. and Seydoux, G. (1999) nos-1 and nos-2, two genes related to Drosophila nanos, regulate primordial germ cell development and survival in Caenorhabditis elegans. Development 126,4861-4871.
40. Parrish, S., Fleenor, J., Xu, S., Mellow, C., and Fire, A. (2000) Functional anatomy of a dsRNA trigger: differential requirements for the two trigger strands in RNA interference. Molec. Cell 6, 1077-1087.
11
The Application of LTR Retrotransposons as Molecular Markers in Plants
Alan H. Schulman, Andrew J. Flavell, and Τ. Η. Noel Ellis
Summary Retrotransposons are major, dispersed components of most eukaryotic genomes. They rep-
licate by a cycle of transcription, reverse transcription, and integration of new copies, without excising from the genome in the process. Because they represent a major share of the genome, cause easily detectable genetic changes having known ancestral and derived states, and contain conserved regions for which polymerase chain reaction (PCR) primers may be designed, retrotransposon insertions can be exploited as powerful molecular marker systems. Here, we describe the background and strategies, as well as give detailed laboratory protocols, for four key retrotransposon-based methods: SSAP, IRAP, REMAP, and RBIP. The SSAP, TRAP, and REMAP methods are multiplex and generate anonymous marker bands; RBIP scores individual loci, much as microsatellite-based marker systems do. The methods are variously suited to marker detection on agarose and polyacrylamide slab gels, slab and capillary sequencing devices, and arrays on solid supports. The different strengths and weaknesses of these approaches and their performance relative to conventional marker methods are discussed, together with their applicability to marker-assisted breeding, phylogenetic analyses, biodiversity determinations, and evolutionary studies.
Key Words: Retrotransposon; molecular marker; biodiversity; marker-assisted breeding; molecular evolution; genetic fingerprinting; pedigree analysis; polymorphism detection; trans-posable element.
1. Introduction Markers, entities which are heritable as simple Mendelian traits and are easy
to score, have long been important in studies of inheritance and variability, in the construction of linkage maps, and in the diagnosis of individuals or lines carry-ing certain linked genes. Phenotypic and biochemical (enzyme) markers tend to have the disadvantages of a low degree of polymorphism, limiting their abil-% to be mapped in crosses; relatively few loci, limiting the density of maps
From: Methods in Molecular Biology, vol. 260: Mobile Genetic Elements Edited by: W. J. Miller and P. Capy © Humana Press Inc., Totowa, NJ
145

146 Schulman, Flavell, and Ellis
which can be produced; and environmentally variable expression, complicat-ing scoring and the determination of genotype. These marker types have been superceded by DNA-based methods that generate "fingerprints" or "molecular markers," distinctive patterns of DNA fragments resolved by electrophoresis in agarose or acrylamide gels and detected by staining or labeling. A molecular marker is in essence a nucleotide sequence corresponding to a particular physi-cal location in the genome. Its sequence needs to be polymorphic enough to allow its pattern of inheritance to be easily followed.
1.1. Molecular Markers
Restriction fragment length polymorphism (RFLP) was the first DNA-based molecular marker technique and was an outgrowth of the development of gene cloning and filter hybridization methods in the 1970s. The polymorphisms it exploits are the presence or absence of restriction sites in genomic sequences for which a cloned hybridization probe exists. Originally, RFLP analysis required Southern blotting and hybridization (7). The RFLP method is still used to generate widely shared "anchor" markers, which are those used by many researchers to combine segregation data from different experiments onto recombinational maps, although it suffers from laboriousness as well as from a paucity of alleles and loci. The advent of the polymerase chain reaction (PCR) made possible the detection of variation in randomly amplified polymorphic DNAs (RAPDs) (2). The RAPDs are indeed rapid, being independent of the need for sequence data, but they suffer from low polymorphism information content (PIC), poor correlation with other marker data, and problems in repro-ducibility resulting from the low annealing temperatures in the reactions.
Around 1990, methods that detect variability in the number of simple sequence repeats (SSRs) in microsatellites (3), or that measure variability in the occurrence of two microsatellites close to one another (4), were developed for plants. In the mid-1990s, the amplified fragment length polymorphism method (AFLP®) was introduced. The AFLP approach is a conceptual hybrid between RFLP and the PCR methods because, whereas the method is PCR-based, its polymorphism is derived from variations in restriction site occur-rence or digestibility (5).
The polymorphism detected by the foregoing methods for generating molecular markers are primarily those of small sequence variations. The RFLP and AFLP methods detect polymorphisms in restriction sites, typically corn-prising 4 to 6 bp. Although insertions or deletions within a restriction fragment would also generate an RFLP or AFLP polymorphism, the resolution limits of gel electrophoresis restricts insertions that can be scored to several kilobases in length. Polymorphisms in RAPDs primarily affect the ability of the 9 or 10 nt primers to anneal efficiently under the reaction conditions of particular experi-
LTR Retrotransposon Marker Systems 147
ments. Microsatellite alleles are generated by the gain or loss of repeat units of only a few base pairs. These changes are, furthermore, bidirectional in the sense that further mutations can restore a restriction site or primer binding site. This bidirectionality reduces the usefulness of these marker systems in resolving phytogenies and pedigrees.
An ideal molecular marker technique would exploit large physical changes in a genome to visualize genetic diversity. The loci scored by the method should be spread throughout the genome at high frequency, enabling dense and well-distributed recombinational maps to be generated. Such a method should be universal in its application, with low investment required for marker develop-ment in any particular species. Generation of the marker pattern should be robust and reproducible, and detection should be inexpensive and technically straightforward. Retrotransposons, described below, meet many of these requirements and have been recently developed as molecular marker systems. After providing an introduction to retrotransposons as biological phenomena, the main marker techniques currently applied to retrotransposons will be described in detail.
1.2. LTR Retrotransposons
Retrotransposons are an abundant class of mobile genetic elements (6). They have little in common with the Class II transposable elements, which are DNA transposons such as Ac, En/Spm, or Mutator, or with MITEs such as Stow-away. Unlike the DNA transposons, the retrotransposons do not excise as a concomitant part of their invasion of new loci in the genome, but instead enter new loci as copies of the mother element, which remains fixed in the genome. Retrotransposons fall into two clearly separated groups: the long terminal repeat (LTR)-containing elements (7,8); those lacking LTRs, the long inter-spersed elements (LINEs); and short interspersed elements (SINEs) (9).
Retrotransposons share many similarities with the retroviruses in their orga-nization, in the gene products they encode, and in the steps of their life cycles. Both retrotransposons (6) and retroviruses (10) propagate through cycles of successive transcription, reverse transcription, and genomic integration. Their extensive similarities suggest that present-day retrotransposons and retro-viruses are derived from a common ancestor (11,12). The extant retroviruses can be distinguished by their possession of an envelope (env) domain encoding a glycoprotein necessary for infective passage from cell to cell through the P'asma membrane. The related defective elements in humans are called human endogenous retroviruses (HERVs) rather than retrotransposons (13). Among the LTR retrotransposons (Fig. 1), the gypsy-like group is most similar in sequence and organization to retroviruses, whereas the copia-like elements share the same coding domains but in a different linear order. The gypsy family

Fig. 1. Organization of LTR retrotransposons. The elements can be classified into two major groups, the copia-like and the gypsy-like elements, named after the type members of Drosophila melanogaster. The elements are flanked by 5-bp direct repeats in the host DNA (hatched arrows), formed by the integration of the element. The retrotransposons consist of two LTRs that contain short inverted repeats at their edges (dark triangles) and that bound the internal domain. Adjacent to the 5' and 3' LTRs are the primer binding site (PBS) and the polypurine tract (PPT), which respectively are responsible for priming the synthesis of the (-)-strand and (+)-strand of the cDNA. The protein coding domain is generally synthesized as a polyprotein, and it contains the Gag domain, which encodes the protein forming the capsid of the virus-like particle; the aspartic proteinase (AP), which cleaves the polyprotein into functional units; the integrase (IN), which inserts the cDNA copy into the genome; and the reverse transcriptase (RT) and RNase Η (RH), which synthesize the cDNA from the RNA transcript. The Gag protein may be expressed in some elements in a different reading frame, and it is shown shifted upwards to reflect this. Gypsy-like elements differ from copia-like elements in the position of the IN domain. Some retrotransposons may contain, as do retroviruses, an envelope (ENV) domain gener-ally expressed in a separate reading frame. The figure is not drawn to scale.
of elements from Drosophila melanogaster is in fact transitional between retroviruses and retrotransposons and can be infective under experimental conditions (14).
1.3. Retrotransposons and the Genome
Retrotransposon transcripts each have the formal potential to be reintegrated into the genome as cDNA copies, which can then serve as further sources of transcripts. The newly integrated retrotransposon copies can be inherited if they are present in cells ultimately giving rise to gametes. In view of the many somatic cell divisions that take place prior to the differentiation of germ cells in plants, it is not totally surprising that retrotransposons have succeeded in becoming major genomic components. In plants with large genomes, retrotrans-posons are the major class of repetitive DNA and can comprise 40-60% of the
LTR Retrotransposon Marker Systems 149 148 Schulman, Flavell, and Ellis
Copia group genome as a whole (15-17). The major families of retrotransposons are, with a few exceptions, dispersed throughout the chromosomes in the plant species examined (18-20). In some cases, retrotransposon copy number increases appear to have been a major factor in genome size growth in the plants (21,22). Not only are retrotransposons highly prevalent within the genomes of plants, but also both copia-like (23,24) and gypsy-like (25) retrotransposons are ubiq-uitous throughout the plant kingdom.
Gypsy group
1.4. Retrotransposons as Molecular Markers
The ubiquitous nature of retrotransposons and their activity in creating genomic diversity by stably integrating large DNA segments into dispersed chromosomal loci make these elements ideal for development as molecular markers. Integration sites shared between germplasm accessions are highly likely to have been present in their last common ancestor. Therefore, retro-transposon insertional polymorphisms can help establish pedigrees and phy-logenies (26,27) as well as serve as biodiversity indicators.
In recent years, several molecular marker methods based on retrotransposons have been developed (28) and they are presented in detail below (Fig. 2). All rely on the principle that a joint is formed, during retrotransposon integra-tion, between genomic DNA and the retrotransposon. These joints may be detected by amplification between a primer corresponding to the retro-transposon and a primer matching a nearby motif in the genome. The methods have been named according to the particular motif that provides the second priming site. The Sequence-Specific Amplified Polymorphism (SSAP) method (Figs. 2A and 3), the first retrotransposon-based method to be described, amplifies products between a retrotransposon integration site and a restriction site to which an adapter has been ligated. In Inter-Retrotransposon Amplified Polymorphism (IRAP) (see Figs. 2B and 4), segments between two nearby retrotransposons or LTRs are amplified. The Retrotransposon-Microsatellite Amplified Polymorphism (REMAP) (see Figs. 2C and 5) technique detects retrotransposons integrated near a microsatellite or stretch of SSRs. The Retro-transposon-Based Insertional Polymorphism (RBIP) (see Figs. 2D and 6) marker system, in contrast to the others, detects a given locus in both alterna-tive states, namely, empty and occupied by a retrotransposon, by using both flanking primers and a retrotransposon primer.
Although these methods are presented here as examples with primers spe-cific to a particular family of retrotransposons, it is important to note that retrotransposon marker methods are generic. Any organism in which retro-transposons are dispersed components of the genome, and in which they have been active over a timescale relevant to the question being asked, can be exam-ined with retrotransposon markers. A couple of direct comparisons of

LTR Retrotransposon Marker Systems 15 /
Fig. 2. Marker methods based on LTR Retrotransposons. (A) Sequence-specific amplified polymorphism (SSAP). The DNA template is digested by two restriction enzymes (R1, R2), an adapter ligated (stippled box), and fragments sharing both a retrotransposon region and restriction site Rl amplified by PCR with adapter primers (PA) and retrotransposon primers (PT). (B) Inter-retrotransposon amplified polymor-phism (IRAP). Regions of the genome flanked by two retrotransposons are amplified by PCR using either two identical or two different retrotransposon primers (PT)· (C) Retrotransposon-microsatellite amplified polymorphism (REMAP). Regions of the genome flanked by a microsatellite domain (left) and a retrotransposon are amplified by PCR using primers containing simple sequence repeats with 3' anchor nucleotides (PM) and retrotransposon primers (PT). (D) Retrotransposon-based inser-tional polymorphism (RBIP). Individual sites that are polymorphic for retrotransposon insertion can be detected by PCR in both allelic states, full (left) and empty (right). To detect the presence of the retrotransposon, primers specific to the host DNA on one side of the integrated element (PH1) are used together with a retrotransposon primer (PT). To detect the empty site, primers to the two host flanks are combined (PH1, PH2)·
150
Fig. 3. SSAP Analysis. The figure shows an autoradiograph of a sequencing gel resolving SSAP products. Products were generated from a set of Pisum accessions (lanes) using a 33P-labeled PCR primer specific to the PPT of the Pisum retro-transposon ΡDR1 and a primer, with selective bases TT, matching a Taq I restriction site adapter. The first set of lanes are P. sativum accessions, the set labeled fulvum are P. fulvum, and the set labeled abyssinicum, P. abyssinicum. The other lanes contain accessions of various Pisum species. From ref. 34 with permission.
retrotransposon marker methods with AFLP indicate that the retrotransposon markers are some 25% more polymorphic (29,30). In principle, retrotrans-poson-based or retrovirus-based molecular markers could prove highly useful in animals, including mammals and birds.
1·5. Sequence-Specific Amplified Polymorphism (SSAP) Sequence-specific amplified polymorphism (SSAP) was described by
Waugh and coworkers in 1997 (30), but it has several origins and embodi-ments (31-34). The SSAP method can be considered to be a modification of AFLP (5), or as a variant of anchored PCR (32). The method described by

152 Schulman, Flavell, and Ellis LTR Retrotransposon Marker Systems 153
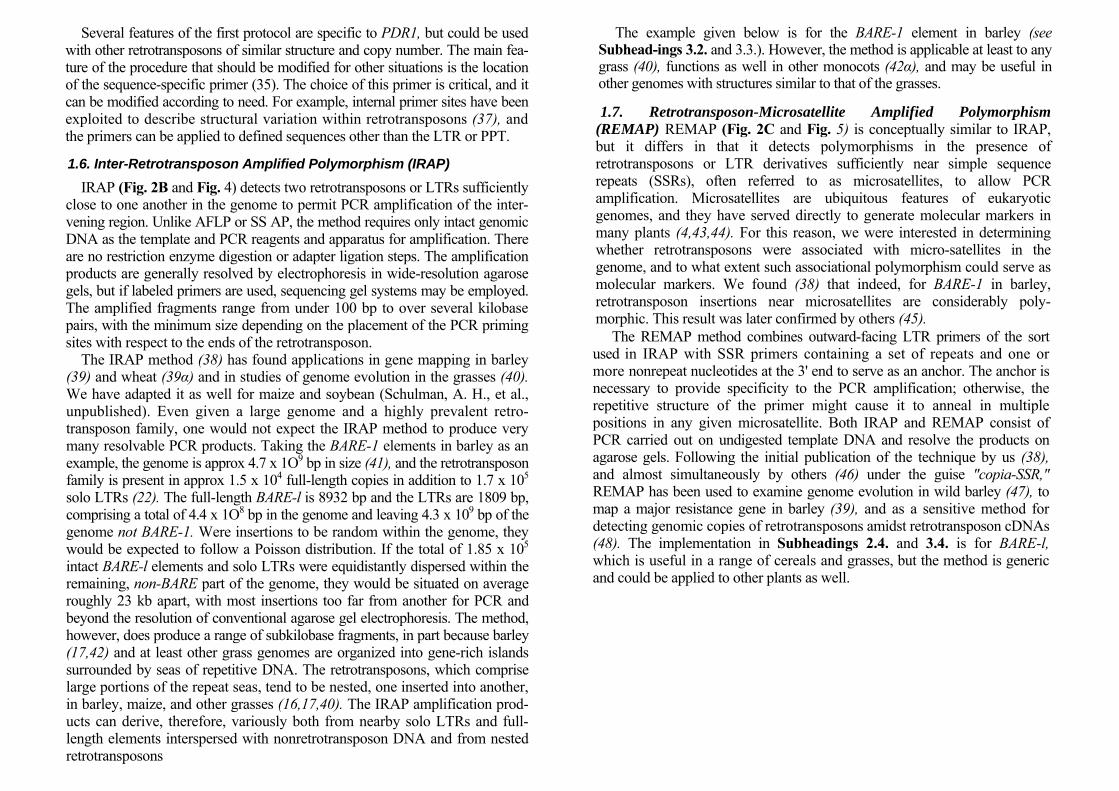
Fig. 4. IRAP analysis. IRAP amplification products from various cereals using
BARE-l primers is displayed. The gel has been ethidium bromide-stained, and the fluorescence detected with UV light; a negative image is shown. This example shows that even heterologous primers can produce useful IRAP amplification. The samples represented are: bread wheat (Triticum aestivum) var. Tjalve (lane 1), bread wheat var. Mahti (lane 2), durum wheat (T. durum) (lane 3), Aegilops tauschii line 1691 (lane 4), A. tauschii line 1704 (lane 5), rye (Secale cereale) line P105 (lane 6), rye line P87 (lane 7), oat var. (Avena saliva) Veli (lane 8), rice var. (Oryza sativa) IRRI52886 (lane 9), timothy (Phleum pratense) line 22 (lane 10), timothy line 16 (lane 11), Spartina maritima (lane 12), S. alterniflora (lane 13), Leymus arenarius (lane 14), Leymus mollis (Lane 15). Marker sizes in kb are indicated on the left axis. From ref. 40 with permission.
Waugh and colleagues (30) has many similarities to AFLP, especially in that two different enzymes are used to generate the template for the specific primer PCR, and in that selective bases are used in the adapter primer.
Two implementations of SSAP (Fig. 2A) are described below. The first (Fig. 3) was designed for use with a retrotransposon found in relatively few copies
Fig. 5. REMAP analysis. A gel is shown of REMAP amplification products from Hordeum spontaneum using BARE-1 primers. The 26 genotypes shown (gel lanes) can be distinguished by their BARE-1 insertion patterns. The REMAP system is useful for such population studies as well as for cultivar distinction. The banding pattern has been detected as in Fig. 4. Size markers in bp derive from a bacteriophage λ Pstl digest. From ref. 47 with permission.
(see Subheadings 2.1. and 3.1.). In this procedure it is important to maximize the sequence complexity of the template for the specific primer amplification, so a single enzyme digestion is used (34). As with the method described for BARE-l (30), the adapter primer is selective. This is a matter of convenience, and nonselective primers could be substituted when the enzyme used for diges-tion has a larger recognition sequence, or when the copy number is lower. In general, LTR ends are convenient for the design of SSAP primers (35). However, in the case of PDR1, the LTR is exceptionally short at 156 bp (36), so a GC-rich primer could be designed corresponding to the polypurine tract (PPT) which is found internal to the 3' LTR in retrotransposons. The second implementation is for BARE-1 in barley (see Subheadings 2.2. and 3.2.), based on the published method (30). For BARE-1 and other high-copy-number fami-lies, the number of selective bases may be increased compared to the first ver-sion of the protocol. Furthermore, BARE-l and most other retrotransposons have long LTRs, necessitating an anchor primer in the LTR near to the external terminus.
Several features of the first protocol are specific to PDR1, but could be used with other retrotransposons of similar structure and copy number. The main fea-ture of the procedure that should be modified for other situations is the location of the sequence-specific primer (35). The choice of this primer is critical, and it can be modified according to need. For example, internal primer sites have been exploited to describe structural variation within retrotransposons (37), and the primers can be applied to defined sequences other than the LTR or PPT.
1.6. Inter-Retrotransposon Amplified Polymorphism (IRAP) IRAP (Fig. 2B and Fig. 4) detects two retrotransposons or LTRs sufficiently
close to one another in the genome to permit PCR amplification of the inter-vening region. Unlike AFLP or SS AP, the method requires only intact genomic DNA as the template and PCR reagents and apparatus for amplification. There are no restriction enzyme digestion or adapter ligation steps. The amplification products are generally resolved by electrophoresis in wide-resolution agarose gels, but if labeled primers are used, sequencing gel systems may be employed. The amplified fragments range from under 100 bp to over several kilobase pairs, with the minimum size depending on the placement of the PCR priming sites with respect to the ends of the retrotransposon.
The IRAP method (38) has found applications in gene mapping in barley (39) and wheat (39α) and in studies of genome evolution in the grasses (40). We have adapted it as well for maize and soybean (Schulman, A. H., et al., unpublished). Even given a large genome and a highly prevalent retro-transposon family, one would not expect the IRAP method to produce very many resolvable PCR products. Taking the BARE-1 elements in barley as an example, the genome is approx 4.7 x 1Ο9 bp in size (41), and the retrotransposon family is present in approx 1.5 x 10⁴ full-length copies in addition to 1.7 x 10⁵
solo LTRs (22). The full-length BARE-l is 8932 bp and the LTRs are 1809 bp, comprising a total of 4.4 x 1Ο8 bp in the genome and leaving 4.3 x 10⁹ bp of the genome not BARE-1. Were insertions to be random within the genome, they would be expected to follow a Poisson distribution. If the total of 1.85 x 10⁵
intact BARE-l elements and solo LTRs were equidistantly dispersed within the remaining, non-BARE part of the genome, they would be situated on average roughly 23 kb apart, with most insertions too far from another for PCR and beyond the resolution of conventional agarose gel electrophoresis. The method, however, does produce a range of subkilobase fragments, in part because barley (17,42) and at least other grass genomes are organized into gene-rich islands surrounded by seas of repetitive DNA. The retrotransposons, which comprise large portions of the repeat seas, tend to be nested, one inserted into another, in barley, maize, and other grasses (16,17,40). The IRAP amplification prod-ucts can derive, therefore, variously both from nearby solo LTRs and full-length elements interspersed with nonretrotransposon DNA and from nested retrotransposons
The example given below is for the BARE-1 element in barley (see Subhead-ings 3.2. and 3.3.). However, the method is applicable at least to any grass (40), functions as well in other monocots (42α), and may be useful in other genomes with structures similar to that of the grasses.
1.7. Retrotransposon-Microsatellite Amplified Polymorphism (REMAP) REMAP (Fig. 2C and Fig. 5) is conceptually similar to IRAP, but it differs in that it detects polymorphisms in the presence of retrotransposons or LTR derivatives sufficiently near simple sequence repeats (SSRs), often referred to as microsatellites, to allow PCR amplification. Microsatellites are ubiquitous features of eukaryotic genomes, and they have served directly to generate molecular markers in many plants (4,43,44). For this reason, we were interested in determining whether retrotransposons were associated with micro-satellites in the genome, and to what extent such associational polymorphism could serve as molecular markers. We found (38) that indeed, for BARE-1 in barley, retrotransposon insertions near microsatellites are considerably poly-morphic. This result was later confirmed by others (45).
The REMAP method combines outward-facing LTR primers of the sort used in IRAP with SSR primers containing a set of repeats and one or more nonrepeat nucleotides at the 3' end to serve as an anchor. The anchor is necessary to provide specificity to the PCR amplification; otherwise, the repetitive structure of the primer might cause it to anneal in multiple positions in any given microsatellite. Both IRAP and REMAP consist of PCR carried out on undigested template DNA and resolve the products on agarose gels. Following the initial publication of the technique by us (38), and almost simultaneously by others (46) under the guise "copia-SSR," REMAP has been used to examine genome evolution in wild barley (47), to map a major resistance gene in barley (39), and as a sensitive method for detecting genomic copies of retrotransposons amidst retrotransposon cDNAs (48). The implementation in Subheadings 2.4. and 3.4. is for BARE-l, which is useful in a range of cereals and grasses, but the method is generic and could be applied to other plants as well.

Fig. 6. RBIP Analysis. (A) Agarose gel electrophoresis products of RBIP PCRs containing two host-specific primers (PHl and PHa) and a retrotransposon-specific primer PT. Only one of the two possible products is produced per sample, and the size indicates the product and hence the state of each locus. (B) Gel of PCR reaction of genotypes polymorphic for the retrotransposon insertion diagramed in (A). + refers to the occupied (retrotransposon-containing) allele, - to the unoccupied (retrotransposon-lacking) allele. (C) RBIP dot analysis. Altogether 48 DNA samples were subjected to PCR with host specific primers PH1 and PH2, then dotted onto nylon membrane and hybridized to a radiolabeled PHI-PIC probe. Samples producing a signal correspond to an unoccupied locus. (D) The same samples were subjected to PCR with the transposon-specific primer PT and host-specific primer PH2, then treated as above. Samples producing a signal correspond to an occupied locus. (E) The deduced scores for the 48 scored at accessions at one locus. + indicates the occupied site, - indicates the unoccupied site, and o, no score (failed PCR or absence of both alleles).
1.8. Retrotransposon-Based Insertional Polymorphism (RBIP) A 1.8.1. Overview
RBIP (Fig. 2D and Fig. 6) is in essence the simple PCR-based detection of retrotransposon insertions using PCR between primers flanking the insertion site and primers from the insertion itself. A complementary reaction using primers from the surrounding DNA alone detects the unoccupied site (Fig. 6A). Because retrotransposon insertions are thousands of bases in length, the "unoc-cupied site PCR" produces no product from an occupied site. The particular feature of RBIP that distinguishes it from the other retrotransposon-based marker methods described in this chapter is that it is a single locus, co-domi-nant technique.
RBIP is a robust technique. For low numbers of samples, the products are detected by normal agarose gel electrophoresis (Fig. 6B). Both reactions are carried out in the same tube, and the size of the PCR product indicates which allele (occupied or unoccupied) has been amplified. The technical problems with this basic RBIP method are all associated with the acquisition of the sequence information for the flanking primers. This situation is closely analo-gous to the collection of new flanking sequences for microsatellite or SSR markers. Sequence data for new RBIP markers may be obtained from sequence analysis of genomic clones. Alternatively, SSAP markers can be converted into RBIP markers.
The basic RBIP method can be automated by adopting a dot-based assay (Fig. 6C-E) to replace gel electrophoresis (49). In this case, the occupied-site and unoccupied-site PCRs are carried out separately, and the products are dotted onto nylon membrane and probed with a locus-specific probe. This approach avoids a size-separation step, and can be scaled up to handle many thousands of plant samples by robotic spotting. Production of the raw marker data (hybridization signals) is independent of sample number, and data capture and processing, using the technology developed for scoring microarrays (50), allow the full automation of the process. Such modifications have been devel-oped (50a).
1.8.2. Converting Other Retrotransposon Markers Into RBIP Markers
In principle, a marker from any of the systems discussed above (SSAP, IRAP, REMAP) can be converted into a corresponding RBIP marker and vice versa. Markers from the former set of techniques are very easy to obtain, and they can be rapidly prescreened for their potential informativeness before investing in the effort of developing a corresponding RBIP marker. An SSAP electrophoresis band represents one side of the insertion. It is easy to cut out these bands from a gel, amplify the fragments by PCR, and sequence them to obtain the sequence of one side of the insert. This process, however, is insuffi-cient to allow the detection of the unoccupied site, which is a major disadvan-
243 bp PH1 PH2
Β 537 bp
243 bp
C
PH1-PH2PCR
D
PT-PH2PCR
Ε Score
+ - + - + + + + + - + + + + + - - + + - + - + + - 0 - - - + - - - - - + + - - - - + 0 + - + - -

tage because much of the strength of the RBIP technique lies in the very high accuracy of a double (or codominant) assay method. A description of standard methods for obtaining the sequence corresponding to the other side of the insertion is given in Note 1.
Table 1 SSR Primers for REMAP
Hybridization temperature for PCR, °C
SSR BARE-1 reverse BARE-1 direct
(GA)9C 56 56
(GT)9C 56 56 (CA)1OG 57 57 (CT)9G 56 56(AC)9C 56 56 (AC)9G 56 56 (AC)9T 56 56 (AG)9C 56 56 (TG)9A 56 56 (TG)9C 56 56 (AGC)6C 60 60 (AGC)6G 60 60(AGC)6T 60 60 (CAC)7A 60 60 (CAC)7G 60 60 (CAC)7T 60 60 (ACC)6C 60 60 (ACC)6G 60 60 (ACC)6T 60 60 (CTC)6A 60 60 (CTC)6G 60 60 (GAG)6C 60 60 (GCT)6A 60 60 (GCT)6C 60 60 (GTG)7A 60 60 (GTG)7C 60 60 (TCG)6G 60 60 (TGC)6A 60 60 (TGC)6C 60 60
2. BARE-l forward primer: 5' CTACATCAACCGCGTTTATT 3' This matches nucleotides 1993-2012 of BARE-1a, extending to 105 bp from
the 3' terminus of the LTR. A range of SSR primers can be used in combination with either the forward or
the reverse retrotransposon primer. These primers are given in Table 1, together with the hybridization temperature to be used in PCR:
2.5. RBIP 1. DNA: High DNA quality is not important for the success of RBIP. Miniprep
plant DNA, with large amounts of contaminating RNA and polysaccharides, do not affect the success rate of the technique.
2. Reagents: Standard proprietary PCR reagents are used. As in all PCR, success is more likely with hot-start Tag enzyme.
3. Methods 3.1. SSAP for PORI in Pea
1. DNA digestion: Digest approx 0.5 µg genomic DNA in RL buffer with 5 units restriction endonuclease Taq I in a total volume of 40 µL. Incubate 65°C for 2 to 3 h (see Note 2).
2. Adapter ligation: To the 40 µL digest from step 1 add 12.5 pmol Taq adapter (from 50 ρmοL/µL stock). Make up to 1 mM ATP, and add 1 unit T4 DNA ligase, adjust the total volume to 50 µL in 1x RL. Incubate at 37°C overnight.
3. Template preparation and storage: Dilute the ligated SSAP template DNA from step 2 by addition of 100 µL TE, pH 8.0, and store at -20°C. (Use 3 µL of this diluted template for a 10-µL PCR volume.)
4. Labeling reaction: Kinase-label the sequence-specific primer in bulk and later dispense the labeled primer among the reactions. The quantity depends on the number of reactions required; the example shown is designed for 30 reactions. The label used here, 33P, is safer and more convenient than 32P, but ensure that appropriate shielding, transport, and disposal procedures are followed (see Note 3).
Labeling mix (total volume 20.0 µL): Primer (100 ng/µL) 4.5 µL [γ-33Ρ]ΑΤΡ 2.0 µL (370 kBq/µL) 10X T4 polynucleotide kinase buffer 2.0 µL Water 11.0 µL 5 units T4 polynucleotide kinase (10 U/µL) 0.5 µL Incubate at 37°C for at least 1 h. Assemble the reaction components, except for the [γ-33Ρ]ΑΤΡ, together in a
clearly marked screwcapped 1.5-mL Eppendorf tube; dispense the [γ-33Ρ]ΑΤΡ in a laboratory appropriately equipped for work with radioactivity according to local safety guidelines. Incubate the labeling reaction at 37°C in a heating block desig-nated for radioactive work.
5. Labeled PCR: Assemble as follows for 30 reactions of 10 µL . Each reaction will use 3 µL of template, so 7 µL of the reaction mix must be added to each. There fore, in this example 210 µL reaction mix must be prepared for aliquoting.
Labeled primer 20 µL (from 4). Primers should be equimolar Adapter primer (7.5 ng/µL) 60µL

10x PCR buffer 30µL 1 mM dNTP 60 µL (200 µΜ each final concentration) Taq DNA Polymerase 6 U Add water (sterile) for a final volume of 210 µL. Dispense 7 µL to each 3 µL template sample and set up the PCR according to Vos and coworkers (5):
a. 10 cycles (94°C for 30 s; 55°C [reducing by 1°C per cycle] for 30 s; 72°C for 60 s).
b. 20 cycles (94°C for 30 s; 45°C for 30 s; 72°C for 60 s). c. A final extension step at 72°C for 7 min.
Check the PCR machine with the Geiger counter before and after use 6. Stopping the reaction: Add 10 µL of Stop solution to each 10 µL PCR; denature
by heating to 95°C for 3 min, and cool on ice. Store the reactions at -20°C until ready to load onto a gel. Use care; formamide is a mutagen.
7. Setting up of the polyacrylamide gels: Prepare the sequencing gel apparatus and cast the gel according to standard procedures suited for your specific apparatus.
8. Running and processing the gel (see Note 4): Mount the gel/glass plate assembly on the electrophoresis unit; add TBE buffer to top and bottom trays; and clean out the wells with buffer using a syringe and needle. Connect up to a power pack and prerun the gel for approx 30 min at 1500-1600V, to warm up. Disconnect the electrophoresis unit, flush out the wells with buffer, and load the denatured samples into the wells (1 µL of sample is generally enough). Continue running the gel for the desired time at 1500-1600V (2 h). Discard the buffer into a drain designated for disposal of low-grade radioactive liquid waste. When the plates have cooled down, remove one of the side spacers. Pry the plates apart, using a thin spatula placed in the gap between the plates at a corner. This is a hazardous procedure as glass fragments may break off or plates may crack and shatter. The gel should remain attached to the nonsilanized plate and can be transferred onto 3MM paper with an extra sheet for backing; trim the excess paper close to the gel. Place a piece of cling film over the gel to protect the gel drier cover from contamination. Dry for 1-2 h at 80°C in the vacuum gel drier. Expose the dried gels to an X-ray film or Phosphoimager plates. An example SSAP gel for Pisum is shown in Fig. 3.
3.2. SSAP for ΒARE-1 in Barley
1. DNA Digestion: Total genomic DNA from the plant of interest is completely digested using two restriction enzymes: one a rare cutter, the other a frequent cutter. The rationale for this approach is explained by Vos and coworkers (5) and is summarized below.
The frequent cutter will generate small DNA fragments, which will amplify well by PCR and are in the correct size range for separation on a denaturing or sequencing gel. The number of fragments amplified can be reduced by using a combination of rare- and frequent-cutting restriction enzymes, allowing amplifi-cation of fragments with a rare-cutter site at one end and a frequent-cutter site at the other, to the exclusion of the other fragments. Presumably, it also decreases
the chance of a fragment ligating to itself. In this example, we used MseI and PstI, as these had been previously used in barley (30), although any combination of rare and frequent cutting enzymes could be tried.
Msel cuts: Τ ΤΑΑ AATT
Pstl cuts: CTGCA G G ACGTC
Prepare a digest as follows: Total genomic DNA 1.0 µg Msel 5 U Pstl 5 U 10X RL buffer 2 µL Add H2O for a final volume of 20 µL. Digest at 37°C for at least 1 h
2. MseI/PstI Adaptor Ligation: Take digested DNA (1 µg in 20 µL) and add the following:
Msel adaptors (40 pmol) 1.0 µL Pstl adaptor (20 pmol) 0.5 µL l0 mM ATP 1.0 µL RL buffer 0.4 µL T4 ligase 0.5 µι Incubate at 37°C for 3 h, then store template DNA (at a final concentration of
40 ng/µΐ.) at -20°C. 3. Preamplification PCR (see Note 5): This procedure is useful when working with
large genome sizes, to reduce the restriction fragments to a manageable number. The PCR conditions are the preferred ones for our Techne Genius PCR machine, and should be adjusted as appropriate to others.
10X PCR buffer 2.5 µL dNTPs 4µL(1.25 mΜ) Msel primer 75 ng Pstl primer 75 ng Template 0.75 µL (approx 30 ng) Taq DNA polymerase 1 U (0.2 µL) Add H2O for a final volume of 25 µL. We use the following PCR program:
a. 1 min 95°C warmup. b. 30 cycles (1 min 94°C denaturing; 1 min 60°C annealing; 1 min 72°C extension). c. 7 min 72°C final extension. After the reaction is complete, add 55 µL TO.1E and store at -20°C. 2. End-
labeling of the BARE-1 oligo: This oligo complements the start of the BARE-1 5' LTR. The final A on this primer is a selective base, designed to anneal to and amplify only the fraction of fragments in which the first nucleotide of the flanking sequence is an A. Also, this A is one of two nucleotides which cause mismatches to the 3' LTR,

thus reducing the chance of priming into the retrotransposon from this LTR. A total of 1 µL of labeled oligo is made per PCR reaction. We have mainly used [γ-32Ρ]ΑΤΡ, but 33P label may be used. Per PCR reaction:
[γ-32Ρ]ΑΤΡ 1 µCi (3000 Ci/mMol) BARE-1 oligo (50 ng/µL) 0.13 µL 10x kinase buffer 0.1 µL T4 polynucleotide kinase 0.25 U (0.025 µL) Add H2O for a final volume of 1 µL. Incubate at 37°C for at least 30 min. Denature kinase at 70°C for 10 min, then
place on ice immediately. Spin at 15,000g for 15 s on desktop microcentrifuge. Store at -20°C.
5. Labeled SSAP PCR reaction (see Note 6): Add the following per PCR reaction: [γ-32P]ATP-labeled BARE-l oligo 1 µL Unlabeled BARE-l oligo (50 ng/µL) 0.5 µL Selective MseI or PstI primer (50 ng/µL) 0.6 µL
(see Subheading 2.2.) 10x PCR buffer 2 µL dNTPs 3.2µL(1.25mΜ) Preamplified DNA (from step 3) 2 µL Taq DNA polymerase 0.5 U (0.1 µL) Add H2O for a final volume of 20 µL. The PCR program is as follows, 36 cycles in total:
a. 94°C, 1 min. b. 13 cycles (65°C for 1 min, imposing a -0.7°C decrease per cycle ["touch-
down PCR"]; 72°C for 1 min; 94°C for 1 min). c. 22 cycles (56°C for 1 min; 72°C for 1 min; 94°C for 1 min). d. A final extension at 72°C for 7 min.
6. Running samples on a denaturing gel: Gels are set up as in step 7 of Subheading 3.1. Add 20 µL of sequencing Stop buffer to each sample, mix well. Denature by incubation at 90°C for 5 min, then place on ice immediately. Load each sample onto a 6% denaturing polyacrylamide gel. Load an amount appropriate to the size of combs you are using. We use "shark-tooth" combs, but larger well-forming combs can be used. Samples usually take 1.75-2.0 h to run. It is also useful to run a marker along side. Fix gel if necessary. Gels are exposed with X-ray film for one to five days. Do not use an intensifying screen for 32P gels. If the procedure is working reasonably well, you should get a visible result in a day or two. An alternative is to use a phosphoimager and imaging plates rather than X-ray film.
3.3, IRAP for BARE-1 in Cereals The technique is presented as developed for barley (see Note 7). 1 Set up the PCR reaction: The reaction here is designed for 20-µL tubes, but it can be scaled
down for use in microtiter plates. Each reaction contains: 10x PCR buffer 2 µL Template DNA (10 ng/µL) 20 ng PCR primers (one, the other, or both) 200 nM each final concentration dNTPs 0.2 mM final concentration 1 U Taq DNA polymerase Add H2O for a final volume of 20 µL.
2. Carry out the PCR as follows: a. 94°C for 2min. b. 30 cycles (94°C for 20 s; 60°C for 20 s; 72°C for 2 min). c. A final extension at 72°C for 10 min. d. Maintenance at 4°C (see Note 8).
3. Electrophoretic resolution of the PCR products: Take one-fifth of the PCR reac- tion, mix with loading buffer, and analyze on a wide-resolution agarose gel. We have used 2% RESolute™ agarose, but 1.2-1.5% Seakem 3:1 NuSieve® aga- rose is expected to work as well. Carry out the electrophoresis in a 20-cm-long gel for 7 h at 100 V in a Pharmacia GNA-200, 20 x 20 cm format, in standard Tris-borate (0.5X TBE) buffer, and visualize by staining with ethidium bromide (see Note 9).
3.4. REMAP for BARE-1 in Cereals The example given is for barley.
1. Set up the PCR reaction: The reaction here is designed for 20-µL tubes, but it can be scaled down for use in microtiter plates.
Each reaction contains: 10x PCR buffer (as for IRAP) 2 µL Template DNA (10 ng^L) 20 ng PCR primers (one, the other, or both) 200 nM each final concentration dNTPs 0.2 mM final concentration 1 U Taq DNA polymerase Add H2O for a final volume of 20 µL.
2. Carry out the PCR as follows: a. 94°C for 2min. b. 28-32 cycles (94°C for 20 s; 56-60°C [according to primer pair; see Sub-
heading 2.4.] for 20 s; 72°C for 2 min). c. A final extension at 72°C for 10 min. d. Maintenance at 4°C (see Note 10).
3. Electrophoretic resolution of the PCR products: As for IRAP; see step 3 in Sub-heading 3.3. An example REMAP gel is shown in Fig. 5.
3.5. RBIP
I. Set up the PCR reaction: The amount of template DNA here is based on use with

pea (see Note 11). Each reaction contains: 10x PCR buffer (Promega) 2 µL Template DNA l0ng PCR primers 40 ng each dNTPs 3.2µL(1.25mΜ) 1 U Tag DNA polymerase Add H2O for a final volume of 20 µι.
2. Carry out the PCR: This program was constructed for a Techne Genius machine but can be adapted to others. It consists of 95°C for 1 min; 35 cycles of 94 °C for 1 min, 55 °C for 1 min, and 72°C for 1 min; a final extension at 72°C for 7 min; maintenance at 4°C.
3. Analyze the RBIP products: For gel-based analysis, the products are electro- phoretically separated on 1.5% agarose gels containing ethidium bromide in TBE buffer (Fig. 6B). For dot-based analysis, 0.5 µL. of each PCR product is spotted onto Biodyne A nylon membrane (see Note 12). The samples are left to dry at room temperature for 5 min, then placed on a sheet of Whatman 3MM chroma- tography paper wetted with 0.5M NaOH, 1M NaCl, for 1 min (see Note 13). After this, they are transferred to another sheet of 3MM paper soaked in \M Tris- HCI, pH 7.5, 3M NaCl, then immersed in 2X SSC for 5 min. Finally, the dena tured DNA is cross-linked to the filter.
The filters are hybridized to the probe using standard methods for Southern blot analysis. Prehybridization in 4X SSC, 0.1% SDS at 60°C for at least 30 min is followed by hybridization to the probe in the same solution overnight. Probes are 32P-labeled by the oligonucleotide-primed method. Posthybridization washes use 2X SSC, 60°C final stringency (see Note 14).
Radiographic detection is best carried out with a phosphoimager, to allow rapid and accurate quantification of the hybridized signal per dot. We use a Fuji Model Β AS-1500 machine, with 1-3 d exposure. The scanned data are quantified by superimposing a square sector matrix using MacBAS software (Fuji; version 2.5). The data are then output to a Microsoft Excel spreadsheet, which subtracts background signals from each scanned sector, calculates occupied/unoccupied signal ratios for each line, and scores the ratios. Ratios of occupied to unoccupied signals of 10 or greater are scored as an occupied site; ratios lower than 0.2 are scored as an unoccupied site; and ratios between these values are scored as het-erozygotes (both occupied and unoccupied). Finally, if the summed total signal for both occupied and unoccupied sectors fall below a preset threshold, the locus is scored as a failure (no score; see Note 15).
3.6. Prospects Retrotransposons are highly useful as molecular markers, in the analysis of
genome structure, and as tools for the reverse-genetic characterization of gene function (28). The protocols presented here have been built around specific retrotransposon families and particular plants. However, retrotransposons throughout the eukaryotes share common structures and life cycles, permitting
adaptation to a wide range of research materials. Key considerations for adap-tation of the method to the plant of interest are the LTR length, copy number of the retrotransposon family for which the PCR primers are designed, and the genome structure of the plant. Long LTRs necessitate primers near the termini, whereas LTRs of only several hundred base pairs allow more flexibility in this regard. Retrotransposons in high copy number may produce too many bands for efficient amplification or gel resolution in all methods except RBIP. This problem can be overcome by increasing the number of selective bases in SSAP or by designing the retrotransposon primer in IRAP or REMAP to bridge the joint between the LTR and the flanking region and to carry selective bases at its 3' end. Genome organization, particularly the nesting of retrotransposons insertion sites and the proximity of microsatellites to retrotransposons, affects the relative efficacy of IRAP, REMAP, and SSAP.
A valuable aspect of retrotransposon marker systems is that the phyloge-netic resolution is dependent on the activity of any particular retrotransposon family. The more active the family, the better the resolution in closely related germplasm. The many examples of explosions in retrotransposon copy number in particular clades of plants (21,22) show that certain retrotransposon families can be phylogenetically diagnostic as well. To take advantage of this feature, one must employ a general method for the isolation of new retrotransposon families. The internal domains of retrotransposons contain conserved motifs necessary for carrying out the life cycle. In particular, the RNase domain in the case of copia-like elements, and the integrase domain for gypsy-like retro-transposons, are sufficiently close to the 3' LTR to permit an SSAP or genome-walking method to be used, employing a PCR primer anchored in either of these regions, to isolate the 5' termini of LTRs of almost any retrotransposon from most eukaryotes (35). In this way, novel elements can be applied to IRAP, REMAP, and SSAP and then in turn the integration sites developed for RBIP. The RBIP method itself has recently been adapted for more efficient, high-
throughput analyses (50α). The improved methodology is based on the use of fluorescent primers where different fluorochromes allow the multiplexing of the PCR reactions as well as on the use of arrays allowing simultaneous analy-sis of thousands of samples. We therefore expect that retrotransposon marker systems will find increasing use in the near future for phylogenetic studies, fingerprinting, and germplasm characterization. 4. Notes
1. Rapid ways exist for obtaining the other side of any given retrotransposon inser-tion. The first of these relies upon the fact that retrotransposons generate a dupli-cation of host insertion site sequence when they insert. For Tyl-copia group retrotransposons, this site is a random 5-bp sequence that can be obtained from sequencing the SSAP, IRAP, or REMAP band. This same 5-bp sequence is

present at the other side of the insertion, and these sequences can be used as selective bases at the 3' end of a primer specific for the other (unsequenced) end of the insertion. The SSAP, IRAP, or REMAP amplification with this primer on accessions containing the particular insertion and accessions lacking it (as indi-cated by the marker data) usually yields a very small number of candidate bands corresponding to the other side of the insertion. The correct band can be chosen by its cosegregation with the original marker in a set of samples that are poly-morphic for the band. This band can then be sequenced to give the other side of the insertion, and that is all that is needed for the RBIP marker.
Alternatively, the GenomeWalker™ kit (BD Biosciences Clonetech) or similar products can be used. This procedure is similar to SSAP in principle, but uses a specific primer derived from the host DNA flanking the insertion rather than from the retrotransposon itself, oriented for synthesis toward the insertion site. Sequence analysis of the fragments obtained from accessions lacking the insertion reveals the sequence at the other side of the insertion.
2. DNA digestion: On occasion, the digestion step does not run to completion, pre-sumably as a consequence of some contaminant in the DNA prep. The result is a track with extra bands on the final gel, so that the sample appears exceptional in element number and also distantly related to the other samples (because many bands are not shared). The presence of incomplete digestion can be checked by digesting some of the final sample to be run on the gel: Bands will disappear, revealing the presence of amplification products with internal Taq I sites. Alter-natively, a specific enzyme digestion buffer can be used and changed for the ligation step; however, this is a little tedious and does not often appear to be necessary. Enzymes other than Taq I, or two enzymes, could be used in this step. This type of behavior can be exploited in studies of DNA methylation. For example Sau3A will not cut C-methylated sites, but Mbol will (52) so the com-parison of Sau3A and Mbol SSAPs is informative. Some enzymes are blocked by C-methylation; this blockage may not occur at a symmetric sequence, and there may be no convenient isoschizomer control (e.g., Hind III). In such cases the comparison of the SSAP products with Hind III digested SSAPs can be a useful alternative.
3. 33P poses a hazard mainly as a consequence of contamination. The β-particle emission is low energy compared to 32P. Follow safety guidelines appropriate for handling of radioactive materials.
4. Gradient gels (53) or high-salt bottom buffers can be used to compress the band ing towards the bottom of the gel, maximizing the information content yield from each run.
5. The primers in this step carry no selective bases. The adapter/primer configura tion are as described in Subheading 2.2.
6. The selective primers used here gave us the most polymorphism with the BARE-1 primer and a manageable number of strong bands with the least background on the film. The number of selective bases has to be optimized for each retro transposon family in a given species. It should be remembered that for any given combination of restriction enzymes (in this example, Pst1/Mse1) and selective primers, only a subset of the retrotransposon family is amplified. Although this is
an inevitable consequence of the limits of PCR amplification and gel-based frag ment resolution, additional combinations of digests, adapters, and primers allow analysis of other subsets of the potential integration sites.
7. If the primer is not fully complementary to the template retrotransposon (as would be the case in unconserved regions of a retrotransposon or in divergent families of elements), the PCR buffer, in particular the salt and pH, but not the poly- merase, may influence the results.
8. The number of reaction cycles, template quantity, primer concentration, and enzyme quantity may need to be optimized for specific retrotransposon families and plant species. We use up to 1.2 units of enzyme and up to 35 cycles in some cases. The annealing temperature must be adjusted to match the primers used.
9. The IRAP reaction generates a complex mixture of fragments of wide size range. Slow electrophoresis as described improves the fragment resolution, as does longer separation distances and high-quality agarose. We routinely use a 20 χ 20 cm Pharmacia gel box (GNA-200) and combs having 1 mm thickness. An example IRAP gel is shown in Fig. 4.
10. If there is high background in the lanes, the amount of template can be reduced to 10 ng.
11. Several different proprietary PCR buffers (PE, Promega, Qiagen) have been tried and all have worked. Primers should follow the normal rules for good primer design. In particular, they should be carefully screened against the possibility of primer-dimer artifacts, and we have always been careful to keep the Tm of all primers used in a single reaction to within 2°C of one another. Typically, we use primers of around 20 bases with 40-50% G/C content.
12. Early versions of this protocol used manual spotting, but this method has been superceded by robotic spotting, using a Robbins Hydra with Automated Plate Positioning (APP). This allows 96-well or 384-well PCR plate formats to be spot ted automatically at a density of 384 or 1536 dots per 12 cm x 8 cm sheet.
13. These soaking steps are similar to the Southern blot steps, in that they denature the DNA for efficient binding to the membrane and subsequent hybridization. These steps can be omitted and the spotted DNA immediately cross-linked to the membrane, but the signal from the hybridized probe(s) falls by at least a factor of fivefold.
14. Be careful to avoid too stringent washing conditions. The short length of the probes (typically 100-300 bp) and frequent high A/T content from nongenic DNA indicate that the conditions quoted here are usually close to the Tm of the hybrid.
15. Failed PCRs generate low or nonexistent signals in both occupied and unoccu pied sectors. Visual screening of scanned hybridized filters gives a very good idea of whether this has happened for any given sample, and the scanned signals for several chosen failures can be used to set the failure threshold signal for all the samples. Typical failure rates are between 3% and 5% in our experience.

Acknowledgments
Development of the methods described in this chapter was funded by con-tracts BIO-4-CT-960508 and QLK5-CT-2000-01502 to the Commission of the European Communities. We are grateful to Ruslan Kalendar, Maggie Knox, and Steven Pearce for material contributions to the methods presented here. Nigel Kilby and Caroline Stuart-Rogers are thanked for proofreading of the text.
References
1. Botstein, D., White, R. L., Skolnick, M., and Davis, R. W. (1980) Construction of a genetic linkage map using restriction fragment length polymorphisms. Am. J. Human Genet. 32, 314-331.
2. Williams, J. G., Kubelik, A. R., Livak, K. J., Rafalski, J. A., and Tingey, S. V. (1990) DNA polymorphisms amplified by arbitrary primers are useful as genetic markers. Nucleic Acids Res. 18, 6531-6535.
3. Zhao, X. and Kochert, G. (1993) Phylogenetic distribution and genetic map ping of a (GCG)n microsatellite from rice (Oryza saliva). Plant Mol. Biol. 21, 607-614.
4. Zietkiewicz, E., Rafalski, A., and Labuda, D. (1989) Genome fingerprinting by simple sequence repeat (SSR)-anchored polymerase chain reaction amplification. Genomics20, 176-183.
5. Vos, P., Hogers, R., Bleeker, M., Reijans, M., van der Lee, T., Homes, M., et al. (1995) AFLP: A new technique for DNA fingerprinting. Nucleic Acids Res. 21, 4407-4414.
6. Kumar, A. and Bennetzen, J. (1999) Plant retrotransposons. Annu. Rev Genet. 33, 479-532.
7. Grandbastien, M.-A. (1992) Retroelements in higher plants. Trends Genet. 8, 103-108.
8. Bennetzen, J. L. (1996) The contributions of retroelements to plant genome orga nization, function and evolution. Trends Microbiol. 4, 347-353.
9. Schmidt, T. (1999) LINEs, SINEs and repetitive DNA: non-LTR retrotransposons in plant genomes. Plant Mol. Biol. 40, 903-910.
10. Frankel, A. D. and Young, J. A. (1998) HIV-1: Fifteen proteins and an RNA. Annu. Rev. Biochem. 67, 1-25.
11. Xiong, Y. and Eickbush, Τ. Η. (1990) Origin and evolution of retroelements based upon their reverse transcriptase sequences. EMBO J. 9, 3353-3362.
12 Doolittle, R. P., Feng, D. F., McClure, Μ. Α., and Johnson, M. S. (1990) Retrovirus phylogeny and evolution. Curr. Top. Microbiol. Immunol. 157, 1-18.
13 Sverdlov, E. D. (2000) Retroviruses and primate evolution. BioEssays 22, 161-171.
14. Sandmeyer, S. B. and Menees, T. M. (1996) Morphogenesis at the retro- transposon-retrovirus interface: gypsy and copia families in yeast and Drosophila. Curr. Top. Microbiol. Immunol. 2124, 261-296.
15. Pearce, S. R., Harrison, G., Li, D., Heslop-Harrison, J. S., Kumar, A., and Flavell, A. J. (1996) The Ty1 -copia group of retrotransposons in Vicia species: Copy num ber, sequence heterogeneity and chromosomal localisation. Mol. Gen. Genet. 205, 305-315.
16. SanMiguel, P., Tikhonov, A., Jin, Y. K., Motchoulskaia, N., Zakharov, D., Melake-Berhan, A., et al. (1996) Nested retrotransposons in the intergenic regions of the maize genome. Science 274, 765-768.
17. Shirasu, K., Schulman, A. H., Lahaye, T., and Schulze-Lefert, P. (2000) A con tiguous 66 kb barley DNA sequence provides evidence for reversible genome expansion. Genome Res. 10, 908-915.
18. Suoniemi, A., Anamthawat-Jonsson, K., Arna, T., and Schulman, A. H. (1996) Retrotransposon BARE-1 is a major, dispersed component of the barley (Hor- deum vulgare L.) genome. Plant Mol. Biol. 30, 1321-1329.
19. Kumar, A., Pearce, S. R., McLean, K., Harrison, G., Heslop-Harrison, J. S., Waugh, R., et al. (1997) The Tyl-copia group of retrotransposons in plants: genomic organisation, evolution, and use as molecular markers. Genetica 100, 205-217.
20. Heslop-Harrison, J. S., Brandes, A., Taketa, S., Schmidt, T., Vershinin, A. V., Alkhimova, E. G., et al. (1997) The chromosomal distributions of Ίy1-copia group retrotransposable elements in higher plants and their implications for genome evo lution. Genetica 100, 197-204.
21. SanMiguel, P. and Bennetzen, J. L. (1998) Evidence that a recent increase in maize genome size was caused by the massive amplification of intergene retro transposons. Ann. Bot. 82, 37-44.
22. Vicient, C. M., Suoniemi, A., Anamthawat-Jonsson, K., Tanskanen, J., Beharav, A., Nevo, E., et al. (1999) Retrotransposon BARE-1 and its role in genome evolu tion in the genus Hordeum. Plant Cell 11, 1769-1784.
23. Voytas, D. F., Cummings, M. P., Konieczny, A. K., Ausubel, F. M., and Rodermel, S. R. (1992) Copia-like retrotransposons are ubiquitous among plants. Proc. Natl. Acad. Sci. USA 89, 7124-7128.
24. Flavell, A. J., Dunbar, E., Anderson, R., Pearce, S. R., Hartley, R., and Kumar, A. (1992) Ty1-copia group retrotransposons are ubiquitous and heterogeneous in higher plants. Nucleic Acids Res. 20, 3639-3644.
25. Suoniemi, A., Tanskanen, J., and Schulman, A. H. (1998) Gypsy-like, retro-transposons are widespread in the plant kingdom. Plant J. 13, 699-705.
26. Rowold, D. J. and Herrara, R. J. (2000) Alu elements and the human genome. Genetica 108, 57-72.
27. Shimamura, M., Yasue, H., Ohshima, K., Abe, H., Kato, H., Kishiro, T., et al. (1997) Molecular evidence from retroposons that whales form a clade within even- toed ungulates. Nature 388, 666-670.
28. Kumar, A. and Hirochika, H. (2001) Applications of retrotransposons as genetic tools in plant biology. Trends Plant Sci. 6, 127-134.
29. Yu, G.-X. and Wise, R. P. (2000) An anchored AFLP- and retrotransposon-based map of diploid Avena. Genome 43, 736-749.
30. Waugh, R., McLean, K., Flavell, A. J., Pearce, S. R., Kumar, A., Thomas, Β. B.

T., et al. (1997) Genetic distribution of BARE-1 -like retrotransposable elements in the barley genome revealed by sequence-specific amplification polymorphisms (SSAP). Mol. Gen. Genet. 253, 687-694.
31. Vogel, J. M. and Morgante, M. A microsatellite-based, multiplexed genome assay. In Plant Genome HI Conference, San Diego, CA, 1992.
32. Korswagen, H. C., Smits, M. T., Durbin, R. M., and Plasterk, R. H. A. (1996) Transposon Tel -derived, sequence-tagged sites in Caenorhabditis elegans as markers for gene mapping. Proc. Natl. Acad. Sci. USA 93, 14,680-14,685.
33. Van den Broeck, D., Maes, T., Sauer, M., Zethof, J., De Keukeleire, P., D'Hauw, M., et al. (1998) Transposon Display identifies individual transposable elements in high copy number lines. Plant Jour. 13, 121-129.
34. Ellis, T. H. N., Poyser, S. J., Knox, M. R., Vershinin, A. V., and Ambrose, M. J. (1998) Polymorphism of insertion sites of Ty1-copia class retrotransposons and its use for linkage and diversity analysis in pea. Mol. Gen. Genet. 260, 9-19.
35. Pearce, S. R., Stuart-Rogers, C., Knox, M. R., Kumar, A., Noel Ellis, Τ. Η., and Flavell, A. J. (1999) Rapid isolation of plant Tyl-copia group retrotransposon LTR sequences for molecular marker studies. Plant J. 19, 711-717.
36. Lee, D., Ellis, T. H. N., Turner, L., Hellens, R. P., and Cleary, W. G. (1990) A copia-like element in Pisum demonstrates the uses of dispersed repeated sequences in genetic analysis. Plant Mol. Biol. 15, 707-722.
37. Vershinin, A. V. and Ellis, T. H. (1999) Heterogeneity of the internal structure of PDR1, a family of Ty1/copia-like retrotransposons in pea. Mol. Gen. Genet. 262,703-713.
38. Kalendar, R., Grob, T., Regina, M., Suoniemi, A., and Schulman, A. H. (1999) TRAP and REMAP: Two new retrotransposon-based DNA fingerprinting tech niques. Theor. Appl. Genet. 98,704-711.
39. Manninen, O., Kalendar, R., Robinson, J., and Schulman, A. H. (2000) Applica tion of BARE-1 retrotransposon markers to map a major resistance gene for net blotch in barley. Mol. Gen. Genet. 264, 325-334.
39a. Boyko, E., Kalendar, R., Korzun, V., et al. (2002) A high density cytogenetic map of the Aegilops tauschii genome incorporating retrotransposons and defense related genes: insight into cereal chromosome structure and function. Plant Mol. Biol. 48, 767-790.
40. Vicient, C. M., Jaaskelainen, M., Kalendar, R., and Schulman, A. H. (2001) Active retrotransposons are a common feature of grass genomes. Plant Physiol. 125, 1283-1292.
41 Kankaanpää, J., Mannonen, L., and Schulman, A. H. (1996) The genome sizes of Hordeum species show considerable variation. Genome 39, 730-735.
42. Panstruga, R., Buschges, R., Piffanelli, P., and Schulze-Lefert, P. (1998) A con tiguous 60 kb genomic stretch from barley reveals molecular evidence for gene islands in a monocot genome. Nucleic Acids Res. 26, 1056-1062.
42a. Price, Z., Schulman, A. H., and Mayes, S. (2003) Development of new marker methods - an example from oil palm. Plant Genet. Resour. (in press).
43. McCouch, S. R., Chen, X., Panaud, O., Temnykh, S., Xu, Y., Cho, Y. G., et al. (1997) Microsatellite marker development, mapping and applications in rice genetics and breeding. Plant Mol. Biol. 35, 89-99.
44. Saghai Maroof, Μ. Α., Biyashev, R. M., Yang, G. P., Zhang, Q., and Allard, R. W. (1994) Extraordinarily polymorphic microsatellite DNA in barley: Species
diversity, chromosomal locations, and population dynamics. Proc. Natl. Acad. Sci. USA 91, 5466-5470.
45. Ramsay, L., Macaulay, M., Carle, L., Morgante, M., degli Ivanissevich, S., Mae stri, E., et al. (1999) Intimate association of microsatellite repeats with retro transposons and other dispersed repetitive elements in barley. Plant J. 17, 415-425.
46. Provan, J., Thomas, W. T. B., Forester, B. P., and Powell, W. (1999) Copia-SSR: A simple marker technique which can be used on total genomic DNA. Genome 42, 363-366.
47. Kalendar, R., Tanskanen, J., Immonen, S., Nevo, E., and Schulman, A. H. (2000) Genome evolution of wild barley (Hordeum spontaneum) by BARE-l retro transposon dynamics in response to sharp microclimatic divergence. Proc. Natl. Acad. Sci. USA 97, 6603-6607.
48. Jaaskelainen, M., Mykkanen, A.-H., Arna, T., Vicient, C., Suoniemi, A., Kalendar, R., et al. (1999) Retrotransposon BARE-l: Expression of encoded proteins and formation of virus-like particles in barley cells. Plant J. 20, 413-422.
49. Flavell, A. J., Knox, M. R., Pearce, S. R., and Ellis, Τ. Η. Ν. (1998) Retro transposon-based insertion polymorphisms (RBIP) for high throughput marker analysis. Plant J. 16, 643-650.
50. DeRisi, J. L., Vishwanath, R. I., and Brown, P. O. (1997) Exploring the metabolic and genetic control of gene expression on a genomic scale. Science 278,680-686.
50a. Flavell, A. J., Bolshakov, V. N., Booth, A., et al. (2003) A microarray-based high throughput molecular marker genotyping method: the tagged microarray marker approach. Nucl. Acids Res. 31, el 15.
51. Singh, R. P., Singh, M., and King, R. R. (1998) Use of citric acid for neutralizing polymerase chain reaction inhibition by chlorogenic acid in potato extracts. J. Virol. Methods 74, 231-235.
52. McClelland, M., Nelson, M., and Raschke, E. (1994) Effect of site-specific modification on restriction endonucleases and DNA modification methyltransferases. Nucleic Acids Res. 22, 3640-3659.
53. Biggin, M. D., Gibson, T. J., and Hong, G. F. (1983) Buffer gradient gels and 35S label as an aid to rapid DNA sequence determination. Proc. Natl. Acad. Sci. USA 80, 3963-3965.