2d-to-3d stereoscopic conversion: depth-map estimation...
TRANSCRIPT

2D-To-3D Stereoscopic Conversion: Depth-Map Estimation in a 2D Single-View Image
Jaeseung Koa, Manbae Kimb, and Changick Kim*a
aSchool of Engineering, Information and Communications University Munji-dong, Yuseong-gu, Deajeon, Korea;
bDept. Of Computer Science and Engineering, Kangwon National University Chuncheon, Gangwondo, Korea
ABSTRACT
With increasing demands of 3D contents, conversion of many existing two-dimensional contents to three-dimensional contents has gained wide interest in 3D image processing. It is important to estimate the relative depth map in a single-view image for the 2D-To-3D conversion technique. In this paper, we propose an automatic conversion method that estimates the depth information of a single-view image based on degree of focus of segmented regions and then generates a stereoscopic image. Firstly, we conduct image segmentation to partition an image into homogeneous regions. Then, we construct a higher-order statistics (HOS) map, which represents the spatial distribution of high-frequency components of the input image. the HOS is known to be well suited for solving detection and classification problems because it can suppress Gaussian noise and preserve some of non-Gaussian information. We can estimate a relative depth map with these two cues and then refine the depth map by post-processing. Finally, a stereoscopic image is generated by calculating the parallax values of each region using the generated depth-map and the input image.
Keywords: 2D-To-3D Conversion, depth map, 3D images, segmentation, HOS.
1. INTRODUCTION It is well expected that three-dimensional television (3DTV) system will bring a way of making TV watching dynamic,
realistic and immersive. Also with the advent of advanced 3D displays, the demand for 3D contents is increasing rapidly. Therefore, 3D conversion of existing 2D videos has become a critical issue because without having an efficient conversion tool, 3D consumer market would not grow easily.
The most important and difficult problem in 2D-to-3D conversion is how to generate or estimate the depth information using only a single-view image. Since there is no 3D information, we should estimate relative depth differences for each region in a single-view image. Several methods have been proposed to estimate the depth information from a single-view image. In [1], Feldman et al. generate the depth map which is made by manual method using some adjusting tools offered in Photoshop. As an automatic estimation method, S. Battiato et al. utilize the color information to estimate the relative depth map in a 2D image [2]. They apply color- based segmentation in an image and then each segmented region is classified into some classes by color-based heuristic rules. Each classified region is assigned different depth value depending on its own class. As another cue to estimate the depth map, the edge information can be used. In [3], Tam et al. present that the most critical depth information tends to be concentrated at object boundaries and at edges. They generate the depth map in a single-view image based on Sobel edge detection. Using focus and blur cue also can estimate depth information in a 2d image. Generally, objects nearer than the point of focus in an image seems clear but farther ones seem blurredly. In [4], S.A. Valencia et al. propose that measurement of the degree of focus, which is spatial frequency measurement, can be achieved by block-based wavelet transform, and then estimated the depth map by edge focus analysis.
This paper presents a novel and automatic technique to estimate the depth information in a single-view 2D image using focus information. Because of the limited ability of human-visual system or camera system for depth of focus, while closer regions on which we focus are shown clearly, the regions which are far from viewer tend to be blurred. In low depth of field images (See Fig. 1), the focused region can be assumed to be a foreground closer to the viewers and
Applications of Digital Image Processing XXX, edited by Andrew G. TescherProc. of SPIE Vol. 6696, 66962A, (2007) · 0277-786X/07/$18 · doi: 10.1117/12.736131
Proc. of SPIE Vol. 6696 66962A-1

.4Far eg? a ii a d
Sftreoscopic sft r 0CCID In' a ___1g:fl_Lfl_4fl_ ForgrGUUd
—
o!fla :Gin, ratio a
Ini agIn, ageUpdaft Estania
- I
the defocused regions are regarded as background which is far from the viewers. We can measure this focus cue using higher-order statistics (HOS) [5]. HOS information is combined with region information obtained by existing image segmentation technique to yield more accurate foreground extraction results. We refine the relative depth map through the post-processing, and finally synthesize new left-view image and right-view image. These synthesized images can be used to generate 3D content, which is stereoscopic image. Figure 2 shows the overall procedure for the proposed 2D-to-3D conversion technique.
Figure 1. Low depth of field images
Figure 2. The overall procedure for 2D-To-3D Conversion
This paper is organized as follows. Section 2 shows the pre-processing procedure being composed of image segmentation and foreground extraction using HOS. The process to estimate the relative depth map is described in Section 3. In section 4, we discuss stereoscopic pair image generation. Experimental results are presented in section 5 and finally we make conclusions in section 6.
2. FOREGROUND EXTRACTION
Let R represent a set of pixels. { }YyXxyxR ≤≤≤≤= 1,1),( , where the image size is YX × . Our goal is to
partition R into foreground regions FR and background regions BR. Let { }},,1{, NiRP i K∈= denote a partition of R with N regions, then FR can be expressed as
i
N
i
RFRFR
U1=
= (1)
where iR is the i-th connected region and FRN denotes the number of regions belonging to FR. BR is simply
represented as cFRBR = and thus the number of regions in BR becomes FRBR NNN −= .
Proc. of SPIE Vol. 6696 66962A-2

Figure 3. The procedure for foreground extraction using HOS.
We can effectively divide the focused foreground and background region using the focus cue in low depth of field image. As shown in Fig. 1, the defocused region can be modeled low-pass filtered. Assuming that only sharply focused foreground regions contain proper high-frequency components, those regions can be distinguished from background regions [5]. Firstly, we transform the input low-depth-of-field image into an appropriate feature space. We compute the higher-order statistics (HOS) for feature space transformation. HOS is effective for assessing the amount of high frequency components in the focused regions. In detail, we compute the fourth moment of each pixel in an image and construct HOS map. Then, block-based HOS map conversion, the hole-detection, region growing, block carving processes, and post-processing are followed. A diagram of whole process for foreground extraction is shown in Fig. 3. The detail process for the foreground extraction using HOS value is described in [5]. We can extract the foreground through above procedure. Figure 4 shows the results of foreground extraction.
Figure 4. The foreground extraction results
As shown in Fig. 4, the extracted results may contain small erosions in the foreground or scattered noise in the background according to content of the image. It is reasonable to combine region information to deal with this problem.
Image segmentation has been used in many image analysis applications to partition an image into homogeneous regions. There have been many approaches proposed, and a graph-based segmentation technique is adopted in this paper. In [6], Felzenszwalb et al. define a graph of a whole image which consists of edge information between neighbor regions and region information obtained by edge detection. The method proposed in [6] is based on selecting edges from a graph. The first step is to measure the dissimilarity between a pair of regions and to determine weights of the edge which is located between those regions. Those regions with a single low weight edge are merged. Then we finally achieve global image segmentation results that are shown in Fig. 5.
Proc. of SPIE Vol. 6696 66962A-3

S
—
RfIafivdpth'nap
(a) (b)
(c) (d)
Figure 5. (a), (c) Low depth of field images (b), (d) Segmentation results
3. DEPTH-MAP ESTIMATION The process for classifying the regions into foreground and background and allocating the depth value for each region
will be discussed in the following subsections.
Figure 6. The procedure for relative depth map estimation
3.1 Foreground Depth Assignment
The goal here is to define the final foreground region and allocate the depth value to the final foreground region using the segmented region information and initial foreground information obtained from HOS values. In order to see whether i-th region iR belongs to foreground, we compute the ratio of foreground pixels in the i-th region, irof
( )( )
ii
i
Card R FRrof
Card R=
I (2)
Proc. of SPIE Vol. 6696 66962A-4

I'
where ( )Card A denotes the cardinality of a set A, and irof denotes the ratio of foreground pixels in the i-th region. Thus, the final foreground region, FR can be determined with this following rule,
{ | }i iFR R rof τ= > (3)
If irof is larger than a pre-fixed threshold (τ = 0.5 in this paper), the region iR is declared to belong to the final foreground region FR. As addressed in the previous section, focused foreground regions are regarded as the nearest region to the viewers. Thus, we allocate the highest depth value to the final foreground region FR. Figure 7 depicts the results of the depth allocation for the set of final foreground region FR.
(a) (b)
Figure 7. The depth allocation for foreground regions.
3.2 Background Region Depth Estimation
We consider that the regions that are not classified as a final foreground region FR are included in the background region BR.
As we discussed in section 2, HOS is an efficient tool to measure the amount of high-frequency components in the regions. The focused regions tend to have high frequency components, but the defocused regions have fewer high-frequency components. The degree of defocus tends to increase when the defocused region is more apart from the viewers. To measure this change of the strength of blur in the defocused background regions, we compute the mean of HOS value for each background region irob . Let HOS(x, y) denote the HOS value at (x, y). The mean of HOS values
in iR , iMean can be obtained in (4).
( , )( , )
, ( )
i
ix y R
i ii
HOS x yMean R BR
Card R∈= ⊂∑
(4)
Based on the above assumption, the region with higher HOS mean value is considered as the one that has weaker blur strength and can be determined as a closer region to the viewers than other regions. In other words, we consider that higher HOS mean can be assigned higher depth values, while regions with lower HOS mean can be assigned lower depth values. Thus, after acquiring the HOS mean for background regions, we compare these HOS mean values and assign
_depth order for each background region, where BRNorderdepth ≤≤ _1 .
_depth order is assigned depending on iMean . In other words, if a region has the highest HOS mean, _depth order is set to NBR, while a region which has the lowest HOS mean is set to one. We also need to define a step size between depth values for assigning depth value to each region in BR as follows.
BRNstepdepth 255_ = (5)
Proc. of SPIE Vol. 6696 66962A-5

I
I
- - -. Single image'-it''.
Generatedleft liew
Screen
Generatedrig lit hew
ZFP(DEP(x) 128)
and,
orderdepthN
stepdepthdepthBR
i __255×
−= (6)
where idepth is allocated depth value for a region i in BR. Figure 8-(a) shows the relative depth map created by assigning depth values in each region.
(a) (b)
Figure 8. The comparison of (a) The estimated relative depth map (b) The result of asymmetric Gaussian Blurring.
The discontinuities of depth value between adjacent regions can cause artifacts when the stereoscopic pair is generated [8]. In order to reduce such artifacts, the process to smooth the estimated depth map is needed. In [8], applying asymmetric Gaussian smoothing in (7) to the depth map shows good performance over other smoothing methods. with the standard deviation in horizontal direction 8Hσ = , and in vertical direction 20Vσ = .
22
221 1( , )2 2
VH
yx
H V
G x y e e σσ
σ σ
−− ⎛ ⎞⎛ ⎞⎜ ⎟⎜ ⎟=⎜ ⎟⎜ ⎟
⎝ ⎠⎝ ⎠ (7)
where G(x,y) is the result of Gaussian smoothing. The result of smoothing is shown in Fig. 8-(b).
4. STEREOSCOPIC IMAGE GENERATION. 4.1 Parallax Generation
` Figure 9. Right view and Left view generation.
Proc. of SPIE Vol. 6696 66962A-6

A.
Screen Viewer
right eye
S
left eye
To synthesize the left-view and the right-view images using the estimated depth map, we compute the parallax value for each pixel in an image from the estimated depth map, and then shift each pixel by corresponding parallax values in an input image. The parallax value at (x, y), ( , )Parallax x y is computed from depth map as follows [2].
( , )( , ) 1128
depth x yParallax x y M ⎛ ⎞= × −⎜ ⎟⎝ ⎠
(8)
where M denotes the maximum parallax value and ( , )depth x y is the estimated depth value at (x,y). From this equation, the zero parallax plane (ZPP) is set to the region which has depth value of 128, so that the regions which have more than depth value of 128 have the negative parallax value and the regions which have lower than depth value of 128 have positive parallax value (See Fig. 9). Since we assign the negative parallax on the foreground regions, when the viewer see the stereoscopic image generated, they can feel that foreground regions are protruded out of the screen.
4.2 Stereoscopic Generation
As shown in Fig. 9, we consider the input image as the center view of stereoscopic pair. We shift each pixel of the input image by the amounts of parallax(x, y)/2 to right direction to generate the right-view image. The left-view image can be obtained by the same process. The generated left and right-view images are shown in Fig. 10.
(a) (b)
Figure 10. Stereoscopic image (a) Left-view and (b) Right-view
5. EXPERIMENTAL RESULTS To generate the stereoscopic image pair, the maximum parallax value M should be determined first.
Figure 11. Max Parallax Computation.
Proc. of SPIE Vol. 6696 66962A-7

In Fig. 11, Inter-ocular distance, S is normally 2.5 inch (= 6.35cm), and we set the distance V between screen and viewer. Max depth into the screen, D is set to 10cm. M value can be calculated by triangulation. Computed M value in this paper is M = 0.578cm. In the experiments, we use 19” monitor (1280x1024 Resolutions) and the length of 1 cm on the monitor is approximately 28 pixels. Thus, Max parallax, M can be determined as approximately16 pixels [8]. We can synthesize the right-view and left-view images by computed parallax value and generate anaglyph images using these two-view images. Viewers can feel the sense of depth through anaglyph glasses (Left: red, Right: cyan) on these anaglyph images [9]. Figure 12 shows single-view images, corresponding relative depth maps, and anaglyph images.
Proc. of SPIE Vol. 6696 66962A-8
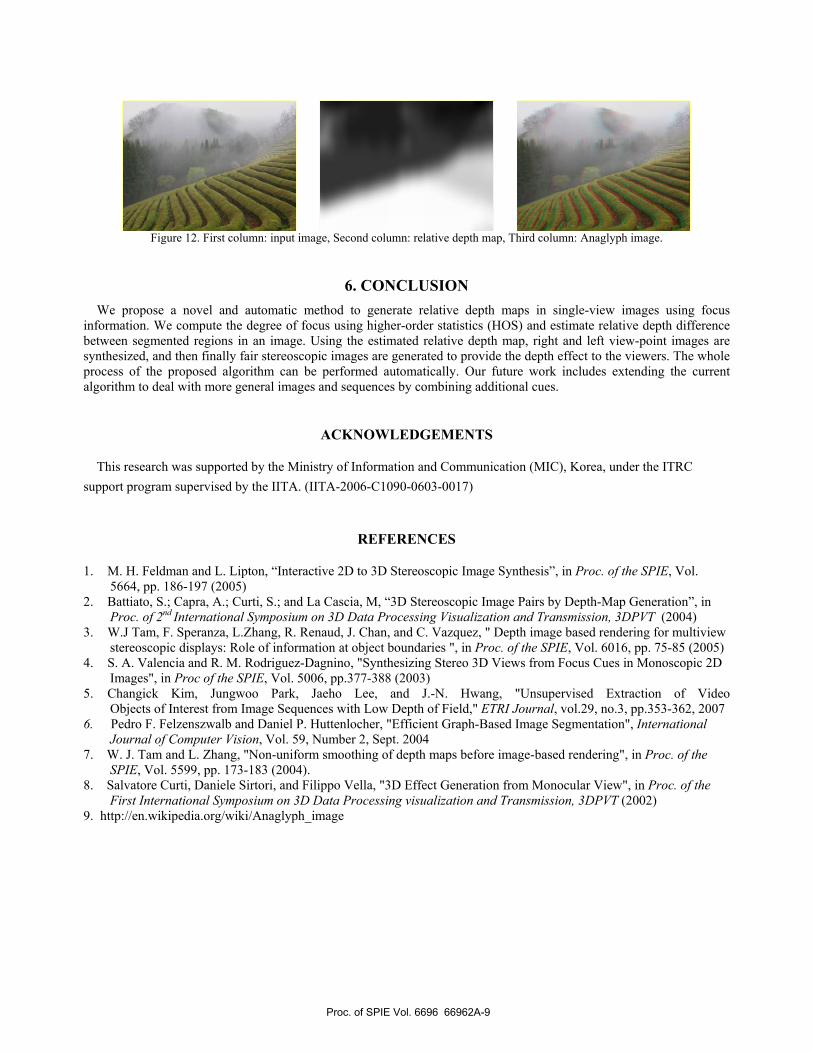
Figure 12. First column: input image, Second column: relative depth map, Third column: Anaglyph image.
6. CONCLUSION We propose a novel and automatic method to generate relative depth maps in single-view images using focus
information. We compute the degree of focus using higher-order statistics (HOS) and estimate relative depth difference between segmented regions in an image. Using the estimated relative depth map, right and left view-point images are synthesized, and then finally fair stereoscopic images are generated to provide the depth effect to the viewers. The whole process of the proposed algorithm can be performed automatically. Our future work includes extending the current algorithm to deal with more general images and sequences by combining additional cues.
ACKNOWLEDGEMENTS
This research was supported by the Ministry of Information and Communication (MIC), Korea, under the ITRC support program supervised by the IITA. (IITA-2006-C1090-0603-0017)
REFERENCES
1. M. H. Feldman and L. Lipton, “Interactive 2D to 3D Stereoscopic Image Synthesis”, in Proc. of the SPIE, Vol. 5664, pp. 186-197 (2005)
2. Battiato, S.; Capra, A.; Curti, S.; and La Cascia, M, “3D Stereoscopic Image Pairs by Depth-Map Generation”, in Proc. of 2nd International Symposium on 3D Data Processing Visualization and Transmission, 3DPVT (2004) 3. W.J Tam, F. Speranza, L.Zhang, R. Renaud, J. Chan, and C. Vazquez, " Depth image based rendering for multiview
stereoscopic displays: Role of information at object boundaries ", in Proc. of the SPIE, Vol. 6016, pp. 75-85 (2005) 4. S. A. Valencia and R. M. Rodriguez-Dagnino, "Synthesizing Stereo 3D Views from Focus Cues in Monoscopic 2D
Images", in Proc of the SPIE, Vol. 5006, pp.377-388 (2003) 5. Changick Kim, Jungwoo Park, Jaeho Lee, and J.-N. Hwang, "Unsupervised Extraction of Video Objects of Interest from Image Sequences with Low Depth of Field," ETRI Journal, vol.29, no.3, pp.353-362, 2007 6. Pedro F. Felzenszwalb and Daniel P. Huttenlocher, "Efficient Graph-Based Image Segmentation", International
Journal of Computer Vision, Vol. 59, Number 2, Sept. 2004 7. W. J. Tam and L. Zhang, "Non-uniform smoothing of depth maps before image-based rendering", in Proc. of the
SPIE, Vol. 5599, pp. 173-183 (2004). 8. Salvatore Curti, Daniele Sirtori, and Filippo Vella, "3D Effect Generation from Monocular View", in Proc. of the
First International Symposium on 3D Data Processing visualization and Transmission, 3DPVT (2002) 9. http://en.wikipedia.org/wiki/Anaglyph_image
Proc. of SPIE Vol. 6696 66962A-9