*2ffffffffffff eeeeeeeeemhhee ee-eeeeeeeohe … · utir.lcarrittle.n _nadc-79056-60 sicurity...
TRANSCRIPT

AD-A1lS 728 DREXEL UNIV PHILADELPHIA PA FIG 11/4
FRACTURE MECHANICS OF DELAMINATION. INITIATION AND GROWTH.(UIM
JAN A2 A S WANG, M SLOMIANA N62269-79-C-0270UNCLASSIFIED NADC-79056-60ON*2ffffffffffff
EEEEEEEEEmhhEEEE-EEEEEEEohEEEEmhhmhEmhhEEEEEEEEEEEohEEEmEEEEEohEEEEEI

(30 REPORT NO. NADC-79056-60
FRACTURE MECHANICS OF DELAMINATION
-INITIATION AND GROWTH-
A.S.D. Wang and M. Slomiana
Drexel University
Philadelphia, Pa. 19104
January 1982
FINAL CONTRACT REPORT
October 1, 1979 - September 30, 1981
CONTRACT NO. N62269-79-C-0270
Approved for Public Release: Distribution Unlimited
Prepared for
Aircraft and Crew Systems Technology Directorate
NAVAL AIR DEVELOPMENT CENTER
8O DTIC Warminster, Pa. 18974
Li E -ECTE
82 0

NADC-79056-60
NOTICES
REPORT NUMBERING SYSTEM - The numbering of technical project reports issued by theNaval Air Development Center is arranged for specific identification purposes. Eachnumber consists of the Center acronym, the calendar year in which the number wasassigned, the sequence number of the report within the specific calendar year, andthe official 2-digit correspondence code of the Command Office or the FunctionalDirectorate responsible for the report. For example: Report No. NADC-7801S-20indicates the fifteenth Center report for the year 1978, and prepared by the SystemsDirectorate. The numerical codes are as follows:
CODE OFFICE OR DIRECTORATE
00 Commander, Naval Air Development Center01 Technical Director, Naval Air Development Center02 Comptroller10 Directorate Command Projects20 Systems Directorate30 Sensors & Avionics Technology Directorate40 Communication & Navigation Technology DirectorateSo Software Computer Directorate60 Aircraft & Crew Systems Technology Directorate70 Planning Assessment Resources80 Engineering Support Group
PRODUCT ENDORSEMENT - The discussion or instructions concerning commercial productsherein do not constitute an endorsement by the Government nor do they convey orimply the license or right to use such products.
APPROVED BY: DATE: 1_2_
C USN

UNCLASSIFIEDNADC-79056-60
%ECUP.ITY CLASSIFICATION OF THIS PAGE (When' Date Entered.)REDWRUOS
REPORT DOCMENTATION PAGE B EPORE COMPLETIN~G PORMI. REP0111 NUMBER 2.GOVT ACCESSION NO. 3. RECIPINTS1 CATALOG NUMBER
NADC-79056-60 1 L.u4. TITLE (and Subtitle) S. TYPE OF REPORT A PERIOD COVIERED
FATRMEHNCOFDELAMINATION Final Contract ReportFEACTNE ~HANIS OFOct. 1, 1979 - Sept. 30,1981
-INITIATION AND GROWTH- 4. PERFORMING ORG. RE1PORT NUMBER
7. AUTI4OR(o) I. CONTRACT OR GRANT NUMISERs)
A.S.D. Wang and M. Slomiana. N62269-79-C-0270
9. PERFORMING ORGANIZATION NAME AND ADDRESS 10. PROGRAM ELEMENT. PROJECT, TASKARE A A WORK UN IT NUMBERS
Drexel UniversityPhiladelphia, Pa. 19104
II. CONTROLLING OFFICE NAME AND ADDRESS 12. REPORT DATEAircraft and Crew Systems Technology Directorate January, 1982Naval Air Development Center 13. NUMBER OF PAGESWarminster, Pa. 18974 154
14. MONITORING AGEN CY NAME & AODRESS(11 different from Controlling Oftice) 15. SECURITY CLASS. (of thi. report)
UNCLASSIFIEDIS. DECL ASS$ IlCATION7 DOWNGRADING
SCI4EVULE
16. DISTRIBUTION STATEMENT (of this Report)
Approved for Public Release: Distribution Unlimited.
17. DISTRI1BUTION STATEMENT (of the abstract erite,.dln Block 20. If differeit from Report)
* IS. SUPPLEMENTARY NOTES
* 19. KEY WORDS (Continue or. reverse aide If necessawy anwd identify by black numnber)
Composite materials, graphite epoxy laminates, transverse cracking, delamina-tion, x-radiography, fracture mechanics, strain energy release rate, finiteelement, initiation and growth criteria, tension, compression, fatigue,fatigue growth model, cumulative damage model.
the fracture mechanics of delamination. Experiments have been conducted usingthe AS-3501-06 graphite-epoxy laminates in order to observe delamination growthof various geometrical and loading conditions. Static and fatigue crack growthunder both tension and compressive loads are studied. The experiments helpedto identify and isolate the most important loading, geometry and material parateters which influence the delamination processes. Predictive models are thendeveloped to model these processes, based on the linear elastic fracture mechan
D iOAO ~71 1473 EDITION OFP I NOV 45 I$ O8SOLETES/N 01 02-LF.01446601
SECURITY CLASSIFICATION OF THIS PAGE (When Dae Entered)

Utir.lCARRITTLE.n _NADC-79056-60
SICURITY CLASSIFICATION OF THIS PAO (On. D.a Entered)
lock 20 Continued:
lement routine which simulates the crack growth process.
tension of the energy method to the growth process under constant amplitudeatigue loads leads to the concept of constant damage states. This concept iseadily applied in a cumulative damage model for fatigue under spectrum loading.
SECURITY CLASSIPICATION 07'1HIS PAGKCVren DAI Entered)

NADC-79056-60
TABLE OF CONTENTS
Page
Foreword
I. INTRODUCTION. .............. ........ 1
II. EXPERIMENT AND DISCUSSIONS ....... ... ................. 7
1 Description of Experiments ... ..... ............. 7
2 Discussion of Experimental Results .......... 11
III. AN ENERGY METHOD FOR SUB-LAMINATE CRACK GROWTH ....... 25
1 Physical Processes of Transverse Cracking and
Edge Delamination .... ................. 25
2 The Strain Energy Release Rate Concept 28
3 Finite Element Models .... ..... ............... 33
4 Numerical Correlation with Experimental Results . . . 37
IV. FATIGUE GROWTH MODEL BASED ON ENERGY 44
1 A Fatigue Growth Model Based on Energy Release Rate . . 44
2 The Concept of Constant Damage States ......... 48
3 A Cumulative Fatigue Damage Model . ........... .50
V. CONCLUDING REMARKS ..... .................... .52
REFERENCES ...... ...................... 55
TABLES ........ ....................... 57
ILLUSTRATIONS ...... ...................... .65
Accession Por
NTIS GRA&IDTIC TAB ElUnannounced CJustificatio
Distribution/ P
Availability Codes 2
.jAvall and/orDist 1Special
N!

NADC-79056-60
Foreword
This final technical report has been prepared in the course of research
supported by the Naval Air Development Center, under the Contract No.
N62269-79-C-0270. The work was performed during the period of October 1,
1979 through September 30, 1981.
The authors would like to thank Mr. Lee W. Gause, the contract monitor,
for the frequent technical discussions during the course of research, and
to Dr. Harry R. Miller for assistance in the computational phase of the
research.
1.l

NADC-79056-60
LIST OF TABLES
Page
Table
1. Basic Property Characterization Tests .. ........... ... 57
2. Damage Growth Tests under Static Step-Loading ....... ... 58
3. Damage Growth Tests under Fatigue Loading . ........ .. 59
4. Summary of Results from Basic Property Tests . ....... . 60
5. Summary of Results from Damage Growth Tests - 61Static Tension ........ .................
6. Summary of Results from Damage Growth Tests -Static Compression . . . ................. 62
7. Summary of Results from Damage Growth Tests -Tension/Tension Fatigue ..... ................. . 63
8. Summary of Results from Damage Growth Tests -Compression/Compression Fatigue ... ............. . 64
iii

NADC-79056-60
LIST OF FIGURES
PageFigure
1 Schematics of Four Delamination Problems Studied ........ .65
2 General Configuration of Tensile Test Specimens . ...... 66
3 General Configuration of Compression Test Specimens ...... 67
4 Schematics of the Compression Test Fixture . .......... 68
5 Load-Sequence X-radiographs for a [02/902/+452/-452]Laminate under Tension ... ................ 69
6 Load-Sequence X-radiographs for a [902/02/-452/4521 SLaminate under Tension ... ................ 72
7 Load-Sequence X-radiographs for [+45/0/902] s Laminateunder Tension ...... ..................... 75
8 Load-Sequence X-radiographs for [+45/0/90 2 ]s-A Laminateunder Tension ...... .................... 77
9 Load-Sequence X-radiographs for [+45/0/902] -B Laminateunder Tension ...... ..................... 80
10 900-Cracking and Edge Delamination Growth Behavior of[+45/0/9021s Laminates under Tension .. ............. .83
11 Load-Sequence of X-radiographs for [02/902/+452]s Laminatesunder Step-Compression ..... ................... .84
12 Load-Sequence of X-radiographs for [02/902/+4521s type ALaminates under Step-Compression ........ 85
13 Load-Sequence of X-radiographs for [02/902 /+4521s type CLaminates under Step-Compression ........ 87
14 Delamination Growth vs Applied Load for [02/902/452-452]sLaminate Series under Step-Compression .. ............ 88
15 Load-Sequence X-radiographs for [0/90/0/90/45/-45/45/-45]Laminates under Step-Compression. ... ............... ... 89
16 Load-Sequence X-radiographs for [0/90/0/90/45/-45/45/-45]stype A Laminates under Step-Compression .. ............ .90
17 Load-Sequence X-radiographs for [0/90/0/90/45/-45/45/-45]type C Laminates under Step-Compression .. ............ . 93
18 Delamination Growth vs Applied Load for the [0/90/0/90/45/-45/45/-45]sLaminate Series under Step-Compression .. ............ 95
19 Edge Delamination Growth vs Applied Load for Laminates underStep-Compression .... .................. 96
iii

NADC-79056-60
Figure Page
20 Life-Sequence X-radiographs for [+45/0/902] s Laminate under189 HPa Tension Fatigue Loading. . ............ 97
21 Transverse Crack Density Growth under Tension Fatigue Loads(±45/0/902]s. ..... .................... 100
22 Edge Delamination Growth under Tension Fatigue Loads[+45/0/902] s ...... . ................... 101
23 Life-Sequence X-radiographs for [+45/0/902]s - type A Laminateunder 187 MPa Tension Fatigue Loading. . ............ 102
24 Life-Sequence X-radiographs for 1+45/0/902]s - type B Laminateunder 189 MPa Tension Fatigue Loading. . ............ 104
25 Effect of Implanted Interlaminar Flaw on Delamination Growth underTension Fatigue Loading. [+45/0/902]s, type A and type B. ..... 106
26 Life-Sequence X-radiographs for [0 /902/452/- 4 5 2]s Laminateunder 221 MPa Compression Fatigue 2oad .... ........ 107
27 Life-Sequence X-radiographs for [02/902/ 452/-452]s - type ALaminate under 221 MPa Compression Fatigue Load. . ........ . 109
28 Life-Sequence X-radiographs for [02/902/452/-452]s - type C
Laminate under 222 MPa Compression Fatigue Load. ... ......... 111
29 Edge Delamination Growth under Compression Fatigue[02/902/452/-4521s ............... . 112
30 Edge Delamination Growth under Compression Fatigue[02/902/452/-452]s - type A. .... ................. 113
31 Edge Delamination Growth under Compression Fatigue[02190214521-45]- type C. .... ................. 114
32 Effect of Implanted Interlaminar Flaw on Delamination Growthunder Compression Fatigue Loading. [02/902/452/-452]s, type Aand type C. ..... ...................... 115
33 Life-Sequence X-radiographs for [0/90/0/90/45/-45/45/-45] sLaminate under 276 MPa Compression Fatigue Load. ........ 116
34 Life-Sequence X-radiographs for [0/90/0/90/45/-45/45/-45]type A Laminate under 219 MPa Compression Fatigue Load. . . . . 119
35 Life-Sequence X-radiographs for [0/90/0/90/45/-45/45/-45] stype C Laminate under 219 MPa Compression Fatigue Load. 121
36 Edge Delamination Growth under Compression Fatigue Loading[0/90/0/90/45/-45/45/-.45] - type A. ............ 122
iv
• o V

NADC-79056-60
Figure Page
37 Effect of Ply Thickness on Delamination Growth underCompression Fatigue ..... .................. 123
38 Effect of Ply Thickness on Delamination Growth underCompression Fatigue for type A Specimens. .. ............ .. 124
39 Effect of Ply Thickness on Delamination Growth underCompression Fatigue for type C Specimens. .... ............ 125
40 Schematics of 90*-Cracking. ... ................ 126
41 Schematics of Irwin's Crack-Closure Representation .. ...... 127
42 The Three Crack Extension Modes. .... ................ . 128
43 Finite Element Scheme of Irwin's Crack-Closure Representation 129
44 Finite Element Representation of a Transverse Crack . .... 130
45 Typical Finite Element Mesh for Transverse Cracks ... ....... 131
46 Typical Ce(a) Curve for Transverse Crack. . ........... . 132
47 Finite Element Model for Mid-Plane Free-Edge Delamination . • 133
48 Finite Element Model for Interface Free-Edge Delamination . 134
49 Typical Finite Element Mesh for Free-Edge Delamination .. ..... 135
50 Typical G(a) for Edge Delamination ...... ............. 136
51 Schematics of Two Different Cracking Actions inUnidirectional Laminate. ... ................ 137
52 Transverse Cracking Coefficient Functions for [+45/0/90 ]Laminate under Uniaxial Tension and Uniform Thermal Loaing 138
53 Mid-plane (mode I) Delamination Coefficient Functions for[+45/0/902]s Laminate under Uniaxial Tension and UniformThermal Loading. .... ................... 139
54 Off-Mid-plane (0/90) Delamination Coefficient Functions for[+45/0/902/l s Laminate under Uniaxial Tension and UniformThermal Loading. ...... ..................... 140
55 Transverse Cracking Coefficient Functions for [02/902/452/-4521sLaminate under Uniaxial Tension and Uniform Thermal Loading. . 141
56 Transverse Cracking Coefficient Functions for [902/02/-452/452]s
Laminate under Uniaxial Tension and Uniform Thermal Loading. 142
57 Off-Mid-plane Delamination (45/-45) Coefficient Functions for(02/902/452/-452]s Laminate under Uniaxial Compression andUniform Thermal Loading. ... ................. 143
58 Off-Mid-plane Delamination (-45/45) Coefficient Functions for[902/02/-452/452] s Laminate under Uniaxial Compression andUniform Thermal Loading. ..... ................... 144
v

NADC-79056-60
Figure Page
59 Schematics of the Strain Energy Release Rate Reserve,for Laminate undergoing Free-Edge Delamination. .. .......... .. 145
60 Data Reduction for a, 8 and k in the Fatigue Damage GrowthModel for [+45/0/902] s Laminates under Tension Fatigue. ...... . 146
61 Comparison of the Edge Delamination Growth Model with Experimentfor [+45/0/902]s Laminate under Tension Fatigue. . ........ 147
62 Data Reduction for a, a and k in the Fatigue Damage Growth Modelfor [02/9021452/-452] s Laminate under Compression Fatigue. . . . 148
63 Comparison of the Edge Delamination Growth Model with Experimentfor [02/902/452/-4521 s Laminate under Compression Fatigue. . . 149
64 Schematics for the Concept of Constant Damage Curves. ....... . 150
65 Constant Damage Curves Obtained from Tests on [±45/0/9021 s
Laminates under Tension Fatigue. ... ............... 151
66 Constant Damage Curves Obtained from Tests on [02/902/452/-4521sLaminates under Compression Fatigue. .... ............. .. 152
67 Constant Damage Curves Obtained from Tests on[0/90/0/90/45/-45/45/-45] s - A Laminates under CompressionFatigue. ..... ..................... 153
68 Cumulative Damage Based on the Concept of Constant DamageState. .......... ........................ 154
vi
MUN I'

NADC-79056-60
1. INTRODUCTION
In the failure analysis of composite laminates, one of the most serious
problems has been the propagation of interlaminar cracking, commonly known
as delamination. This mode of failure is a major cause for the deterioration
of laminate structural properties, including its strength, stiffness, re-
liability and durability. Although delamination occurs initially as a local
damage, it can propagate rapidly to cause catastrophic laminate failure,
especially under compressive and/or fatigue loads.
The exact formation and growth mechanisms of interlaminar cracking in
laminates are not well understood. The general belief is that a certain
distribution of small interface flaws* exists in laminates prior to loading.
These are thought to be caused by factors such as poor fabrication, improper
handling, residual curing stresses, external impact damage, environmental
degradation, etc. Under a certain critical loading condition, some interface
flaws would grow and coalesce with each other, forming a single crack of macro-
scopic proportion.** At this dimensional level, such an event would constitute
the onset, or the initiation of the macro-crack, the delamination.
Experimental evidence indicates that upon the initiation of a delamina-
tion, the growth process may remain stationary in some laminates; while
The size of the interface flaws is of the order of the fiber diameter.For graphite-epoxy composite systems, for instance, this dimension isabout 4-5 um.
** Observable interfacial cracks are in the realm of the ply thickness, whichis two orders of magnitude larger than the size of fiber diameter in mostcommercially available graphite-epoxy systems.
1

NADC-79056-60
in others the process may be unstable and lead to catastrophic growth. Clearly,
the factors that influence the nature of delamination initiation and growth
are complicated. The exact cracking mechanisms may ultimately involve intri-
cate material, geometrical and loading interactions.
Early investigators focused mainly on experimental studies of free edge
induced delamination in laboratory test specimens [1-6]. The emphasis was to
determine the effect of laminate stacking sequence on tensile strength and
fatigue life. It was found that the laminates of particular stacking sequences
in which free-edge delamination occurred, always had a reduced strength.
The major cause of free edge delamination is the tensile component (normal
to lamina interface) of the interlaminar stresses that concentrate near the
laminate edge boundaries. The sign and magnitude of the interlaminar stresses
vary considerably with the stacking sequence of the laminate.
A considerable amount of effort in the past decade has been expended to
calculate analytically the free edge stresses in multilayered laminates [7-19].
While these edge stress solutions tend to explain qualitatively the observed
edge effects, they are still inadequate to provide a quantitative description
of the delamination failure process, including initiation and growth behavior.
Since the delamination cracking mechanism is essentially a fracture
problem, a description of the cracking process requires a fracture mechanics
analysis. In a recent series of papers [20-23], Wang, Crossman, et al.
reported on a fracture mechanics study of the free edge delamination problem
2

NADC- 79056-60
in graphite-epoxv laminates under simple tension. The analytical
approach employed is based on the classical fracture mechanics concept of
strain energy release rate [24]. A numerical (finite element) routine incor-
porating the technique of crack-closure [25] is developed to simulate the
delamination cracking process.* The method proved to be viable in describing
the delamination process, correlating with an experimental verification effort
which was conducted concurrently by Wang, et al. [23].
The main results obtained in the Wang/Crossman study are briefly dicussed
below:
a) One of the basic assumptions in the Wang/Crossman approach is that pre-
existing interfacial micro-flaws propagate and coalesce into a macroscopic
crack whenever a certain condition is reached due to the applied load. In
order to bring the microscopic effect to the macroscopic level, the concept
of "equivalent edge flaw" is introduced. Namely, the effect of the preexist-
ing micro-flaw distribution near the free edge on the initiation mechanisms
of delamination, is macroscopically equivalent to that of a single, large
crack of size ac. ac is thus an inherent material property of a given laminate
system.
b) As is postulated in the classical fracture mechanics [24], it is assumed
that strain energy is released, and is converted into surface energy whenever
delamination cracking is induced by the applied load. The rate of the avail-
able energy release per newly created cracking surface area, G, is the driving
force which extends the crack further. Of course, the capability of the
The numerical technique was first used by Rybicki and Kanninen [26] to
calculate the stress intensity factor by the crack-closure procedure.Rybicki, et al. [27] applied the method to calculate the energy releaserate in a stable delamination cracking problem.
3
......... ... .................... .. .." "......lI.II.I.. III.....II.I...I.I..I..I...i..i..nii....

NADC-79056-60
material to convert the strain energy into surface energy represents the
resistance (toughness) against further crack extension. The latter is the
well known critical energy release rate, denoted as Gc . The quantities Gc c
and a are the only two material parameters appearing in the predictivec
delamination growth model suggested by Wang and Crossman [20].
c) The behavior of the computed energy release rate, G, depends not only
on the applied load, but also on the interface location of the delamina-
tion and other geometrical parameters. In particular, the amount of strain
energy available for release is controlled largely by the laminate stacking
sequence, the lamina geometry (thickness of lamina) and the overall laminate
thickness relative to the size of the delamination. In short, G is strongly
influenced by the lamination structural dimensions at the ply level.
To summarize the above development, the simple case of free edge delami-
nation in laminates subjected to static tension has been experimentally studied
and analytically simulated. The latter was based on the method of the class-
ical fracture mechanics. Material, geometrical and loading parameters are
identified explicitly in a suggested delamination growth model. It is
therefore tempting to see whether or not this approach remains applicable
to other types of delamination processes under different sets of material,
geometrical and loading conditions. For instance, it is desirable to extend
the approach to problems involving compressive and/or fatigue loading. Also,
the growth behavior of an internal delamination rather than free edge delam-
ination is another practical laminate failure problem frequently encountered
in design.
4

NADC-79056-60
Thus, it is the purpose of the present study to expand the fracture
mechanics method to describe the mechanisms of delamination in graphite-epoxy
laminates, especially under compressive static and fatigue loads. In this
effort, four categories of delamination are studied. The first problem is
the simple case of free edge delamination under static tension, case a, Fig. 1.
The selection of this problem provides a ready check of the Wang/Crossman model,
and helps to define the necessary material constants, such as G and a . The
second problem is the free edge delamination under static compressive loading.
In this case, the material and geometrical conditions remain the same as in
the first problem; only the loading direction is reversed, case b. The third
problem is the delamination emanating from an implanted interlaminar defect. The
implanted defect is a thin teflon film strip (-150 micron thickness) imbedded
at the intended interface of the laminate, see case c, Fig. 1. The fourth
problem is similar except that the imbedded interlaminar deflect is in a
circular shape (- 6 mm diameter), see case d, Fig. 7.
In addition to studying the delamination mechanisms under static loading,
all four problems are also studied under constant amplitude fatigue loadings.
An understanding of the fatigue failure modes and the delamination growth
mechanisms is essential to the development of a deterministic cumulative damage
model which is necessary for the reliability analysis of laminated composites.
As far as delamination mechanisms are concerned, one of the central questions
is whether or not the mechanisms of damage are the same under static and
fatigue loadings. Recent experiments by Reifsnider, et al. [28] on damages
in laminates indicate that, given a type of laminate, there seems to exist
5
or~ .
NADC-79056-60
a damage state that is characteristic to the particular laminate, whether
* it be under static or fatigue loading. In addition, a certain load threshold,
or a fatigue life threshold can be determined, for which the characteristic
damage state occurs. These observations suggest that a law of deterministic
mechanics may be found, which relates the applied load to the fatigue life for
a given state of sub-laminate damage.
In view of this background, the present study also aims to use the
physical parameters identified in the static delamination problems in an
attempt to formulate a predictive deterministic model for delamination
growth under fatigue loads.
Needless to say, such an attempt, though ambitious, is only exploratory
at this stage. Gains as well as open questions encountered in this effort
will be discussed in the ensuing sections.
Section II discusses the experiment and the experimental results. When-
ever possible, factors influencing the mechanisms of delamination are identi-
fied and investigated in light of the experimental data.
Section III presents the analytical model and the associated numerical
technique. Problems studied in the experiment are then simulated numerically.
Here, the limitations of the present numerical method for treating the general
types of delamination crack are discussed. Future development of more
suitable methods have also been suggested in this section.
Finally, a deterministic cumulative fatigue damage model is formulated
in Section IV. The model is based on the results of both analysis and
experiment. A concluding discussion is given in Section V.
6

NADC-79056-60
II. EXPERIMENT AND DISCUSSIONS
1. Description of Experiments
In this study program, the experimental plan was designed to include
three major types of tests: (a) base-line laminate property tests, (b) static
load-delamination growth tests; and (c) fatigue load-delamination growth
tests.
The basic material system chosen for the experimental plan was the
Hercules Magnamite AS-3501-06 graphite-epoxy system. The material came
in prepreg form, and laminates were fabricated in accordance with NADC re-
quirements.* All test specimens were cut using a diamond saw, and end-tabbed
with fiber-glass laminates. Fig. 2 illustrates the general dimensions of the
tensile specimens, while Fig. 3 shows the general dimensions of the compressive
specimens. In each case, there are three types: one plain (without implanted
defects) and two with implanted defects, as indicated in Fig. 2 and Fig. 3.
All tests were performed on a closed-loop Instron hydraulic testing
machine. A specially designed test fixture was used for all the compression
tests. Fig. 4 displays the schematics of the compression test fixture. This
fixture is similar to that used in the Celanese compression test. No special
fixture was required for the tension tests.
The test environment for all tests was maintained at a room temperature
(25*C) and ambient humidity (- 60% R.H.) condition. Other details of the
individual tests are given in the following:
* All laminates were layed up at Drexel University and cured at NADCfacilities. 7

NADC-79056-60
(a) Base-line Property Tests - The purposes of the base-line tests were to
qualify the material system and the laminate fabrication processes, and to
determine the material constants that are necessary in the analysis models.
For purpose of determining the basic lamina properties, uniaxial stress-
strain diagrams* for the [O12], [9012], [±45]2s laminates were obtained under
tension loading, and for the [012] , [±45]2 s under compressive loading.
Included in the basic lamina properties were also test findings of [0121
fiber contents and specific gravity. Specific gravity was determined by
weighing and measuring a volume of the material. Fiber content was deter-
mined from photomicrographs of the untested unidirectional material.
Static stress-strain diagrams were also obtained for the following
laminates; for static tension,
[02/902 /452 /-4523s
[902/02/-452/452]s
[0/90/0/90/45/-45/45/-45] ]
[90/0/90/0/-45/45/-45/453
[45/-45/0/902]s
[-45/45/90/0 21s
and for static compression,
[02/902/452/-45 21s
[902/02/-452/452]s
[0/90/0/90/45/-45/45/-45]
2ss[45/-45/0/90 21s
._
* A 90°-strain gage rosette was used to measure the longitudinal andtransverse strains for both tension and compression tests.
8

NADC-79056-60
In all these static tests, tension or compression, the loading was main-
tained at a constant cross-head displacement rate of 0.012 cm/min.
Table I summarizes the individual tests and the number of specimens
used in each test.
(b) Static Load-Delamination Growth Tests - The purpose of this series of
tests is to develop an understanding of the load-delamination growth relation-
ship for the various laminates under both static tension and static compression
loadings. In order to reliably determine the load at onset of delamination,
and to document the load-growth relation, a step-loading scheme was employed.
Briefly, each specimen is subjected to step-loading with small increments.
After each step-load, the specimen is removed from the tester and inspected
by x-radiographing for any damages that may occur during the step-load. The
specimen is then reloaded for the next step-loading, x-ray inspection, and
so on.
The following laminates were step-loaded in tension:
[02/902/452/-452 s
(902/02/-452/4523s
(0/90/0/90/45/-45/45/-45 ]s
[90/0/90/0/-45/45/-45/45]s
[45/-45/0/902 ]
[-45/45/90/021
[45/-45/0/9021 - type A
[45/-45/0/902] - type B
and the following laminates were step-loaded in compression:
9

-wI
NADC-79056-60
[012]
[02/902/452/-45
[ 90 2/0 2/-45 2/45 21]s
[02/902/452/-452]s - type A
[02/902/452/-45 Is - type C
[0/90/0/90/45/-45/45/-45 ]s
[0/90/0/90/45/-45/45/-45] s - type A
[0/90/0/90/45/-45/45/-45]s - type C
(45/-45/0/9021s
In the above, those laminates designated as type A have an implanted
interface defect consisting of a 0.25 in. (6.35 mm) Teflon strip; type B
laminates have a 0.5 in. (12.7 mm) Teflon strip, and type C laminates have
a circular Teflon disk of 0.25 in. (6.35 amo) in diameter. All defects are
located at the mid-plane of the laminates; see Fig. 2 and Fig. 3.
Table 2 summarizes these tests and the number of specimens used in each
test.
(c) Fatigue Life - Delamination Growth Tests - The purpose of this series
of tests is to establish the fatigue load-life-damage interrelationships of
the laminates under either tension-tension or compression-compression fatigue
loadings. All tests were conducted under constant amplitude load cycling with
a minimum to maximum load ratio, R - 0.1, at a frequency of 5 Hertz.
Again, in urder to determine the life (number of cycles) at onset of delami-
nation, and to document the life-damage-growth history, specimens are
periodically removed from the tester and inspected by x-radlography. In each
type of laminate, at least three fatigue load levels were selected for the
10

NADC-79056-60
fatigue tests. In general, all the selected fatigue load levels are below
the static load for which onset of delamination occurs.
The following laminates were studied in tension-tension fatigue:
[45/-45/0/902]S
[45/-45/0/902] s - type A
[45/-45/0/902]s - type B
and the following laminates were studied in compression-compression fatigue:
[45/-45/0/90 2]s
[02/902/452/-452 s
[0 2/90 2/452/-452] s - type A
[02 /902 /452/-452 s - type C
[902/02/-452/452] s
[0/90/0/90/45/-45/45/-45]1
[0/90/0/90/45/-45/45/-45] - type A
[0/90/0/90/45/-45/45/-45] - type Cs
Table 3 summarizes these tests, the number of fatigue load levels and
the number of specimens used in each test.
2. Discussion of Experimental Results
(a) Base-line Property Tests - Results from all the static property char-
acterization tests were within the normal range of values for this material.
Average properties for each of the laminates are summarized in Table 4. In
particular, the basic properties obtained from the unidirectional laminates
are:
11

-7
NADC-79056-60
Tension Compression
EL 140 GPa 137 GPa
ET 11.1 GPa -
V LT 0.29 0.28
VTL 0.027 -
GLT 5.6 GPa 5.4 GPa
Fiber volume, % 66.5
Sp. gravity 1.55
It is noted that the longitudinal Young modulus EL and Poisson ratio v LT
from both the tension test and the compression test are essentially the same.
Also, in obtaining the in-plane shear modulus GLT for the unidirectional laminate,
data from [+4512 s were used. Specifically, the average values for E and v-- x xy
found from [+45)2 s are used in computing GLT approximately by the formula:
GLT E x/2(l + vxy .
The values of G calculated using tension test results and using compressionLT
test results are also very close; see Table 4.
However, the values for the compressive strength from Table 4 should be
viewed with caution. They are uniformly lower than the tensile strengths,
especially for 0-ply dominant laminates. It is suspected that the ultimate
compressive laminate failures may have involved some degree of structural
buckling.
(b) Static Load-Delamination Growth Tests - In this series of tests, eight
different laminates were tested under step-tension loading, and nine different
laminates were tested under step-compression loading. In each case, the
various parameters effecting delamination have been investigated.
12

NADC-79056-60
Delamination Growth by Tension
The first group of laminates examined were the quasi-isotropic laminates,
(02/902/452/-452] and [902 /02/-45 /-45] s . In each case, three specimens
were tested. The difference between the two types of laminates is basically
the stacking sequence of the 0*-ply and the 90*-ply. Under uniaxial tension,
both laminates suffered transverse cracking in the 90*-ply during the early
stage of loading. As the applied load increased, cracks were observed
in the +450 plies at about 80% ultimate load. Edge delamination in the +450
interface was first observable at about 90% ultimate load. Both laminates
failed at essentially the same ultimate load of 540 MPa (68.4 ksi).
Fig. 5 displays the load-sequence x-radiographs of a [02/902/452/-4521s
laminate under tensile loading. It is seen that transverse cracks in the
90°-direction are visible from about 255 MPa load. The crack density increases
with the applied load until +450 cracks appear at about 426 MPa. These +450
cracks increased rapidly with load, causing edge delamination which initiated
at about 520 HPa. The delamination propagated unstably, resulting in laminate
failure at 540 MPa.
A set of similar load-sequence x-radiographs for the [902/02/-452/452]
laminate is shown in Fig. 6. Here, it is observed that onset of 90* trans-
verse cracks occurred at about 234 MPa, onset of +450 cracks occurred at
about 380 MPa, and onset of edge delamination at 442 MPa. The final laminate
failure occurred at 540 MPa; this is the same load as in the [02/902/452/-452]
laminate shown in Fig. 5. A comparison between these two sets of results is
given in the following:
laminate Onset stress, MPa
90*-crack +450-crack edge delam. final failure
[02/902/452/-45 2] 255 426 520 540
(902/021-452/452]s 234 380 442 540
13

NADC-79056-60
Clearly, the onset stresses for the different cracking events are
uniformly lower in the second laminate than in the first. Also, it seems
that growth of edge delamination is the cause of final failure for both
laminates. The difference exhibited by these two sets of results are ex-
plained by the energy analysis, which is to be discussed in Section III.
The second group of laminates examined were [0/90/0/90/45/-45/45/-45)s
and [90/0/90/0/-45/45/-45/45]s. These are simply the same two quasi-isotropic
laminates examined previously with their stacking plies dispersed, so that no
two plies of the same fiber orientation are stacked together. By dispersing
the stacking plies, the laminate stiffness properties do not change, see
Table 4. However, the behavior of the sub-laminate cracking events is changed
by ply-dispersion. In the step-tension tests, both laminates showed 90' -
cracking at the applied load of 434 MPa; neither +450 -cracking nor edge
delamination was observed before the laminate final failure. Furthermore, the
final laminate failure load for both laminates was over 620 MPa, or 15% higher
than the undispersed laminates.
These results show clearly the influence of ply thickness on the sub-
laminate cracking behavior as well as the final strength of the laminate.
Energy analysis on this subject is also included in Section III.
The next group of laminates tested were the [t45/0/902]s series. Three
types were examined: the plain (without implant), the type A (with 1/4" Teflon
strip implanted) and the type B (with 1/2" Teflon st'Ip implanted); see
dimensions given in Fig. 2.
When loaded in tension, tensile edge stress a is induced throughout the
900-plies. This a stress is thus responsible for edge delamination in the
900-plies. Test results show the following cracking activities:
14

NADC-79056-60
90*-crackings occurred at about 131 MPa in the plain laminates,
and occurred at about 103 MPa in both type A and type B laminates. Edge
delamination became observable at about 223 MPa in the plain laminates, and
about 180 MPa in type A and type B laminates. All three types had the same
average failure stress of about 438 MPa. These results are summarized in the
following
type of laminate r onset stress, MPa90-cracking edge delam. final failure
[+45/0/90] s 131 223 443
type A 103 179 436
type B 103 172 435
Clearly, the presence of interlaminar defects in the type A and type B
laminates has some measurable adverse effect on the initiation of transverse
cracking and edge delamination. But the final failure load of the laminates
is not affected. This suggests that the growth behavior of the sub-laminate
cracking events is probably quite stable, and that the extent of sub-laminate
damage prior to final failure is also the same in all three types of laminates.
Indeed, from the load-sequence x-radiographs shown in Figs. 7, 8 and 9, it is
seen that in all cases, free edge delamination growth is extremely stable.
The influence of the implanted defect becomes insignificant as the applied
load approaches its ultimate.
Fig. 10 illustrates graphically the 90*-cracking and edge delamination
growth as a function of the applied load. It is seen that the planted inter-
laminar flaws had little effect on the growth behavior. It is essentially
negligible as the applied load reaches the ultimate.
Again, energy analysis of the cracking events for this series of
laminates is included in Section III.
15

NADC-79056-60
Finally, several specimens of [+45/90/02] s configuration were also
tested. An interlaminar edge stress analysis would show that the edge normal
stress c is compressive. Thus, no delamination is expected in such a
laminate configuration. In the step-loading experiment, some 90°-cracking was
observed from about 820 MPa which is 88% the ultimate strength of the laminate
(a uit = 935 MPa). Even prior to final failure, there was no noticeable +45* -
cracking or free edge delamination observed.
Table 5 summarizes all the test results obtained for the eignt types of
laminates. Major findings from this series of tests may be briefly stated
as follows:
(1) Between the laminates [02/902/452/-4521 s and [902/02/-452/452]s, very
little difference exists in terms of laminate behavior, including their
stiffnesses and the stress states. Initiation of 90*-cracking
occurred early in the loading for the second laminate. This sub-
laminate damage event influenced, in turn, an early onset of +45* -
cracking and edge delamination in the +450 interface. Although the
ultimate load for both laminates was the same, the process of damage
development before final failure is not.
(2) Between the laminates (02/902/452/-4521s and (0/90/0/90/45/-45/45/-45]s,
the difference exhibited in sub-laminate damage development is significant.
The following comparison shows their strikingly different behavior
Onset stress, MPalaminate 90*-cracking +45* cracking Edge Delam. Final failure
02 /902/452 /-4521s 255 426 520 540
[0/90/0/90 .... ]s 434 - - 607
16

NADC-79056-60
The effect of ply thickness on both crack initiation and growth behavior
is clearly demonstrated here. It is an important parameter in the
fracture mechanisms associated with these cracking events.
(3) For the [±45/0/902] s series, the effect of implanted interlaminar defect
is relatively unimportant if the laminates are under tension (static
loading). The defects do cause early initiation of damage growth,
emanating from the defect. This could be a factor in situations where
unstable damage growth is dominant, however.
Delamination Growth by Compression
Two major groups of laminates were tested by static step-compression.
The first group consisted of the [02/902/452/-452]s laminates, and included
those with a Teflon strip implant (type A), and those with a Teflon circular
disk (type C) implanted in the mid-plane. The purpose of testing this grouped-
ply laminates was simply to see the effect of the implanted defects on
delamination under compressive loading.
The second group of laminates were the "dispersed" laminates; namely, the
[0/90/0/90/45/-45/45/-45]s and included both type A and type C implants. lhub,
between the two groups, the Ply-grouping effect on delamination can be
evaluated for the compression loading cases.
In addition, some [012], [902/02/-452/452]s and [+45/0/902] s laminates
were also tested by step-compression. For [012], it was hoped to detect any
fiber splitting during the step-loading, or any other matrix-dominated crack-
ing prior to final failure. As for the [902/02/-452/452]s , its behavior should
be identical with the [0 2/92/452/-4521 under compression. And, of course,
the [+45/0/902 ]a should exhibit no delamination under such loading, as well.
17

NADC-79056-60
Figs. 11, 12 and 13 show, respectively, the load-sequence x-radiographs
of the [02/902/452/-452] s, type A and type C laminates. Free edge delamination
was observed at various loading levels, depending on the type of laminates.
The following shows the onset loads at delamination and failure:
laminate Onset stress, MPaEdge delaM. final failure
[02/902/452/-4521 s 339.2 369.5
[02/902/452/-452]s- A 131.0 286.0
[02/902/452/-452]s - C 252.0 331.0
(902/02/452/-452]s 316.0 320.0
From the above, it is seen that in the plain [02/902/452/-452] s and
(902/02/452/-4521s laminates, onset of edge delamination led immediately to
final laminate failure; the growth of delamination was unstable.
In the type A laminates, the implanted teflon strip is exposed at the
free edges. This defect caused an early but stable edge delamination growth,
as is seen in the x-ray pictures depicted in Fig. 12. This growth also pre-
cipitated a lowered final failure stress for the laminates (about 25% lower).
The implant in the type C laminate is in the interior; it has no effect
on the free edges of the laminates. Initially, there are two independent delam-
ination initiators, the implant and the free edges. Apparently, the implanted
circular disk had less effect on delamination than the free edge. As is
seen in the load-sequence x-ray pictures in Fig. 13, edge delamination was
the first event to occur. Once edge delamination started, however, the
internal circular patch affected the growth behavior, resulting in a lowered
final failure load for the laminates.
18

NADC-79056-60
The delamination growth behavior of these three types of laminates is
illustrated in Fig. 14 where the amount of delamination growth (in % of
delaminated area) is plotted against the applied load. It is seen that
delamination growth in the [02/902/452/-4521s laminates is almost catastropic
following the initiation. Type C laminates had a relatively stable growth,
while type A laminates had the most stable growth. The effect of the inter-
laminar defect on delamination was significant. This is in contrast with
the results from tensile step-loading, where the effect of interlaminar
defects on delamination was relatively insignificant; see Fig. 10.
Figs. 15, 16 and 17 display the load-sequence x-radiographs for the three
types of laminates in the second group. Recall that in this group, the ply
stacking sequence of the previous laminate is dispersed. The following table
shows the comparisons of the onset loads of delamination and final failure for
these laminates:
laminates Onset stress, MPaedge delam. final failure
[0/90/0/90/45/-45/45/-451 379.2 425.4
(0/90/0/90/45/-45/45/-45] - A 138.0 382.6
[0/90/0/90/45/-45/45/-451 s - C 265.4 365.4
Again, it is seen that edge delamination was the initial damage event pre-
cipitating failure in all the laminates. The effect of an interlaminar defect on
the initiation of delamination remains as significant as in the previous un-
dispersed laminates. Fig. 18 illustrates the various delamination growth
developments as functions of the applied load.
Between the two groups of laminates, the undispersed and the dispersed,
the important difference is again caused by the parameter of ply thickness.
Fig. 19 shows the delamination growth behavior between the undispersed and
the dispersed laminates. 19
1now

NADC-79056-60
Table 6 sumarizes all the results obtained in this series of
tests. It is clear that interlaminar defects have a significant adverse
effect on delamination when the laminates are subjected to compression. In
addition, the ply thickness parameter continues to play an important role
in the delamination growth processes.
(c) Fatigue Life - Delamination Growth Tests - In this series of tests, both
tension-tension fatigue and compression-compression fatigue tests were
conducted. Details of test results are discussed in the following.
Tension-Tension Fatigue Tests
In the tension-tension fatigue experiment, only the [±45/0/902]s and
the associated type A and type B laminates were tested. For the [+45/0/9021s
laminates, five fatigue load levels were selected. These were one load level
below, three load levels above, and one load level at about the static
onset load of transverse cracking in the 90*-plies. The purpose of these
tests was to establish some quantitative damage growth rates in terms of the
fatigue load and the fatigue life. A typical life-sequence of x-radiographs
for the [+45/0/9021 s laminate tested under of = 189 MPa is shown in Fig. 20.
Since the maximum fatigue load is higher than the static onset load for
transverse cracking (at 131 MPa), it is seen from the x-radiographs that
multiple 90*-cracks occur very early during the fatigue loading. As the
fatigue cycling increases, the crack density also increases. At about
1000 cycles, free-edge delamination becomes identifiable. The delamination
then grows with increasing fatigue cycles.
Fig. 21 shows the growth of the 90*-cracks as a function of fatigue
cycles, while Fig. 22 displays the delamination growth. It is seen from these
figures that free edge delamination at all fatigue load levels occurs whenever
20
........................... .........

NADC-79056-60
the transverse crack density reaches 8 -10 cracks per cm. From there on, edge
delamination becomes the dominant damage mode, which leads steadily to final
laminate failure. Both Fig. 21 and Fig. 22 suggest a certain damage
growth rate dependent upon the maximum fatigue load, of, and the cyclic loading
history, N. The exact form for such a growth model will be discussed in
Section IV.
The effect of interlaminar defects on this laminate series under tension
fatigue may be determined from thex-radiographs taken for a [+45/0/902] - A
laminate and a [+45/0/902] - B laminate, shown respectively by Fig. 23 and
Fig. 24. Both laminates were cycled under a maximum fatigue load of 189 MPa.
It is observed from both cases that 90*-cracking occurs early in the fatigue
life, followed promptly by edge delamination eminating from the inter-
laminar flaw. Thus, the presence of different interlaminar flaws had only
a small effect on the growth of 90*-cracking, but precipitated early delami-
nation initiation. Fig. 25 shows the delamination growth under the same
fatigue load (189 MPa) for the three types of laminates. Clearly, the effect
of implanted flaws is significant enough that it should not be disregarded,
although its effect on static tension strength was found to be minimal.
Results obtained from tests at other fatigue load levels are summarized
in Table 7.
Compression-Compression Fatigue Tests
As in the case of the static compression tests, two major laminate
series were also tested under compression-compression fatigue loads. These
two series were (a) the [02/902/452/-452]s and the associated type A and
type C laminates, and (b) the dispersed [0/90/0/90/45/-45/45/-45] and the
21

NADC-79056-60
associated type A and type C laminates. In addition, laminates of [+45/0/902] s
and 902 /02/-452/4521s were also tested. In each case, two or three fatigue
load levels were selected; see Table 8.
For the [02 /902/52/-452]., type A and type C series, typical x-radio-
graphs are displayed, respectively, in Figs. 26, 27 and 28. These were all
under a 222 MPa maximum fatigue load. This load is much higher than the
static onset load for delamination for type A laminate (131 MPa), but is lower
than that for the plain and the type C laminates (339 MPa and 252 MPa, re-
spectively). Thus, in the case of type A laminate, edge delamination was
found during the first cycle of loading. Growth of delamination was rather
stable until fatigue life exceeds 104 cycles. For the plain and the type C
laminate, delamination occurred later in the fatigue life but with a faster
growth rate.
Fig. 29 shows the delamination growth curves obtained from three fatigue
load levels for the plain laminates. The growth rates in these curves are
higher compared with those found under tension fatigue. The same growth
behavior is observed also for the type A and type C laminates, see Fig. 30
and Fig. 31, respectively. Both show an accelerated growth rate under com-
pression fatigue. This result is thought to be due to the buckling action of
the test specimen under compression. This behavior must be considered in any
growth model formulation.
The effect of implanted interlaminar flaws is illustrated in Fig. 32.
Under a 221 MPa fatigue load, it is seen that edge delamination initiates
at different lives depending on the type of flaw implanted. For instance,
type A laminate suffers delamination at the first cycle, type C begins to show
delamination at about 200 cycles, while the plain laminate shows delamination
at a life exceeding 2000 cycles. The rate of growth in all three cases takes
22
hL

NADC-79056-60
a sharp increase at about 25% delamination, and the fatigue lives of all
three cases remain within one decade of variation of each other.
The purpose of testing the (0/90/0/90/45/-45/45/-45]s and the associated
type A and type C laminates was again to assess the effect of Ply-grouping
when the loading condition is compression-compression fatigue. In the exper-
iments on this series of laminates, the same general behavior was found as in
the previous series. In all cases, edge delamination was induced under the
fatigue loads, and while the effect of the implanted flaw was noticeable, it
was not significant.
Figs. 33, 34, and 35 illustrate respectively, the growth of delamination
by a life-sequence of x-radiographs for the plain (under 276 MPa),
type A and type C (both under 219 M a) laminates. From these x-radiographs,
delamination growth curves can be obtained. Fig. 36 shows a typical set of
delamination growth curves for the type A laminate under three different
fatigue load levels. It is noted that these curves are similar with those
found earlier for the [02/902/452/-452s series, except that delamination
growth is suppressed by the dispersion of the plies.
In order to see the ply-grouping effect more quantitatively, examine
the comparative growth curves shown in Figs. 37, 38, and 39. In all
cases, the dispersed laminates, whether they contain implanted flaws or not,
display a much "stronger" behavior against delamination than their undispersed
counterparts. The dispersed laminates show more than 2 decade longer life
than the undispersed. This significant simple geometrical parameter is seen
to have a dominant effect on the failure mechanisms of the laminates.
23

NADC-79056-60
Finally, test results for the [+45/0/90218 and [902/02/-452/452]s
laminates were as expected. The [+45/0/90)] failed in fatigue without
any edge delamination, and the [902/02/-452/452]s behaved similarly to
[02/902/452/-4521s
All these results are summarized in Table 8.
24

NADC-79056-60
II. AN ENERGY METHOD FOR SUB-LAMINATE CRACK GROWTH
In this section, the approach being taken in the development of a crack
growth model will be described. To this end, a brief review is presented
describing the major sub-laminate crack mode and the classical fracture con-
cept of strain energy release rate. Finally, the cracking events documented
from experiments will be analyzed using the energy model presented in this
section.
1. Physical Processes of Transverse Cracking and Edge Delamination
Examination of the earlier test results show that matrix and/or
matrix-fiber interface damage almost always precedes the laminate failure.
Particularly, 90*-cracking (transverse cracks) and free-edge delamination have
been identified as the two major damage modes which precede the final failure
in the laminates studied in this report. In order to properly model each of
these cracking processes, a closer analysis of the mechanisms of these events
becomes essential.
(a) Transverse Cracking Process Transverse cracks form in plies when a
sufficiently large tensile stress exists transverse to the fibers. Consider,
for example, a cross-ply (0/90) laminate which is subjected to tension in thes!00-direction; at some critical stress level, the 900-ply begins to suffer
transverse cracks. Laboratory experience indicates the following characteris-
tics of the transverse cracking process:
Reproducible Onset Load In a given population of identical specimens sub-
jected to identical test conditions, the critical load at initiation of
transverse cracking is surprisingly reproducible, especially in view of the
large scatter experienced in material properties (such as the transverse strength
of a 90*-laminate). This suggests that the transverse crack initiation
mechanisms are predominantly influenced by the geometrical conditions surround-
ing the crack, rather than by the material property variations.
25
NADC- 79056-60
Thickness Effect and Shear Lag X-radiographs in earlier experiments showed
that transverse cracks in the 90°-ply generally follow the matrix-fiber inter-
face; in a trans-thickness view, such as sketched in Fig. 40, the crack is
believed to form inside the 90°-ply, and extend vertically across the 90°-ply,
eventually terminating at the 0°-90° interface. Clearly, the outside 0-plies
must have a restraining and arresting effect as the transverse crack approaches
this interface.
If strain energy is released as the transverse crack propagates, it is
easy to see that the farther a transverse crack is allowed to propagate (i.e.,
the thickness of 90e-ply is larger) the greater the strain energy released
by the propagating crack. Thus, from the energy point of view, a thin
900-ply layer can provide only a small amount of energy release. Consequently,
a higher applied load is required to propagate a crack in the thin 90@-ply
layer. This, of course, is consistent with the experimentally observed
thickness effect, discussed extensively in Section II.
After the transverse crack is arrested at the 00/900 interface, the load
normally carried by the 90'-ply before the crack must now be transmitted
through the 0°/90 ° interface, creating a local region of interlaminar shear
stress distribution, called the shear lag. Obviously, the size of the shear
lag depends again on the thickness of the 900-ply layer. Generally, it is
about 4-times the thickness of the 90°-layer.
Theoretically, if the material properties of the 90*-layer are perfectly
uniform, then any two adjacent transverse cracks must maintain a minimum dis-
tance equal to the shear lag. Thus, at the onset of transverse cracking, one
would actually see multiple cracks that are separated by the shear-lag spacing.
This has been referred to as the "characteristic spacing" by Reifsnider,
et al. [28].26
.. ~~~~~~ ~~........... ... -- .................... ,.... .. ........... ................ , ,.

NADC-79056-60
In actuality,however, the variability of the material properties distortes
the so-called "characteristic spacing." The growth of the transverse
cracking is a continuous function of the applied load, as observed in the
earlier experiments. The lack of a "characteristic spacing" complicates the
definition of cracking initiation; and necessitates a statistical approach
to address the random nature of the material variability.
Effect of Transverse Cracking on Edge Delamination The aforementioned shear-
lag region may suffer local damage in the form of delamination, due to the
concentration of interface shear stress near the transverse crack-tip. Since
the size of the shear-lag is proportional to the 90*-ply layer thickness, the
likelihood of transverse cracking induced delamination also increases with the
90*-layer thickness. Thus, a laminate which is already delamination prone due
to edge effects will suffer a compounded delamination growth if it under-
goes simultaneously transverse cracking. Such an interacting effect is 3-
dimensional in nature, and requires 3-dimensional crack-modeling.
(b) Edge Delamination Process As has been discussed earlier in Section I,
edge delamination stems from the boundary edge stresses which exist along ply
interfaces near the laminate free edges. These interlaminar stresses
can be computed accurately by a stress analysis based on ply elasticity.
Again, consider as an example the (0*/90*) laminate subjected to uniaxial
tension. An edge stress analysis will show (see e.g., Ref. 14) that a tensile
a stress exists throughout the 90*-ply layer, and a combination of tensile az z
and shearing Txz exists along the 00/900 interface. Under these stresses, a
mode-I crack along the mid-plane (900/900 interface), or a mixed-mode crack
along the 0°/900 interface are both possible, depending on which of the two
possible sites meet the cracking conditions.
27

NADC-79056-60
Furthermore, the edge stresses exist only within a small boundary edge region.
The size of the boundary region is kqain found to depend on the thickness of the
layers along whose interface the edge stresses are distributed. Hence, the
thicker the material layers, the larger the size of the boundary region. If
an interlaminar crack is to form in this region, it may be inferred again that
the available strain energy released during the formation of the crack is
limited by the layer thickness. Or, alternatively, the critical load at onset
of edge delamination depends on the material layer thickness. This is
also clearly consistent with the experimental results.
Once the free edge crack is formed, the boundary region propagates inward
to the interior of the laminate. If the width of laminate is large compared
to the size of crack, stable growth will follow. Otherwise, the growth may
become unstable.
The foregoing physical analyses are based primarily on experimental
observations. With this understanding, the development of a descriptive model
will be presented next, on the basis of the energy release rate concept.
2. The Strain-Energy Release Rate Concept
The concept of the strain energy release rate as a fracture growth criterion
for brittle cracks in elastic solids is of long standing. In his first
paper published in 1920, Griffith [29] attributed the ultimate tensile strength
of glass to the propagation of crack-like surface flaws; stress concentration
surrounding the worst (largest) flaw cause unstable propagation. He
postulated that a change (increase) in the crack size causes a decrease in the
stored strain energy near the crack-tip; at the same time, the solid body
increases its surface area so that the total surface energy is also increased.
28

NADC-79056-60
Let U be the strain energy and S the surface energy; then for an initial flaw
of size a, a crack growth is induced if
a-u Z 2- (3-1)
The quantity aU/aa depends on the stress field near the crack-tip which
in turn depends on the geometry of the crack and the magnitude of the applied
load. This quantity represents the driving force, and is commonly referred to
as the available energy release rate, G(a). The quantity aS/aa depends on
the microstructure of the material and the magnitude of the molecular bond;
it is thus considered a material property, representing the resistance of
the material against crack growth. It is also commonly called the critical
energy release rate, G . For most materials, Gc is a constant, independentC c
of the crack size or the applied load (but may depend on the crack direction).
The Griffith crack growth criterion, (3-1) may be rewritten in the form
G > G . (3-2)- C
(a) The Crack-Closure Representation From an elastic energy balance con-
sideration, Irwin [25] showed that the strain energy released in an incre-
mental crack extension can be equated to the amount of work done required to
close it again. Let Aa represent an infinitesimal crack extension from the
initial crack of size a, as shown in Fig. 41. Let A be the relative dis-
placements between the mating surfaces along Aa when the crack extension is
open, as in Fig. 41(b); let Z be the surface stresses along Aa when the crack
extension is closed, as in Fig. 41(c)
Then, the work done in closing the crack extension Aa can be expressed as
AaAW J 0 .Au da (3-3)
29
-- .. . . . I ff . .. _ _ ,~i, ... . . . .. .... . . . ..

NADC-79056-60
By Irwin's elastic energy balance, the strain energy release rate correspond-
ing to the crack of initial size a is given by
G = l 1 Aa Au da (-4)
Aa-0O 2a j0 (
Substituting the normal and shearing stress components of the surface
stress B, and the relative displacement Au into (3-4), the modal components
of G are obtained as
lim 1 (Aa
G im1fa TA da(35
I Aa-*O 2Aa 0 dy
lim 1 fAaGI Aa 2Aa 0 x Au da (3-5)
G - lim 1 fAa AwdaIII Aa-0 MAa 0 yz
where Gi, GII and GIII are, respectively, the energy release rates correspond-
ing to the mode-I, mode-Il and mode-Ill crack opening, such as illustrated in
Fig. 42. The total energy release rate of the generally mixed-mode crack ex-
tension is given by
G - GI + GII + Gi11 (3-6)
(b) The Finite-Element Scheme In order to evaluate the integrals in
(3-4) or (3-5), the exact stress field near the crack-tip must be determined.
But, the stress field surrounding a sharp crack is singular in nature; and
in a generally anisotropic solid, the mode-I, mode-lI and mode-Ill cracking
actions are mutually coupled. Thus, the crack-closure representation of
Irwiu's must be adapted by applying a finite element approximation for
problems involving complicated layering structures. A technique of
30

NADC-79056-60
nodal-release-and-close has been implemented recently by Wang and Crossman
[20] to approximate the Irwin integrals of (3-5). Fig. 43 illustrates the
finite element representation of the crack-tip region shown in Fig. 41(a).
Here, the crack of size a is shown with the crack-tip at node C. Under a
given far field loading condition, the displacements of node C, Uc can be
determined by the finite element solution. Then, a small incremental crack
extension (self-similar, for instance) Aa is introduced by opening up node C,
with node C becoming two separate nodes f and g, as shown in Fig. 43(b). A
new round of finite element solutions is obtained, given the new crack geometry
(the far field loading condition remains unchanged). This provides the nodal
displacements of node f and node g, denoted respectively by -?f and ig. Theg
last step is to force-close node f and g to return to the original position
of node C by prescribing the common displacement 5 for both node f and node g.c
The finite element solution of the last step gives the necessary nodal force
F required for the closure. The work done in the process of a finite crack-c
closure is given by
A= [Fx(uf-Ug) + Fy(vf-vg) + Fz(wf-Wg) ] (3-7)
Thus, for approximation, the strain energy release rate G may be
expressed as *
G = AW/Aa. (3-8)
• The adequacy of this kind of approximation has been a source of great con-
cern. A more detailed assessment of such approximation is found in Ref. [20).
31

NADC-79056-60
Consequently, the modal components of G corresponding to the initial crack
of size a are represented by
GI = Fy(Vy-Vg)/2ba
GII - Fx(uf-ug)/ 2 a (3-9)
I Gill Fz(Wf-Wg)/2 a
By successively opening and closing the nodes along a prescribed crack
path, the energy release rate G can be computed as a function of the extend-
ing crack's size, i.e., G - G(a) under a given far-field loading condition.
(c) Sub-laminate Crack Initiation and Growth Criteria In this study, the
only sub-laminate cracks investigated are the 90*-cracking and the free-edge
delamination. In order to set up a crack initiation and growth criterion for
each of the two types of cracking, it is assumed that micro-flaws exist
along the fiber-matrix interface, and also along the ply-to-ply interface.
These flaws are generally of a size in the order of the fiber diameter. This
dimension is in the realm of micro-mechanics, whose crack propagation mech-
anisms will not be dealt with here. Instead, it is postulated only that these
micro-flaws would propagate and coalesce into a macroscopic proportion under
a certain critical far field loading condition. The resulting crack is
recognizable only at the macro-scale, where the basic axioms of ply-elasticity
are valid*. The minimum crack size first formed at the macro-scale depends on
the micro-structure of the material (perhaps also on a host of other material
processing factors, such as the curing process, post-cure handling, etc).
* One of the basic axioms in ply-elasticity is that within each layer the
material is represented by a homogeneous, anisotropic medium. Material dis-continuity exists only across the interface of two different material layers.
32

NADC-79056-60
This minimum macro-crack size is also called the critical flaw size, denoted
by ac. The value of ac is generally unknown and can be random in nature. It
is then regarded as a material property at the macroscopic level.
The Griffith criterion of (3-2), when applied to predict the initiation
of a sub-laminate cracking, is replaced by
G(ac ) > G . (3-10)
And, the stability of growth following initiation is governed by the
conditions:
G(a + Aa) < C ; stable growth (3-11)c
G(a + Aa) > G c; unstable growth (3-12)
and
G(a + Aa) - Gc; neutral growth (3-13)
where a(> ac) is the instantaneous crack size for which the growth stability
is to be determined.
3. Finite Element Models
In the foregoing discussions, the available energy release rate function
G(a) was left in general terms. For the specific modeling of the transverse
cracking and free edge delamination, G(a) must be appropriately calculated
by the finite-element crack-closure procedures discussed earlier. Details of
the specific models are discussed in the following.
(a) Transverse Cracking Model The finite element representation for the
transverse cracking is illustrated in Fig. 44. Under the idealized cracking
geometry as shown in Fig. 44(a), the growth path of the crack is represented
by Fig. 44(b). The solution domain is in the 2-dimensional x-z plane,
33

NADC-79056-60
although the plane may undergo warping in the y-direction. Thus, a generalized
plane strain formulation (see, e.g., Ref. (14]) was adapted in the finite
element routine.
Fig. 45 shows a typical finite element mesh for the growth of transverse
cracking. As has been postulated previously that an initial macro-flaw of
size a exists in the 90*-plies, and this crack can be propagated to reach thec
interface of the face-plies as shown in the figure. Hence, if the laminate is
subjected to a uniaxial tension represented by a far field uniform displace-
ment 6, the energy release rate function C(a) may be calculated and expressed
by
G(a) - [C (a)e It, a > a (3-14)e x c (-4
where t is a characteristic length (e.g., thickness of a ply) and e is thex
far field laminate strain induced by S. The coefficient function C e(a) is
calculated by imposing e - 1.x
Fig. 46 shows the general behavior of C e(a) for the crack in the lami-
nate shown. Note that the crack size a is limited by the thickness of the
90*-layer, b. The strain energy available increases initially with the in-
crease of cracking size; as the crack approaches the ply interface, the
available energy begins to decrease; the rate of decrease depends on the rel-
ative rigidity of the outside layer. Generally, a maximum is located at about
a - 0.9b.
Similarly, if the laminate is subjected to a uniform temperature drop
of At, and if tensile stress in the 90*-layer is also induced, then the calcu-
lated energy release rate function for the transverse crack is expressed by
G(a) - [CT(a)AT2]t, a > a . (3-15)
34

NADC-79056-60
Typical behavior of CT(a) for a transverse crack is similar to that of
C (a), as shown in Fig. 46. Again, CT(a) is generated by imposing AT - 1.e
In practice, all laminates are subjected to thermal residual stresses
before test; and its effects on sub-laminate cracks are not insignificant.
The effect of such residual stresses may be simply included in the form of a
uniform thermal load, such that
AT = T - T (3-16)c 0
where Tc is the curing temperature and T the ambient testing temperature.
Thus, when the laminate is loaded by unaxial tension, a combined loading con-
dition must be considered. The calculated energy release rate function takes
the form
G(a) = [C e(a)e 2 + CeT (a)e x(AT) + CT(a)(AT)2 ]t (3-17)
where C eT(a) is generated by results for e = 1, and AT = 1.
Note that the cracking action of the transverse cracks is primarily of
mode-I, the opening mode.
Accordingly, for a given laminate geometry, say (+45/0/902)s, onset of
90°-cracking in the 90*-layer can be determined if the coefficient functions
Ce (a), CeT(a) and CT(a) are calculated. Then by setting AT and a to known
values and by letting G(ac) = Gc, Eq. (3-17) determines the far-field straincc
e at the onset of cracking. From e , the far-field applied load is thenx X
obtained; o = E ex x x
(b) Free Edge Delamination Model The finite element representation for the
free edge delamination is illustrated in Fig. 47 and Fig. 48. For symmetrically
stacked laminates, edge delamination may occur along the mid-plane (y-axis),
or the off-mid-plane interfaces. The mid-plane cracking is illustrated in
35
NADC-79056-60
Fig. 47, while the off-mid-plane cracking is illustrated in Fig. 48. In both
cases, the solution domain is the 2-dimensional y-z plane, with the applied
load in the x-direction. Again, a generalized plane strain condition is
assumed, if the edge cracking is idealized as illustrated. Fig. 49 depicts
a typical finite element mesh for an edge delamination that occurs along a
chosen ply interface.
The edge crack begins with the assumed macroscopic interface flaw of size
a c and it is propagated self-similarly away from the edge boundary. If the
applied far field load is represented by the laminate strain ex, the calculated
energy release rate function again takes the form of Eq. (3-14). And, if a
combined thermal and mechanical loading condition is considered, the G(a)
function takes the form of Eq. (3-17).
A typical G(a) function for an edge delamination growth is displayed in
Fig. 50. Its behavior is slightly different from that for the transverse
cracking. It is seen from Fig. 50 that the available energy release function
G(a) increases initially with the crack growth to reach a maximum value at a'
the thickness of the layers containing the interface crack; beyond this point,
G(a) remains at a constant value.
Hence, for a given laminate geometry and at a chosen interface cracking
site, the coefficient functions C (a), C (a) and C (a) must first be gener-e eT T
ated numerically. Then by given AT and a values, the applied far-field strainc
e is determined from (3-17) by letting G(ac) + Gc.x
Note that a mid-plane cracking is primarily mode-I action, while an off-
mid-plane cracking is generally a mixed-mode action. In the latter case, G(a)
is the total energy release rate, consisting af all three modal components,
as stated by Eq. (3-6).
36

F I
NADC-79056-60
4. Numerical Correlation with Experimental Results
The AS-3501-06 graphite-epoxy material ply is assumed as a homogeneous
medium having elastic orthotropic property in the principal material coordi-
nates. The effective (or macroscopic) moduli of material have been determined
in the basic material characterization experiments, see Table 4. Specifically,
these are given as
EL = 140 GPa; ET = E = 11.1 GPa
GLT =G G =5.5 GPa(3-18)
VLT V Lz f 0.29
aL i 0.36x10⁻⁶ /oC; aT = a = 28.8x10⁻⁶/0C
In addition, the average thickness of a single ply is t = 0.0136 cm.
Since the laminates were fabricated under a curing temperature of 177°C,
and were tested under the average ambient temperature of 22*C, the equivalent
thermal load in the laminates is approximately
AT - 155 0C (3-19)
The critical strain energy release rate G appropriate with the kinds ofc
cracks discussed here must be determined by independent experiments. Generally
speaking, 90'-cracking and ply delamination are fractures of the matrix, or
the fiber-matrix interface. Data obtained for bulk epoxy and epoxy adhesive
[30] under mode-I action range from 90 to 210 J/m2 for GIc; and somewhat higher
value for G III)c under mixed-mode actions. In a comprehensive experimental
correlation using a T300/934 graphite-epoxy system, Law [31] found Gi 0230 Jim 2
Ic
and a somewhat lower value for mixed-mode G Recent experiments by(I,II)c*
Wilkins, et al. [32] and Schapery, et al. [33], have reported that Glc value
can vary depending on the microscopic crack path. For example, Fig. 51
illustrates two situations where the crack opening is in mode-I, but the
37

NADC-79056-60
microscopic crack-path in the two cases is different. For a graphite-epoxy
system, Gl value found for cracking path parallel to the fiber direction,
22
such as shown in Fig. 51(a) ranged from 80-' 140 J/m2 , while for cracking path
normal to the fibers, shown in Fig. 51(b) ranged from 210'-260 J/m2.
For the cases considered in this report, the 90*-cracking action is
similar to that illustrated by Fig. 51(b); while, the delamination action de-
pends on the specific interface where the crack occurs. In general, a mixed-
mode cracking occurs on off-mid-plane interface, and a mode-I cracking occurs
on the mid-plane interface for symmetric laminates. Lacking the specific data
for specific action, it is assumed, for purpose of illustrating the method
developed herein, that G value for all the different modal actions are thec
same. Namely
G =G G - 210 J/m2 (3-20)c = Gc = mixed
Finally, the proper value for the (macroscopic) critical flaw size, ac
must be determined. This value is probably the most ill-defined quantity,
and is difficult to determine physically. In the experimental correlation by
Law (311, a for 90*-cracking was found at about 0.25 mm. For delamination,c
the value is slightly lower. Thus, in the present study, it is assumed that
ac is the same for both types of cracking, and its value is given by
a , 0.25 mm (3.21)
c
With the basic material values defined, the numerical correlations with
the experimental results are presented in the next two sub-sections.
* Mixed-mode cracking between +45' interface have shown higher values than
this. But, carefully designed experiments are necessary to accuratelydetermine these basic material values.
38

NADC-79056-60
(a) Laminates under Static Tension Consider the experimental results for
the [+45/0/902]s laminates tested under uniaxial tension. Onset of transverse
cracking occurred at 131 MPa, and onset of free-edge delamination occurred at
262 MPa. Using the basic material properties for the material ply given in
(3-18), the finite element routine calculation for the energy release rate
coefficient functions are first obtained for the 90'-cracking simulation.
These coefficient functions are displayed in Fig. 52. It is seen that the
three coefficient functions are all similar in form; all have a maximum at
about am = 1.7 t, which is about 85% of the 902-layer.m2
It was assumed earlier that the macroscopic critical flaw size is about
a c- 0.25 mu, or a - 2t. But the physical constraint (the thickness of thec c
902 layer) limits the value of a c. Thus, in order to apply the cracking onset
criteria of Eq. (3-17), a is replaced by a. Hence, the equation governingc m
the onset of 90*-cracking is,
-22[Ce(a )e + C (am)ex(AT) + CT(am)(AT)2 ]t = Gc (3-22)e m x eT m x T m c
Using the values of C's from Fig. 52, the value for AT from (3-19), the
value for Gc from (3-20) and t = 0.136 mm, Eq. (3-22) yields the far-field
laminate strain at onset of cracking,
e 3.15x10x
Using E from experiment, E x 43.2 GPa, the far-field laminate stress
at onset of cracking is given by
a 136 MPa
which compares with the average value of 131 MPa obtained from experiment.
39

NADC-79056-60
As the load increases, more 90°-cracks are induced according to the
damage event sequence. Then, at some critical load, onset of delamination
occurs. By an edge stress analysis, it is inferred that the most probable
delamination sites are the mid-plane interface (900/900) and the off-mid-plane
interface (0*/900). Numerical results for the energy release rate coefficients
have been generated for both cracking sites. Fig. 53 displays the coefficient
functions for the mid-plane delamination (mode-I predominant), while Fig. 54
shows the coefficient functions for the off-mid-plane delamination (mixed
mode I and mode III predominant). By comparing these two sets of curves, it
is determined that the mid-plane delamination is more energetically dominant.
Thus, using the values of the coefficient functions at a a c 0.25 mm, and
AT = - 155*C, Gc = 210 J/m2 in Eq. (3-22), the onset of free edge delaminationC
along the mid-plane is obtained at the far-field laminate strain,
e= 7.25x0 -3.x
Then, using the value of E of the laminate E x 39.6 GPa, the farx x
field stress at onset of delamination is predicted as,
a = 289 MPa.
x
The predicted value is about 10% higher than the experimental value
(262 MPa). The reason for the discrepancy is probably due to the effect of
the transverse cracking on delamination. The interaction of the transverse
cracking and delamination is not accounted for in the prediL.ive model.
In the experiment, laminates [02/902/452/-452]8 and [902/02/-452/452]s
both showed transverse cracking before delamination. A numerical simulation
of transverse cracking for beth laminates has been conducted.
40

NADC-79056-60
Fig. 55 shows the computed energy release rate coefficient functions for the
[02/902/452/-4521s laminates, while Fig. 56 shows the same for the
(902/02/-452/452 1 laminates. It is seen that the available energy release
rate for the latter is much larger than the former, because in the former,
the 90*-layer is constrained on both sides. This added constraint delays the
onset and thc growth of the transverse cracking. Using the same model as
before, the calculated onset stress for [02/902/452/-452]s is
a = 407 MPa.x
This value, however, is much higher than the measured onset stress of
255 MPa at the first transverse crack. A closer examination of the x-radio-
graph taken for this series of laminates (3 replicas) shows that significant
number of transverse cracks occurred after the load reached 344 MPa. On
the other hand, the predicted onset stress for the (902 /0/-452/45 laminate
is
a =288 MPax
which is about 20% higher than the measured onset stress of 234 MPa.
Finally, the predicted delamination for [02/902/452/-452] occurs at the
45/-45 interface, and for [902/02/-452/4521s occurs at the 0/90 interface;
the predicted onset stresses falls within 10% of the measured values.
(b) Laminates under Static Compression Consider the laminates [02/902/452-4521
and [90 2/02/-452/4521s for which experimental results on delamination under
compression are available, see Table 6. Onset stress is found to be 339.2 MPa,
for the former and 316 MPa for the latter. Calculations using the finite
element routine yielded the energy release rate coefficient functions for
these laminates. In both cases, the most energetically probable
41

NADC-79056-60
delamination site is along the +45/-45 interface, resulting in mixed mode
cracking. The coefficient functions corresponding to the predicted delamina-
tion sitesare displayed in Figs. 57 and 58 respectively. Using the values
of a - a c 0.25 mm and AT = - 155*C, G = 210 J/m2 and t - 2x (ply thickness),c c
the predicted far field strains for [02/902/452/-452]s at onset of delamination
is- -3e = 5.01xlO
x
and for [902/0 /45 /-45 1 is22 2 2 s
e = 4.65xi0 3.x
These values translate to a = 272 MPa and a = 240 MPa respectively.x x
It is noted that the experimental values for the former is 339 MPa, and for
the latter 316 MPa. Thus, the predicted onset of edge delamination under
compression is about 20% too low. The reason for the rather poor correlation
is thought to be that the compression specimen had a clear test section length
of less than 2 cm, so the relatively rigid end-tabs exert a constraining force
normal to the specimen, which in turn may suppress the onset and the growth of
delamination.
In the case of the dispersed laminates [0/90/0/90/45/-45/45/-45]s, aa
450/-450 interface delamination simulation would yield the energy release rate
coefficient functions identical to those shown in Fig. 57, except that t = one
ply thickness, instead of 2 ply thickness as indicated in the figure. In this
case, the maximum available energy release rate occurs at am = t, which is less
than the critical flaw size a . Hence, in predicting the onset of delamination,c
the values of the coefficient functions are taken at am, not a . The pre-c
dicted onset strain is then,
e 8.18xlO 3
x
42

NADC-79056-60
or, the onset stress,
a 410 MPa.x
The corresponding experimental value was 380 MPa, and the final failure
was at 425 MPa. Note that at the onset of delamination the specimen is
already near total failure. It is not clear whether delamination or buck-
ling action is the cause of final failure.
In view of the foregoing comparisons between the predicted and the
experimental loads for the various cracking events, it is clear that the energy
method as outlined here appears to be an acceptable analytical tool for de-
scribing these cracking events. There are, clearly, some uncertainties with
respect to the variable material properties. The other limitation in the
method remains the computer routine itself. The.finite element formula-
tion is essentially two-dimensional, but most of the cracking events observed
in the tests have been three-dimensional in nature, except a few simple
cases, such as 90*-cracks and mid-plane delamination in long specimens under
uniaxial tension. This limitation precludes a prediction for those specimens
with implanted defects. However, this limitation is a numerioal short-coming;
it does not pertain to the physical method of the energy release rate. It is
conceivable that a three-dimensional, or some quasi-3-dimensional finite ele-
ment routine may readily be developed to handle those cracks which are three-
dimensional in nature.
43
- ..-. ~,

NADC-79056-60
IV. FATIGUE GROWTH MODEL BASED ON ENERGY
The fracture strain energy release rate models developed in the preceding
section were shown to be capable of predicting reasonably well the initiation
loads for multiple transverse cracking and free edge delamination. Owing to
the 2-dimensional nature of the finite element crack growth representation, a
satisfactory correlation between experiment and prediction for any 3-dimensional
delamination cracking still remains unavailable. However, the energy model
does provide a qualitative means for identifying the dominant cracking modes,
and their dependence on the fracture energy release rate during the course of
the 3-dimensional crack growth.
In this section, an effort is made to extend the concept of fracture
energy release rate to describe the crack growth process for laminates under
fatigue loads. Special emphasis will be placed on delamination growth under
constant amplitude fatigue. An empirical delamination growth model is developed
from the experimental data that was generated in early tests. The model is
shown to apply well for the tension/tension fatigue case. For the compression/
compression fatigue case, the cracking is 3-dimensional; and the model gives
only a qualitative description.
A concept of constant damage state is introduced; and by an extension of
this concept, a tentative cumulative damage model is presented. Details in
these developments are described in the following sub-sections.
1. A Fatigue Ceowth Model Based on Energy Release Rate
For laminates undergoing free edge delamination under statically applied
load, a typical (calculated) energy release rate curve, G(a), is shown in
Fig. 50. When the laminate is subjected to a constant amplitude fatigue load,
44

aviaeNAD G-79056-60
say of the maximum available instantaneous energy release rate Gf(a'af) is
shown in Fig. 59. Assume that af is generally lower than the static onset
load for delamination; then the laminate will not suffer any delamination dur-
ing the first cycle of fatigue life. It is said that the laminate possesses
a "reserved" toughness against delamination; and this "reserved" toughness
will diminish with increased fatigue load of, or increased fatigue cycles N.
Let Gc be the material critical strain energy release rate against delam-
ination, as has been defined in the static fracture case. Then, the quantity
AG - Gc - Gf(aaf) (4.1)
represents the "reserved" energy release rate of the laminate against delami-
nation under the fatigue load a.
It is further postulated that growth of delamination under a is described
by
a = F(AG,N). (4.2)
Or, the increment of delamination Aa per increment of fatigue cycle is
described by the relation,
Aa (AG)- N (4.3)AN
The choice of (4.3) is based on the observation that, under a small
fatigue load af, growth of delamination is slow. From (4.1) it is seen that
for small aft AG %,G ; hence the left-hand of (4.3) decreases rapidly with N.c
On the other hand, when of is large, or af approaches the static onset load
of delamination then AG -0; and the growth of delamination increases
rapidly with N.
The exact form of (4.3) must be determined from experimental data.
45

NADC-79056-60
Consider the case of free edge delamination growth in the [+45/0/902]s
laminates under tension fatigue. The averaged experimental measurements of
delamination are plotted against log N in Fig. 22, for various fatigue load
levels. Using the data in this figure, a plot of log(Aa/AN) versus log(N) is
obtained for each of the fatigue loads. These plots are shown in Fig. 60.
Here
a =(a/b)100% (4.4)
where b is the width of the specimen. Note that a also represents the
"percentage delamination."
It is seen from Fig. 60 that for all fatigue load levels log(Aa/AN)
maintains a linear relation with log(N). Then, the following empirical form
is suggested:
A- = O[k AG]-$w 8N (4.5)
where AG is defined as the "percentage energy reserve,"
AG - (G - Gf)/G c. (4.6)
With (4.5) and (4.6), one obtains the delamination growth relation
N8logN (7a(N) - b a[k AG] - dN (4.7)fNOM1
Strictly speaking, AG is a complicated function; AG AG(Gc,aof) for
0 < a < b. Thus, (4.7) is also a complex integral. Onset of delamination
is defined when a( ) 4 ac C
For approximation, one may consider a >> a and definec
Gf - Gf(am af) (4.8)
where am is the size of a at which Gf attains the maximum value, see Fig. 59.
46

NADC- 79056-60
Then AG becomes a constant and an integration of (4.7) from N to N yieldsm
a(N)=b c[N(k AG) - 8 logN_ y]/[l - Slog(k AG)] (4.9)
The constants a,8, and k are determined from experimental data, while y
is determined by a(Nm ) m am . It is noted that the applied load of and the
structural geometry and their interaction with the ply stacking sequence are
implicit in AG. Hence, the constants a, 8 and k should be primarily material
property dominated. From the data reduction plots in Fig. 60, these three
constants are determined as
a = 0.25; 8 = 0.806; k - 12.67.
and the value of y is y = 2.35.
Using these values in Eq. (4.9), and the G-curves generated for the
delamination cracking in the [+45/0/902] s laminates (see Fig. 53) growth
curves under various af loads can be calculated according to Eq. (4.9).
These are shown along with the experimentally measured curves in Fig. 61.
It is seen that the growth model (4.9) describes the experimental data quite
well.
Note that it takes only fatigue growth curves at two load levels to
determine the values for a, 8 and k and y.
Next, consider the experimental data obtained from the compression fatigue
tests of the [02/902/452/-452] laminates. Fig. 29 shows the delamination
growth curves for three levels of fatigue loads, at 179 11a, 221 MPa and 276 MPa.
Recall that this series of laminates had no edge delamination until a compressive
load of 339 MPa was reached. But the predicted edge delamination onset was
only 272 MPa. This discrepancy was attributed to the pinning effect of the
47

NADC- 79056-60
end-tabs of the test specimen, which resulted in 3-dimensional crack growth.
The finite element solution for the available energy release rate G(a) however
was about 50% too high, because of the 2-dimensional plane strain formulation.
Thus, if the calculated Gf(a Mof) is reduced by 50%, and using Gc M 210 J/m2,
Eq. (4.6) gives the values of AG as 0.8, 0.572 and 0.451, respectively, for
Of = 179 KPa, 221 MPa and 276 MPa.
Assume that the delamination model under compression fatigue is also
given by Eq. (4.5). Data reduction for this case is displayed in Fig. 62. It
is seen that the test data generally follow a straight line in the log(Aa/AN)
vs. logO4) plane. The constants in Eq. (4.9) are determined as
a = 0.4; 0 - 0.51; k - 35.9; y = 4.
These values are slightly different from those obtained for tension fatigue;
under compression, the rate of growth is faster than that under tension. The
predicted delamination growth by Eq. (4.9) does not compare as well with the
experiment, although it does provide the general trend, see Fig. 63. The
discrepancy is believed due to the inaccuracy in the G(a) calculation by the
2-D finite element.
2. The Concept of Constant Damage States
From the preceding discussions on delamination growth under both static
and fatigue loads, it appears that a generally deterministic relationship may
be found between the applied load and the state of damage. In the event of
fatigue cycling, this relationship varies smoothly with N. Fig. 64 illustrates
the concept of constant damage. The vertical coordinate of Fig. 64 represents
the static loading. When the applied load reaches ac, onset of delamination
occurs. This state of damage can be independently produced by a fatigue load,
48

A
NADC-79056-60
say at 01 < a . Then under a1. it takes N1 cycles to induce onset ofc
delamination. Similarly, the same state of damage can also be reached by a
different fatigue load, say 02, by N2 cycles. Points defining the same damage
state in the a f-log(N) plane define a "constant" damage curve. In Fig. 64,
a curve representing 20% delamination and a curve representing 100% delami-
nation are depicted. Clearly, the 100%-curve corresponds to the final failure
of the laminate; and it is the same curve as the commonly generated fatigue
S-N curve.
The constant damage curves can be constructed using experimental data.
For example, Fig. 65 displays the constant damage curves generated by tension
fatigue for the [±45/0/902]s laminates. It is seen that the various damage
states (transverse cracking, delamination, etc.) maintains a definite occur-
rence sequence under both static and fatigue loadings. The shape of the
curves depicts the trend of fatigue degradation.
Figs. 66 and 67 show the constant damage curves in terms of % delami-
nation for [02/902/452/-452]s and (0/90/0/90/45/-45/45/-45]s-A laminates,
respectively. These laminates were tested under compression fatigue; it is
seen that the rate of fatigue degradation is much larger than that under
tension (see Fig. 65).
From these constant damage curves, the growth of damage under some spec-
trum fatigue loads may be evaluated. As has been demonstrated in the preced-
ing sub-section, a deterministic damage growth model based on energy release
rate may be formulated, such as proposed by Eq. (4.9). If such a model correct-
ly describes the damage growth processes in the laminate, it can calcu-
late the constant damage curves in the load-life plane without the necessity
of experiment. The constant damage curves provide the essential step in the
formulation of a cumulative damage model under spectrum fatigue loading.
49
* HI,

NADC-79056-60
3. A Cumulative Fatigue Damage Model
Upon the construction of the constant damage curves in the load (of)-life (N)
plane, cumulative damage in the laminate under a given load spectrum may be eval-
uated in a manner similar to the well known Miner's rule. Consider, as an example,
the load history shown in Fig. 68(a). When it is applied to a given laminate, the
state of damage at the end of the period of constant amplitude loading 01
is represented by point A in the load-life plane. The constant damage curve
passing point A is denoted as curve a1 (say e.g., the onset of delamination).
At the end of NI-cycle, the fatigue load of is raised to 02. Then the state
of damage in the laminate at N1 moves from point A to point B along curve a1.
Under 02 and for a period of (N2 - N1) cycles, the damage state in the laminate
is represented by point C; through C passes the constant damage curve a2.
Clearly, the damage state represented by curve a2 is more extensive than the
damage state represented by curve a1. At the end of the N2-cycle, the fatigue
load is lowered to 0I again; and the corresponding damage state moves from
point C to point D along the constant damage curve a2. Finally, at the com-
pletion of the loading history at N3, the damage state moves from D to E,
where the damage is represented by curve a3 . Extension from E toward the
failure envelop intersects the S-N curve at point F. EF gives the residual
life of the laminate after it has been subjected to the prescribed spectrum
loading shown by Fig. 68(a).
The foregoing cumulative damage representation depends on the ability to
accurately construct the constant damage curves, either experimentally or
50

NADC-79056-60
Numerically. In the case of delamination, both aspects have been discussed
in this study. The suggested cumulative model, however, remains to be tested
against experiments. In view of the understanding gained in this study, the
method appears quite promising.
51

NADC-79056-60
V. CONCLUDING REMARKS
In this report, the fracture growth mechanisms of delamination in fiber
reinforced composite laminates have been studied. Experiments on various
types of delamination growth have been conducted in order to observe and
identify the dominant loading, geometry and material parameters which influ-
ence the growth processes of delamination. Predictive models based on the
linear elastic fracture mechanics concept of strain energy release rate are
then developed to describe the various delamination processes. The energy
method has been shown to apply, with varying degree of accuracy, to delamination
cracking in laminates made of a graphite-epoxy composite system.
From the numerous results obtained in the present study, an assessment of
our understanding and ability to model the complex process of delamination
is attempted here. The following remarks are in order:
1. Delamination stems from material property mismatch between two layers.
Under load, each layer of the laminate would deform differently if
allowed to delaminate. Bonds between layers prevent this from happening.
The bonding strength is derived primarily from the matrix phase which
is a material property inherent to the composite system. The driving force
for delamination derives from the available strain energy release in the
course of delanination growth. The available energy near a delamination
crack, however, is a very complicated function of loading, layering
structural geometry and the overall geometry of the laminate. The most
striking factor in the available energy release is the actual thickness
of the material layer adjacent to the delamination cracking. This is re-
ferred to as the "thickness effect" discussed in this study. The thickness
effect is significant both in static strength and in fatigue life of the
52

NADC-79056-60
laminates. Accordingly, the effect must be considered in laminate design.
2. For all the delamination cases studied, except one, the delamination
growth front is a 2-dimensional contour and the stress field near the
contour cracking front is 3-dimensional. The exception is the long
symmetric laminate under tension, whose straight free edge undergoes
delamination because of interlaminar edge stresses. In this case, a
2-dimensional generalized plane strain approximation is quite appropriate.
Consequently, the 2-dimensional finite element modeling of free edge
delamination growth yielded exceptionally good results when compared to
experiment. All other cases, however, require 3-dimensional modeling,
which so far is not available. Nevertheless, qualitative analysis based
on the same energy release method showed correct trend without contra-
diction. Thus, the growth of delamination with 2-dimensional contour
front can be analyzed by the energy method, but the quantitative predic-
tion must wait for the successful development of a 3-dimensional, or a
quasi-3-dimensional numerical routine.
3. The energy release rate method provides a one-to-one load-damage (delami-
nation) relationship. It is a deterministic relationship based on the
mechanisms of crack growth. Extension of this model to the growth
process under constant amplitude fatigue loading is made possible by the
concept of constant damage curves. Although fatigue experiments con-
ducted in this study have been limited in scope, the results obtained
indicate the validity of the constant damage concept. Analytical
construction of the constant damage curves in the load-life plane is also
possible if the damage itself can be successfully modeled (e.g., 2-dimen-
sional vs. 3-dimensional model at the present state of the art).
53

NADC-79056-60
The concept of constant damage may be readily applicable it. a
cumulative damage model for fatigue under spectrum loading. All
this points to a promising direction toward a deeper understanding of
failure in laminates.
It is noted that there are several other areas basic to the understand-
ing of the delamination mechanics, that are left unexplored. One of which
is the determination of the material critical energy release rate Gc . It isc
conceivable that this property, when measured at the macroscopic scale, will
exhibit a considerable scatter. Compared to the extensive experiments on
the ultimate strength of composite, studies on the property Gc have been rela-c
tively few.
Another area that needs more comprehensive examination is the fracture
growth criterion under a mixed-mode cracking action at the macro-scale. It
is apparent in the experifments that mode-I and mixed-mode fracture surfaces
exhibit different characteristics. Energy required to separate the two dif-
ferent surfaces may be also different, thus requiring a different set of crack
growth criteria.
Finally, a concentrated effort should be made in developing a 3-dimen-
sional numerical routine which is capable of modeling the delamination growth,
similar to the 2-dimensional model employed in this study. Such a 3-dimen-
sional routine is essential to describe most other delamination cracks which I:are 3-dimensional in nature.
54

NADC-79056-60
REFERENCES
[1] N.J. Pagano and R.B. Pipes, "The Influence of Stacking Sequence onLaminate Strength," J. Composite Materials, Vol. 5, (1971) p. 50.
[21 K.L. Reifsnider, E.G. Henneke and W.W. Stinchcomb, "Delamination of Quasi-isotropic Graphite-Epoxy Laminates," Composite Materials: Testing andDesign. ASTM STP 617 (1977) p. 93.
[3] G.P. Sendeckyj and H.D. Stalnaker, "Effect of Time at Load on FatigueResponse of [0/+45/90]2s T300/5208 Graphite-Epoxy Laminate," Composite
Materials: Testing and Design. ASTM STP 617 (1977) p. 39.
[4] J.G. Bjeletich, F.W. Crossman and W.J. Warren, "The Influence of StackingSequence on Failure Modes in Quasi-isotropic Graphite-Epoxy Laminates,"Failure Modes in Composites - IV, AIME (1978).
[5] J.M. Whitney and R.Y. Kim, "Effect of Stacking Sequence on the NotchedStrength of Laminated Composites," Composite Materials: Testing and Design.ASTM STP 617 (1977) p. 229.
[6] M.S. Rosenfeld and S.L. Huang, "Fatigue Characteristics of Graphite-EpoxyLaminates under Compressive Loading," J. Aircraft, Vol. 15 (1978) p. 264.
[7] A.H. Puppo and H.A. Evensen, "Interlaminar Shear in Laminated Compositesunder Generalized Stress," J. Composite Materials, Vol. 4, (1970) p. 204.
[8] R.B. Pipes and N.J. Pagano, "Interlaminar stresses in Composite Laminatesunder Uniform Axial Tension," J. Composite Materials, Vol. 4, 1970 p. 538.
[9] G. Isakson and A. Levy, "Finite Element Analysis of Interlaminar Shearin Fibrous Composites," J. Composite Materials, Vol. 5, (1971) p. 273.
[101 E.F. Rybicki, "Approximate Three-Dimensional Solutions for SymmetricLaminates under In-plane Loading," J. Composite Materials, Vol. 5,(1971) p. 354.
[11] N.J. Pagano, "On the Calculation of Interlaminar Normal Stress in Composite
Laminates," J. Composite Materials, Vol. 8 (1974) p. 89.
(121 S. Tang, "Interlaminar Stresses of Uniformly Loaded Rectangular CompositePlate," J. Composite Materials, Vol. 10, (1976) p. 69.
[13] P.W. Hsu and C.T. Herakovich, "A Perturbation Solution for InterlaminarStresses in Composite Laminates," Composite Materials: Testing and Design,ASTM STP 617 (1977) p. 296.
(14] A.S.D. Wang and F.W. Crossman, "Some New Results on Edge Effect in SymmetricComposite Laminates," J. Composite Materials, Vol. 11, (1977) p. 92.
[15] P.W. Hsu and C.T. Herakovich, "Edge Effects in Angle-ply Composite Laminates,"J. Composite Materials, Vol. 11 (1977) p. 422.
[16] A.S.D. Wang and F.W. Crossman, "Edge Effects on Thermally Induced Stressesin Composite Laminates," J. Composite Materials, Vol. 11, (1977) p. 300.
55* - 'S

NADC-79056-60
(17] F.W. Crossman and A.S.D. Wang, "Stress Field Induced by Transient MoistureSorption in Finite Width Composite Laminates," J. Composite MaterialsVol. 12, (1978) p. 2.
[181 A.S.D. Wang and F.W. Crossman, "Calculation of Edge Stresses in Multi-layer Laminates by Sub-structuring," J. Composite Materials, Vol. 12,(1978) p. 76.
(19] R.L. Spilker and S.C. Chou, "Edge Effects in Summetric CompositeLaminates: Importance of Satisfying the Traction-Free-Edge Condition,"J. Composite Materials, Vol. 14, (1980) p. 2.
[20] A.S.D. Wang and F.W. Crossman, "Initiation and Growth of TransverseCracks and Edge Delamination in Composite Laminates, Part 1, An EnergyMethod," J. Composite Materials, Vol. 14, (1980) pp. 71-87.
[211 F.W. Crossman, W.J. Warren, A.S.D. Wang and G.E. Law, "Initiation andGrowth of Transverse Cracks and Edge Delamination in Composite Laminates,Part 2, Experimental Correlation," J. Composite Materials, Vol. 14,(1980) pp. 88-106.
[22] A.S.D. Wang, "Growth Mechanisms of Transverse Cracks and Ply Delaminationin Composite Laminates," Advances in Composite Materials, ICCM-III,Paris (1980) pp. 170-182.
[231 F.W. Crossman and A.S.D. Wang, "The Dependence of Transverse Cracking andDelamination on Ply Thickness in Graphite-Epoxy Laminates," Damages inComposite Materials, ASTM STP (in press).
[24] A.S. Tetelman and A.J. McEvily, Jr., "Fracture of Structural Materials,"John Wiley and Sons, New York (1967).
[25] G.R. Irwin, "Fracture" Handbuch der Physik, Vol. 6, (1958) p. 551.
[26] E.F. Rybicki, and M.E. Kanninen, "A Finite Element Calculation of StressIntensity Factors by a Modified Crack Closure Integral," Engr. FractureMechanics, Vol. 9, (1977) p. 931.
[27] E.F. Rybicki, D.W. Schmueser and J. Fox, "An Energy Release Rate Approachfor Stable Crack Growth in the Free Edge Delamination Problem,"J. Composite Materials, Vol. 11, (1977) p. 470.
[28] K.L. Reifsnider, W.W. Stinchcomb and E.G. Henneke, "Defect-PropertyRelationships in Composite Materials," AFML-TR-76-81, Part 1 (1976),Part 2 (1977) and Part 3 (1979).
[29] A.S. Griffith, "The Phenomenon of Rupture and Flow in Solids," Phil.Trans. Roy. Society, London. Series A-221 (1920) p. 163.
[30] W.D. Bascom, R.L. Cottington and C.O. Timmons, "Fracture Design Criteriafor Structural Adhesive Bonding - Promise and Problems," Naval Engr.Journal, Aug. (1976) p. 73.
[31] G. E. Law, Jr., "Fracture Analysis of (+25/90n)s Graphite-Epoxy
Laminates," Ph.D. Thesis, Drexel University, (1981).
(32] D.J. Wilkins, J.R. Eisenmann, R.A. Carmin, W.S. Margolis and R.A. Benson,"Characterizing Delamination Growth in Graphite-Epoxy," Damages inComposite Materials, ASTM STP (1981) (to appear).
[33] R.A. Schapery, "Composite Materials for Structural Design," Mechanicsof Composite Review, (1980) p. 4.
56
~4~'~' '

NADC-79056-60
Table 1. Basic Property Characterization Tests
Type of test Type of laminate # of specimens
Static Tension [0121 2
[9121(9012 ] 3
[0 2/90 2/452/-452) s 2
[902/0 2 /-45 2/4521s
[0/90/0/90/45/-45/45/-451 1
[90/0/90/O/-45/45/-45/43] 1S
[45/-45/0/9")] 3
[-45/45/90/,? 2]s 1
[±45] 2s 3
Static Compression [0121 3
[02 902/452/-452]s 1
[902/02/-452/4521s 4
[0/90/0/90/45/-45/45/-451 2
[45/-45/0/902] s 1
[±4512 3
57

NADC- 79056-60
Table 2. Damage Growth Tests under Static Step-Loading
Type of test Type of laminate # of specimens
Tension step-load [02/902 /4 2 /-452s 3
[902/02 1-52 /4521 s 3
[0/90/0/90/45/-45/L5/-45] 3
[90/0/90/0/-45/45/-45/45] 3
[45/-45/0P'0 21s 5
[-45/45/90/021 s 3
[45/-45/0)/90 21s - A* 2
[45/-45/0/90 ]s - i* 2
Conression step-load [012] 1
[02/902/45?/ 45,] 3
[902/02/..452/4521 s 3
[02/902/45 /-452]s - A* 22 A* 2
[02/902/452/--45 2 - C* 2
[0/90/0/90/45/--45/45/.-45] s 2
[0/90/0/90/45/-45/43/-45]s-AA 2
[0/90/0/90/45/-45/45/-45] -C* 2
[45/-45/0/02 1s 2
* A - Specimens with iWplanted 1/4" Teflon strip, see Fig. 2.
B - Specimens with iplanted 1/2" Teflon strip, see Fig. 2
C - Specimens with i:-,lanted 1/4" diameter Teflon circle, see Fig.3.
58

NADC-79056-60
Table 3. Damage Growth Tests under Fatigue Loading
Type of test Type of laminate # of # ofspecimens load levels
Tension Fatigue (45/-45/0/9021 s 9 5
[45/-45/0/9021 S A* 7 3
L45/-45/0/902is 7 3
Compression Fatigue [45/--45/0/902]s 2 2
? s 2 2[02/9052/- '22 ] 6 3
[02/902/452/-45 ) * 5 3
[02/902/452/ 45 C* 4 2
[90/0 /-45 /45 5 3
[0/90/0/90/45/-45/45/ 451 2 2
[0/90/0/90/45/-45/45/-45] s - Al 5 3
[0/90/0/90/45/-Z5/4 /-451 - C. 4 2
A - Specimens with implanted 1/4"1 Teflon strip
B - Specimens with implanted 1/2" Teflon strip
C - Specimens with implanted 1/4" diameter Teflon circle
59

NADC-79056-60
Table 4. Summary of Results from Basic Property Tests
Static Tension
laminate lay up avg ault (MPa] E [GPa] v Remarks
[012J 1325.2* 139.83 0.291 *a withoutmax failure
[90121 60.0 11.03 0.027
[02/902/452/-4521s 524.0 50.13 0.283
[902 /02/-452/452 s 453.0 51.38 0.309
[0/90/0/90/45/-45/45/-45]s 659.2 51.99 0.325
[90/0/90/0/-45/45/-45/45] s 673.6 52.26 0.304
[45/-45/0/9021s 326.1 39.65 0.172
(45/-45/0/902] s 430.9 43.23 - * new batch
[-45/45/90/021s 930.1 73.71 0.317
[+45] 156.5 19.10* 0.69 * initial modulus
Static Compression
laminate lay up avg ault [MPa] E x [Pal v Remarks
[012) 932.2 136.93 0.277
[02/902/452/-4521s 388.2 60.33 0.248
[902/02/-452/45s 346.1 51.23 0.292 I
[0/90/0/90/45/-45/45/-45]s 430.9 53.64 0.266
245/-45/0/90 2 s 371.6 38.13 0.151
[+4512s 175.1 17.30* 0.60 * initial modulus
60

NADC-79056-60
Table 5. Summary of Results from Damage Growth Tests
Static Tension
lset stress, MPa a ult, MPa Remarkslaminate lay-up T.C. E.D.
[02/902/452/-452] 255.0 521.2 539.0 +45 cracks dominantfrom a = 427 MPa
[90 2/02 /-45/45 234.4 442.6 541.0 +45 cracks froma= 379 MPa
E.D. and +45 cracksdominant from a = 448
[90/0/90/0/-45/45/-45/45] 413.6 - 650.8 * not clear
[0/90/0/90/45/-45/45/-45] 434.3 - 606.7 * local
(45/-45/0/9021s 131.0 262.0 393.0 E.D. dominant froma = 351.6 MPa
[45/-45/0/902]s* 131.0 236.5 443.3 * new batch[45/-45/0/902 - A* 103.4 179.2 435.7 * new batch implanted
1/4" teflon strip
[45/-45/0/902] - B* 103.4 172.4 434.3 * new batch implanted1/2" teflon strip
[-45/45/90/023 820.4* 935.0 * local T.C. on edges
61

NADC-79056-60
Table 6. Summary of Results from Damage Growth Tests
Static Compression
Laminate lay-up Onset of E.D. a ult' MPa Remarks____ ___ ___ ____ ___ ___ ___ MPa _ _ _ _ _ _ _ _ _ _ _ _ _ _ _ _ _ _
to11- 857 No damage before failure
to02 90 245 2/-45 21 339.2 369.5 Local +45-crackingfrom 341 MPa
[02/902/452/-4521 - A* 131.0 286.0 Local +45-crackingfrom 241.3 MPa
to /90 /45 /-45 1 - 0* 251.6 330.9 Delamination from edge2 2 22 s first
[90 2/0 2/-45 2/45 21s 315.7 319.2
(0/90/0/90/45/-45/45/-451 s 379.2* 425.4 *Onset delam. not clear
(0/90/0/90/45/-45145/-451 A 138.0 382.6 +45-cracking from310 MWa
[0/90/0/90/45/-45/45/-451 sC 265.4 365.4 +45-cracking aroundcircular patch
[+45/0/90 21 382.6 No delamination beforefailure
62

NADC-79056-60
Table 7. Summary of Results from Damage Growth Tests
Tension-Tension Fatigue
laminate lay-up max aF No. of No. of cycles T.C. density No. ofMPa specimens at onset of at onset cyclesT.C. E.D. of E.D. tested
[45/-45/0/9021s 110.3 1 100 - 2,000,000
ault = 443.3 MPa 138.0 1 10 500,000 8.2/cm 1,000,000
171.0 2 - 7,500 8.4
189.6 2 - 1,000 8.2
205.5 1 - 500 8.2
[45/-45/0/902 ]s-A 137.2 2 - 7,500 4.7 600,000
Gult = 435.8 171.0 3 - 1,000 5.7 500,000
186.8 2 - 50 3.2 400,000
[45/-45/0/902]s-B 138.6 2 - 100 4.4 300,000
ault = 434.0 171.7 3 - 20 4.0 500,000
189.6 2 - - 2.5 100,000
63

NADC-19056-60
Table 8. Summary of Results from Damage Growth Tests
Compression-Compression Fatigue
laminate lay-up Max aF No. of No.of cycles Max No. Remarksat onset of of cycles
1f~a specimens E.D.
(02/902/452/-4521s 182.0 2 150,000 1,000,000 suspended
ault M 369.5 221.3 2 3,000 130,700 failed
276.5 2 70 16,975 i
[02/902/452/-452]s-A 182.7 1 - 257,260
ault = 286.0 196.5 2 - 307,000 suspended
220.6 2 - 73,430 failed
[02/902/452/-45 2 ]s-C 194.4 2 10,000 500,000 suspended
ault = 330.9 222.0 2 200 94,710 failed
[0/90/0/90/45/-45/45/-45]s 276.5 1 10,000 748,320 "
ault = 425.4 343.4 1 500 3,100
(0/90/0/90/45/-45/45/-451 s-A 219.2 1 - 300,000 suspended
ault = 382.6 248.9 2 - 143,870 failed
276.5 2 - 42,650
[0/90/0/90/45/-45/45/-45]s-C 193.7 2 5,000 500,000 suspended
ault f 365.4 219.2 2 300 500,000
[45/-45/0/9021 s 241.3 1 - 100,000 failed
ault f 382.6 MPa 304.7 1 - 860 "
[902/02/-452/4521 180.6 2 190,000 1,000,000 suspended
aUlt = 319.2 220.6 2 7,000 77,890 failed
274.4 1 200 10,000
64

nAw-79056-6o
axx
'Ix /
(a) (b)
t $ax
ImplantedInterlaminar
Flaw
tax x
(c) (d)
Figure 1. Schematics of Four Delamination Problems Studied
65

NADlC-79056-60
-0
0'A
-v -
$4 $
O C
0 00
%00Cr-.4
0
1-40
4e
0
r4-
Li0
660

NAD-79056-60
25.4 mm
liB -- AimlI
54 mm 19 mn 54 mm
Type "A"
specimens
6.3 mm Teflon strip
- ype "C"I.pecimens
S6.3 mi T atjoL
Figure 3. General Configuration of Compression Test Specimens
67

NADC-79056-60
'P
upper loading platen
sliding block
pad
wedgesspecimen
010housing cylinder
lower loading platen
Figure 4. Schematics of the Compression Test Fixture
68

A-t Z
(DC
~ aW
~6

N ADC-79056-6o
C31,
VA
c'J
r
C'
70C

N \FX~-~'9~. ''C -(0
4-
K-4
C'
r- +NI -
320I
Ct
4-
-ya-
* Ctfl
C
4-
>1
C-
Ct* C-
C:12
N ~32
C--Ct
In
4-
N ** -4
-% 1~> 4-~-Ct
71

NAD-79056-60
00
~ -Zr
C-4
-4
Z-Zr
u
00-44
krtC) ~
vU
72U

N ADC-79056-60
c'J
C'4
S 0
cC-
0
L-
C IR
cc.I-
cz
c czm In
cc
CI
-S-
co
73-

NAD-79056- 60
r-
ci)
0
4 11
i)
a
744

NADC-79056-60
CI
~~ca
Cr)
t ca
-Z
T&M1ca
-n 0
75 -

NADC~-7905 6-60
CU)
Cl
co
--4
c12
+
U)
"4 4
Q)
C14
CW-

N ADC-79056-60
C',,
"0
+1
0
>$14
cu
-o
77
C,
0)4-i

NADC-79056-60
CV)
Cd
C,
a% 0
C>
0
Cd
0
Q-)
S 0
1,8

N ADC~-79056-60
4
M
"0>a
4
CY
00-
W
79v
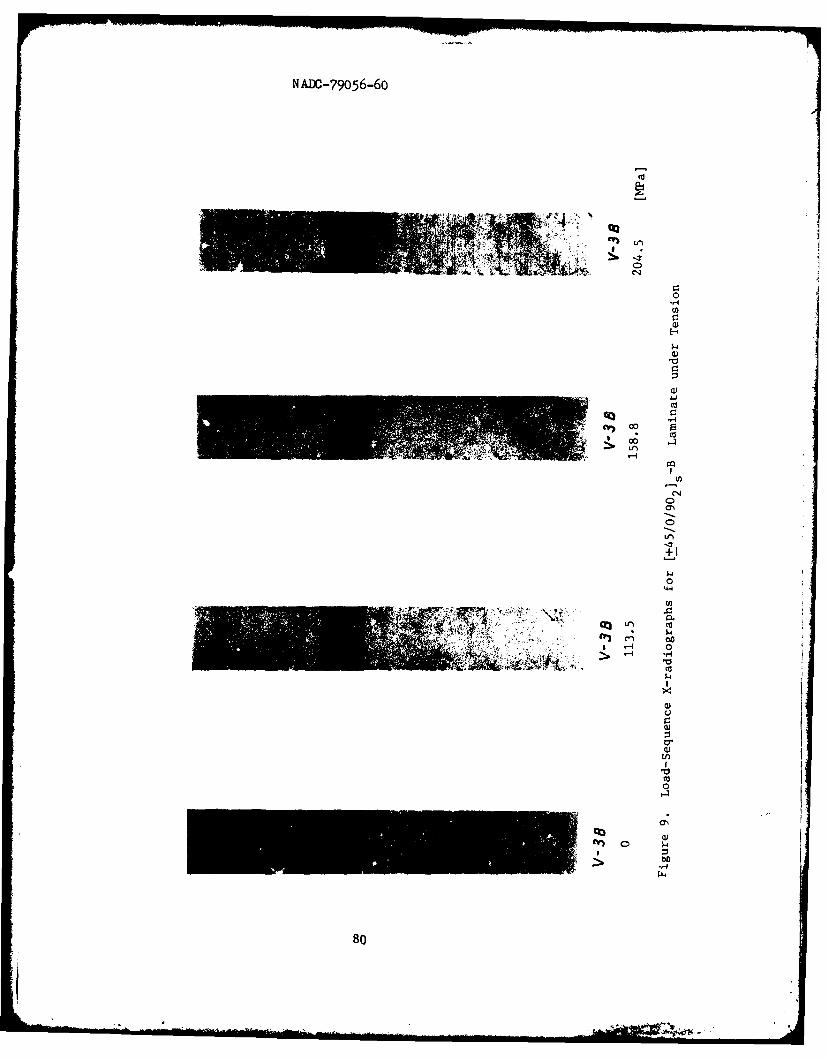
N ADC-79056-60
on
CO
0a
00LIn
+14'
0
ca~f co-4'n00
0)
C-)0
'0
800

N AUC-79056-60
fl) U)
C14
0)
V.C
0
r-
81-
dhk Z

N ADC-79056-6o
040
co
'I
0
C)
+1
p
-o
0
a)i04
400
00
0
82

NIADO -79056-60
-~ 0
-- 4
0*
0
0 04coo W-)0 4 4
12. 0.0 .0 cac :-
00 -400
440 0
000
C>~' 00 koC4 00j
-- 4
-4 ~4-4
Z .- 4-4
[%I T~ UCDc > 0
4).
c- 40)c cc
bcD c.
z I4
1.1- c4 ul
P-4
o O~-83
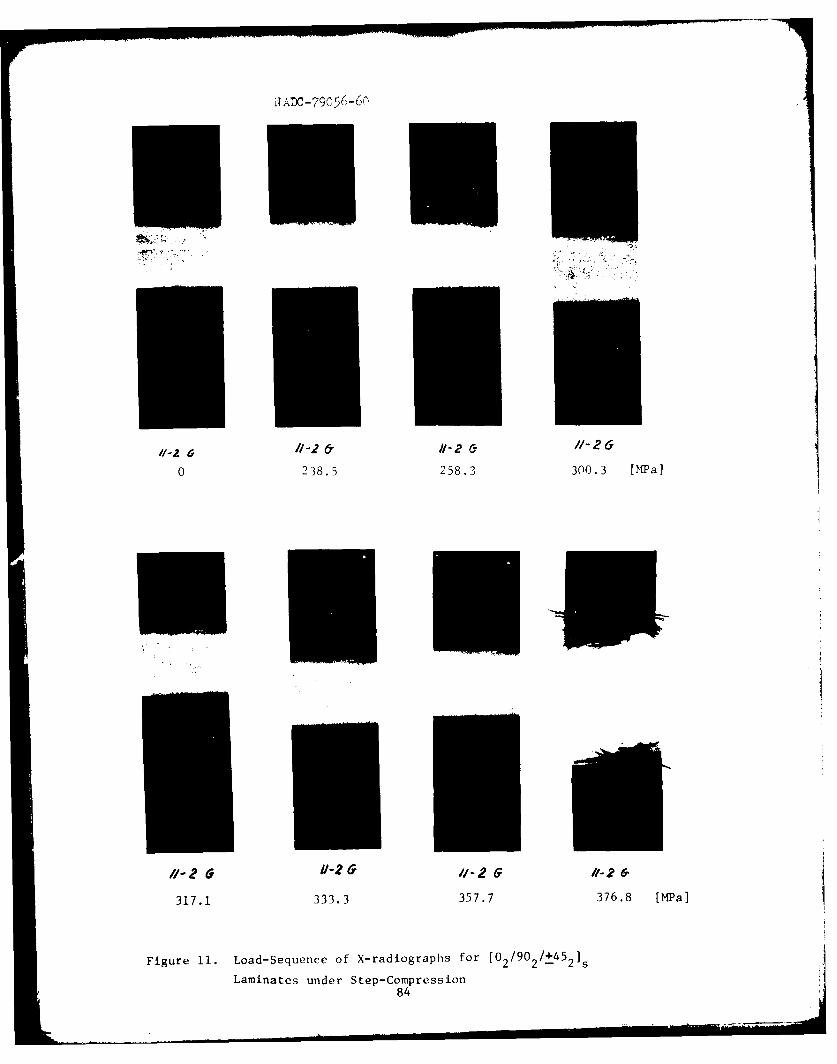
A Dc-?9C 56-6@
112 1-2 & I 51-26
0 238.5 258.3 300.3 [MPa]
* Es
11-11 -2 Cy 11-2 G 11-26-
317.1 333.3 357.7 376.8 [MPa]
Figure 11. Load-Sequence of X-radiographs for [02/902/+452]sLaminates under Step-Compression
84

NADC-?9056-60
/6AQ/1
0 120.5 146.1 [bi~aj
11-6,9 f/- CA 11-60
172.6 206.8 240.9
Figure 12. Load-Sequence of X-radiographs for [02 /902/+4521s type A
Laminates under Step-Compression.85

AD-Ai15 728 DREXEL UNIV PHILADELPHIA PA F/ 11/4FRACTURE MECHANICS OF DELAMINATION. INITIATION AND GROWTH.(U)JAN 82 A S WANG, M SLOMIANA N6226q-79-C-0270
UNCLASSIFIED NADC-79056-60 NL2 1*,F lfl-l 2lll-EEEEEiE/iE-]EElllI---EEEElEIIEEEEEEEEEEEEEEEEIIEhE

NADC-79056-60
/1-619 11-6.9 /16 R
266.6 283.7 294.8 [MPaj
Figure 12 Cont'd: Load-Sequence of X-radiographs for [0 2/90 2/+45 21s
type A Laminates under Step-Compression
86
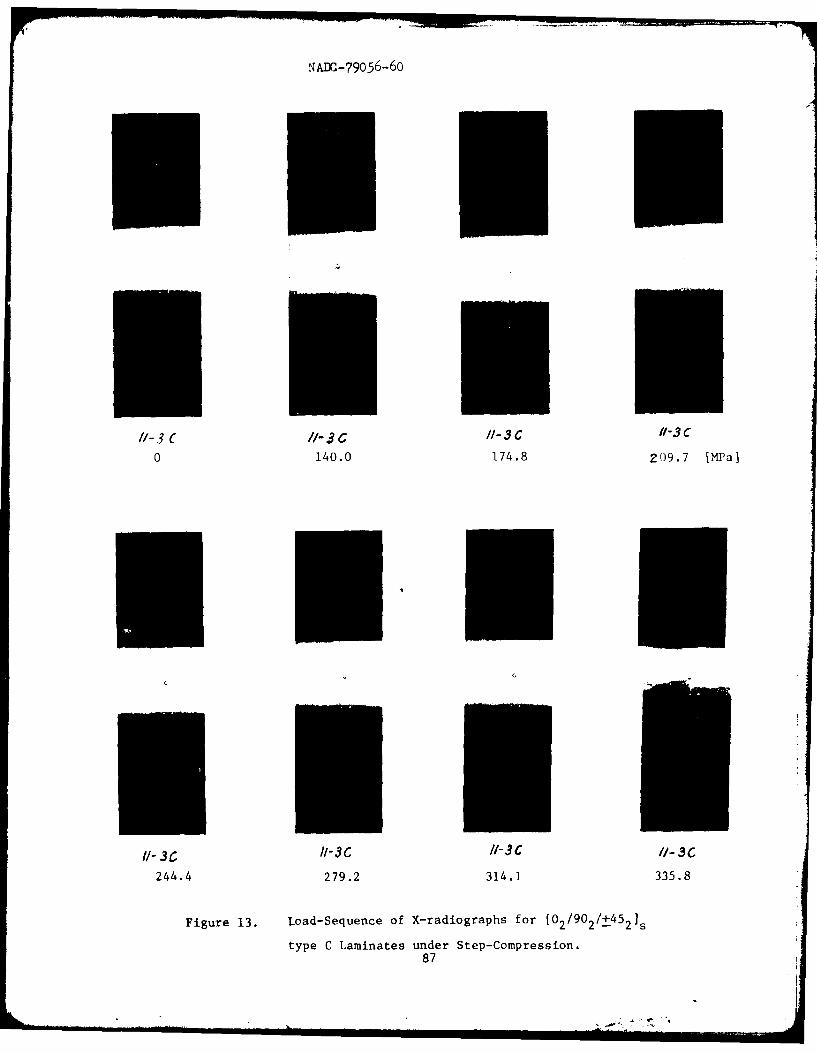
NA1XC-79056-60
11-3 C /-C fl- 3C #-3 C0 140.0 174.8 209.7 WMa]
I/-3 I3C 11/-3C 1/3C
244.4 279.2 314.1 335.8
Figure 13. Load-Sequence of X-radiographs for (0 2/90 2/+45 21s
type C Laminates under Step-Compression.87

N4ADlC-79056-60
f - -No implantii - Implanted Teflon circle -"C"
1001Implanted Teflon strip -"A"ll
80
60j
40 / I20
0 100 200 300 400 a[MWa]
Figure 14. Delamination. Growth vs Applied Load for(0 2/90 2/45 2 /45 ], Laminate Series under
Step-Compression
88

NADC-?9056-6Q
IV-3 IV-3 /V..3
0 132.5 220.7 316.5 379.0 [MPa]
IV-3 /V-3 NV-3 IV-3396.5 419.5 441.5 433.2 [MPa]
Figure 15. Load-Sequence X-radiographs for 10/90/0/90/45/-45/45/-45]
Laminates under Step-Compression.
89

N A.I-?9056-60
/V 9IV-8 9 /v- 8R0 119.3 144.8 [MPa]
/P 9/-SR IV-819
171.0 204.9 238.8 [Pi
Figure 16. Load-Sequence X-raidiographis for [0/90/0/90/45/-45/4)/'-45 Istype A Laminate-s under Strep--Compression
90

NADC-?9056-60
I9
Iv-lf IV-SR IV-8 0
264.1 281.9 298.9 [MFa]
'U9
IV-5#? IV A/ N"-8 R
323.4 349.6 375.1 [MPa]
Figure 16 Cont'd: Load-Sequence X-radiographs for [0/90/0/90/45/-45/45/-45]stype A Laminates under Step-Compression.
91

NADC-79056 - 6 0
/v- 819 V-8
392.9 376.7 [MPa]
Figure 16 Cont'd: Load-Sequence X-radiographs for [0/90/0/90/45/-45/45/-45]s
type A Laminates under Step-Compression
92

NAEX- ?90.56-60
I
IV- 2C IV-2C IV-2C0 135.0 168.6 [MPa]
IV-2 C /V- 2 C IV-2 C
202.2 235.7 269.2 (MPa]
Figure 17. Load-Sequence X-radiographs for (0/90/0/90/45/-45/45/-451, type C
Laminates under Step-Compression93

NAfC-1,9 5u-6 O
v 2 CV-C
302.7 323.0 [pa]
IV - 2C IV-2C336.3 352.3 [MPa]
Figure 17 Cont'd: Load-Sequence X-radiographs for [0/90/0/90/45/-45/45/-45] s
type C Laminates under Step-Compression.
94

NADc-79o56-6o
N
C
,, - - No implant- -.- Implanted Teflon circle - "C"
Implanted Teflon strip - "A"
100
80 I
60
I I
40
20 / I
0 100 200 300 400 500 OIMPa]
Figure 18. Delamination, Growth vs Applied Load for the
[0/90/0/90/45/-45/45/-451, Laminate Seriesunder Step-Compression
95

Wx UOT39UTU1Toa *2 8 a 2 3
C4
UOT~w~m la *2C4 (
PC

NADlO-79056-60
u>1
0
C) 0
00
-4
2.4
0 0
CN
0
0"-
010'I-,-
1
97-

N ADC-79056 -60
-4A
988

NADC-79056-0o
ao
00
00
c~cv
440
990

N ADC-79056-60
0 +1
000 00
0 -
-I 00r-44
"44
10

N ADC-7905 6- 60
'-4
00
C4 +0
000
0
'4d)
Cud
'-4C4
03o
3.014

NADC-?9056-6o
0 L
-4C)
C-)
.C 0
0 0
-)
C-4
0)
.. o 00
04
102

N Anc-79o56-6o
-- 0)
h~-4
103

NADC-79056-60
cc4C1
w%w
000e*
II

NAD-79056-60
C.)
C)
C-4
100

NADC-79056-60
-4
o a,
JtJ 4-4
00 V i - 00
AED-4- M.
C C00W
Go a C- tv a 4-H4-
S EI
000
0 0 ~06 00-

N ADC~-79056-60
11-6 61-6 &1- 60 500 2 000 cycles
16 &T I/ 6 &1-63 000i 5 000 10 000 cycles
Figure 26. Life-Sequence X-radiographs for [ Y902/452/-452]s
Laminate under 221 M~a Compression Fatigue Load.107

NADC-7905 6 - 60
6, 11-
20 000 50 000 cycles
116 //6
100 000 130 703 cycles
Figure 26 Continued10

N AD-79056- 60
11-2,9 //-29 11Ii-2,i9
0 5 30 cycles
100 500 2 000 cycles
Figure 27. Life-Sequence X-radiographs for [02/9021/4 /45 2]5-type A
Laminate under 221 MPa Compression Fatigue Load.109

NADC-79056-60
11-2,9
2 110 cycles
Figure 27 Continued
110

N ADC-?9056-6c
0 10 100 1 000 cycles
fl- 4C I C10 000 20 000 29 730 cycles
Figure 28. Life-Sequence X-radiographs for (02/902/452/-452I5-type CLaminate under 222 MPa Compression Fatigue Load.

N ADC-79056-60
-l 0 0
0
Lrz
00
0~ CD C 1
-4-
112

NADC-79056-60
Ln
zC4
(U 0
a'a%
co 00
-n ca
C:
10
c
Ci,
0 c0
-A -4
to b0
113.

NADC-79056-60
40
zId0 *
00
0
-Col
P4 40
00
-ri V4
114,

NADC-79056-60
0
d) . 4
04 CL4 C\
-4
-4 ---
0 tv
'-44
co
1151

NADC-79056-60
,-4
0
'4
0
044
M w
14
00
in
lu
0I'
-c n
-
116a

N ADC-79056-60
U
U
1 0
tn0
I I
CD
1174
II
, gi
0
: 117

NADO- ?9056-60
cn
'=4U
c-*4
-4
118

N ADC>-79056 -60
0 10 1 000 cycles
10 000 10 000 40 000 cycles
Figure 34. Life-Sequence X-radiographs for [0/90/0/90/45/-45/45/-45] sA
Laminate under 219 I4Pa Compression Fatigue Load.
119

NADC-?9o56-6o
100 000 300 000 cycles
Figure 34 Continued
120

NADC-79056-60
V- 6 C IV- 6C
0 500 5 000 20 000 cycles
IV- 16C IV-6 C IV-6 C70 000 200 000 500 000 cycles
Figure 35. Life-Sequence X-radiographs for j0/90IQf90/45/-45/45/-451s- CLaminate under 219 Wea Compression Fatigue Load.

NAMl-79056-60
ED
Lrn
Lfn
00
00
Go%%
120

NADC-79056-60
4.1
'00$4
0
-. 1'
IA
Ln i 4
4-00 0
Go - 4.4
en I
be '
123~

NADC-79056-60
u
0
V4
go
0
C4.
P44.
124*

NADC-79056-60
1
0.
Un
s1
C14
0
C44
C41
.4
4
125
LLA

NADC-7?9056-60
TRANSVERSEY0
Figure 40. Schematics of 90*-Cracking
126

N ADC-79056-60
0
(U
bo"A
127I

N ADC-?9056-60
/H
'-4'-4I-4
I0
0
4,'3$
N IIU U1 '4
'=4 aH
0
C,'
4,I.'
00
N
H
I
128
I

NADC-79056-60
Ygv
Z,W
ypV
ZIW
Figure 43. Finite Element Scheme of Irwin's Crack-ClosureRepresentation.
129

NaDc-'?956-60
ax
90*-Plies
Face-Plies
Transverse Crack,.
(a) Single Transverse Crack Geometry
z ,w
Face Plies
90n
Lj
(b) Single Transverse Crack Finite Element Model
Figure 44. Finite Element Representation of A Transverse Crack.
130

030
"-4 >
o tv
0
m -4-4
kCo
131)

NAD-M956-60
C e(a) 01 zla
/13

NAflC-79056-60
ya
Face Plies _______________
90*-Plies
Face Plies
ax
z
Face Plies
t y
Figure 47. Finite Element Model for Mid-plane Free-Edge Delamination
133

NADO-79056-60
Face-Plies
90*-Plies
Face Plies
at
x
Face flies
Ia L 0-90n
Figure 48. Finite Element Model for Interface Free-Edge Delamination
134
hLA

NADC-79056-60
______ CD
-4
135)
!0
6 QJ- - -
________ C\
-I ° - - -cv --I °r-,
L-4
-.. ,,
x~
____5
Iw
_ -q -

NADC-79056-6o
G (a)
2ax
a
Fir 0 Tyia a)frEg eaiain
/136
6L/

NADC-79056-60
4
Crack path
*--Direction of fibers
(a) 00/00 Delamination Action
~..... ..• 0 0 • 0
Crack path...>
(b) Transverse Cracking Action
FIgure 51. Schematics of Two Different Cracking Actions in Unidirectional Laminate.
137

NAMl-79056-60
Cd
$43
04J 44
S0)
0
to oor p )
C.) C. 0 0 * 0IT en. C4 ..
[-4, -
'4.4
138)

N ADC-79056-60
044cu
4-0
0
0-
C1 C V
C14 u' -4 oUU
CD 0 0a-, c
F4 c cC.) C.) 0 ) J U)
C:C
C
-4-4
Ln~ C,
0* 0
Lr) en
139

NADC-79036-60
C4o
4).
V4
o~ 0co 0- -. d '4 I.4
0 0 0% 0 4-
414U~ '.0 I1(
Un LI tn
C4 C4 r4
1404

N ADC-79056-60
e
CT
CeC
70 , CT
100.
60c
e
50~50 C
', Ce T51
40460-
3 0 1 . , 2
C T :10 - I/m2/OC 2
40 3 /O
20 t = 2(ply. thickness)
2t 2
20t
10
0.2 0.4 0.6 0.8 1.0 a/t
Figure 55. Transverse Cracking Coefficient Functions for [O,/90,/4i 2-4S]Laminate under Uniaxial Tension and Uniform Thermal .nading.
141.

NADC-79056-60
Ce
C T C T
250 160 CeT
140 C 0
200
120.
100 1
1500
10C : 06 /
100 60Ce 103 / 26
6
t -2(ply thickness)
40
450
201 2
00.2 0.4 0.6 0 0.8 1. 0 a/t
Figure 56. Transverse Cracking Coefficient Functions for (902/0 /-45 /45S 1aLaminate under Uniaxial Tension and Uniform Thermal Loading.
142

NADC-79o56-60
i In
C~4
0'
0
0. '-4
41 0
-4
t 0
C..' @1 c
C..) u
U-4
I~I ca ~.
E-4 01 00 0 14) -4 t C
ow M
0~~ co 10C
-4
uli~~c LnL r
1434

NADc-'?956-60
e l CT
5001 C eT CT
140-
4001
120 e
100.300-
12
80
10
200 C:1 /
60 8 C T: 103 /2O2
eT:
40 6
t -2(ply thickness)100
4
20
2-
0 0.4 0.8 1. 2 1.6 a/
Figure 58. 0ff-Mid-plane Delamination (-45/45) Coefficient Functionsfor [902/02/-452/4521,~ Laminate under Uniaxial Compressionand Uniform Thermal Loading.
144
-..

NADC-79056-60
Gf(a)
G c •I AG -G c -G f(a,a f)
a f(max. fatigue load)
a a a ac m
Figure 59. Schematics of the Strain Energy Release Rate Reserve,for Laminate Undergoing Free Edge Delamination.
145
- ...--

NAflc-?956-60
0
04 r -4 4
4~ 44 4.4o
I' 0
xtii
00 10
0r1
SSa4 0
0-A. 06j -
IC.4
In %0r XE
('400 *
00
140

NAD-79056-60
$4
tn 0
"4W
(U ~ U ra N r-4
-4 1004
004~~ w .~00
00
o 4)
c4~C. -4 -4
-44 N
0 I
P49
0 +1
004%a-'
147 17-1

NADC-79056-60
00
04 V-4
4" N4 0"44
3
I) 0
0 1
I j tC4
afta
3.4
r-.4 0
n ; 41.4
I0
0 0~
old
O"40%148

NADC-79056-60
0
0
4
00
0. 0ca 0
m-S
o* 0
1491
1A.

NAD-79056-60
of
U,
a2 increasing
20% D.L. damage
N2 N log N21
Figure 64. Schematics for the Concept of Constant Damage Curves
150

N ADC-79056-60
to
1-4
z
"4 0
%0
+1
0
0
ca0
00
041
C-,d
41
C4-) C
t0)
~4
44.
151O

NAD-79036-60
0
40
0r4 0to 0
LM5
0en-
4m0
C4 464
1521

NADC-79056-60
004-
'-4
- m
CO4 -Ha
a I
a))
-zr
CO I
0)
Ch -
000
C14 C1 C14 4
153

NADc-7905"-0
Of
2
N1N 2N 3 N
(a) Schematic of A Spectrum Loading History
a f
au
S-N curve
A1 D a........ ...... E a3
a1
N1 N
(b) Damage Growth Path in the Load-Life Plane
Figure 68. Cumulative Damage Based on the Concept of Constant Damage State.
.04
NADC-79056-60
Non-Government Agencies (continued)
No. ofCopies
University of Wyoming, Laramie, WY 82071 (Attn: Dr. D. Adams). 1Villanova University, Villanova, PA 19085
(Attn: Dr. P. V. McLaughlin) . . . . . . . . . . . . . 1Virginia Polytechnic Institute, Blacksburg, VA 24061
(Attn: Dr. K. Reifsnider). . . .. .. . . . . .. 1Vought Corporation, Dallas, TX 75265
(Attn: Mr. 0. E. Dhonau/2-53442) . . . . . . . . . . . 1(Attn: Dr. J. Renton) ...... .................... 1
5
.........

NADC- 79056-60
Non-Government Agencies (continued)
No. ofCopies
McDonnell Douglas Corporation, St. Louis, MO 63166(Attn: Mr. J. Schier) ..... ...................... 1(Attn: Mr. C. Stenberg) ........... ................ I(Attn: Mr. R. Garrett) ..... ................. .i.
McDonnell Douglas Corporation, Long Beach, CA 90846(Attn: G. Lehman) ....... ................... . .. 1(Attn: D. Smillie) ............. ................ 1
Minnesota Mining and Manufacturing Company, St. Paul, MN 55104(Attn: Mr. W. Davis) ....... ................ . . 1
Northrop Aircraft Corporation, One Northrop Avenue, Hawthorne,CA 90250 (Attn: Mr. L. Jeans) ................. . . 1(Attn: Mr. D. Stansbarger) ..... .................. 1(Attn: Mr. R. C. Isemann) .......... ................ 1(Attn: Mr. R. M. Verette). . . ................ 1(Attn: Mr. B. Butler) .......................... 1
Owens Corning Fiberglass, Granville, OH 43023(Attn: Mr. D. Mettes) . ...........
Prototype Development Associates, Inc.: 1560"B;ookhollow Drive,Santa Ana, CA 92705 (Attn: E. L. Stanton) ............
Rockwell International, Columbus, OH 43216(Attn: Mr. F. Kaufman) .. ................. ..(Attn: Mr. M. Schweiger) ................. 1
Rockwell International, Los Angeles, CA 90009(Attn: Dr. Lackman) ...... ......................
Rockwell International, Tulsa, OK 74151(Attn: Mr. E. Sanders) ........ . .......... . . 1(Attn: Mr. J. H. Powell) ...... .............. . . . 1
Rohr Corporation, Riverside, CA 92503(Attn: Dr. F. Riel) ...... .................... . ...(Attn: Mr. R. Elkin) ............ ...... . ...
School of Engineering and Applied Science, Materials ResearchLaboratory, Washington University, Campus Box 1087, St.Louis, MO 63130 (Attn: T. Hahn). . .......... 1
Sikorsky Aircraft, Stratford, CT 06622(Attn: Mr. J. Ray) ...... ....................
Teledyne Ryan Aeronautical Company, San Diego, CA 92138(Attn: Mr. R. Long). . . ...................
Union Carbide Corporation, Cleveland, OH 44101(Attn: Dr. H. F. Volk) . . . . . ............... 1
University of Dayton Research Institute, 300 College Park Ave.,Dayton, OH 45469 (Attn: Dr. J. Gallagher). . ........ .
University of Delaware, Mechanics & Aerospace Eng. Dept.,Evans Hall, Newark, DE 19711 (Attn: Dr. R. B. Pipes) . . . 1
University of Oklahoma, Norman, OK 93069(Attn: Dr. C. W. Bert, School of AMNE) . . . . . . . . . . 1
4

NADC- 79056-60
Non-Government Agencies (continued)
No. ofCopies
Effects Technology, Inc., 5383 Holtister Avenue, P. 0.Box 30400, Santa Barbara, CA 93111 (Attn: Robert Globus) . . . . 2
E. I. DuPont Company, Wilmington, DE 19898(Attn: Dr. 3. Pigoiacampi). .. ..... .......... . 1
Fairchild Republic Company, Farmingdale, L.I., NY 11735(Attn: Mr. Frank Costa).............. . . .. .. .. .. .. .. .... 1
Georgia Institute of Technology, Atlanta, GA(Attn: Prof. W. H. Horton)..** . . . . . . . . 1
General Dynamics/Convair, San Dieo CA*92138(Attn: Mr. D. R. Dunbar)............. . . .. .. .. .. .. .. .... 1(Attn: Mr. W. G. Scheck). ........................ ...
General Dynamics, Fort Worth, TX 76101 **(Attn: Mr. J. A. Fant)......... .. .. .. .. .. .. .. .. .. 1(Attn: Mr. E. Petruska)...... ... .. .. .. .. .......... 1(Attn: Dr. D. Wilkins (Composite Structures Eng . Dept.) . . . . 1
General Electric Company, Phila., PA 19101(Attn-. Dr. C. Zweben)...... .... . .. .. .. .. .. .. .. .. 1(Attn: Mr. A. Garber). .. .................................
Great Lakes Carbon Corporation, NY, New York 10017(Attn: Mr. W. R. Benn, Mgr., Market Development)... .. .. .. .... 1
Grummian Aerospace Corporation, South Oyster Bay Rd., Bethpage,Long Island, NY 11714(Attn: Mr. R. Hadcock)... .. .. .. .. .. .. .. .. .. .. 1(Attn: Mr. S. Dastin)............. . ........ 1 *
Hercules Aerospace Div., P. 0. Box 210, Cumberland,'MD 21502(Attn: Mr. D. Hug) ... .. .. .. .. .. .. .. .. .. . 1
H. I. Thompson Fiber Glass Company, Gardena, CA 90240(Attn: Mr. N. Myers)................. ..... .. .. .. .. .... 1
ITT Research Institute, Chicago, IL 60616(Attn: Mr. K. Hofar)......... . . . . ......... 1
3. P. Stevens & Co., Inc., New York, NY 1036*(Attn: Mr. H. I. Shulock)...... .. .. .. .. .. .. . . . .
Kaman Aircraft Corporation, Bloomfield, CT 06002(Attn: TechnicLbary)i.r. r ......... . .. .. . . . . . 1
Lehigh University, Bethlehem, PA 18015(Attn: Dr. G. C. Sih) . . . .. .. .. . .. .. . . . . 1
Lockheed-California Co., Burbank, CA 91520(Attn: Mr. E.K. Walker)..... .. .. ... . . .. .. . .. 1
(Attn: Mr. Vaughn).................. . . ..... . .. .. .. .. .... 1(Attn: Mr. A. James)................. ..... .. .. .. .. .... 1
Lockheed-California Co., Rye Canyon Research Lab,Burbank, CA 91520 (Attn: Mr. Don E. Pettit).... .. .. .. ...... 1
Lockheed-Georgia Company, Marietta, GA 30063(Attn: Technical Information Dept., Dept. 72-34, Zone 26) . . . 1
Martin Company, Baltimore, MD 21220(Attn: Mr. J. E. Pawken)...... . . . ........ 1
Materials Sciences Corporation , Sp;ring House,*PA 19477..........
3

NADC-79056-60
Government Activities (continued)
No. ofCopies
NOL, White Oak, MD 20910(Attn: Mr. F. R. Barnet) ................ . . . . . 1
NRL, Washington, D.C. 20375(Attn: Dr. I. Wolock) .. .......... . . . . . . . . 1
ONR, Washington, D.C. 20362(Attn: Dr. N. Perrone). o.................... . . . . 1
PLASTEC, Picatinny Arsenal, Dover, NJ 07801(Attn: Mr. H. Pebly) . ... ____.. . . . . o ...... .1
(Attn: Librarian, Bldg. 176, SARPA-FR-M-D). . .... . 1U. S. Army Materials Research Center (DRXMR-TK),Watertown, MA 02172(Attn: Dr. E. Lenoe) ................... . . . . . 1(Attn: Mr. D. Oplinger) . . . . ............. . .. 1
U. S. Army Research Office, Durham, NC 27701 ..... .......... 1U. S. Army R&T Lab (AVRADCOM), Ames Research Center,Moffett Field, CA 94035 (Attn: Mr. F. Inmen, DAVDL-AS-M.S.207-5, Dr. R. Foye). . . ...................... 2
Non-Government Agencies
Avco, Aero Structures Division, Nashville, TN 37210. . . . . . .1
Battelle Columbus Laboratories, Metals and CeramicsInformation Center, 505 King Avenue, Columbus, OH 43201. . . .1
Bell Aerospace Company, Buffalo, NY 14240(Attn: Zone 1-85, Mr. F. M. Anthony) ........ ..... 1
Bell Helicopter Company, Fort Worth, TX 76101(Attn: Mr. G. Reis Alsmiller, Jr.).......... ..... 1
Bendix Products Aerospace Division, South Bend, IN 46619(Attn: Mr. R. V. Cervelli)... . . . . . . . . . . 1
Boeing Company, P. 0. Box 3707, Seattle, WA 98124(Attn: Mr. R. E. Horton, MS 9K-23) . . . . . . . . 1(Attn: Dr. R. June) .... . . . .. . ..
Boeing Company, Vertol Division, P. 0. Box 16858,Philadelphia, PA 19142(Attn: Mr. R: L. Pinckney) . . . . . . . . . . . . . . . .1(Attn: Mr. D. Hoffstedt). . . . .. . . .. . . . . .1(Attn: Mr. L. Marchinski) . . . . . . . . . . . . . . . . . . 1
Boeing Company, Wichita, KS 67210(Attn: R. D. Hoaglanb - M. S. -K32-95) . . . . . . . .0 01
Cabot Corporation, Billerica Research Center, Billerica,MA 01821 . . . . . ... -.... . . .. . . 1
Compositek Engineering Corporation, 6925-1 Aragon Circle,*Buena Park, CA 90620 (Attn: J. V. Noyes). . . . . . . . . . .1
Drexel University, Phila., PA 19104(Attn: Dr. P. C. Chou). . . . . . . . . . . . . . . . . . . .1(Attn: Dr. A. S. D. Wang) .... . . . . . . . . . . . .1
2
, f. .- l. t - . - - -

4