2g-0258 the 17th world conference on earthquake engineering
TRANSCRIPT

17th World Conference on Earthquake Engineering, 17WCEE
Sendai, Japan - September 13th to 18th 2020
Paper N° C003481
Registration Code: S- A00270
PERFORMANCE ASSESSMENT OF A LOW-COST SEISMIC ISOLATION
PROTOTYPE USING RECYCLED RUBBER
R. Reyna(1), A. Muñoz(2), C. Zavala(3)
(1) Associate Professor, National University of Engineering, [email protected](2) Research Assistant, Japan-Peru Center for Earthquake Engineering Research and Disaster Mitigation, [email protected](3) Professor, National University of Engineering, [email protected]
Abstract
According to the philosophy of seismic design of buildings of the Peruvian Earthquake Resistant Standard, buildings
must be design to keep the life of the inhabitants safe. The seismic design of essential buildings such as health centers, as
well as buildings that could be used as shelters in case of disaster, must ensure that those buildings remain operational
and functional post disaster. For this reason, it is necessary to protect seismically the structure. To do so, many
technologies have been developed and implemented throughout the world, one of them is the seismic isolation system of
structures. Peruvian standard requires that certain health center buildings must use a seismic isolation system to
seismically protect the building. However, common buildings such as dwellings, are not required to use seismic protection
of buildings. Due to the high cost of seismic isolation systems, a prototype of low-cost seismic isolation using recycled
rubber was developed in the structural laboratory of the Japan-Peru Center for Earthquake Engineering Research and
disaster Mitigation. The low-cost seismic isolation prototype was tested under a free vibration and lateral reversal cyclic
loading test, showing that the device has a good performance by dissipating the energy and shear strain deformation
around 100% up to the failure. From the literature reviewed, a comparison of the stress-strain relationship is carried out
and a modified stress-strain relationship to described the behavior of the developed device is proposed. Finally, comparing
the response of a base isolated building and a fix building under an earthquake motion was performed. The results of the
numerical simulations, show that the low-cost seismic isolation system proposed has a good performance by reducing the
shear force induced to the building and the story drift of the isolated building.
Keywords: performance assessment; low-cost; seismic isolation; recycled rubber; stress-strain relationship,
2g-0258 The 17th World Conference on Earthquake Engineering
© The 17th World Conference on Earthquake Engineering - 2g-0258 -

17th World Conference on Earthquake Engineering, 17WCEE
Sendai, Japan - September 13th to 18th 2020
2
1. Introduction
Seismic isolation system has been proved to be an efficient technology to protect buildings against earthquakes;
a clear example of this occurred during the Great East Japan Earthquake in 2011 where many seismic isolated
building did not suffer significant damages during the ground motion, moreover, buildings were kept
operational post-disaster. [1][2]
As Peru is located in a high seismic hazard zone, it is necessary to protect essential buildings like
hospitals, governmental buildings, etc., as it its required in the Seismic-Resistant Design Peruvian Standard,
to ensure the life of its inhabitants, to keep the structure and non-structural elements without any damage, and
that the building remains operational post-disaster.[3]
Seismic isolation system is expensive to afford, especially in developing countries; to protect buildings
that are not categorized as essential buildings, such as dwellings, or other minor structures, it will be almost
impossible to afford the use of this kind of system. For this reason, a prototype of isolator device with low cost
of manufacture were developed, ABC for its acronym in Spanish (Aislador de Bajo Costo), using recycled
rubber tire sheets. Three specimens were manufactured, and tested under a free vibration test and a lateral
reversal loading test, under a constant axial load around 10tonf and a maximum shear strain around 100%. [4]
Based on a proposed modified Bouc-Wen hysteresis model [5], the aim of this research is to evaluate
the performance of a base isolated system for a masonry dwelling, using the developed prototype ABC, through
a time history analysis, considering the height of the masonry building up to 4 story and different soil
conditions.
2. Outline of the Test and Test Result
2.1 Specimens
There specimens were manufactured (ABC-01, ABC-02 and ABC-03). The raw material used was recycled
rubber tires, the rubber tire was cut into a square shape sheet of 20cm x 20cm and about 1.1cm of thickness,
the internal wire mesh was kept as a contribution for the vertical stiffness of the isolator support, amount of
wire-reinforcement is about 8.59% of the cross-section.
Rubber tire sheets was joined to each other using a vulcanization process, with a rubber layer of 3mm
thickness made of recycled rubber tire powder in between rubber tire sheets; and in between the rubber tire
sheet and the steel plate at both ends of the bearing. In total 4 rubber tire sheets was used, with a total height
of the bearing of 6cm. the geometry of the specimen can be appreciated in Fig. 1
Fig. 1 – ABC specimen
Steel Plate
1/4"
2g-0258 The 17th World Conference on Earthquake Engineering
© The 17th World Conference on Earthquake Engineering - 2g-0258 -

17th World Conference on Earthquake Engineering, 17WCEE
Sendai, Japan - September 13th to 18th 2020
3
2.2 Free Vibration Test
A free vibration test was conducted in order to determine the dynamic properties of the specimens, by applying
an impulse and initial deformation to the specimen and recording the displacement and acceleration of the
specimen. By processing the recorded data, it is possible to determine the natural vibration frequency, natural
period, and inherent damping.
To carry out the free vibration test, different dead loads were applied on top of the isolators (see Fig. 2),
then, a sequence of initial impulse and initial deformation was applied to the specimen. The measurement
system to record the response of the specimen during the test was composed of accelerometers and laser
displacement transductors at the bottom and the top of the specimen.
Fig. 2 – Free vibration test with different dead load applied
The displacement and acceleration response of the specimens was recorded as is shown in Fig. 3. The
data was processed through filtering the noise. Using the processed data, a Fast Fourier Transform Analysis
was performed; from the Fourier spectrums of the specimen, its fundamental period was calculated. Also, from
the Weight vs Period graph shown in Fig. 4, is possible to calculate the initial stiffness of the specimen.
Fig. 3 – Free vibration test. Left: Acceleration response. Right: Displacement response
Fig. 4 – Weight vs Period of specimen ABC-02
2g-0258 The 17th World Conference on Earthquake Engineering
© The 17th World Conference on Earthquake Engineering - 2g-0258 -
17th World Conference on Earthquake Engineering, 17WCEE
Sendai, Japan - September 13th to 18th 2020
4
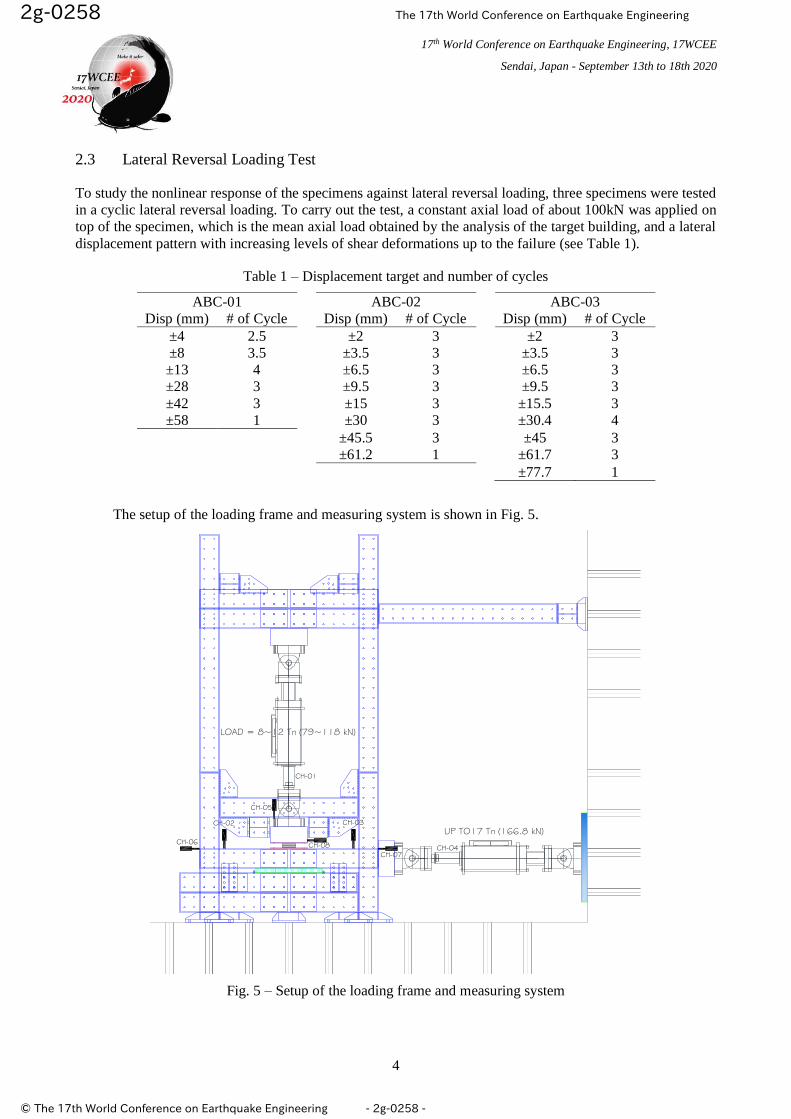
2.3 Lateral Reversal Loading Test
To study the nonlinear response of the specimens against lateral reversal loading, three specimens were tested
in a cyclic lateral reversal loading. To carry out the test, a constant axial load of about 100kN was applied on
top of the specimen, which is the mean axial load obtained by the analysis of the target building, and a lateral
displacement pattern with increasing levels of shear deformations up to the failure (see Table 1).
Table 1 – Displacement target and number of cycles
ABC-01 ABC-02 ABC-03
Disp (mm) # of Cycle Disp (mm) # of Cycle Disp (mm) # of Cycle
±4 2.5 ±2 3 ±2 3
±8 3.5 ±3.5 3 ±3.5 3
±13 4 ±6.5 3 ±6.5 3
±28 3 ±9.5 3 ±9.5 3
±42 3 ±15 3 ±15.5 3
±58 1 ±30 3 ±30.4 4
±45.5 3 ±45 3
±61.2 1 ±61.7 3
±77.7 1
The setup of the loading frame and measuring system is shown in Fig. 5.
Fig. 5 – Setup of the loading frame and measuring system
UP TO17 Tn (166.8 kN)
CH-01
CH-05
CH-02
CH-06
CH-03
CH-07
CH-08CH-04
LOAD = 8~12 Tn (79~118 kN)
2g-0258 The 17th World Conference on Earthquake Engineering
© The 17th World Conference on Earthquake Engineering - 2g-0258 -

17th World Conference on Earthquake Engineering, 17WCEE
Sendai, Japan - September 13th to 18th 2020
5
For the load measurement, two load cells were used; meanwhile, the horizontal and vertical
displacements of the top and bottom of the isolator were measured using displacement transducers, which
distribution is shown in Fig. 5. The loading frame and specimen ABC-02 during the test is shown in Fig. 6.
Fig. 6 – Loading frame and specimen
As an example, after processing the experimental data recorded by filtering the noise, correcting the
frictional force and deleting the pauses during the test; Fig. 7 shows the displacement pattern as well as the
hysteresis curve of specimen ABC-02.
Fig. 7 – Displacement pattern (a) and hysteresis curve (b)(c)(d)
(a) ABC-02 (b) ABC-01
(d) ABC-03 (c) ABC-02
2g-0258 The 17th World Conference on Earthquake Engineering
© The 17th World Conference on Earthquake Engineering - 2g-0258 -

17th World Conference on Earthquake Engineering, 17WCEE
Sendai, Japan - September 13th to 18th 2020
6
3. Review of the Stress-Strain Relationship Models
The essential hypothesis to model a base isolated building, is that the structure above the isolation level will
remain elastic or very close to the elastic behavior, which in other words means that the upper-structure will
not suffer significant damage. Takeda-silp model will be use to model the behavior of the upper-structure. On
the other hand, the base isolated system will be modeled using a nonlinear hysteretic model based on Bouc-
Wen model.
3.1 Stress-strain relationship of the building structure
The upper-structure will be modeled by using Takeda-slip model. Eto and Takeda (1973) modified the Takeda
model to incorporate a slip-type behavior at low stress level due to pull-out of longitudinal reinforcement from
the anchorage zone. The skeleton curve is tri-linear with stiffness changes at cracking and yielding where the
cracking and yielding levels can be different in positive and negative directions. The performance of the model
is identical to the Takeda model before yielding. [11]
The reloading pinching stiffness 𝐾𝑠 is defined by Eq. (1), the unloading stiffness for the same pinching
loop 𝐾𝑑 is defined by Eq. (2) and the slip stiffness 𝐾𝑝 is defined by Eq. (3)
𝐾𝑠 = 𝐹𝑚
𝐷𝑚 − 𝐷𝑜|𝐷𝑚
𝐷𝑦|
−𝛾
(1)
𝐾𝑑 = 𝐹𝑐
′ + 𝐹𝑦
𝐷𝑐′ − 𝐷𝑦
|𝐷𝑚
𝐷𝑦|
−𝛼
(2)
𝐾𝑝 = 𝜂 (𝐹𝑚
𝐷𝑚)
Where 𝐷𝑜 is the displacement at the end of the unloading (force equal to zero), 𝐷𝑚 and 𝐹𝑚 are the
maximum deformation and force in the direction of loading, 𝐷𝑦 and 𝐹𝑦 are the yielding deformation and
yielding force in the direction of loading and 𝛾 is the slip stiffness degradation factor (suggested to be equal to
0.5)
Where 𝐷𝑐′ and 𝐹𝑐
′ are the deformation and resistance at the cracking point on the opposite side, is the
displacement at the end of the unloading (resistance equal to zero), 𝐷𝑚 and 𝐹𝑚 are the maximum deformation
and resistance, 𝐷𝑦 is the yielding deformation and 𝛾 is the slip stiffness degradation factor (suggested to be
equal to 0.5)
2g-0258 The 17th World Conference on Earthquake Engineering
© The 17th World Conference on Earthquake Engineering - 2g-0258 -
17th World Conference on Earthquake Engineering, 17WCEE
Sendai, Japan - September 13th to 18th 2020
7
3.2 Stress-strain relationship of the seismic isolation system
The stress strain-relationship of the isolation system is based on the Bouc-Wen Model. The basic formula of
Bouc-Wen model, described by Ikhouane [6] and Saito [7] is shown in Eq.(3) and (4).
𝑓 = α𝑘0𝑥 + (1 − α)𝑘0𝑧 (3)
�̇� = 𝐴�̇� − (𝛽|�̇�||𝑧|𝑁−1𝑧 + 𝛾�̇�|𝑧|𝑁)𝜈
𝜂(4)
Where, 𝛽, 𝛾 and 𝑁 are parameters that control the shape of the hysteresis loop, while 𝐴, 𝜈 and 𝜂 are
variables that control the material degradation.
However, the original Bouc-Wen model does not fit well with the experimental data due to the lack to
reproduce the pinching effect and the hardening effect at the end of the loop so, inspired on the Bouc-Wen
Baber and Noori model [8] and using the properties of the Gauss bell, a modified Bouc-Wen model is proposed.
This model is described by the Eq. (5), (6), (7) and (8). The described hysteretic model is controlled by 11
parameters: 𝛼, 𝛽, 𝛾, 𝜔𝑛, 𝐴, 𝑛, 𝑠1, 𝜎1, 𝑑, 𝑠2, 𝜎2. [4]
𝑢(𝑡) = �̈� + 2𝜉𝜔𝑛�̇� + 𝛼𝜔𝑛2𝑥 + (1 − 𝛼)𝜔𝑛
2𝑧 (5)
�̇� = 𝐴�̇�1 − (𝛽|�̇�||𝑧|𝑛−1𝑧 + 𝛾�̇�|𝑧|𝑛) (6)
�̇�2 = √2
𝜋
𝑠1
𝜎1�̇�𝑒
−𝑥2
2𝜎2 − √2
𝜋
𝑠2
𝜎2�̇�𝑒
−(𝑥−𝑑 𝑠𝑔𝑛(�̇�))2
2𝜎22 (7)
𝑥 = 𝑥1 + 𝑥2 (8)
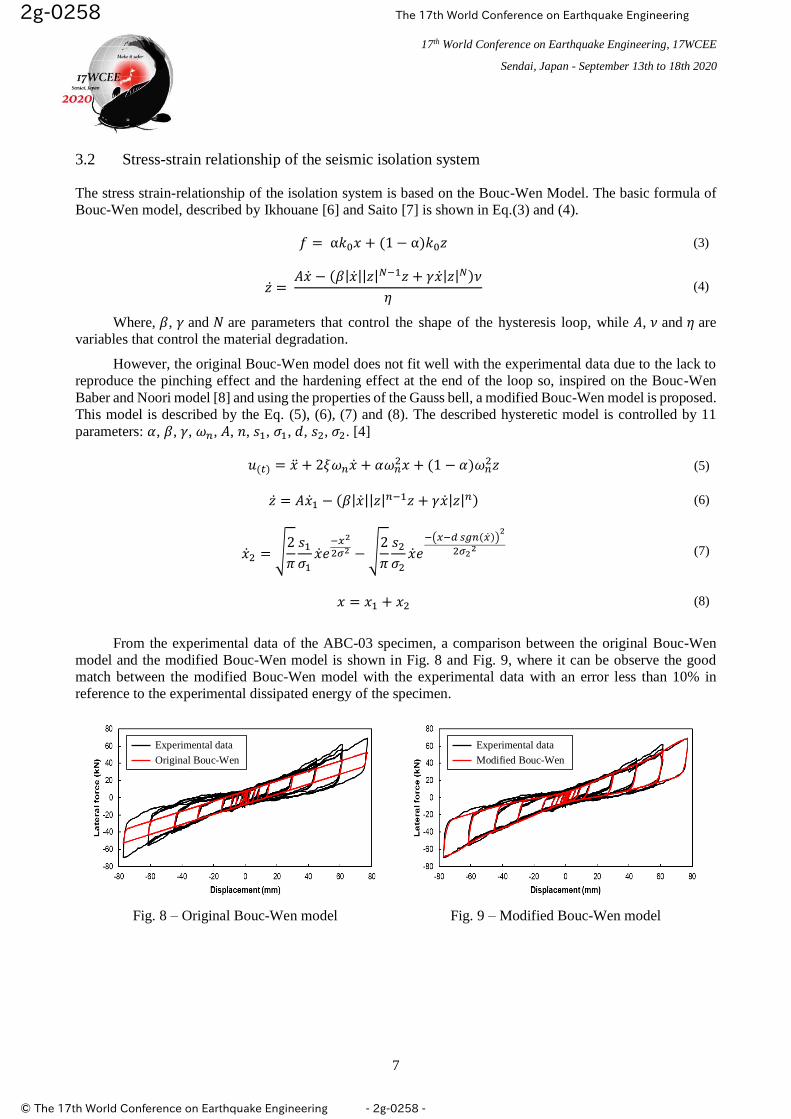
From the experimental data of the ABC-03 specimen, a comparison between the original Bouc-Wen
model and the modified Bouc-Wen model is shown in Fig. 8 and Fig. 9, where it can be observe the good
match between the modified Bouc-Wen model with the experimental data with an error less than 10% in
reference to the experimental dissipated energy of the specimen.
Fig. 8 – Original Bouc-Wen model Fig. 9 – Modified Bouc-Wen model
Experimental data
Original Bouc-Wen
Experimental data
Modified Bouc-Wen
2g-0258 The 17th World Conference on Earthquake Engineering
© The 17th World Conference on Earthquake Engineering - 2g-0258 -

17th World Conference on Earthquake Engineering, 17WCEE
Sendai, Japan - September 13th to 18th 2020
8
4. Time History Analysis of the Target Building
4.1 Target Building
To perform a Time History Analysis, the target building considered is a masonry dwelling located in Lima
city, and categorized as common building according to the Peruvian Standard E.030 Earthquake-Resistant
Design [3]. Considering a typical floor plan for de building as is shown in Fig. 10, the target building was
analyzed considering a different number of story.
Fig. 10 – Floor plan of the masonry dwelling
4.2 Comparison of the fixed and base isolated building
Two models were analyzed, the first one consist of 2 story fixed base building and the second one is a
2 story base isolated building using 16 ABC-3 isolators due to the axial loads transmitted to the isolators
oscillate between 100kN and 120kN. Considering soil type condition S1 and S2 according to the Earthquake-
Resistant Standard E.030[3], Fig. 11 shows the comparison of the displacement response of a fixed base and a
base isolated masonry dwelling, where a significant displacement reduction can be observed.
Fig. 11 – Displacement response of fixed and isolated building. Left: soil S1. Right: soil S2
2g-0258 The 17th World Conference on Earthquake Engineering
© The 17th World Conference on Earthquake Engineering - 2g-0258 -

17th World Conference on Earthquake Engineering, 17WCEE
Sendai, Japan - September 13th to 18th 2020
9
Lim
a 1966, L
ima
19
74 a
nd I
ca 2
007 E
arth
quak
e – S
oil
Type
S1
tico
2001, Ic
a 2007 a
nd L
agunas
2019
Ear
thquak
e. –
Soil
Type
S2
Fig. 12 – Earthquake response analysis of 2 story masonry dwelling
0
1
2
3
4
5
6
7
8
0 200 400 600 800 1000 1200
Sto
ry
Maximum absolute acceleration (cm/s2)
L66_400 EW
L66_400 NS
L66_600 EW
L66_600 NS
L66_800 EW
L66_800 NS
L66_900 EW
L66_900 NS
0
Base
1
2
0
1
2
3
4
5
6
7
8
0 10 20 30 40 50 60 70 80 90 100
Sto
ry
Maximum displacement (mm)
L66_400 EW
L66_400 NS
L66_600 EW
L66_600 NS
L66_800 EW
L66_800 NS
L66_900 EW
L66_900 NS
Limit (100%)0
Base
1
2
0
1
2
0.0001 0.0010 0.0100
Sto
ry
Maximum interstory drift
L66_400 EW
L66_400 NS
L66_600 EW
L66_600 NS
L66_800 EW
L66_800 NS
L66_900 EW
L66_900 NS
Limit (E.031)
1
2
Dri
ft li
mit
(0.0
035)
0
1
2
3
4
5
6
7
8
0 200 400 600 800 1000 1200
Sto
ry
Maximum absolute acceleration (cm/s2)
L74_400 EW
L74_400 NS
L74_500 EW
L74_500 NS
L74_600 EW
L74_600 NS
L74_700 EW
L74_700 NS
0
Base
1
2
0
1
2
3
4
5
6
7
8
0 10 20 30 40 50 60 70 80 90 100
Sto
ry
Maximum displacement (mm)
L74_400 EW
L74_400 NS
L74_500 EW
L74_500 NS
L74_600 EW
L74_600 NS
L74_700 EW
L74_700 NS
Limit (100%)0
Base
1
2
0
1
2
0.0001 0.0010 0.0100
Sto
ry
Maximum interstory drift
L74_400 EW
L74_400 NS
L74_500 EW
L74_500 NS
L74_600 EW
L74_600 NS
L74_700 EW
L74_700 NS
Limit (E.031)
1
2
Dri
ft li
mit
(0.0
035)
0
1
2
3
4
5
6
7
8
0 200 400 600 800 1000 1200
Sto
ry
Maximum absolute acceleration (cm/s2)
ICA_400 EW
ICA_400 NS
ICA_600 EW
ICA_600 NS
ICA_800 EW
ICA_800 NS
ICA_1000 EW
ICA_1000 NS
0
Base
1
2
0
1
2
3
4
5
6
7
8
0 10 20 30 40 50 60 70 80 90 100
Sto
ry
Maximum displacement (mm)
ICA_400 EW
ICA_400 NS
ICA_600 EW
ICA_600 NS
ICA_800 EW
ICA_800 NS
ICA_1000 EW
ICA_1000 NS
Limit (100%)0
Base
1
2
0
1
2
0.0001 0.0010 0.0100
Sto
ry
Maximum interstory drift
ICA_400 EW
ICA_400 NS
ICA_600 EW
ICA_600 NS
ICA_800 EW
ICA_800 NS
ICA_1000 EW
ICA_1000 NS
Limit (E.031)
1
2
Dri
ft li
mit
(0.0
035)
0
1
2
3
4
5
6
7
8
0 200 400 600 800 1000 1200
Sto
ry
Maximum absolute acceleration (cm/s2)
ATI_400 EW
ATI_400 NS
ATI_500 EW
ATI_500 NS
ATI_600 EW
ATI_600 NS
ATI_800 EW
ATI_800 NS0
Base
1
2
0
1
2
3
4
5
6
7
8
0 10 20 30 40 50 60 70 80 90 100
Sto
ry
Maximum displacement (mm)
ATI_400 EW
ATI_400 NS
ATI_500 EW
ATI_500 NS
ATI_600 EW
ATI_600 NS
ATI_800 EW
ATI_800 NS
Limit (100%)0
Base
1
2
0
1
2
0.0001 0.0010 0.0100
Sto
ry
Maximum interstory drift
ATI_400 EW
ATI_400 NS
ATI_500 EW
ATI_500 NS
ATI_600 EW
ATI_600 NS
ATI_800 EW
ATI_800 NS
Limit (E.031)
1
2
Dri
ft li
mit
(0.0
035)
0
1
2
3
4
5
6
7
8
0 200 400 600 800 1000 1200
Sto
ry
Maximum absolute acceleration (cm/s2)
ICA_400 EW
ICA_400 NS
ICA_500 EW
ICA_500 NS
ICA_600 EW
ICA_600 NS0
Base
1
2
0
1
2
3
4
5
6
7
8
0 10 20 30 40 50 60 70 80 90 100
Sto
ry
Maximum displacement (mm)
ICA_400 EW
ICA_400 NS
ICA_500 EW
ICA_500 NS
ICA_600 EW
ICA_600 NS
Limit (100%)0
Base
1
2
0
1
2
0.0001 0.0010 0.0100
Sto
ry
Maximum interstory drift
ICA_400 EW
ICA_400 NS
ICA_500 EW
ICA_500 NS
ICA_600 EW
ICA_600 NS
Limit (E.031)
1
2
Dri
ft li
mit
(0.0
035)
0
1
2
3
4
5
6
7
8
0 200 400 600 800 1000 1200
Sto
ry
Maximum absolute acceleration (cm/s2)
LAG_400 EW
LAG_400 NS
LAG_500 EW
LAG_500 NS
LAG_600 EW
LAG_600 NS
LAG_800 EW
LAG_800 NS0
Base
1
2
0
1
2
3
4
5
6
7
8
0 10 20 30 40 50 60 70 80 90 100
Sto
ry
Maximum displacement (mm)
LAG_400 EW
LAG_400 NS
LAG_500 EW
LAG_500 NS
LAG_600 EW
LAG_600 NS
LAG_800 EW
LAG_800 NS
Limit (100%)0
Base
1
2
0
1
2
0.0001 0.0010 0.0100
Sto
ry
Maximum interstory drift
LAG_400 EW
LAG_400 NS
LAG_500 EW
LAG_500 NS
LAG_600 EW
LAG_600 NS
LAG_800 EW
LAG_800 NS
Limit (E.031)
1
2
Dri
ft li
mit
(0.0
035)
2g-0258 The 17th World Conference on Earthquake Engineering
© The 17th World Conference on Earthquake Engineering - 2g-0258 -

17th World Conference on Earthquake Engineering, 17WCEE
Sendai, Japan - September 13th to 18th 2020
10
Lim
a 1966, L
ima
19
74 a
nd I
ca 2
007 E
arth
qu
ake – S
oil
Type
S1
tico
2001, Ic
a 2007 a
nd L
agunas
2019
Ear
thquak
e. –
Soil
Type
S2
Fig. 13 – Earthquake response analysis of 3 story masonry dwelling
0
1
2
3
4
5
6
7
8
9
10
11
0 200 400 600 800 1000
Sto
ry
Maximum absolute acceleration (cm/s2)
L66_400 EW
L66_400 NS
L66_500 EW
L66_500 NS
0
Base
1
2
3
0
1
2
3
4
5
6
7
8
9
10
11
0 20 40 60 80 100
Sto
ry
Maximum displacement (mm)
L66_400 EW
L66_400 NS
L66_500 EW
L66_500 NS
Limit (100%)
0
Base
1
3
2
0
1
2
3
0.0001 0.0010 0.0100
Sto
ry
Distorsión de entrepiso máxima
L66_400 EW
L66_400 NS
L66_500 EW
L66_500 NS
Limit (E.031)
1
3
Dri
ftlim
it(0
.003
5)
2
0
1
2
3
4
5
6
7
8
9
10
11
0 200 400 600 800 1000
Sto
ry
Maximum absolute acceleration (cm/s2)
L74_300 EW
L74_300 NS
L74_400 EW
L74_400 NS
0
Base
1
2
3
0
1
2
3
4
5
6
7
8
9
10
11
0 20 40 60 80 100
Sto
ry
Maximum displacement (mm)
L74_300 EW
L74_300 NS
L74_400 EW
L74_400 NS
Limit (100%)
0
Base
1
3
2
0
1
2
3
0.0001 0.0010 0.0100
Sto
ry
Distorsión de entrepiso máxima
L74_300 EW
L74_300 NS
L74_400 EW
L74_400 NS
Limit (E.031)
1
3
Dri
ftlim
it(0
.003
5)
2
0
1
2
3
4
5
6
7
8
9
10
11
0 200 400 600 800 1000
Sto
ry
Maximum absolute acceleration (cm/s2)
ICA_400 EW
ICA_400 NS
ICA_500 EW
ICA_500 NS
ICA_600 EW
ICA_600 NS0
Base
1
2
3
0
1
2
3
4
5
6
7
8
9
10
11
0 20 40 60 80 100
Sto
ry
Maximum displacement (mm)
ICA_400 EW
ICA_400 NS
ICA_500 EW
ICA_500 NS
ICA_600 EW
ICA_600 NS
Limit (100%)0
Base
1
3
2
0
1
2
3
0.0001 0.0010 0.0100
Sto
ry
Distorsión de entrepiso máxima
ICA_400 EW
ICA_400 NS
ICA_500 EW
ICA_500 NS
ICA_600 EW
ICA_600 NS
Limit (E.031)
1
3
Dri
ftlim
it(0
.003
5)
2
0
1
2
3
4
5
6
7
8
9
10
11
0 200 400 600 800 1000
Sto
ry
Maximum absolute acceleration (cm/s2)
ATI_400 EW
ATI_400 NS
ATI_500 EW
ATI_500 NS
ATI_600 EW
ATI_600 NS
0
Base
1
2
3
0
1
2
3
4
5
6
7
8
9
10
11
0 20 40 60 80 100
Sto
ry
Maximum displacement (mm)
ATI_400 EW
ATI_400 NS
ATI_500 EW
ATI_500 NS
ATI_600 EW
ATI_600 NS
Limit (100%)0
Base
1
2
3
0
0.5
1
1.5
2
2.5
3
3.5
0.0001 0.0010 0.0100
Sto
ry
Maximum interstory drift
ATI_400 EW
ATI_400 NS
ATI_500 EW
ATI_500 NS
ATI_600 EW
ATI_600 NS
Limit (E.031)
1
2
3
Dri
ft li
mit
(0.0
035)
0
1
2
3
4
5
6
7
8
9
10
11
0 200 400 600 800 1000
Sto
ry
Maximum absolute acceleration (cm/s2)
ICA_300 EW
ICA_300 NS
ICA_400 EW
ICA_400 NS
0
Base
1
2
3
0
1
2
3
4
5
6
7
8
9
10
11
0 20 40 60 80 100
Sto
ry
Maximum displacement (mm)
ICA_300 EW
ICA_300 NS
ICA_400 EW
ICA_400 NS
Limit (100%)
0
Base
1
2
3
0
0.5
1
1.5
2
2.5
3
3.5
0.0001 0.0010 0.0100
Sto
ry
Maximum interstory drift
ICA_300 EW
ICA_300 NS
ICA_400 EW
ICA_400 NS
Limit (E.031)
1
2
3
Dri
ft li
mit
(0.0
035)
0
1
2
3
4
5
6
7
8
9
10
11
0 200 400 600 800 1000
Sto
ry
Maximum absolute acceleration (cm/s2)
LAG_400 EW
LAG_400 NS
LAG_500 EW
LAG_500 NS
LAG_600 EW
LAG_600 NS
0
Base
1
2
3
0
1
2
3
4
5
6
7
8
9
10
11
0 20 40 60 80 100
Sto
ry
Maximum displacement (mm)
LAG_400 EW
LAG_400 NS
LAG_500 EW
LAG_500 NS
LAG_600 EW
LAG_600 NS
Limit (100%)0
Base
1
2
3
0
0.5
1
1.5
2
2.5
3
3.5
0.0001 0.0010 0.0100
Sto
ry
Maximum interstory drift
LAG_400 EW
LAG_400 NS
LAG_500 EW
LAG_500 NS
LAG_600 EW
LAG_600 NS
Limit (E.031)
1
2
3
Dri
ft li
mit
(0.0
035)
2g-0258 The 17th World Conference on Earthquake Engineering
© The 17th World Conference on Earthquake Engineering - 2g-0258 -
17th World Conference on Earthquake Engineering, 17WCEE
Sendai, Japan - September 13th to 18th 2020
11
Lim
a 1966, L
ima
19
74 a
nd I
ca 2
007 E
arth
qu
ake – S
oil
Type
S1
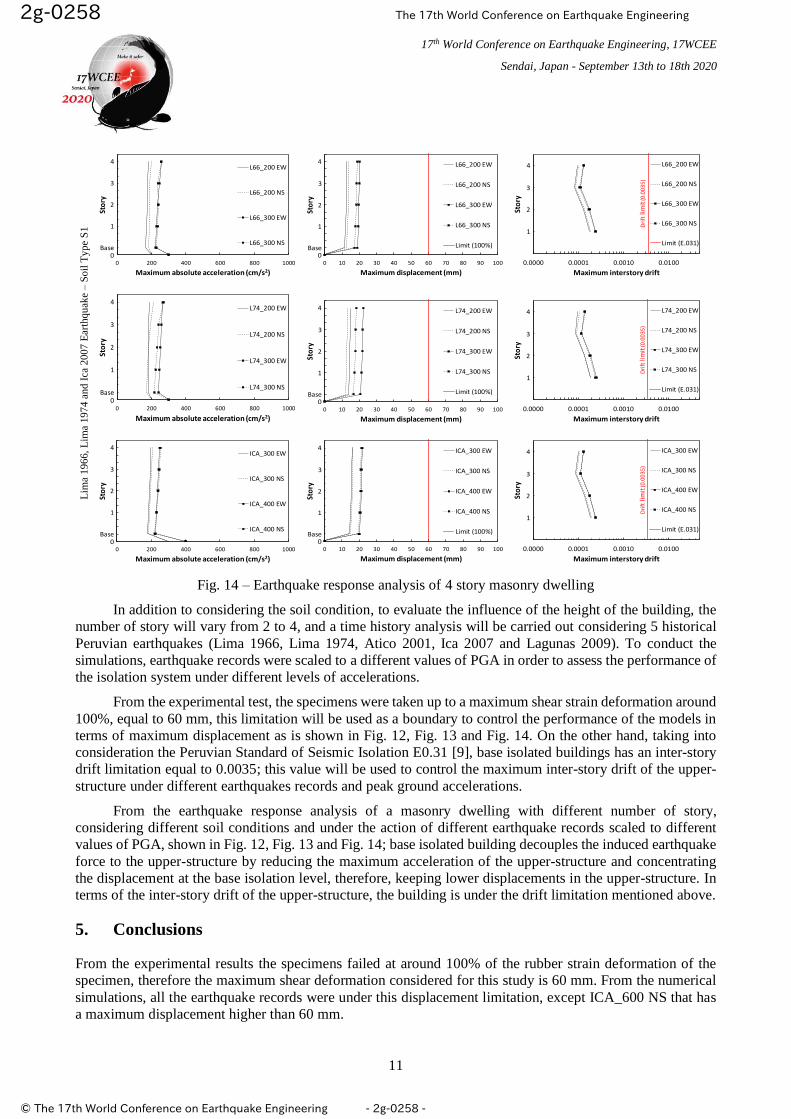
Fig. 14 – Earthquake response analysis of 4 story masonry dwelling
In addition to considering the soil condition, to evaluate the influence of the height of the building, the
number of story will vary from 2 to 4, and a time history analysis will be carried out considering 5 historical
Peruvian earthquakes (Lima 1966, Lima 1974, Atico 2001, Ica 2007 and Lagunas 2009). To conduct the
simulations, earthquake records were scaled to a different values of PGA in order to assess the performance of
the isolation system under different levels of accelerations.
From the experimental test, the specimens were taken up to a maximum shear strain deformation around
100%, equal to 60 mm, this limitation will be used as a boundary to control the performance of the models in
terms of maximum displacement as is shown in Fig. 12, Fig. 13 and Fig. 14. On the other hand, taking into
consideration the Peruvian Standard of Seismic Isolation E0.31 [9], base isolated buildings has an inter-story
drift limitation equal to 0.0035; this value will be used to control the maximum inter-story drift of the upper-
structure under different earthquakes records and peak ground accelerations.
From the earthquake response analysis of a masonry dwelling with different number of story,
considering different soil conditions and under the action of different earthquake records scaled to different
values of PGA, shown in Fig. 12, Fig. 13 and Fig. 14; base isolated building decouples the induced earthquake
force to the upper-structure by reducing the maximum acceleration of the upper-structure and concentrating
the displacement at the base isolation level, therefore, keeping lower displacements in the upper-structure. In
terms of the inter-story drift of the upper-structure, the building is under the drift limitation mentioned above.
5. Conclusions
From the experimental results the specimens failed at around 100% of the rubber strain deformation of the
specimen, therefore the maximum shear deformation considered for this study is 60 mm. From the numerical
simulations, all the earthquake records were under this displacement limitation, except ICA_600 NS that has
a maximum displacement higher than 60 mm.
0
1
2
3
4
5
6
7
8
9
10
11
12
13
14
0 200 400 600 800 1000
Sto
ry
Maximum absolute acceleration (cm/s2)
L66_200 EW
L66_200 NS
L66_300 EW
L66_300 NS
0Base
1
2
3
4
0
1
2
3
4
5
6
7
8
9
10
11
12
13
14
0 10 20 30 40 50 60 70 80 90 100
Sto
ry
Maximum displacement (mm)
L66_200 EW
L66_200 NS
L66_300 EW
L66_300 NS
Limit (100%)
0Base
1
3
2
4
0
1
2
3
4
0.0000 0.0001 0.0010 0.0100
Sto
ry
Maximum interstory drift
L66_200 EW
L66_200 NS
L66_300 EW
L66_300 NS
Limit (E.031)
1
3
Dri
ftlim
it(0
.003
5)
2
4
0
1
2
3
4
5
6
7
8
9
10
11
12
13
14
0 200 400 600 800 1000
Sto
ry
Maximum absolute acceleration (cm/s2)
L74_200 EW
L74_200 NS
L74_300 EW
L74_300 NS
0Base
1
2
3
4
0
1
2
3
4
5
6
7
8
9
10
11
12
13
14
0 10 20 30 40 50 60 70 80 90 100
Sto
ry
Maximum displacement (mm)
L74_200 EW
L74_200 NS
L74_300 EW
L74_300 NS
Limit (100%)
0Base
1
3
2
4
0
1
2
3
4
0.0000 0.0001 0.0010 0.0100
Sto
ry
Maximum interstory drift
L74_200 EW
L74_200 NS
L74_300 EW
L74_300 NS
Limit (E.031)
1
3
Dri
ftlim
it(0
.003
5)
2
4
0
1
2
3
4
5
6
7
8
9
10
11
12
13
14
0 200 400 600 800 1000
Sto
ry
Maximum absolute acceleration (cm/s2)
ICA_300 EW
ICA_300 NS
ICA_400 EW
ICA_400 NS
0Base
1
2
3
4
0
1
2
3
4
5
6
7
8
9
10
11
12
13
14
0 10 20 30 40 50 60 70 80 90 100
Sto
ry
Maximum displacement (mm)
ICA_300 EW
ICA_300 NS
ICA_400 EW
ICA_400 NS
Limit (100%)
0Base
1
3
2
4
0
1
2
3
4
0.0000 0.0001 0.0010 0.0100
Sto
ry
Maximum interstory drift
ICA_300 EW
ICA_300 NS
ICA_400 EW
ICA_400 NS
Limit (E.031)
1
3
Dri
ftlim
it(0
.00
35
)
2
4
2g-0258 The 17th World Conference on Earthquake Engineering
© The 17th World Conference on Earthquake Engineering - 2g-0258 -

17th World Conference on Earthquake Engineering, 17WCEE
Sendai, Japan - September 13th to 18th 2020
12
Considering the maximum inter-story drift equal to 0.0035, all the earthquake records were under this
drift limitation, which means that the building has no significant damage in the upper-structure, and that the
displacement is concentrated at the isolation level.
Proposed hysteresis model, gives a good approach of the experimental results, however the model has
11 parameters that controls the model, therefore it is necessary to improve the model to better characterize it
by an adequate choosing of the parameters based on experimental information.
ABC specimens were considerend to work in compression, but rocking effect were shown during the
test, therefore the numerical analysis were considered up to a rocking tolerance were not tension force in the
isolator is allowed.
6. Acknowledgements
The authors would like express their gratitude to the researchers and research assistant who contribute
significantly during the experimental test as well as to the technicians of CISMID for their valuable support
for the preparations of the tests.
7. Copyrights
17WCEE-IAEE 2020 reserves the copyright for the published proceedings. Authors will have the right to use
content of the published paper in part or in full for their own work. Authors who use previously published data
and illustrations must acknowledge the source in the figure captions.
8. References
[1] Reyna R, Saito T (2012): Numerical simulation of base isolated buildings during the Great East Japan Earthquake
and a proposal for a design procedure of base isolation system in Peru, Bulletin of the International Institute of
Seismology and Earthquake Engineering, 47, 103-108.
[2] Reyna R, Saito T, Zavala C, (2013). Numerical simulation of base isolated buildings during the Great East Japan
Earthquake and a comparison of different hysteresis models, Technical Paper, 13th World Conference on Seismic
Isolation, Energy Dissipation and Active Vibration Control of Structures, Sendai, Japan.
[3] Minitry of Housing, Construction and Sanitation (2018): Technical Standard E.030 Earthquake-Resistant Design.
[4] Reyna R, Muñoz A, Zavala C, Diaz M (2018): Prototype of low-cost seismic isolator using recycled tire sheets.
Technical Paper No. 11323, 16th European Conference on Earthquake Engineering, Thessaloniki, Greece.
[5] Muñoz A, Diaz M, Reyna R (2019): Applicability study of a low cost seismic isolator prototype using recycled
rubber. TECNIA, 29(2).
[6] Ikhouane F, Mañosa V, Rodellar J (2007): Dynamic properties of the hysteretic Bouc-Wen model, Technical Paper,
Systems & control letters. 56, 197-205.
[7] Saito T (2019): STERA3D Structural Earthquake Response Analysis 3D Technical Manual version 6.3. Toyohashi
University of Technology, Japan.
[8] Baber TT, Noori, MN (1985): Random vibration of degrading, pinching systems. Journal of Engineering Mechanics.
111(8), 1010-1026.
[9] Minitry of Housing, Construction and Sanitation (2019): Technical Standard E.031 Seismic Isolation.
[10] Eto H, Takeda Y (1973): Elasto Plastic Earthquake Response Analysis of Reinforced Concrete Frame Structure (in
Japanese). Report, Annual Meeting, Architectural Institute of Japan. 1261-1262.
[11] Otani S, (2002): Nonlinear Earthquake Response Analysis of Reinforced Concrete Buildings. Lecture Notes,
Department of Architecture, Graduate School of Engineering, University of Toyo, Japan.
2g-0258 The 17th World Conference on Earthquake Engineering
© The 17th World Conference on Earthquake Engineering - 2g-0258 -