2h16 telecom industry outlook
TRANSCRIPT
Telecom Service Solid downside support and decent growth potential
In late phase of LTE era: Consumption diverging and becoming rational
LTE technology came to Korea in end-2011. Nearly five years later, the domestic telecom service industry is now entering the late phase of the LTE era. During the initial high-growth phase, early adopters purchased expensive handsets and subscribed to high-priced rate plans. Now, telecom service consumption trends are changing. 1) First, consumption is diverging, with the gap between telcos’ average rates and MVNO rates widening further this year, compared to 2012. 2) Second, consumers are becoming more rational. Low- to mid-end handset purchases out of all purchases are estimated to be near 30%, from less than 10% in 2012. In addition, the cumulative number of subscribers who have chosen a rate discount in lieu of subsidies has surpassed 10% of overall mobile subscribers.
Risks from telecom plan restrictions; Opportunities from growing data usage and business expansion
The most serious threat to telcos in 2H should be downward pressure on plan prices. Once the new National Assembly takes office in June, a revision to the handset distribution act and a bill related to telecom plan restrictions will likely be proposed. With ARPU growth slowing and service rate discounts being booked as sales discounts, telcos must find ways to deal with the growing pressure to lower telecom bills. In our view, they could point to the following facts to justify current rates: 1) Telecom expenses as a percentage of household spending have steadily decreased over the past decade. 2) Handset purchase expenses are a bigger driver of household spending growth than service plans. 3) Data plans are cheaper in Korea than in other countries.
On the bright side, we believe telcos will find opportunities from high-priced rate plans amid growing data usage. In addition, telcos are expanding aggressively into new business areas, with a particular growing influence in the media business. Furthermore, capitalizing on nationwide IoT networks, telcos are planning full-swing launch of low-power wide-area network (LPWAN) services.
2H: Attractive dividend payout; Aggressive expansion; Retain Overweight
Free cash flow at domestic telcos is improving markedly. Capex has been on the downswing in the era of advanced telecom technology, while variable costs have also decreased due to stable marketing competition. Given stable earnings and ample cash flow, we expect telcos to show attractive dividend payout. If shares correct due to regulatory risks, high dividend yields should provide downside support. Telcos’ growth prospects also appear decent in light of their aggressive business expansion.
We retain our Overweight rating on the telecom sector. In the short term, we recommend KT in light of its high earnings visibility and dividend growth. And from a longer-term perspective (through the end of the year), we recommend SK Telecom (SKT) given its high dividend payout and aggressive business expansion.
Overweight (Maintain)
2H16 Outlook Report
June 3, 2016
Mirae Asset Daewoo Co., Ltd.
[Telecom Service / Media]
Jee-hyun Moon
+822-768-3615
Nu-ri Ha
+822-768-4130
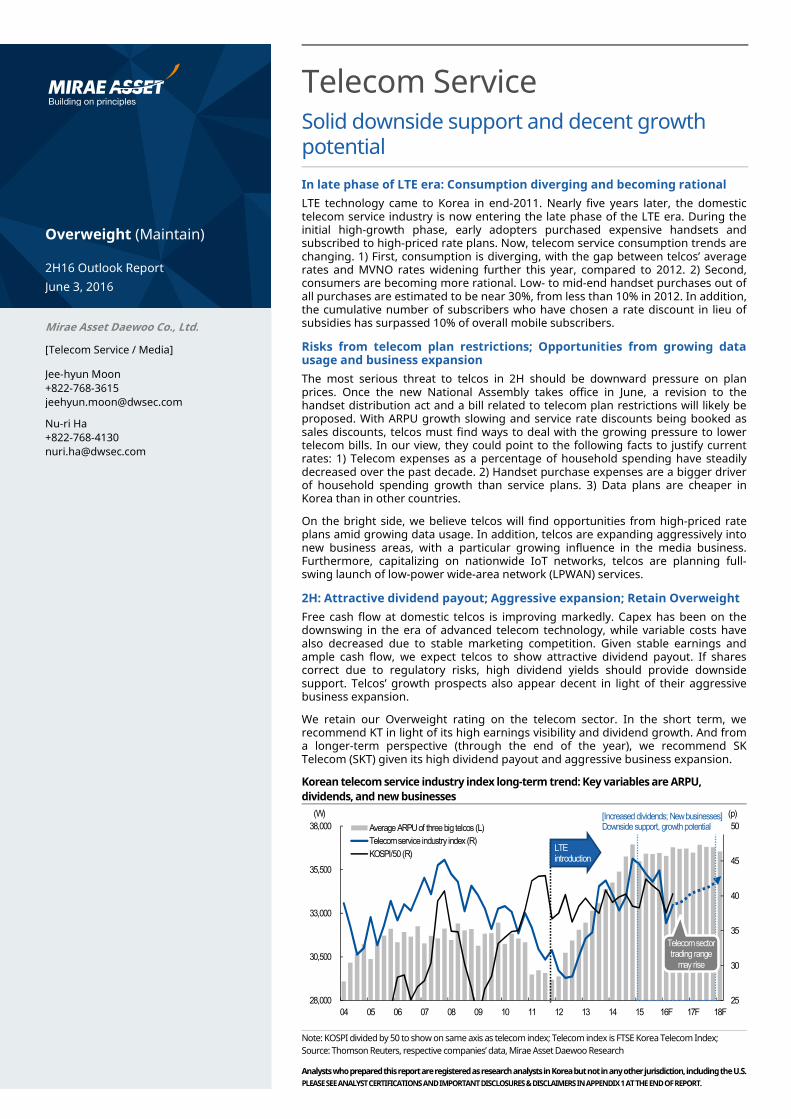
Korean telecom service industry index long-term trend: Key variables are ARPU,
dividends, and new businesses
Note: KOSPI divided by 50 to show on same axis as telecom index; Telecom index is FTSE Korea Telecom Index;
Source: Thomson Reuters, respective companies’ data, Mirae Asset Daewoo Research
25
30
35
40
45
50
28,000
30,500
33,000
35,500
38,000
04 05 06 07 08 09 10 11 12 13 14 15 16F 17F 18F
(p)(W)
Average ARPU of three big telcos (L)
Telecom service industry index (R)
KOSPI/50 (R)LTE introduction
[Increased dividends; New businesses]Downside support, growth potential
Telecom sector trading range
may rise
Telecom Service
2
June 3, 2016
Mirae Asset Daewoo Research
C O N T E N T S
Industry trends: Entering late phase of LTE era 3 1. Consumption diverging 3 2. Consumers becoming increasingly rational 4 3. Cash utilization 5
Risks in 2H: Regulations 6 1. Pressure to cut telecom rates 6 2. How to handle growing pressure to lower monthly bills 7
Opportunities in 2H16: Growth strategy 9 1. Wireless 9 2. Media 14 3. Internet of Things (IoT) 20
Investment & valuation 22 1. Attractive dividend yields 22 2. Investment strategy 23 3. Valuation comparison 24
KT (030200 KS) 25 SK Telecom (017670 KS) 28 LG Uplus (032640 KS) 31
Telecom Service
3
June 3, 2016
Mirae Asset Daewoo Research
Industry trends: Entering late phase of LTE era
1. Consumption diverging
LTE technology came to Korea in end-2011. Nearly five years later, the domestic telecom
service industry is now entering the late phase of the LTE era. During the initial high-growth
phase, early adopters purchased expensive handsets and subscribed to high-priced rate
plans. Now, telecom service consumption trends are changing.
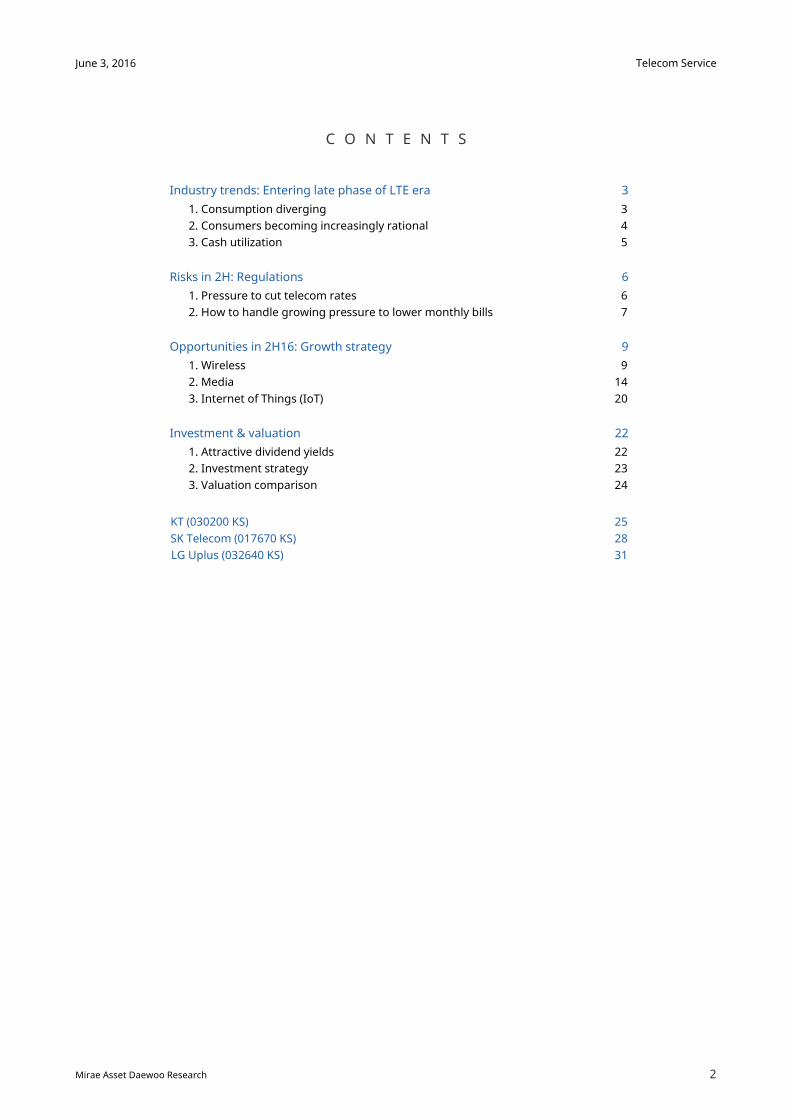
First, consumption is diverging. While subscribers to relatively high-priced LTE plans are
expanding, MVNO subscribers are also growing. Currently, MVNO subscribers account for
10.5% of overall subscriptions, and this figure is expected to grow to roughly 15% by year-
end. And the gap between telcos’ average rates and MVNO rates has been widening further
this year compared to 2012.
In France and Japan, which introduced MVNO before Korea, MVNO subscribers make up
10% and 17% of overall subscribers, respectively. Despite the later introduction, Korea has
seen a swift increase in MVNO subscribers, aided by the government’s support and
promotion and strong marketing activities by CJ HelloVision.
Figure 1. Consumption is diverging, as subscribers to high-priced LTE plans and low-priced MVNO
plans are growing simultaneously
Source: MSIP, Mirae Asset Daewoo Research
Figure 2. The ARPU gap between traditional telcos (MNOs) and MVNOs is widening
Note: ARPU = average revenue per user
Source: Respective companies’ data, Mirae Asset Daewoo Research
0
1
2
3
4
5
6
7
0
10
20
30
40
50
1/13 7/13 1/14 7/14 1/15 7/15 1/16
(mn people)(mn people)
Number of LTE subscribers (L)
Number of MVNO subscribers (R)
W10,728 difference
W14,642 difference
15,000
20,000
25,000
30,000
35,000
40,000
1Q12 1Q13 1Q14 1Q15 1Q16
(W)
Average MNO ARPU
Average MVNO (CJ HelloVision) ARPU
Telecom Service
4
June 3, 2016
Mirae Asset Daewoo Research
2. Consumers becoming increasingly rational
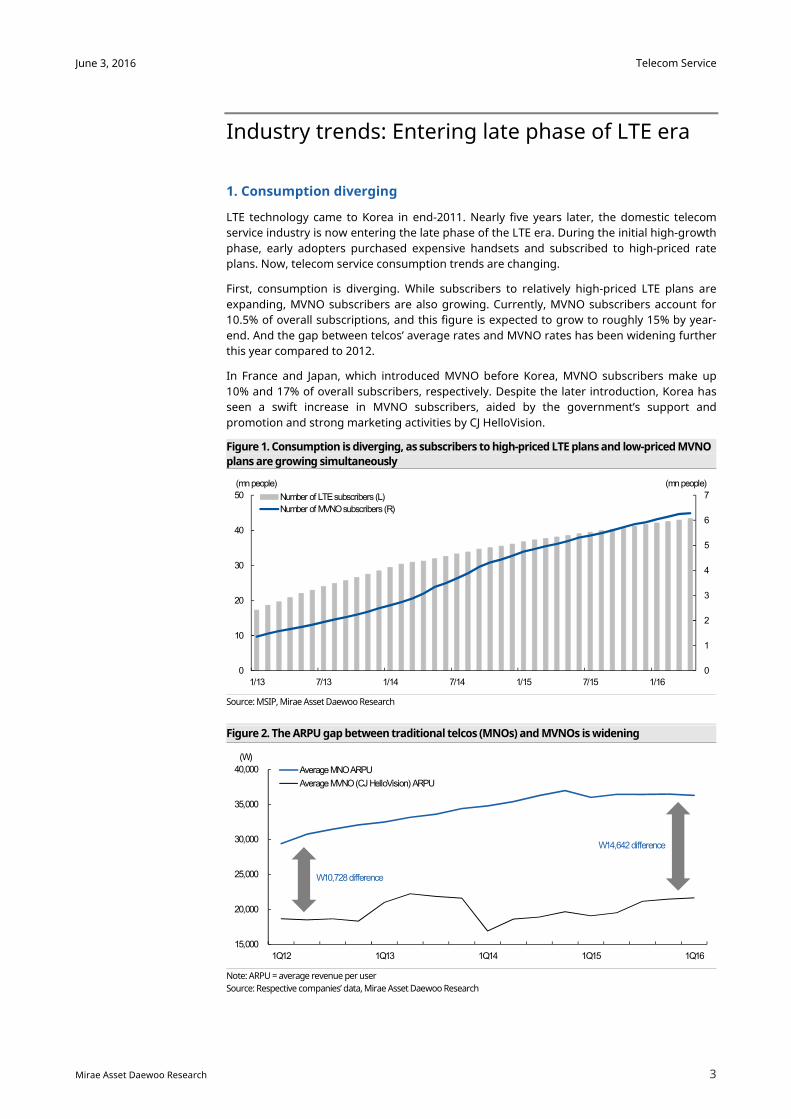
Consumers are becoming increasingly rational in choosing telecom services. An increasing
number of subscribers are opting for a rate discount instead of subsidies when purchasing
handsets. The option to receive a discount upon purchase was introduced in October 2014,
and in April 2015, the government increased the discount to 20% (from 12%). Starting this
year, consumers can look up whether discounted rates are available to them.
The handset distribution act placed a ceiling on subsidies. In addition, for premium models,
initial subsidies are minimal, prompting consumers to opt for discounted rates.
Low- to mid-end handset purchases out of all purchases are estimated to be near 30%, from
less than 10% in 2012. The average selling price at global handset producers declined to
US$291 in 2016, from US$386 in 2012.
Overall improvement in smartphone specifications has contributed to the growth of
low/mid-end phone sales. In efforts to boost sales volume, handset makers have been
lowering the prices of premium models and/or expanding their low/mid-end lineups.
Domestic telcos’ launch of low/mid-end handset brands—namely SKT’s LUNA—also
contributed to an increase in subscribers.
Figure 3. Cumulative number of subscribers opting for discounted rates is growing, prompted by
increase in discount and introduction of discount eligibility inquiry service
Source: MSIP, Mirae Asset Daewoo Research
Figure 4. Proportion of mid/low-end mobile phone purchases recently reached 30%, from below
10% in 2012
Note: Low/mid-end phones defined as those priced below W500,000
Source: MSIP, ATLAS, Mirae Asset Daewoo Research
0
10
20
30
40
2012 2013 1Q14 2Q14 3Q14 4Q14 1Q15 2Q15 3Q15 4Q15
(%)
Proportion of low/mid-end smartphone purchases out of all purchases
0
2
4
6
8
10
12
0
2
4
6
8
10/14 1/15 4/15 7/15 10/15 1/16
(%)(mn people)
Cumulative number of subscribers opting for discount (L)
Proportion of all mobile subscribers (R)
4/15:Raised discount to20% from 12%
1/16:Started discounteligibility inquiryservice
10/14:Introductionof discounted rate option
Telecom Service
5
June 3, 2016
Mirae Asset Daewoo Research
3. Cash utilization
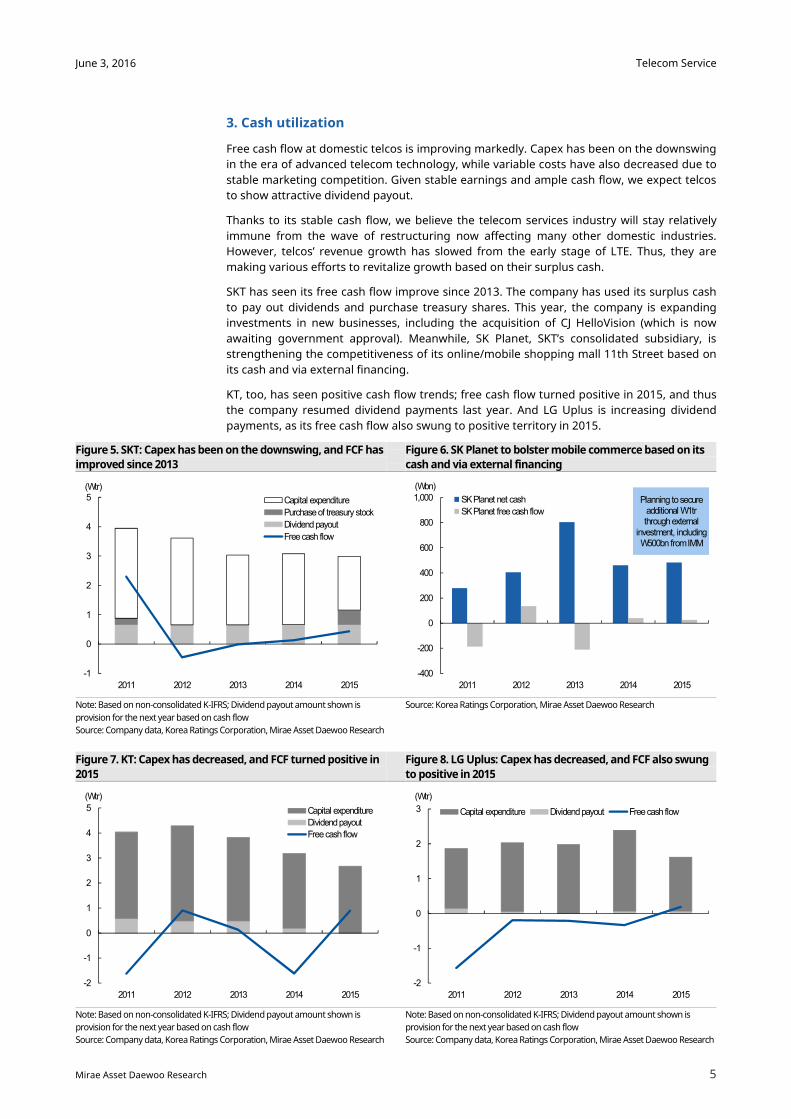
Free cash flow at domestic telcos is improving markedly. Capex has been on the downswing
in the era of advanced telecom technology, while variable costs have also decreased due to
stable marketing competition. Given stable earnings and ample cash flow, we expect telcos
to show attractive dividend payout.
Thanks to its stable cash flow, we believe the telecom services industry will stay relatively
immune from the wave of restructuring now affecting many other domestic industries.
However, telcos’ revenue growth has slowed from the early stage of LTE. Thus, they are
making various efforts to revitalize growth based on their surplus cash.
SKT has seen its free cash flow improve since 2013. The company has used its surplus cash
to pay out dividends and purchase treasury shares. This year, the company is expanding
investments in new businesses, including the acquisition of CJ HelloVision (which is now
awaiting government approval). Meanwhile, SK Planet, SKT’s consolidated subsidiary, is
strengthening the competitiveness of its online/mobile shopping mall 11th Street based on
its cash and via external financing.
KT, too, has seen positive cash flow trends; free cash flow turned positive in 2015, and thus
the company resumed dividend payments last year. And LG Uplus is increasing dividend
payments, as its free cash flow also swung to positive territory in 2015.
Figure 5. SKT: Capex has been on the downswing, and FCF has
improved since 2013
Figure 6. SK Planet to bolster mobile commerce based on its
cash and via external financing
Note: Based on non-consolidated K-IFRS; Dividend payout amount shown is
provision for the next year based on cash flow
Source: Company data, Korea Ratings Corporation, Mirae Asset Daewoo Research
Source: Korea Ratings Corporation, Mirae Asset Daewoo Research
Figure 7. KT: Capex has decreased, and FCF turned positive in
2015
Figure 8. LG Uplus: Capex has decreased, and FCF also swung
to positive in 2015
Note: Based on non-consolidated K-IFRS; Dividend payout amount shown is
provision for the next year based on cash flow
Source: Company data, Korea Ratings Corporation, Mirae Asset Daewoo Research
Note: Based on non-consolidated K-IFRS; Dividend payout amount shown is
provision for the next year based on cash flow
Source: Company data, Korea Ratings Corporation, Mirae Asset Daewoo Research
-1
0
1
2
3
4
5
2011 2012 2013 2014 2015
(Wtr)
Capital expenditure
Purchase of treasury stock
Dividend payout
Free cash flow
-2
-1
0
1
2
3
4
5
2011 2012 2013 2014 2015
(Wtr)
Capital expenditure
Dividend payout
Free cash flow
-2
-1
0
1
2
3
2011 2012 2013 2014 2015
(Wtr)
Capital expenditure Dividend payout Free cash flow
-400
-200
0
200
400
600
800
1,000
2011 2012 2013 2014 2015
(Wbn)
SK Planet net cash
SK Planet free cash flow
Planning to secure additional W1tr through external
investment, including W500bn from IMM
Telecom Service
6
June 3, 2016
Mirae Asset Daewoo Research
Risks in 2H: Regulations
1. Pressure to cut telecom rates
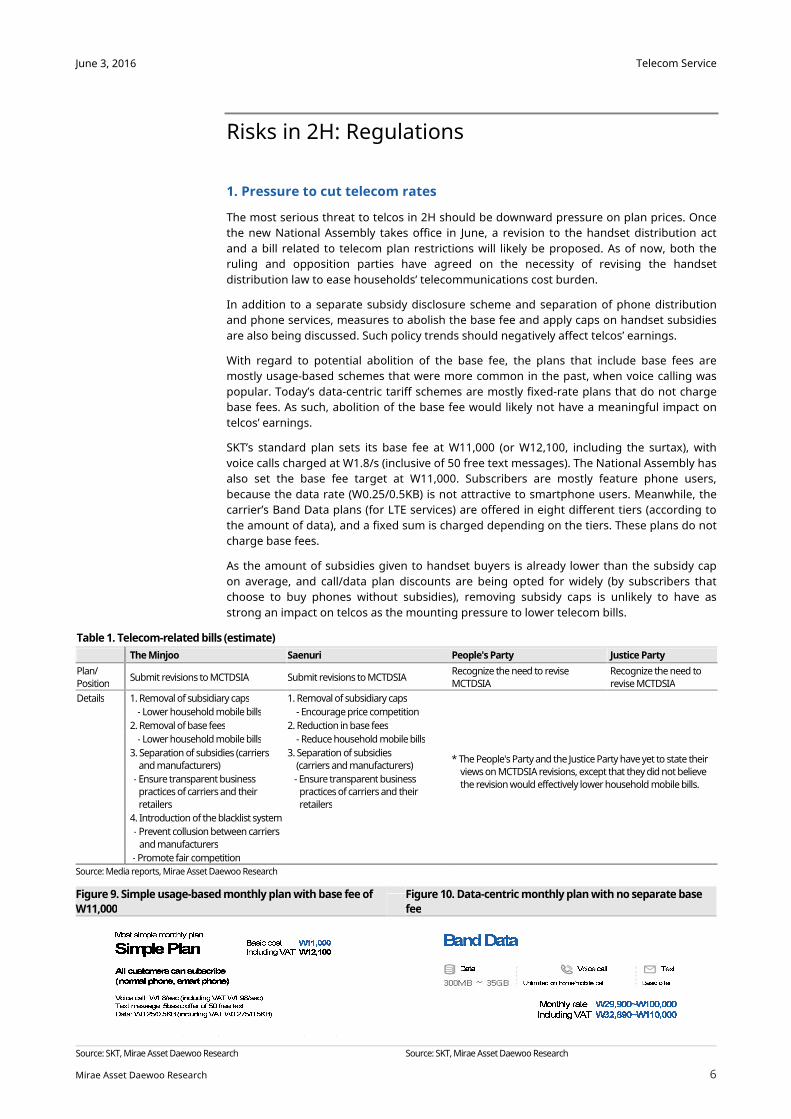
The most serious threat to telcos in 2H should be downward pressure on plan prices. Once
the new National Assembly takes office in June, a revision to the handset distribution act
and a bill related to telecom plan restrictions will likely be proposed. As of now, both the
ruling and opposition parties have agreed on the necessity of revising the handset
distribution law to ease households’ telecommunications cost burden.
In addition to a separate subsidy disclosure scheme and separation of phone distribution
and phone services, measures to abolish the base fee and apply caps on handset subsidies
are also being discussed. Such policy trends should negatively affect telcos’ earnings.
With regard to potential abolition of the base fee, the plans that include base fees are
mostly usage-based schemes that were more common in the past, when voice calling was
popular. Today’s data-centric tariff schemes are mostly fixed-rate plans that do not charge
base fees. As such, abolition of the base fee would likely not have a meaningful impact on
telcos’ earnings.
SKT’s standard plan sets its base fee at W11,000 (or W12,100, including the surtax), with
voice calls charged at W1.8/s (inclusive of 50 free text messages). The National Assembly has
also set the base fee target at W11,000. Subscribers are mostly feature phone users,
because the data rate (W0.25/0.5KB) is not attractive to smartphone users. Meanwhile, the
carrier’s Band Data plans (for LTE services) are offered in eight different tiers (according to
the amount of data), and a fixed sum is charged depending on the tiers. These plans do not
charge base fees.
As the amount of subsidies given to handset buyers is already lower than the subsidy cap
on average, and call/data plan discounts are being opted for widely (by subscribers that
choose to buy phones without subsidies), removing subsidy caps is unlikely to have as
strong an impact on telcos as the mounting pressure to lower telecom bills.
Table 1. Telecom-related bills (estimate)
The Minjoo Saenuri People's Party Justice Party
Plan/ Position
Submit revisions to MCTDSIA Submit revisions to MCTDSIA Recognize the need to revise MCTDSIA
Recognize the need to revise MCTDSIA
Details 1. Removal of subsidiary caps 1. Removal of subsidiary caps
* The People's Party and the Justice Party have yet to state their views on MCTDSIA revisions, except that they did not believe
the revision would effectively lower household mobile bills.
- Lower household mobile bills - Encourage price competition
2. Removal of base fees 2. Reduction in base fees
- Lower household mobile bills - Reduce household mobile bills
3. Separation of subsidies (carriers
and manufacturers) 3. Separation of subsidies
(carriers and manufacturers)
- Ensure transparent business
practices of carriers and their
retailers
- Ensure transparent business practices of carriers and their
retailers
4. Introduction of the blacklist system
- Prevent collusion between carriers
and manufacturers
- Promote fair competition
Source: Media reports, Mirae Asset Daewoo Research
Figure 9. Simple usage-based monthly plan with base fee of
W11,000
Figure 10. Data-centric monthly plan with no separate base
fee
Source: SKT, Mirae Asset Daewoo Research Source: SKT, Mirae Asset Daewoo Research
Telecom Service
7
June 3, 2016
Mirae Asset Daewoo Research
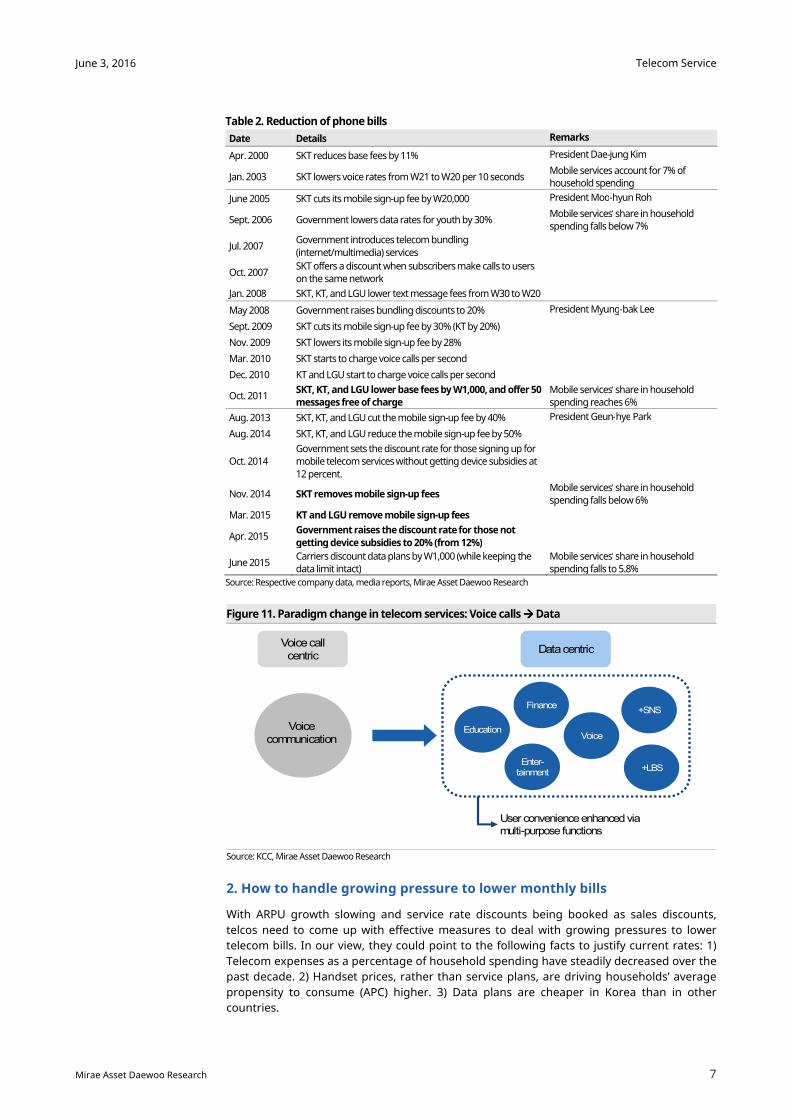
Table 2. Reduction of phone bills
Date Details Remarks
Apr. 2000 SKT reduces base fees by 11% President Dae-jung Kim
Jan. 2003 SKT lowers voice rates from W21 to W20 per 10 seconds Mobile services account for 7% of household spending
June 2005 SKT cuts its mobile sign-up fee by W20,000 President Moo-hyun Roh
Sept. 2006 Government lowers data rates for youth by 30% Mobile services’ share in household spending falls below 7%
Jul. 2007 Government introduces telecom bundling
(internet/multimedia) services
Oct. 2007 SKT offers a discount when subscribers make calls to users on the same network
Jan. 2008 SKT, KT, and LGU lower text message fees from W30 to W20
May 2008 Government raises bundling discounts to 20% President Myung-bak Lee
Sept. 2009 SKT cuts its mobile sign-up fee by 30% (KT by 20%)
Nov. 2009 SKT lowers its mobile sign-up fee by 28%
Mar. 2010 SKT starts to charge voice calls per second
Dec. 2010 KT and LGU start to charge voice calls per second
Oct. 2011 SKT, KT, and LGU lower base fees by W1,000, and offer 50 messages free of charge
Mobile services’ share in household spending reaches 6%
Aug. 2013 SKT, KT, and LGU cut the mobile sign-up fee by 40% President Geun-hye Park
Aug. 2014 SKT, KT, and LGU reduce the mobile sign-up fee by 50%
Oct. 2014 Government sets the discount rate for those signing up for mobile telecom services without getting device subsidies at
12 percent.
Nov. 2014 SKT removes mobile sign-up fees Mobile services’ share in household spending falls below 6%
Mar. 2015 KT and LGU remove mobile sign-up fees
Apr. 2015 Government raises the discount rate for those not
getting device subsidies to 20% (from 12%)
June 2015 Carriers discount data plans by W1,000 (while keeping the data limit intact)
Mobile services’ share in household spending falls to 5.8%
Source: Respective company data, media reports, Mirae Asset Daewoo Research
Figure 11. Paradigm change in telecom services: Voice calls ���� Data
Source: KCC, Mirae Asset Daewoo Research
2. How to handle growing pressure to lower monthly bills
With ARPU growth slowing and service rate discounts being booked as sales discounts,
telcos need to come up with effective measures to deal with growing pressures to lower
telecom bills. In our view, they could point to the following facts to justify current rates: 1)
Telecom expenses as a percentage of household spending have steadily decreased over the
past decade. 2) Handset prices, rather than service plans, are driving households’ average
propensity to consume (APC) higher. 3) Data plans are cheaper in Korea than in other
countries.
Voice callcentric
Data centric
Education
Finance+SNS
+LBS
Voice
Enter-tainment
User convenienceenhanced via multi-purpose functions
Voice communication
Telecom Service
8
June 3, 2016
Mirae Asset Daewoo Research
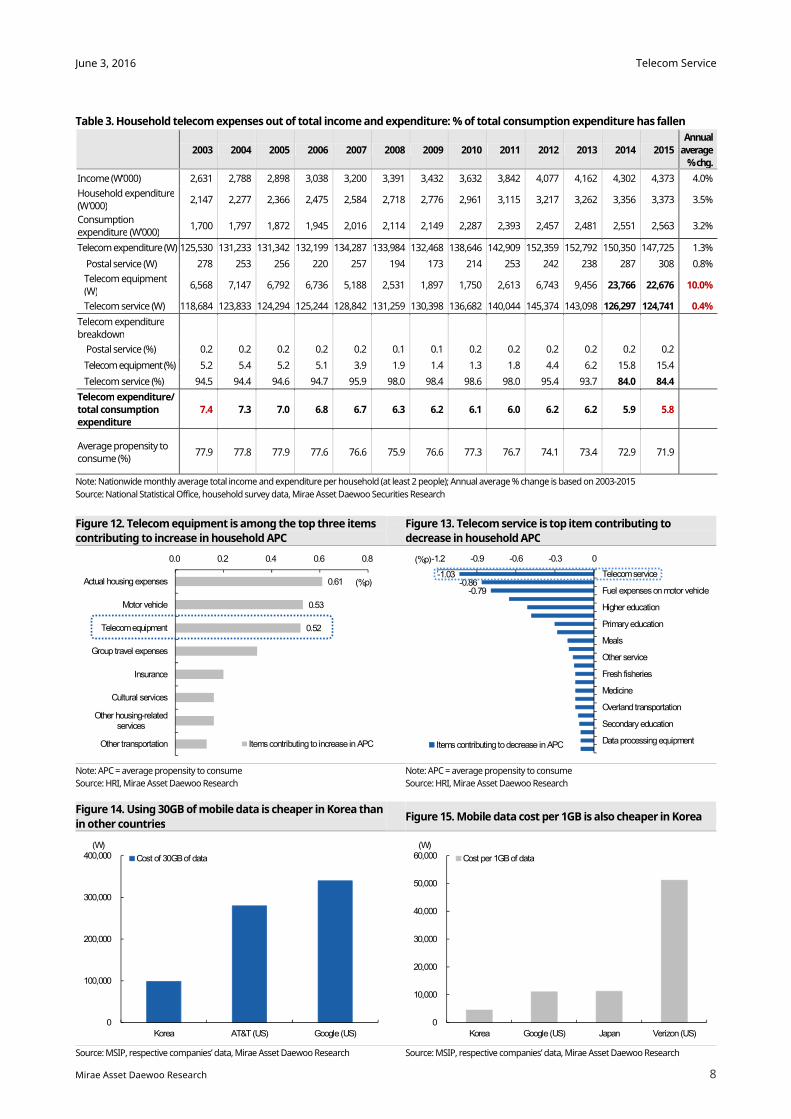
Table 3. Household telecom expenses out of total income and expenditure: % of total consumption expenditure has fallen
2003 2004 2005 2006 2007 2008 2009 2010 2011 2012 2013 2014 2015
Annual
average % chg.
Income (W’000) 2,631 2,788 2,898 3,038 3,200 3,391 3,432 3,632 3,842 4,077 4,162 4,302 4,373 4.0%
Household expenditure (W’000)
2,147 2,277 2,366 2,475 2,584 2,718 2,776 2,961 3,115 3,217 3,262 3,356 3,373 3.5%
Consumption expenditure (W’000)
1,700 1,797 1,872 1,945 2,016 2,114 2,149 2,287 2,393 2,457 2,481 2,551 2,563 3.2%
Telecom expenditure (W) 125,530 131,233 131,342 132,199 134,287 133,984 132,468 138,646 142,909 152,359 152,792 150,350 147,725 1.3%
Postal service (W) 278 253 256 220 257 194 173 214 253 242 238 287 308 0.8%
Telecom equipment (W)
6,568 7,147 6,792 6,736 5,188 2,531 1,897 1,750 2,613 6,743 9,456 23,766 22,676 10.0%
Telecom service (W) 118,684 123,833 124,294 125,244 128,842 131,259 130,398 136,682 140,044 145,374 143,098 126,297 124,741 0.4%
Telecom expenditure breakdown
Postal service (%) 0.2 0.2 0.2 0.2 0.2 0.1 0.1 0.2 0.2 0.2 0.2 0.2 0.2
Telecom equipment (%) 5.2 5.4 5.2 5.1 3.9 1.9 1.4 1.3 1.8 4.4 6.2 15.8 15.4
Telecom service (%) 94.5 94.4 94.6 94.7 95.9 98.0 98.4 98.6 98.0 95.4 93.7 84.0 84.4
Telecom expenditure/ total consumption expenditure
7.4 7.3 7.0 6.8 6.7 6.3 6.2 6.1 6.0 6.2 6.2 5.9 5.8
Average propensity to consume (%)
77.9 77.8 77.9 77.6 76.6 75.9 76.6 77.3 76.7 74.1 73.4 72.9 71.9
Note: Nationwide monthly average total income and expenditure per household (at least 2 people); Annual average % change is based on 2003-2015
Source: National Statistical Office, household survey data, Mirae Asset Daewoo Securities Research
Figure 12. Telecom equipment is among the top three items
contributing to increase in household APC
Figure 13. Telecom service is top item contributing to
decrease in household APC
Note: APC = average propensity to consume
Source: HRI, Mirae Asset Daewoo Research
Note: APC = average propensity to consume
Source: HRI, Mirae Asset Daewoo Research
Figure 14. Using 30GB of mobile data is cheaper in Korea than
in other countries Figure 15. Mobile data cost per 1GB is also cheaper in Korea
Source: MSIP, respective companies’ data, Mirae Asset Daewoo Research Source: MSIP, respective companies’ data, Mirae Asset Daewoo Research
0
100,000
200,000
300,000
400,000
Korea AT&T (US) Google (US)
(W)
Cost of 30GB of data
0
10,000
20,000
30,000
40,000
50,000
60,000
Korea Google (US) Japan Verizon (US)
(W)
Cost per 1GB of data
0.61
0.53
0.52
0.0 0.2 0.4 0.6 0.8
Actual housing expenses
Motor vehicle
Telecom equipment
Group travel expenses
Insurance
Cultural services
Other housing-relatedservices
Other transportation
(%p)
Items contributing to increase in APC
-1.03-0.86
-0.79
-1.2 -0.9 -0.6 -0.3 0
Telecom service
Fuel expenses on motor vehicle
Higher education
Primary education
Meals
Other service
Fresh fisheries
Medicine
Overland transportation
Secondary education
Data processing equipment
(%p)
Items contributing to decrease in APC
Telecom Service
9
June 3, 2016
Mirae Asset Daewoo Research
Opportunities in 2H16: Growth strategy
1. Wireless
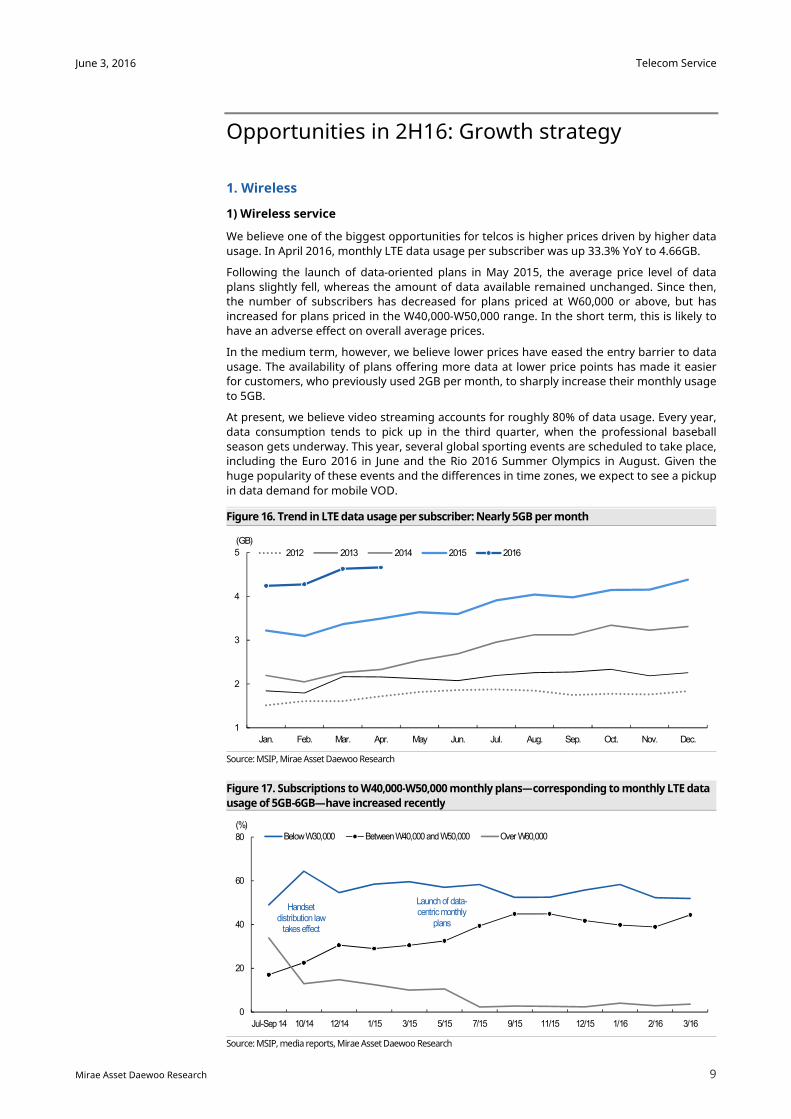
1) Wireless service
We believe one of the biggest opportunities for telcos is higher prices driven by higher data
usage. In April 2016, monthly LTE data usage per subscriber was up 33.3% YoY to 4.66GB.
Following the launch of data-oriented plans in May 2015, the average price level of data
plans slightly fell, whereas the amount of data available remained unchanged. Since then,
the number of subscribers has decreased for plans priced at W60,000 or above, but has
increased for plans priced in the W40,000-W50,000 range. In the short term, this is likely to
have an adverse effect on overall average prices.
In the medium term, however, we believe lower prices have eased the entry barrier to data
usage. The availability of plans offering more data at lower price points has made it easier
for customers, who previously used 2GB per month, to sharply increase their monthly usage
to 5GB.
At present, we believe video streaming accounts for roughly 80% of data usage. Every year,
data consumption tends to pick up in the third quarter, when the professional baseball
season gets underway. This year, several global sporting events are scheduled to take place,
including the Euro 2016 in June and the Rio 2016 Summer Olympics in August. Given the
huge popularity of these events and the differences in time zones, we expect to see a pickup
in data demand for mobile VOD.
Figure 16. Trend in LTE data usage per subscriber: Nearly 5GB per month
Source: MSIP, Mirae Asset Daewoo Research
Figure 17. Subscriptions to W40,000-W50,000 monthly plans—corresponding to monthly LTE data
usage of 5GB-6GB—have increased recently
Source: MSIP, media reports, Mirae Asset Daewoo Research
1
2
3
4
5
Jan. Feb. Mar. Apr. May Jun. Jul. Aug. Sep. Oct. Nov. Dec.
(GB)
2012 2013 2014 2015 2016
0
20
40
60
80
Jul-Sep 14 10/14 12/14 1/15 3/15 5/15 7/15 9/15 11/15 12/15 1/16 2/16 3/16
(%)Below W30,000 Between W40,000 and W50,000 Over W60,000
Handset distribution law
takes effect
Launchof data-centric monthly
plans
Telecom Service
10
June 3, 2016
Mirae Asset Daewoo Research
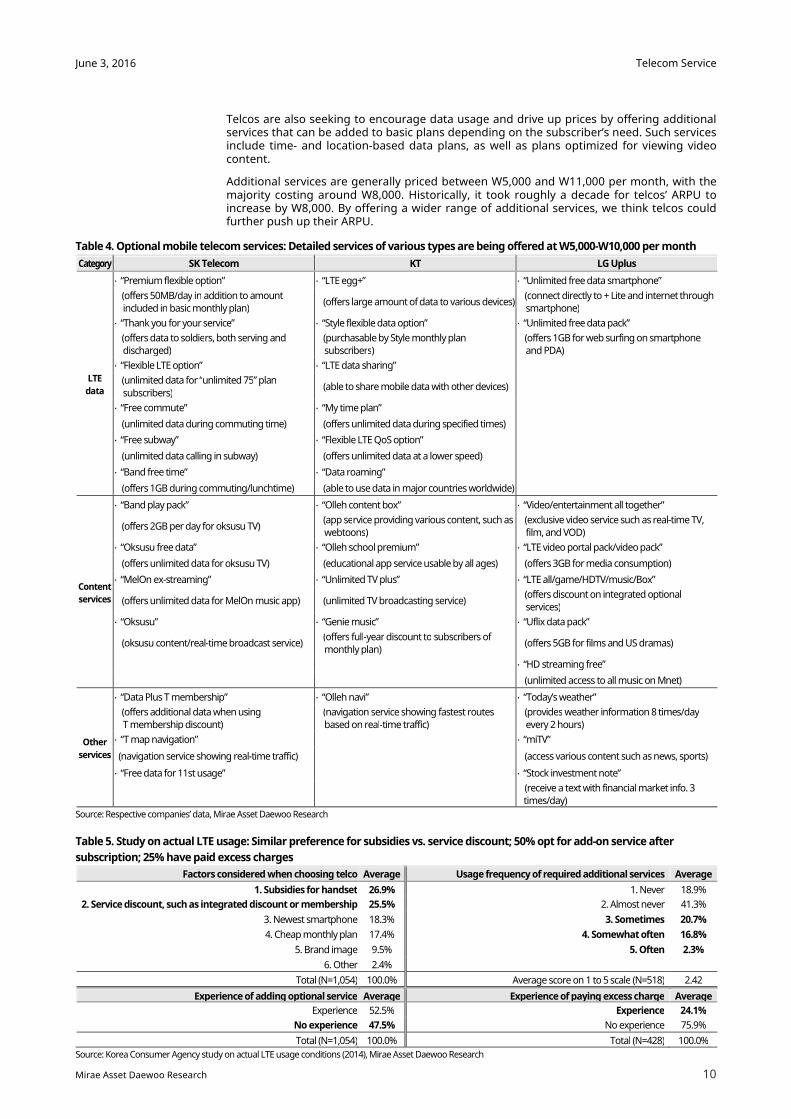
Telcos are also seeking to encourage data usage and drive up prices by offering additional services that can be added to basic plans depending on the subscriber’s need. Such services include time- and location-based data plans, as well as plans optimized for viewing video content.
Additional services are generally priced between W5,000 and W11,000 per month, with the majority costing around W8,000. Historically, it took roughly a decade for telcos’ ARPU to increase by W8,000. By offering a wider range of additional services, we think telcos could further push up their ARPU.
Table 4. Optional mobile telecom services: Detailed services of various types are being offered at W5,000-W10,000 per month
Category SK Telecom KT LG Uplus
LTE
data
∙ “Premium flexible option” ∙ “LTE egg+” ∙ “Unlimited free data smartphone”
(offers 50MB/day in addition to amount included in basic monthly plan)
(offers large amount of data to various devices) (connect directly to + Lite and internet through
smartphone)
∙ “Thank you for your service” ∙ “Style flexible data option” ∙ “Unlimited free data pack”
(offers data to soldiers, both serving and discharged)
(purchasable by Style monthly plan subscribers)
(offers 1GB for web surfing on smartphone and PDA)
∙ “Flexible LTE option” ∙ “LTE data sharing”
(unlimited data for “unlimited 75” plan
subscribers) (able to share mobile data with other devices)
∙ “Free commute” ∙ “My time plan”
(unlimited data during commuting time) (offers unlimited data during specified times)
∙ “Free subway” ∙ “Flexible LTE QoS option”
(unlimited data calling in subway) (offers unlimited data at a lower speed)
∙ “Band free time” ∙ “Data roaming”
(offers 1GB during commuting/lunchtime) (able to use data in major countries worldwide)
Content
services
∙ “Band play pack” ∙ “Olleh content box” ∙ “Video/entertainment all together”
(offers 2GB per day for oksusu TV) (app service providing various content, such as
webtoons) (exclusive video service such as real-time TV,
film, and VOD)
∙ “Oksusu free data” ∙ “Olleh school premium” ∙ “LTE video portal pack/video pack”
(offers unlimited data for oksusu TV) (educational app service usable by all ages) (offers 3GB for media consumption)
∙ “MelOn ex-streaming” ∙ “Unlimited TV plus” ∙ “LTE all/game/HDTV/music/Box”
(offers unlimited data for MelOn music app) (unlimited TV broadcasting service) (offers discount on integrated optional
services)
∙ “Oksusu” ∙ “Genie music” ∙ “Uflix data pack”
(oksusu content/real-time broadcast service) (offers full-year discount to subscribers of
monthly plan) (offers 5GB for films and US dramas)
∙ “HD streaming free”
(unlimited access to all music on Mnet)
Other
services
∙ “Data Plus T membership” ∙ “Olleh navi” ∙ “Today’s weather”
(offers additional data when using T membership discount)
(navigation service showing fastest routes based on real-time traffic)
(provides weather information 8 times/day every 2 hours)
∙ “T map navigation” ∙ “miTV”
(navigation service showing real-time traffic) (access various content such as news, sports)
∙ “Free data for 11st usage” ∙ “Stock investment note”
(receive a text with financial market info. 3 times/day)
Source: Respective companies’ data, Mirae Asset Daewoo Research
Table 5. Study on actual LTE usage: Similar preference for subsidies vs. service discount; 50% opt for add-on service after
subscription; 25% have paid excess charges
Factors considered when choosing telco Average Usage frequency of required additional services Average
1. Subsidies for handset 26.9% 1. Never 18.9%
2. Service discount, such as integrated discount or membership 25.5% 2. Almost never 41.3%
3. Newest smartphone 18.3% 3. Sometimes 20.7%
4. Cheap monthly plan 17.4% 4. Somewhat often 16.8%
5. Brand image 9.5% 5. Often 2.3%
6. Other 2.4%
Total (N=1,054) 100.0% Average score on 1 to 5 scale (N=518) 2.42
Experience of adding optional service Average Experience of paying excess charge Average
Experience 52.5% Experience 24.1%
No experience 47.5% No experience 75.9%
Total (N=1,054) 100.0% Total (N=428) 100.0%
Source: Korea Consumer Agency study on actual LTE usage conditions (2014), Mirae Asset Daewoo Research
Telecom Service
11
June 3, 2016
Mirae Asset Daewoo Research
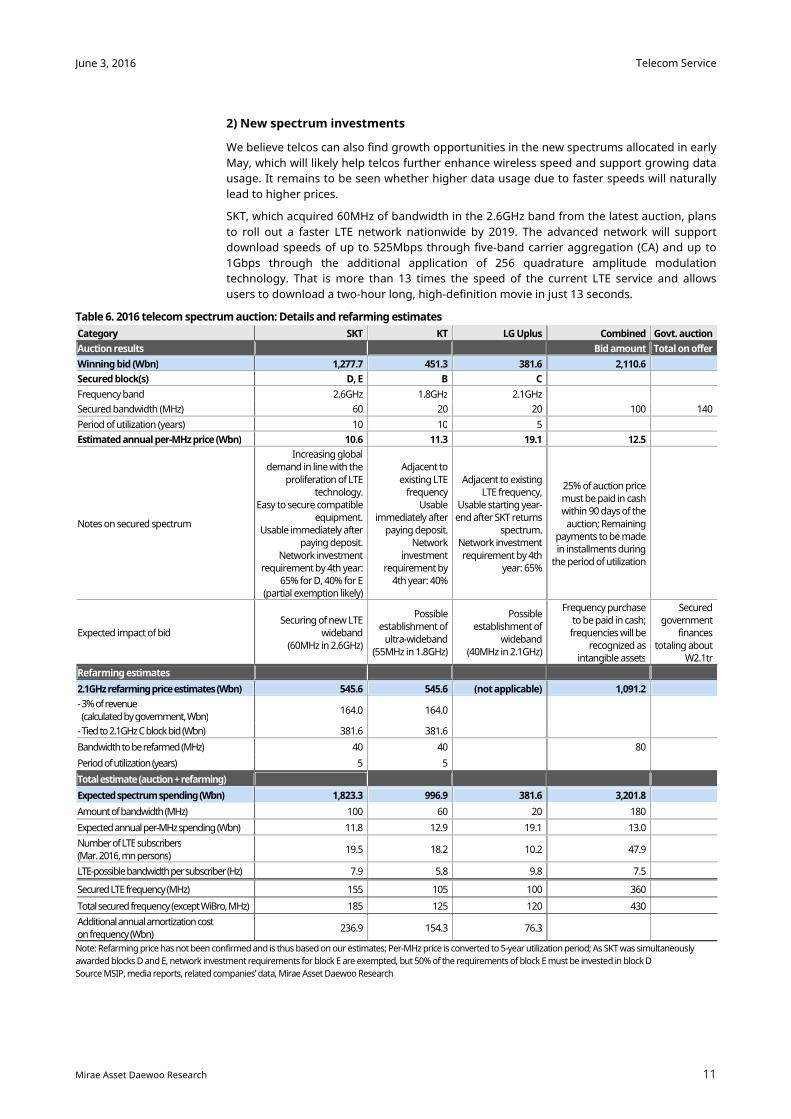
2) New spectrum investments
We believe telcos can also find growth opportunities in the new spectrums allocated in early
May, which will likely help telcos further enhance wireless speed and support growing data
usage. It remains to be seen whether higher data usage due to faster speeds will naturally
lead to higher prices.
SKT, which acquired 60MHz of bandwidth in the 2.6GHz band from the latest auction, plans
to roll out a faster LTE network nationwide by 2019. The advanced network will support
download speeds of up to 525Mbps through five-band carrier aggregation (CA) and up to
1Gbps through the additional application of 256 quadrature amplitude modulation
technology. That is more than 13 times the speed of the current LTE service and allows
users to download a two-hour long, high-definition movie in just 13 seconds.
Table 6. 2016 telecom spectrum auction: Details and refarming estimates
Category SKT KT LG Uplus Combined Govt. auction
Auction results Bid amount Total on offer
Winning bid (Wbn) 1,277.7 451.3 381.6 2,110.6 Secured block(s) D, E B C
Frequency band 2.6GHz 1.8GHz 2.1GHz
Secured bandwidth (MHz) 60 20 20 100 140
Period of utilization (years) 10 10 5
Estimated annual per-MHz price (Wbn) 10.6 11.3 19.1 12.5
Notes on secured spectrum
Increasing global demand in line with the
proliferation of LTE technology.
Easy to secure compatible equipment.
Usable immediately after paying deposit.
Network investment requirement by 4th year:
65% for D, 40% for E (partial exemption likely)
Adjacent to
existing LTE frequency
Usable immediately after
paying deposit. Network
investment requirement by
4th year: 40%
Adjacent to existing LTE frequency,
Usable starting year-end after SKT returns
spectrum. Network investment
requirement by 4th year: 65%
25% of auction price must be paid in cash within 90 days of the
auction; Remaining payments to be made in installments during
the period of utilization
Expected impact of bid Securing of new LTE
wideband (60MHz in 2.6GHz)
Possible establishment of
ultra-wideband (55MHz in 1.8GHz)
Possible establishment of
wideband (40MHz in 2.1GHz)
Frequency purchase to be paid in cash; frequencies will be
recognized as intangible assets
Secured government
finances totaling about
W2.1tr
Refarming estimates
2.1GHz refarming price estimates (Wbn) 545.6 545.6 (not applicable) 1,091.2 - 3% of revenue
(calculated by government, Wbn) 164.0 164.0
- Tied to 2.1GHz C block bid (Wbn) 381.6 381.6
Bandwidth to be refarmed (MHz) 40 40 80
Period of utilization (years) 5 5
Total estimate (auction + refarming)
Expected spectrum spending (Wbn) 1,823.3 996.9 381.6 3,201.8
Amount of bandwidth (MHz) 100 60 20 180
Expected annual per-MHz spending (Wbn) 11.8 12.9 19.1 13.0
Number of LTE subscribers (Mar. 2016, mn persons)
19.5 18.2 10.2 47.9
LTE-possible bandwidth per subscriber (Hz) 7.9 5.8 9.8 7.5
Secured LTE frequency (MHz) 155 105 100 360
Total secured frequency (except WiBro, MHz) 185 125 120 430
Additional annual amortization cost on frequency (Wbn)
236.9 154.3 76.3
Note: Refarming price has not been confirmed and is thus based on our estimates; Per-MHz price is converted to 5-year utilization period; As SKT was simultaneously
awarded blocks D and E, network investment requirements for block E are exempted, but 50% of the requirements of block E must be invested in block D
Source MSIP, media reports, related companies’ data, Mirae Asset Daewoo Research
Telecom Service
12
June 3, 2016
Mirae Asset Daewoo Research
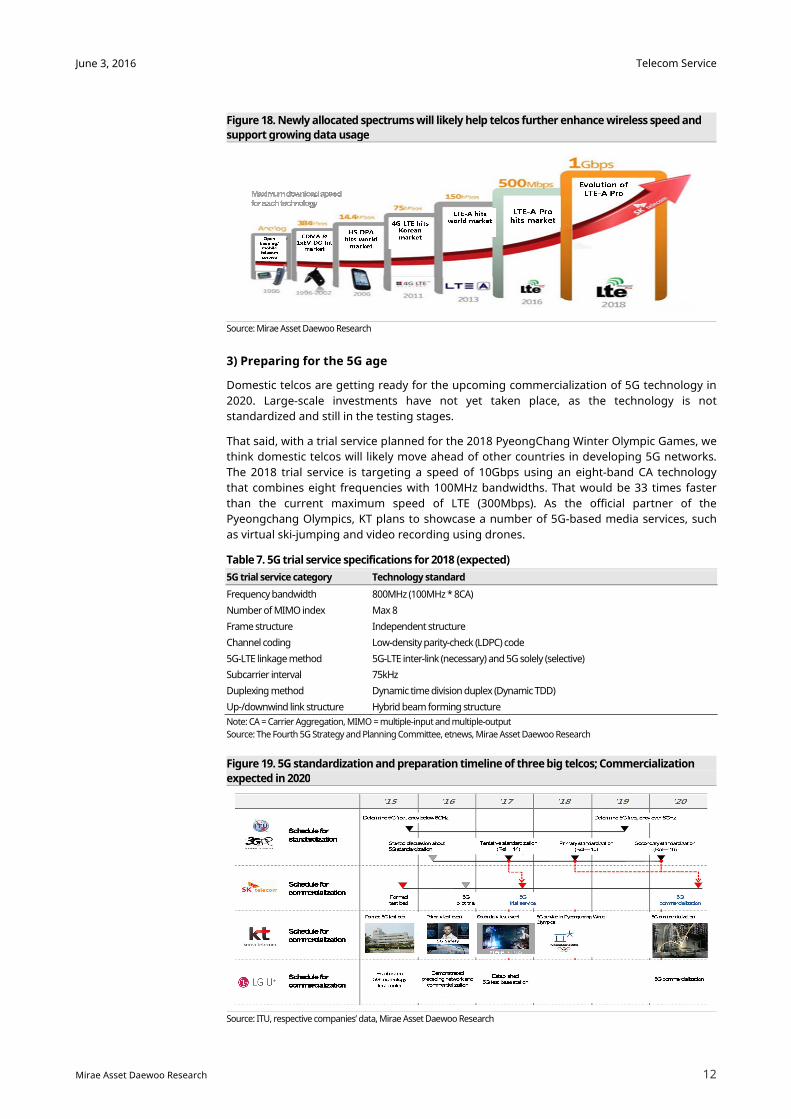
Figure 18. Newly allocated spectrums will likely help telcos further enhance wireless speed and
support growing data usage
Source: Mirae Asset Daewoo Research
3) Preparing for the 5G age
Domestic telcos are getting ready for the upcoming commercialization of 5G technology in
2020. Large-scale investments have not yet taken place, as the technology is not
standardized and still in the testing stages.
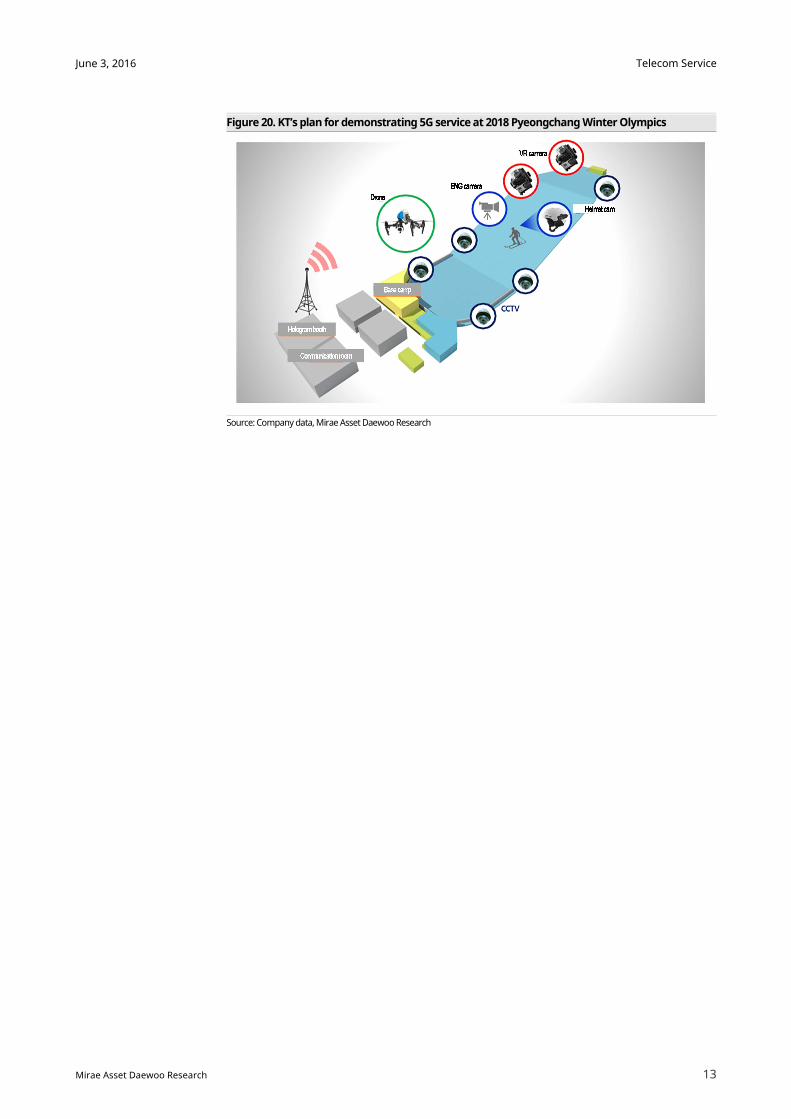
That said, with a trial service planned for the 2018 PyeongChang Winter Olympic Games, we
think domestic telcos will likely move ahead of other countries in developing 5G networks.
The 2018 trial service is targeting a speed of 10Gbps using an eight-band CA technology
that combines eight frequencies with 100MHz bandwidths. That would be 33 times faster
than the current maximum speed of LTE (300Mbps). As the official partner of the
Pyeongchang Olympics, KT plans to showcase a number of 5G-based media services, such
as virtual ski-jumping and video recording using drones.
Table 7. 5G trial service specifications for 2018 (expected)
5G trial service category Technology standard
Frequency bandwidth 800MHz (100MHz * 8CA)
Number of MIMO index Max 8
Frame structure Independent structure
Channel coding Low-density parity-check (LDPC) code
5G-LTE linkage method 5G-LTE inter-link (necessary) and 5G solely (selective)
Subcarrier interval 75kHz
Duplexing method Dynamic time division duplex (Dynamic TDD)
Up-/downwind link structure Hybrid beam forming structure
Note: CA = Carrier Aggregation, MIMO = multiple-input and multiple-output
Source: The Fourth 5G Strategy and Planning Committee, etnews, Mirae Asset Daewoo Research
Figure 19. 5G standardization and preparation timeline of three big telcos; Commercialization
expected in 2020
Source: ITU, respective companies’ data, Mirae Asset Daewoo Research
Telecom Service
13
June 3, 2016
Mirae Asset Daewoo Research
Figure 20. KT’s plan for demonstrating 5G service at 2018 Pyeongchang Winter Olympics
Source: Company data, Mirae Asset Daewoo Research
Telecom Service
14
June 3, 2016
Mirae Asset Daewoo Research
2. Media
1) Pay-TV to reach an inflection point
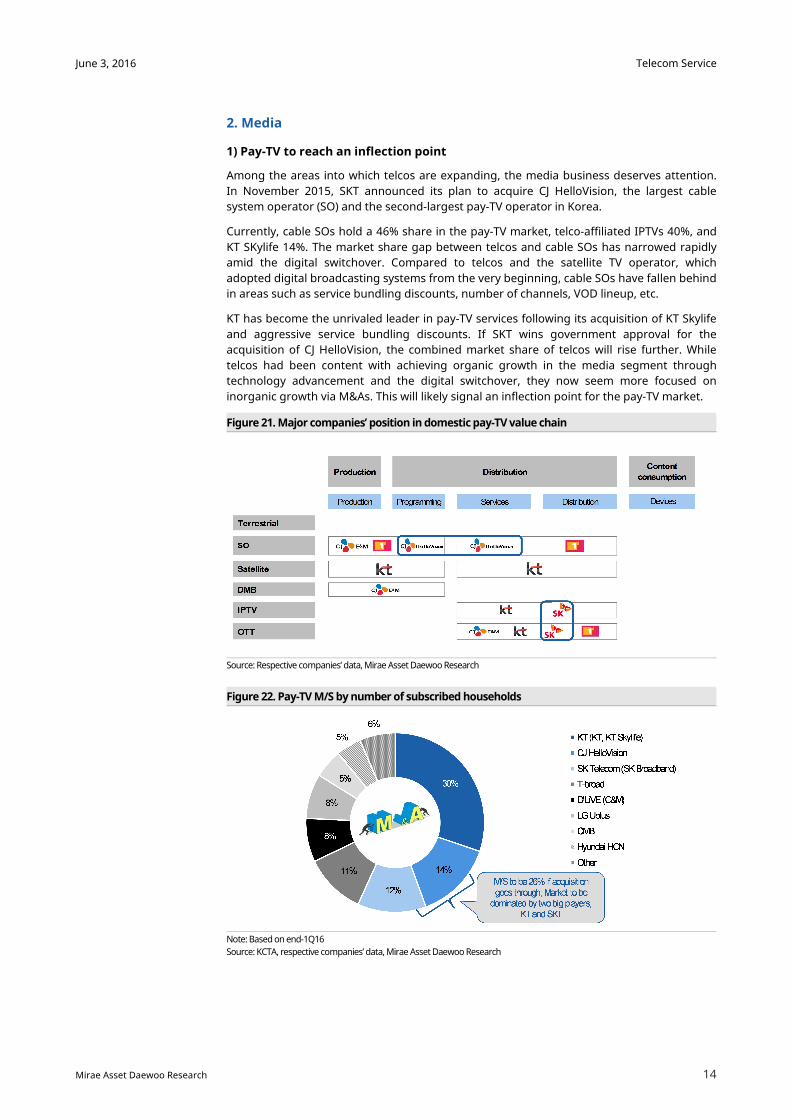
Among the areas into which telcos are expanding, the media business deserves attention.
In November 2015, SKT announced its plan to acquire CJ HelloVision, the largest cable
system operator (SO) and the second-largest pay-TV operator in Korea.
Currently, cable SOs hold a 46% share in the pay-TV market, telco-affiliated IPTVs 40%, and
KT SKylife 14%. The market share gap between telcos and cable SOs has narrowed rapidly
amid the digital switchover. Compared to telcos and the satellite TV operator, which
adopted digital broadcasting systems from the very beginning, cable SOs have fallen behind
in areas such as service bundling discounts, number of channels, VOD lineup, etc.
KT has become the unrivaled leader in pay-TV services following its acquisition of KT Skylife
and aggressive service bundling discounts. If SKT wins government approval for the
acquisition of CJ HelloVision, the combined market share of telcos will rise further. While
telcos had been content with achieving organic growth in the media segment through
technology advancement and the digital switchover, they now seem more focused on
inorganic growth via M&As. This will likely signal an inflection point for the pay-TV market.
Figure 21. Major companies’ position in domestic pay-TV value chain
Source: Respective companies’ data, Mirae Asset Daewoo Research
Figure 22. Pay-TV M/S by number of subscribed households
Note: Based on end-1Q16
Source: KCTA, respective companies’ data, Mirae Asset Daewoo Research
Telecom Service
15
June 3, 2016
Mirae Asset Daewoo Research
2) Pay-TV market status and outlook
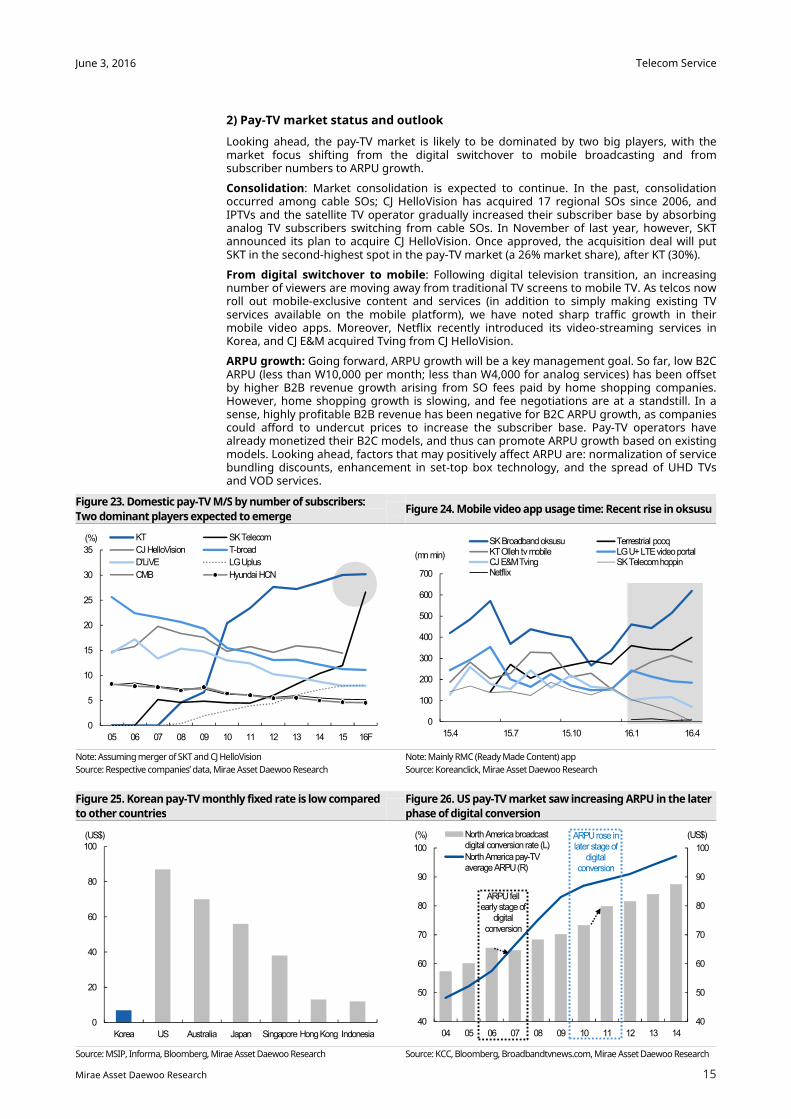
Looking ahead, the pay-TV market is likely to be dominated by two big players, with the market focus shifting from the digital switchover to mobile broadcasting and from subscriber numbers to ARPU growth.
Consolidation: Market consolidation is expected to continue. In the past, consolidation occurred among cable SOs; CJ HelloVision has acquired 17 regional SOs since 2006, and IPTVs and the satellite TV operator gradually increased their subscriber base by absorbing analog TV subscribers switching from cable SOs. In November of last year, however, SKT announced its plan to acquire CJ HelloVision. Once approved, the acquisition deal will put SKT in the second-highest spot in the pay-TV market (a 26% market share), after KT (30%).
From digital switchover to mobile: Following digital television transition, an increasing number of viewers are moving away from traditional TV screens to mobile TV. As telcos now roll out mobile-exclusive content and services (in addition to simply making existing TV services available on the mobile platform), we have noted sharp traffic growth in their mobile video apps. Moreover, Netflix recently introduced its video-streaming services in Korea, and CJ E&M acquired Tving from CJ HelloVision.
ARPU growth: Going forward, ARPU growth will be a key management goal. So far, low B2C ARPU (less than W10,000 per month; less than W4,000 for analog services) has been offset by higher B2B revenue growth arising from SO fees paid by home shopping companies. However, home shopping growth is slowing, and fee negotiations are at a standstill. In a sense, highly profitable B2B revenue has been negative for B2C ARPU growth, as companies could afford to undercut prices to increase the subscriber base. Pay-TV operators have already monetized their B2C models, and thus can promote ARPU growth based on existing models. Looking ahead, factors that may positively affect ARPU are: normalization of service bundling discounts, enhancement in set-top box technology, and the spread of UHD TVs and VOD services.
Figure 23. Domestic pay-TV M/S by number of subscribers:
Two dominant players expected to emerge Figure 24. Mobile video app usage time: Recent rise in oksusu
Note: Assuming merger of SKT and CJ HelloVision
Source: Respective companies’ data, Mirae Asset Daewoo Research
Note: Mainly RMC (Ready Made Content) app
Source: Koreanclick, Mirae Asset Daewoo Research
Figure 25. Korean pay-TV monthly fixed rate is low compared
to other countries
Figure 26. US pay-TV market saw increasing ARPU in the later
phase of digital conversion
Source: MSIP, Informa, Bloomberg, Mirae Asset Daewoo Research Source: KCC, Bloomberg, Broadbandtvnews.com, Mirae Asset Daewoo Research
40
50
60
70
80
90
100
40
50
60
70
80
90
100
04 05 06 07 08 09 10 11 12 13 14
(US$)(%) North America broadcastdigital conversion rate (L)
North America pay-TVaverage ARPU (R)
ARPU fell early stage of
digital conversion
ARPU rose in later stage of
digital conversion
0
5
10
15
20
25
30
35
05 06 07 08 09 10 11 12 13 14 15 16F
(%) KT SK Telecom
CJ HelloVision T-broad
D'LiVE LG Uplus
CMB Hyundai HCN
0
20
40
60
80
100
Korea US Australia Japan Singapore Hong Kong Indonesia
(US$)
0
100
200
300
400
500
600
700
15.4 15.7 15.10 16.1 16.4
(mn min)
SK Broadband oksusu Terrestrial pooqKT Olleh tv mobile LG U+ LTE video portalCJ E&M Tving SK Telecom hoppinNetflix
Telecom Service
16
June 3, 2016
Mirae Asset Daewoo Research
3) Changing competitive landscape in the pay-TV market
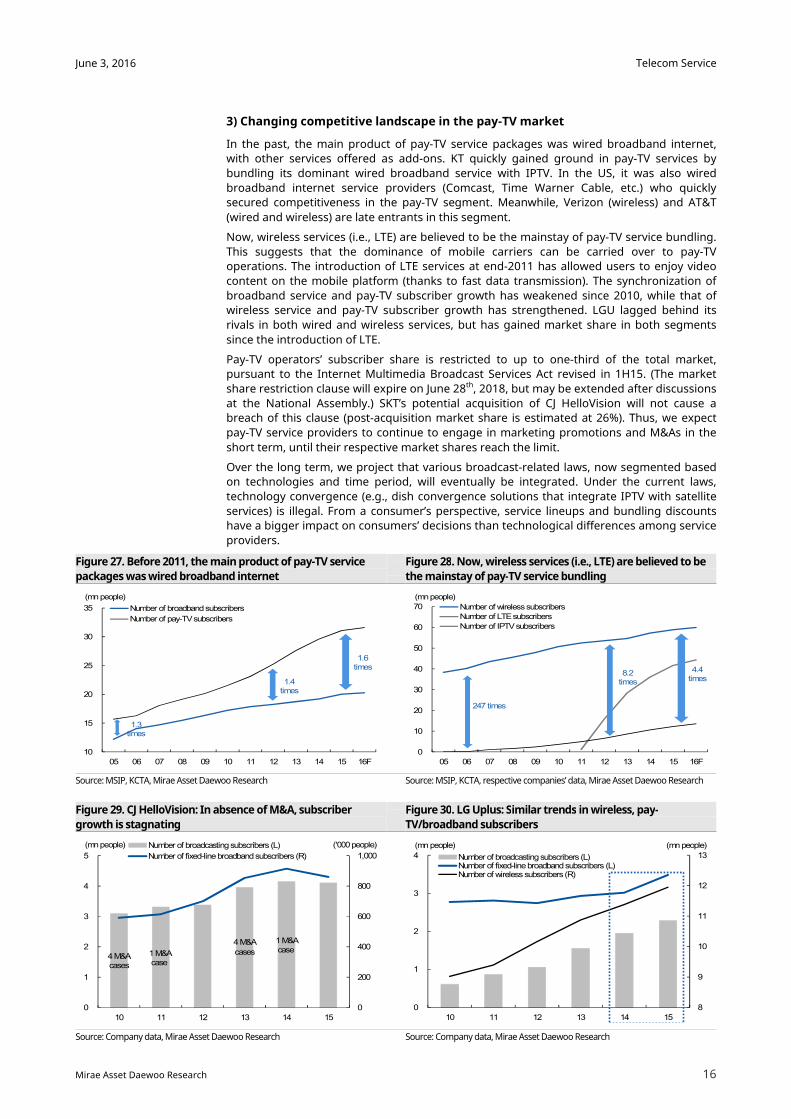
In the past, the main product of pay-TV service packages was wired broadband internet,
with other services offered as add-ons. KT quickly gained ground in pay-TV services by
bundling its dominant wired broadband service with IPTV. In the US, it was also wired
broadband internet service providers (Comcast, Time Warner Cable, etc.) who quickly
secured competitiveness in the pay-TV segment. Meanwhile, Verizon (wireless) and AT&T
(wired and wireless) are late entrants in this segment.
Now, wireless services (i.e., LTE) are believed to be the mainstay of pay-TV service bundling.
This suggests that the dominance of mobile carriers can be carried over to pay-TV
operations. The introduction of LTE services at end-2011 has allowed users to enjoy video
content on the mobile platform (thanks to fast data transmission). The synchronization of
broadband service and pay-TV subscriber growth has weakened since 2010, while that of
wireless service and pay-TV subscriber growth has strengthened. LGU lagged behind its
rivals in both wired and wireless services, but has gained market share in both segments
since the introduction of LTE.
Pay-TV operators’ subscriber share is restricted to up to one-third of the total market,
pursuant to the Internet Multimedia Broadcast Services Act revised in 1H15. (The market
share restriction clause will expire on June 28th, 2018, but may be extended after discussions
at the National Assembly.) SKT’s potential acquisition of CJ HelloVision will not cause a
breach of this clause (post-acquisition market share is estimated at 26%). Thus, we expect
pay-TV service providers to continue to engage in marketing promotions and M&As in the
short term, until their respective market shares reach the limit.
Over the long term, we project that various broadcast-related laws, now segmented based
on technologies and time period, will eventually be integrated. Under the current laws,
technology convergence (e.g., dish convergence solutions that integrate IPTV with satellite
services) is illegal. From a consumer’s perspective, service lineups and bundling discounts
have a bigger impact on consumers’ decisions than technological differences among service
providers.
Figure 27. Before 2011, the main product of pay-TV service
packages was wired broadband internet
Figure 28. Now, wireless services (i.e., LTE) are believed to be
the mainstay of pay-TV service bundling
Source: MSIP, KCTA, Mirae Asset Daewoo Research Source: MSIP, KCTA, respective companies’ data, Mirae Asset Daewoo Research
Figure 29. CJ HelloVision: In absence of M&A, subscriber
growth is stagnating
Figure 30. LG Uplus: Similar trends in wireless, pay-
TV/broadband subscribers
Source: Company data, Mirae Asset Daewoo Research Source: Company data, Mirae Asset Daewoo Research
1.3times
1.6times
1.4times
10
15
20
25
30
35
05 06 07 08 09 10 11 12 13 14 15 16F
(mn people)
Number of broadband subscribers
Number of pay-TV subscribers
247 times
8.2times
4.4 times
0
10
20
30
40
50
60
70
05 06 07 08 09 10 11 12 13 14 15 16F
(mn people)
Number of wireless subscribersNumber of LTE subscribers
Number of IPTV subscribers
4 M&A cases
1 M&Acase
4 M&A cases
1 M&Acase
0
200
400
600
800
1,000
0
1
2
3
4
5
10 11 12 13 14 15
('000 people)(mn people) Number of broadcasting subscribers (L)
Number of fixed-line broadband subscribers (R)
8
9
10
11
12
13
0
1
2
3
4
10 11 12 13 14 15
(mn people)(mn people)
Number of broadcasting subscribers (L)Number of fixed-line broadband subscribers (L)Number of wireless subscribers (R)
Telecom Service
17
June 3, 2016
Mirae Asset Daewoo Research
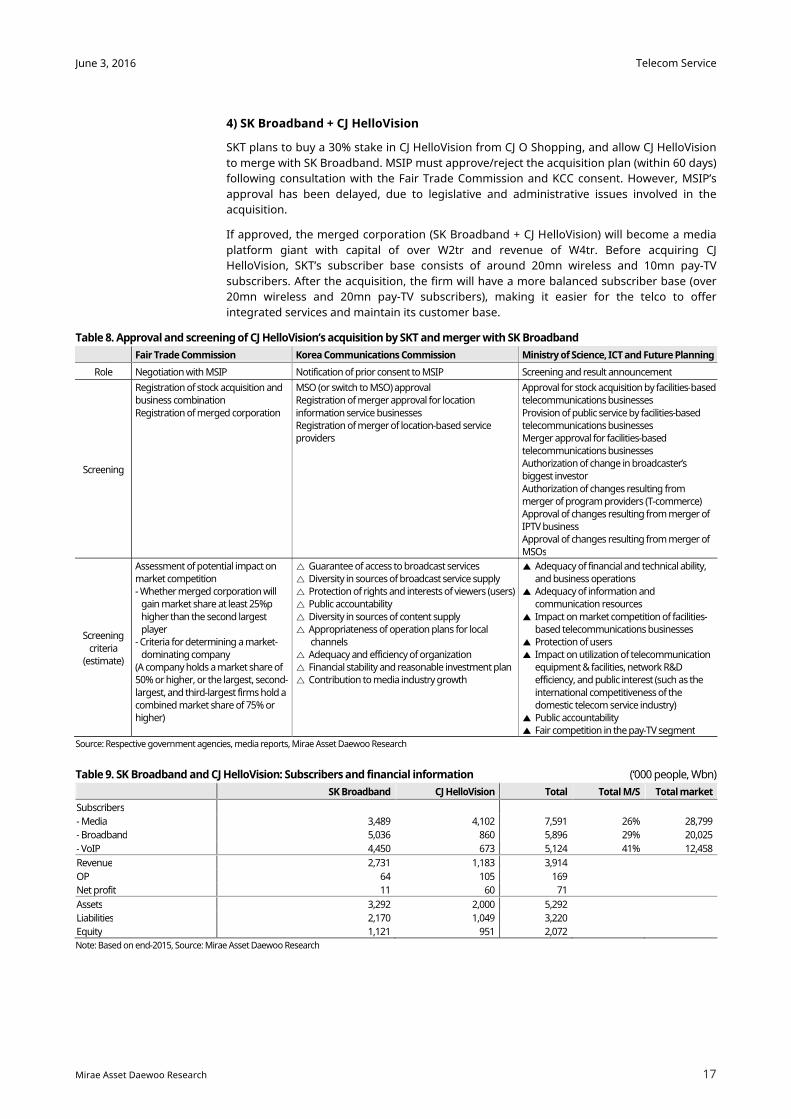
4) SK Broadband + CJ HelloVision
SKT plans to buy a 30% stake in CJ HelloVision from CJ O Shopping, and allow CJ HelloVision
to merge with SK Broadband. MSIP must approve/reject the acquisition plan (within 60 days)
following consultation with the Fair Trade Commission and KCC consent. However, MSIP’s
approval has been delayed, due to legislative and administrative issues involved in the
acquisition.
If approved, the merged corporation (SK Broadband + CJ HelloVision) will become a media
platform giant with capital of over W2tr and revenue of W4tr. Before acquiring CJ
HelloVision, SKT’s subscriber base consists of around 20mn wireless and 10mn pay-TV
subscribers. After the acquisition, the firm will have a more balanced subscriber base (over
20mn wireless and 20mn pay-TV subscribers), making it easier for the telco to offer
integrated services and maintain its customer base.
Table 8. Approval and screening of CJ HelloVision’s acquisition by SKT and merger with SK Broadband
Fair Trade Commission Korea Communications Commission Ministry of Science, ICT and Future Planning
Role Negotiation with MSIP Notification of prior consent to MSIP Screening and result announcement
Screening
Registration of stock acquisition and business combination
Registration of merged corporation
MSO (or switch to MSO) approval Registration of merger approval for location
information service businesses Registration of merger of location-based service providers
Approval for stock acquisition by facilities-based telecommunications businesses
Provision of public service by facilities-based telecommunications businesses Merger approval for facilities-based telecommunications businesses Authorization of change in broadcaster’s biggest investor
Authorization of changes resulting from merger of program providers (T-commerce) Approval of changes resulting from merger of IPTV business Approval of changes resulting from merger of MSOs
Screening
criteria (estimate)
Assessment of potential impact on market competition - Whether merged corporation will
gain market share at least 25%p
higher than the second largest player
- Criteria for determining a market-dominating company
(A company holds a market share of 50% or higher, or the largest, second-
largest, and third-largest firms hold a combined market share of 75% or higher)
△ Guarantee of access to broadcast services △ Diversity in sources of broadcast service supply △ Protection of rights and interests of viewers (users) △ Public accountability
△ Diversity in sources of content supply △ Appropriateness of operation plans for local
channels △ Adequacy and efficiency of organization △ Financial stability and reasonable investment plan △ Contribution to media industry growth
▲ Adequacy of financial and technical ability, and business operations
▲ Adequacy of information and communication resources
▲ Impact on market competition of facilities-based telecommunications businesses
▲ Protection of users ▲ Impact on utilization of telecommunication
equipment & facilities, network R&D efficiency, and public interest (such as the
international competitiveness of the domestic telecom service industry)
▲ Public accountability ▲ Fair competition in the pay-TV segment
Source: Respective government agencies, media reports, Mirae Asset Daewoo Research
Table 9. SK Broadband and CJ HelloVision: Subscribers and financial information (‘000 people, Wbn)
SK Broadband CJ HelloVision Total Total M/S Total market
Subscribers
- Media 3,489 4,102 7,591 26% 28,799
- Broadband 5,036 860 5,896 29% 20,025
- VoIP 4,450 673 5,124 41% 12,458
Revenue 2,731 1,183 3,914
OP 64 105 169
Net profit 11 60 71
Assets 3,292 2,000 5,292
Liabilities 2,170 1,049 3,220
Equity 1,121 951 2,072
Note: Based on end-2015, Source: Mirae Asset Daewoo Research
Telecom Service
18
June 3, 2016
Mirae Asset Daewoo Research
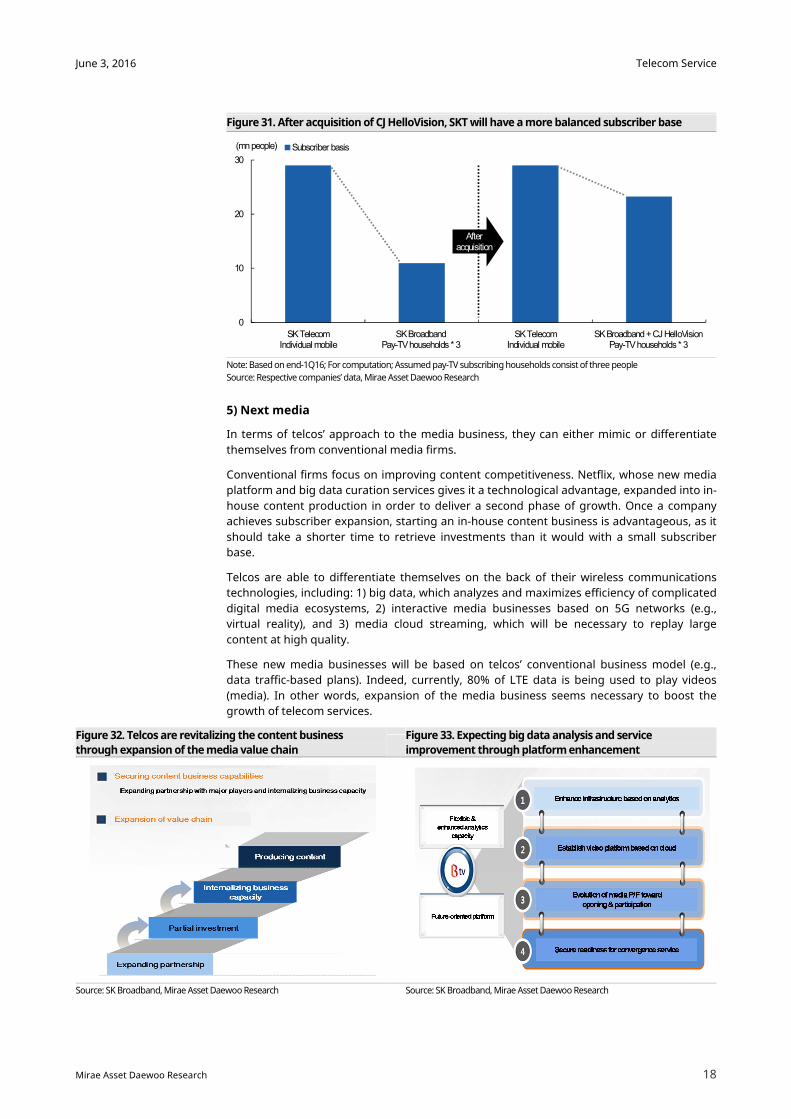
Figure 31. After acquisition of CJ HelloVision, SKT will have a more balanced subscriber base
Note: Based on end-1Q16; For computation; Assumed pay-TV subscribing households consist of three people
Source: Respective companies’ data, Mirae Asset Daewoo Research
5) Next media
In terms of telcos’ approach to the media business, they can either mimic or differentiate
themselves from conventional media firms.
Conventional firms focus on improving content competitiveness. Netflix, whose new media
platform and big data curation services gives it a technological advantage, expanded into in-
house content production in order to deliver a second phase of growth. Once a company
achieves subscriber expansion, starting an in-house content business is advantageous, as it
should take a shorter time to retrieve investments than it would with a small subscriber
base.
Telcos are able to differentiate themselves on the back of their wireless communications
technologies, including: 1) big data, which analyzes and maximizes efficiency of complicated
digital media ecosystems, 2) interactive media businesses based on 5G networks (e.g.,
virtual reality), and 3) media cloud streaming, which will be necessary to replay large
content at high quality.
These new media businesses will be based on telcos’ conventional business model (e.g.,
data traffic-based plans). Indeed, currently, 80% of LTE data is being used to play videos
(media). In other words, expansion of the media business seems necessary to boost the
growth of telecom services.
Figure 32. Telcos are revitalizing the content business
through expansion of the media value chain
Figure 33. Expecting big data analysis and service
improvement through platform enhancement
Source: SK Broadband, Mirae Asset Daewoo Research Source: SK Broadband, Mirae Asset Daewoo Research
0
10
20
30
SK TelecomIndividual mobile
SK BroadbandPay-TV households * 3
SK TelecomIndividual mobile
SK Broadband + CJ HelloVisionPay-TV households * 3
(mn people) Subscriber basis
Afteracquisition
Telecom Service
19
June 3, 2016
Mirae Asset Daewoo Research
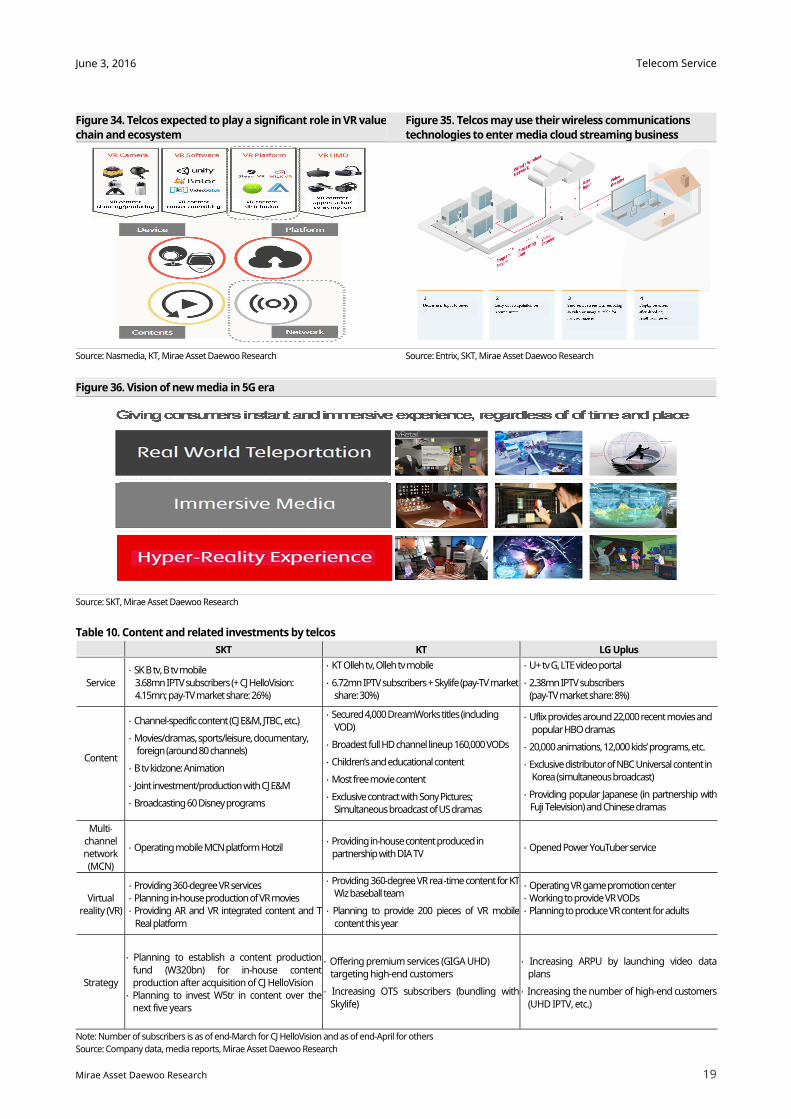
Figure 34. Telcos expected to play a significant role in VR value
chain and ecosystem
Figure 35. Telcos may use their wireless communications
technologies to enter media cloud streaming business
Source: Nasmedia, KT, Mirae Asset Daewoo Research Source: Entrix, SKT, Mirae Asset Daewoo Research
Figure 36. Vision of new media in 5G era
Source: SKT, Mirae Asset Daewoo Research
Table 10. Content and related investments by telcos
SKT KT LG Uplus
Service
∙ SK B tv, B tv mobile
3.68mn IPTV subscribers (+ CJ HelloVision: 4.15mn; pay-TV market share: 26%)
∙ KT Olleh tv, Olleh tv mobile
∙ 6.72mn IPTV subscribers + Skylife (pay-TV market share: 30%)
∙ U+ tv G, LTE video portal
∙ 2.38mn IPTV subscribers (pay-TV market share: 8%)
Content
∙ Channel-specific content (CJ E&M, JTBC, etc.)
∙ Movies/dramas, sports/leisure, documentary, foreign (around 80 channels)
∙ B tv kidzone: Animation
∙ Joint investment/production with CJ E&M
∙ Broadcasting 60 Disney programs
∙ Secured 4,000 DreamWorks titles (including
VOD)
∙ Broadest full HD channel lineup 160,000 VODs
∙ Children’s and educational content
∙ Most free movie content
∙ Exclusive contract with Sony Pictures; Simultaneous broadcast of US dramas
∙ Uflix provides around 22,000 recent movies and
popular HBO dramas
∙ 20,000 animations, 12,000 kids’ programs, etc.
∙ Exclusive distributor of NBC Universal content in Korea (simultaneous broadcast)
∙ Providing popular Japanese (in partnership with Fuji Television) and Chinese dramas
Multi-channel network (MCN)
∙ Operating mobile MCN platform Hotzil ∙ Providing in-house content produced in partnership with DIA TV
∙ Opened Power YouTuber service
Virtual reality (VR)
∙ Providing 360-degree VR services ∙ Planning in-house production of VR movies ∙ Providing AR and VR integrated content and T
Real platform
∙ Providing 360-degree VR real-time content for KT Wiz baseball team
∙ Planning to provide 200 pieces of VR mobile
content this year
∙ Operating VR game promotion center ∙ Working to provide VR VODs ∙ Planning to produce VR content for adults
Strategy
∙ Planning to establish a content production
fund (W320bn) for in-house content production after acquisition of CJ HelloVision
∙ Planning to invest W5tr in content over the next five years
∙ Offering premium services (GIGA UHD) targeting high-end customers
∙ Increasing OTS subscribers (bundling with
Skylife)
∙ Increasing ARPU by launching video data plans
∙ Increasing the number of high-end customers
(UHD IPTV, etc.)
Note: Number of subscribers is as of end-March for CJ HelloVision and as of end-April for others
Source: Company data, media reports, Mirae Asset Daewoo Research
Telecom Service
20
June 3, 2016
Mirae Asset Daewoo Research
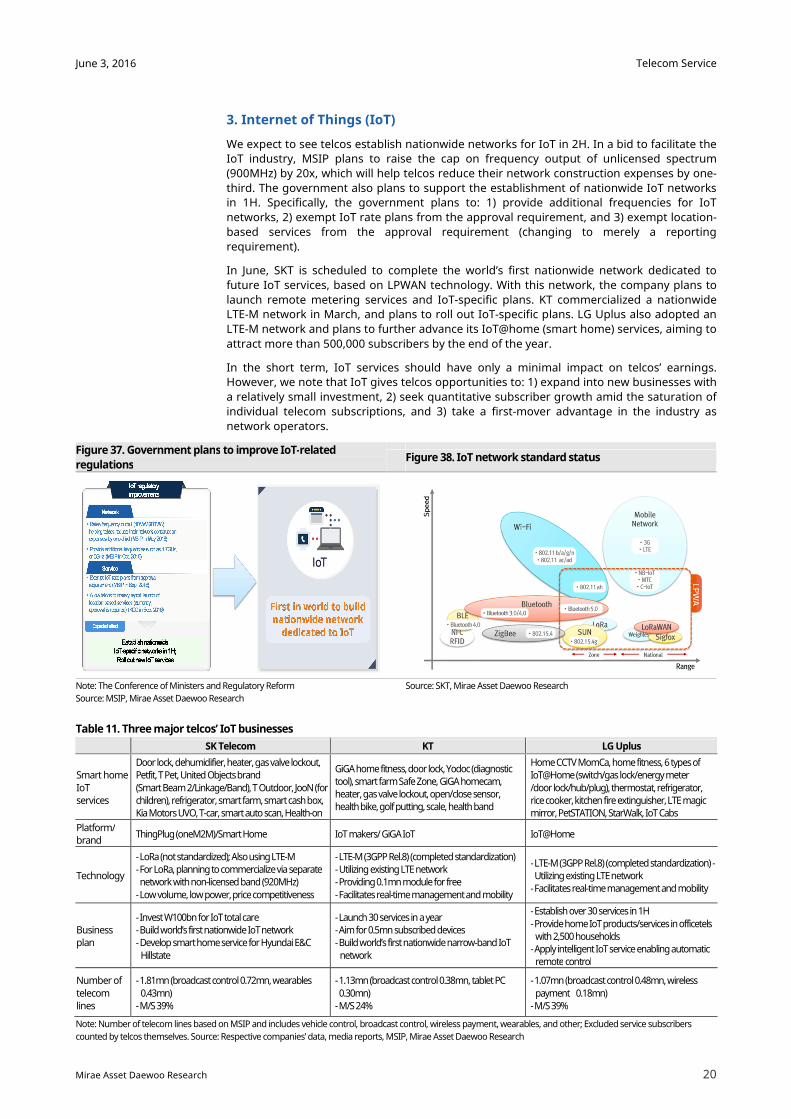
3. Internet of Things (IoT)
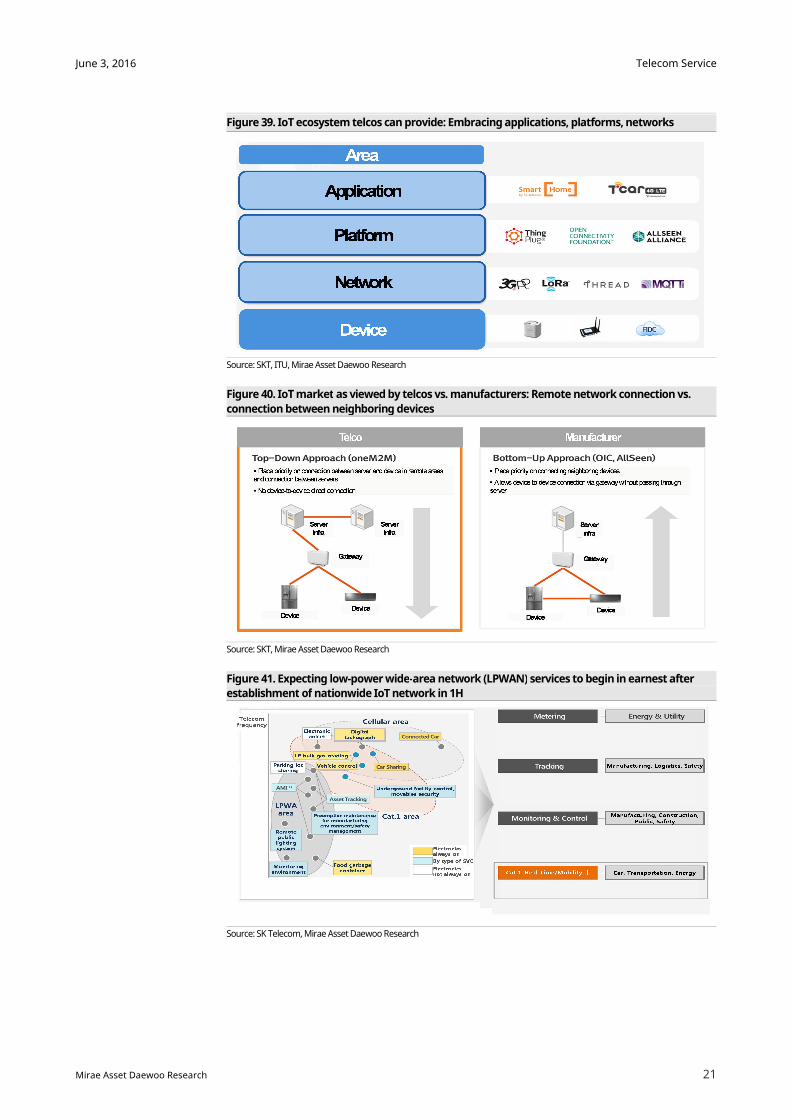
We expect to see telcos establish nationwide networks for IoT in 2H. In a bid to facilitate the
IoT industry, MSIP plans to raise the cap on frequency output of unlicensed spectrum
(900MHz) by 20x, which will help telcos reduce their network construction expenses by one-
third. The government also plans to support the establishment of nationwide IoT networks
in 1H. Specifically, the government plans to: 1) provide additional frequencies for IoT
networks, 2) exempt IoT rate plans from the approval requirement, and 3) exempt location-
based services from the approval requirement (changing to merely a reporting
requirement).
In June, SKT is scheduled to complete the world’s first nationwide network dedicated to
future IoT services, based on LPWAN technology. With this network, the company plans to
launch remote metering services and IoT-specific plans. KT commercialized a nationwide
LTE-M network in March, and plans to roll out IoT-specific plans. LG Uplus also adopted an
LTE-M network and plans to further advance its IoT@home (smart home) services, aiming to
attract more than 500,000 subscribers by the end of the year.
In the short term, IoT services should have only a minimal impact on telcos’ earnings.
However, we note that IoT gives telcos opportunities to: 1) expand into new businesses with
a relatively small investment, 2) seek quantitative subscriber growth amid the saturation of
individual telecom subscriptions, and 3) take a first-mover advantage in the industry as
network operators.
Figure 37. Government plans to improve IoT-related
regulations Figure 38. IoT network standard status
Note: The Conference of Ministers and Regulatory Reform
Source: MSIP, Mirae Asset Daewoo Research
Source: SKT, Mirae Asset Daewoo Research
Table 11. Three major telcos’ IoT businesses
SK Telecom KT LG Uplus
Smart home
IoT services
Door lock, dehumidifier, heater, gas valve lockout, Petfit, T Pet, United Objects brand
(Smart Beam 2/Linkage/Band), T Outdoor, JooN (for children), refrigerator, smart farm, smart cash box, Kia Motors UVO, T-car, smart auto scan, Health-on
GiGA home fitness, door lock, Yodoc (diagnostic tool), smart farm Safe Zone, GiGA homecam, heater, gas valve lockout, open/close sensor, health bike, golf putting, scale, health band
Home CCTV MomCa, home fitness, 6 types of IoT@Home (switch/gas lock/energy meter
/door lock/hub/plug), thermostat, refrigerator, rice cooker, kitchen fire extinguisher, LTE magic mirror, PetSTATION, StarWalk, IoT Cabs
Platform/ brand
ThingPlug (oneM2M)/Smart Home IoT makers/ GiGA IoT IoT@Home
Technology
- LoRa (not standardized); Also using LTE-M - For LoRa, planning to commercialize via separate network with non-licensed band (920MHz)
- Low volume, low power, price competitiveness
- LTE-M (3GPP Rel.8) (completed standardization) - Utilizing existing LTE network - Providing 0.1mn module for free
- Facilitates real-time management and mobility
- LTE-M (3GPP Rel.8) (completed standardization) -Utilizing existing LTE network
- Facilitates real-time management and mobility
Business plan
- Invest W100bn for IoT total care - Build world’s first nationwide IoT network - Develop smart home service for Hyundai E&C
Hillstate
- Launch 30 services in a year - Aim for 0.5mn subscribed devices - Build world’s first nationwide narrow-band IoT
network
- Establish over 30 services in 1H
- Provide home IoT products/services in officetels with 2,500 households
- Apply intelligent IoT service enabling automatic remote control
Number of
telecom lines
- 1.81mn (broadcast control 0.72mn, wearables
0.43mn) - M/S 39%
- 1.13mn (broadcast control 0.38mn, tablet PC
0.30mn) - M/S 24%
- 1.07mn (broadcast control 0.48mn, wireless
payment 0.18mn) - M/S 39%
Note: Number of telecom lines based on MSIP and includes vehicle control, broadcast control, wireless payment, wearables, and other; Excluded service subscribers
counted by telcos themselves. Source: Respective companies’ data, media reports, MSIP, Mirae Asset Daewoo Research
Telecom Service
21
June 3, 2016
Mirae Asset Daewoo Research
Figure 39. IoT ecosystem telcos can provide: Embracing applications, platforms, networks
Source: SKT, ITU, Mirae Asset Daewoo Research
Figure 40. IoT market as viewed by telcos vs. manufacturers: Remote network connection vs.
connection between neighboring devices
Source: SKT, Mirae Asset Daewoo Research
Figure 41. Expecting low-power wide-area network (LPWAN) services to begin in earnest after
establishment of nationwide IoT network in 1H
Source: SK Telecom, Mirae Asset Daewoo Research
Telecom Service
22
June 3, 2016
Mirae Asset Daewoo Research
Investment & valuation
1. Attractive dividend yields
Free cash flow at domestic telcos is improving markedly. Capex has been on the downswing
in the era of advanced telecom technology, while variable costs have also decreased due to
stable marketing competition. Given stable earnings and ample cash flow, we expect telcos
to show attractive dividend payout.
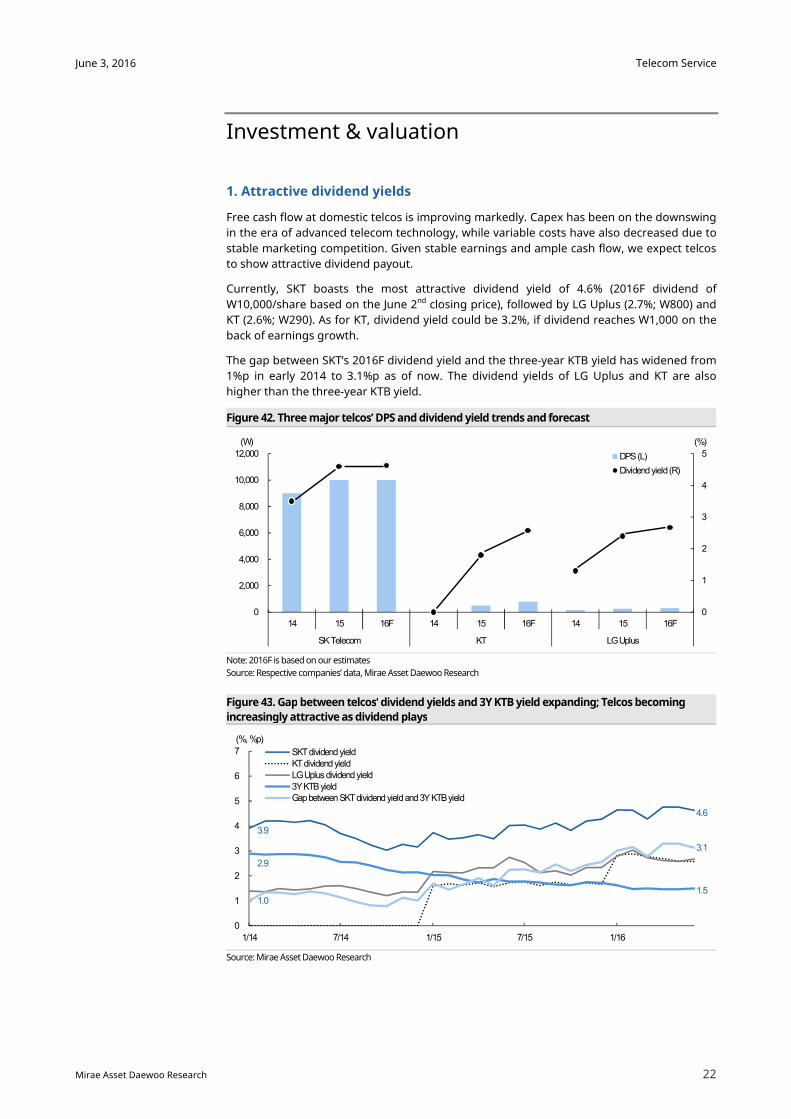
Currently, SKT boasts the most attractive dividend yield of 4.6% (2016F dividend of
W10,000/share based on the June 2nd closing price), followed by LG Uplus (2.7%; W800) and
KT (2.6%; W290). As for KT, dividend yield could be 3.2%, if dividend reaches W1,000 on the
back of earnings growth.
The gap between SKT’s 2016F dividend yield and the three-year KTB yield has widened from
1%p in early 2014 to 3.1%p as of now. The dividend yields of LG Uplus and KT are also
higher than the three-year KTB yield.
Figure 42. Three major telcos’ DPS and dividend yield trends and forecast
Note: 2016F is based on our estimates
Source: Respective companies’ data, Mirae Asset Daewoo Research
Figure 43. Gap between telcos’ dividend yields and 3Y KTB yield expanding; Telcos becoming
increasingly attractive as dividend plays
Source: Mirae Asset Daewoo Research
0
1
2
3
4
5
0
2,000
4,000
6,000
8,000
10,000
12,000
14 15 16F 14 15 16F 14 15 16F
SK Telecom KT LG Uplus
(%)(W)
DPS (L)
Dividend yield (R)
3.9
4.6
2.9
1.5 1.0
3.1
0
1
2
3
4
5
6
7
1/14 7/14 1/15 7/15 1/16
(%, %p)
SKT dividend yieldKT dividend yieldLG Uplus dividend yield3Y KTB yieldGap between SKT dividend yield and 3Y KTB yield
Telecom Service
23
June 3, 2016
Mirae Asset Daewoo Research
2. Investment strategy
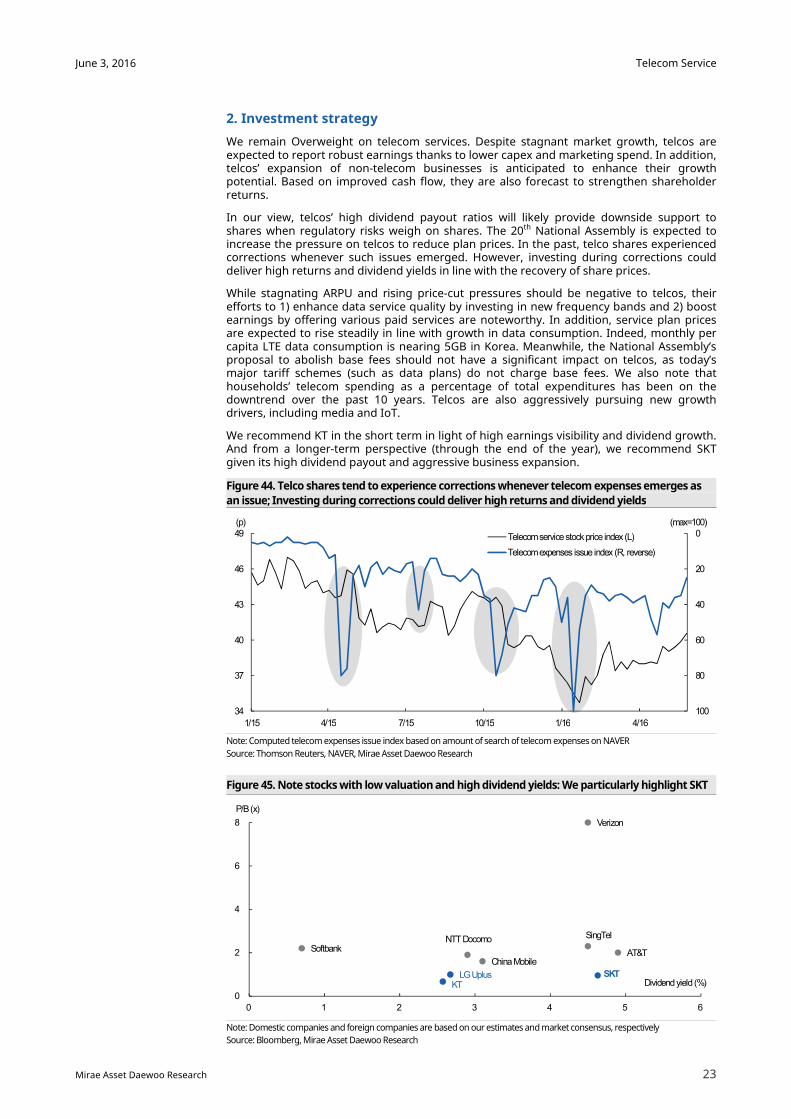
We remain Overweight on telecom services. Despite stagnant market growth, telcos are expected to report robust earnings thanks to lower capex and marketing spend. In addition, telcos’ expansion of non-telecom businesses is anticipated to enhance their growth potential. Based on improved cash flow, they are also forecast to strengthen shareholder returns.
In our view, telcos’ high dividend payout ratios will likely provide downside support to shares when regulatory risks weigh on shares. The 20th National Assembly is expected to increase the pressure on telcos to reduce plan prices. In the past, telco shares experienced corrections whenever such issues emerged. However, investing during corrections could deliver high returns and dividend yields in line with the recovery of share prices.
While stagnating ARPU and rising price-cut pressures should be negative to telcos, their efforts to 1) enhance data service quality by investing in new frequency bands and 2) boost earnings by offering various paid services are noteworthy. In addition, service plan prices are expected to rise steadily in line with growth in data consumption. Indeed, monthly per capita LTE data consumption is nearing 5GB in Korea. Meanwhile, the National Assembly’s proposal to abolish base fees should not have a significant impact on telcos, as today’s major tariff schemes (such as data plans) do not charge base fees. We also note that households’ telecom spending as a percentage of total expenditures has been on the downtrend over the past 10 years. Telcos are also aggressively pursuing new growth drivers, including media and IoT.
We recommend KT in the short term in light of high earnings visibility and dividend growth. And from a longer-term perspective (through the end of the year), we recommend SKT given its high dividend payout and aggressive business expansion.
Figure 44. Telco shares tend to experience corrections whenever telecom expenses emerges as
an issue; Investing during corrections could deliver high returns and dividend yields
Note: Computed telecom expenses issue index based on amount of search of telecom expenses on NAVER
Source: Thomson Reuters, NAVER, Mirae Asset Daewoo Research
Figure 45. Note stocks with low valuation and high dividend yields: We particularly highlight SKT
Note: Domestic companies and foreign companies are based on our estimates and market consensus, respectively
Source: Bloomberg, Mirae Asset Daewoo Research
0
20
40
60
80
10034
37
40
43
46
49
1/15 4/15 7/15 10/15 1/16 4/16
(max=100)(p)
Telecom service stock price index (L)
Telecom expenses issue index (R, reverse)
SKT
KTLG Uplus
Verizon
AT&T
SingTelNTT DocomoSoftbank
China Mobile
0
2
4
6
8
0 1 2 3 4 5 6
P/B (x)
Dividend yield (%)
Telecom Service
24
June 3, 2016
Mirae Asset Daewoo Research
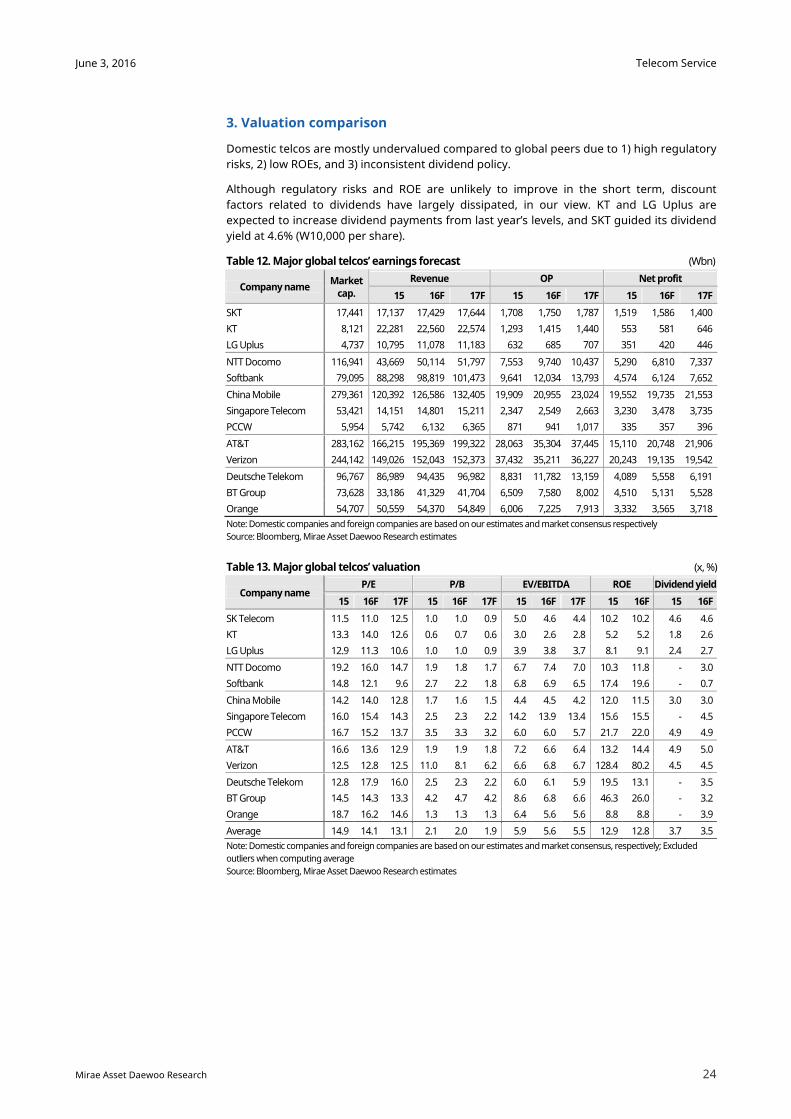
3. Valuation comparison
Domestic telcos are mostly undervalued compared to global peers due to 1) high regulatory
risks, 2) low ROEs, and 3) inconsistent dividend policy.
Although regulatory risks and ROE are unlikely to improve in the short term, discount
factors related to dividends have largely dissipated, in our view. KT and LG Uplus are
expected to increase dividend payments from last year’s levels, and SKT guided its dividend
yield at 4.6% (W10,000 per share).
Table 12. Major global telcos’ earnings forecast (Wbn)
Company name Market
cap.
Revenue OP Net profit
15 16F 17F 15 16F 17F 15 16F 17F
SKT 17,441 17,137 17,429 17,644 1,708 1,750 1,787 1,519 1,586 1,400
KT 8,121 22,281 22,560 22,574 1,293 1,415 1,440 553 581 646
LG Uplus 4,737 10,795 11,078 11,183 632 685 707 351 420 446
NTT Docomo 116,941 43,669 50,114 51,797 7,553 9,740 10,437 5,290 6,810 7,337
Softbank 79,095 88,298 98,819 101,473 9,641 12,034 13,793 4,574 6,124 7,652
China Mobile 279,361 120,392 126,586 132,405 19,909 20,955 23,024 19,552 19,735 21,553
Singapore Telecom 53,421 14,151 14,801 15,211 2,347 2,549 2,663 3,230 3,478 3,735
PCCW 5,954 5,742 6,132 6,365 871 941 1,017 335 357 396
AT&T 283,162 166,215 195,369 199,322 28,063 35,304 37,445 15,110 20,748 21,906
Verizon 244,142 149,026 152,043 152,373 37,432 35,211 36,227 20,243 19,135 19,542
Deutsche Telekom 96,767 86,989 94,435 96,982 8,831 11,782 13,159 4,089 5,558 6,191
BT Group 73,628 33,186 41,329 41,704 6,509 7,580 8,002 4,510 5,131 5,528
Orange 54,707 50,559 54,370 54,849 6,006 7,225 7,913 3,332 3,565 3,718
Note: Domestic companies and foreign companies are based on our estimates and market consensus respectively
Source: Bloomberg, Mirae Asset Daewoo Research estimates
Table 13. Major global telcos’ valuation (x, %)
Company name P/E P/B EV/EBITDA ROE Dividend yield
15 16F 17F 15 16F 17F 15 16F 17F 15 16F 15 16F
SK Telecom 11.5 11.0 12.5 1.0 1.0 0.9 5.0 4.6 4.4 10.2 10.2 4.6 4.6
KT 13.3 14.0 12.6 0.6 0.7 0.6 3.0 2.6 2.8 5.2 5.2 1.8 2.6
LG Uplus 12.9 11.3 10.6 1.0 1.0 0.9 3.9 3.8 3.7 8.1 9.1 2.4 2.7
NTT Docomo 19.2 16.0 14.7 1.9 1.8 1.7 6.7 7.4 7.0 10.3 11.8 - 3.0
Softbank 14.8 12.1 9.6 2.7 2.2 1.8 6.8 6.9 6.5 17.4 19.6 - 0.7
China Mobile 14.2 14.0 12.8 1.7 1.6 1.5 4.4 4.5 4.2 12.0 11.5 3.0 3.0
Singapore Telecom 16.0 15.4 14.3 2.5 2.3 2.2 14.2 13.9 13.4 15.6 15.5 - 4.5
PCCW 16.7 15.2 13.7 3.5 3.3 3.2 6.0 6.0 5.7 21.7 22.0 4.9 4.9
AT&T 16.6 13.6 12.9 1.9 1.9 1.8 7.2 6.6 6.4 13.2 14.4 4.9 5.0
Verizon 12.5 12.8 12.5 11.0 8.1 6.2 6.6 6.8 6.7 128.4 80.2 4.5 4.5
Deutsche Telekom 12.8 17.9 16.0 2.5 2.3 2.2 6.0 6.1 5.9 19.5 13.1 - 3.5
BT Group 14.5 14.3 13.3 4.2 4.7 4.2 8.6 6.8 6.6 46.3 26.0 - 3.2
Orange 18.7 16.2 14.6 1.3 1.3 1.3 6.4 5.6 5.6 8.8 8.8 - 3.9
Average 14.9 14.1 13.1 2.1 2.0 1.9 5.9 5.6 5.5 12.9 12.8 3.7 3.5
Note: Domestic companies and foreign companies are based on our estimates and market consensus, respectively; Excluded
outliers when computing average
Source: Bloomberg, Mirae Asset Daewoo Research estimates
Telecom Service
25
June 3, 2016
Mirae Asset Daewoo Research
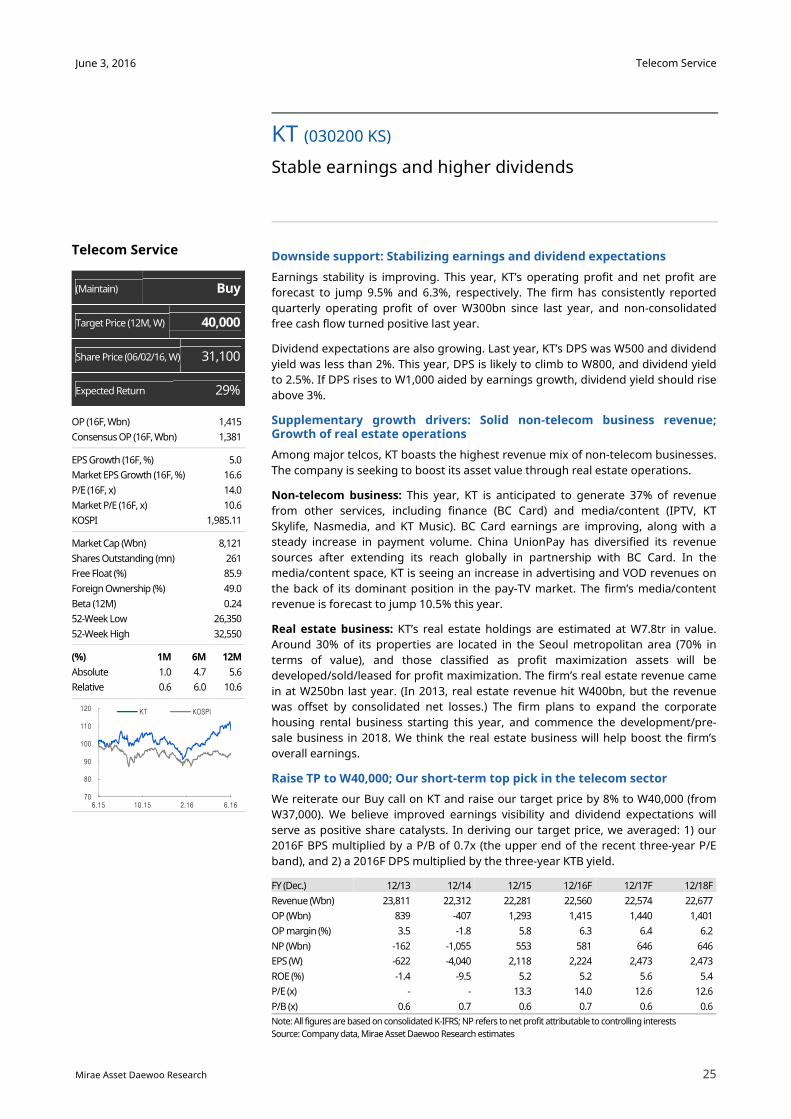
Downside support: Stabilizing earnings and dividend expectations
Earnings stability is improving. This year, KT’s operating profit and net profit are
forecast to jump 9.5% and 6.3%, respectively. The firm has consistently reported
quarterly operating profit of over W300bn since last year, and non-consolidated
free cash flow turned positive last year.
Dividend expectations are also growing. Last year, KT’s DPS was W500 and dividend
yield was less than 2%. This year, DPS is likely to climb to W800, and dividend yield
to 2.5%. If DPS rises to W1,000 aided by earnings growth, dividend yield should rise
above 3%.
Supplementary growth drivers: Solid non-telecom business revenue; Growth of real estate operations
Among major telcos, KT boasts the highest revenue mix of non-telecom businesses.
The company is seeking to boost its asset value through real estate operations.
Non-telecom business: This year, KT is anticipated to generate 37% of revenue
from other services, including finance (BC Card) and media/content (IPTV, KT
Skylife, Nasmedia, and KT Music). BC Card earnings are improving, along with a
steady increase in payment volume. China UnionPay has diversified its revenue
sources after extending its reach globally in partnership with BC Card. In the
media/content space, KT is seeing an increase in advertising and VOD revenues on
the back of its dominant position in the pay-TV market. The firm’s media/content
revenue is forecast to jump 10.5% this year.
Real estate business: KT’s real estate holdings are estimated at W7.8tr in value.
Around 30% of its properties are located in the Seoul metropolitan area (70% in
terms of value), and those classified as profit maximization assets will be
developed/sold/leased for profit maximization. The firm’s real estate revenue came
in at W250bn last year. (In 2013, real estate revenue hit W400bn, but the revenue
was offset by consolidated net losses.) The firm plans to expand the corporate
housing rental business starting this year, and commence the development/pre-
sale business in 2018. We think the real estate business will help boost the firm’s
overall earnings.
Raise TP to W40,000; Our short-term top pick in the telecom sector
We reiterate our Buy call on KT and raise our target price by 8% to W40,000 (from
W37,000). We believe improved earnings visibility and dividend expectations will
serve as positive share catalysts. In deriving our target price, we averaged: 1) our
2016F BPS multiplied by a P/B of 0.7x (the upper end of the recent three-year P/E
band), and 2) a 2016F DPS multiplied by the three-year KTB yield.
KT (030200 KS)
Stable earnings and higher dividends
FY (Dec.) 12/13 12/14 12/15 12/16F 12/17F 12/18F
Revenue (Wbn) 23,811 22,312 22,281 22,560 22,574 22,677
OP (Wbn) 839 -407 1,293 1,415 1,440 1,401
OP margin (%) 3.5 -1.8 5.8 6.3 6.4 6.2
NP (Wbn) -162 -1,055 553 581 646 646
EPS (W) -622 -4,040 2,118 2,224 2,473 2,473
ROE (%) -1.4 -9.5 5.2 5.2 5.6 5.4
P/E (x) - - 13.3 14.0 12.6 12.6
P/B (x) 0.6 0.7 0.6 0.7 0.6 0.6
Note: All figures are based on consolidated K-IFRS; NP refers to net profit attributable to controlling interests
Source: Company data, Mirae Asset Daewoo Research estimates
Telecom Service
(Maintain) Buy
Target Price (12M, W) 40,000
Share Price (06/02/16, W) 31,100
Expected Return 29%
OP (16F, Wbn) 1,415
Consensus OP (16F, Wbn) 1,381
EPS Growth (16F, %) 5.0
Market EPS Growth (16F, %) 16.6
P/E (16F, x) 14.0
Market P/E (16F, x) 10.6
KOSPI 1,985.11
Market Cap (Wbn) 8,121
Shares Outstanding (mn) 261
Free Float (%) 85.9
Foreign Ownership (%) 49.0
Beta (12M) 0.24
52-Week Low 26,350
52-Week High 32,550
(%) 1M 6M 12M
Absolute 1.0 4.7 5.6
Relative 0.6 6.0 10.6
70
80
90
100
110
120
6.15 10.15 2.16 6.16
KT KOSPI
Telecom Service
26
June 3, 2016
KDB Daewoo Securities Research
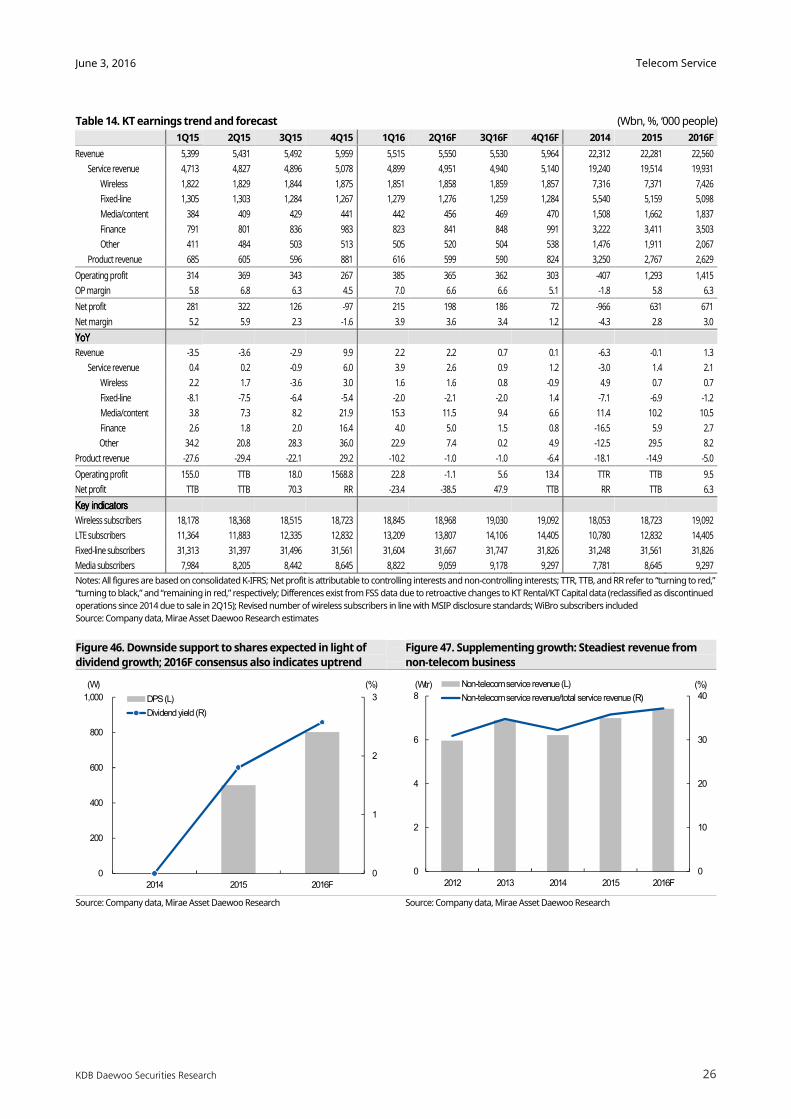
Table 14. KT earnings trend and forecast (Wbn, %, ‘000 people)
1Q15 2Q15 3Q15 4Q15 1Q16 2Q16F 3Q16F 4Q16F 2014 2015 2016F
Revenue 5,399 5,431 5,492 5,959 5,515 5,550 5,530 5,964 22,312 22,281 22,560
Service revenue 4,713 4,827 4,896 5,078 4,899 4,951 4,940 5,140 19,240 19,514 19,931
Wireless 1,822 1,829 1,844 1,875 1,851 1,858 1,859 1,857 7,316 7,371 7,426
Fixed-line 1,305 1,303 1,284 1,267 1,279 1,276 1,259 1,284 5,540 5,159 5,098
Media/content 384 409 429 441 442 456 469 470 1,508 1,662 1,837
Finance 791 801 836 983 823 841 848 991 3,222 3,411 3,503
Other 411 484 503 513 505 520 504 538 1,476 1,911 2,067
Product revenue 685 605 596 881 616 599 590 824 3,250 2,767 2,629
Operating profit 314 369 343 267 385 365 362 303 -407 1,293 1,415
OP margin 5.8 6.8 6.3 4.5 7.0 6.6 6.6 5.1 -1.8 5.8 6.3
Net profit 281 322 126 -97 215 198 186 72 -966 631 671
Net margin 5.2 5.9 2.3 -1.6 3.9 3.6 3.4 1.2 -4.3 2.8 3.0
YoYYoYYoYYoY
Revenue -3.5 -3.6 -2.9 9.9 2.2 2.2 0.7 0.1 -6.3 -0.1 1.3
Service revenue 0.4 0.2 -0.9 6.0 3.9 2.6 0.9 1.2 -3.0 1.4 2.1
Wireless 2.2 1.7 -3.6 3.0 1.6 1.6 0.8 -0.9 4.9 0.7 0.7
Fixed-line -8.1 -7.5 -6.4 -5.4 -2.0 -2.1 -2.0 1.4 -7.1 -6.9 -1.2
Media/content 3.8 7.3 8.2 21.9 15.3 11.5 9.4 6.6 11.4 10.2 10.5
Finance 2.6 1.8 2.0 16.4 4.0 5.0 1.5 0.8 -16.5 5.9 2.7
Other 34.2 20.8 28.3 36.0 22.9 7.4 0.2 4.9 -12.5 29.5 8.2
Product revenue -27.6 -29.4 -22.1 29.2 -10.2 -1.0 -1.0 -6.4 -18.1 -14.9 -5.0
Operating profit 155.0 TTB 18.0 1568.8 22.8 -1.1 5.6 13.4 TTR TTB 9.5
Net profit TTB TTB 70.3 RR -23.4 -38.5 47.9 TTB RR TTB 6.3
Key indicatorsKey indicatorsKey indicatorsKey indicators
Wireless subscribers 18,178 18,368 18,515 18,723 18,845 18,968 19,030 19,092 18,053 18,723 19,092
LTE subscribers 11,364 11,883 12,335 12,832 13,209 13,807 14,106 14,405 10,780 12,832 14,405
Fixed-line subscribers 31,313 31,397 31,496 31,561 31,604 31,667 31,747 31,826 31,248 31,561 31,826
Media subscribers 7,984 8,205 8,442 8,645 8,822 9,059 9,178 9,297 7,781 8,645 9,297
Notes: All figures are based on consolidated K-IFRS; Net profit is attributable to controlling interests and non-controlling interests; TTR, TTB, and RR refer to “turning to red,”
“turning to black,” and “remaining in red,” respectively; Differences exist from FSS data due to retroactive changes to KT Rental/KT Capital data (reclassified as discontinued
operations since 2014 due to sale in 2Q15); Revised number of wireless subscribers in line with MSIP disclosure standards; WiBro subscribers included
Source: Company data, Mirae Asset Daewoo Research estimates
Figure 46. Downside support to shares expected in light of
dividend growth; 2016F consensus also indicates uptrend
Figure 47. Supplementing growth: Steadiest revenue from
non-telecom business
Source: Company data, Mirae Asset Daewoo Research Source: Company data, Mirae Asset Daewoo Research
0
10
20
30
40
0
2
4
6
8
2012 2013 2014 2015 2016F
(%)(Wtr) Non-telecom service revenue (L)
Non-telecom service revenue/total service revenue (R)
0
1
2
3
0
200
400
600
800
1,000
2014 2015 2016F
(%)(W)
DPS (L)
Dividend yield (R)
Telecom Service
27
June 3, 2016
Mirae Asset Daewoo Research
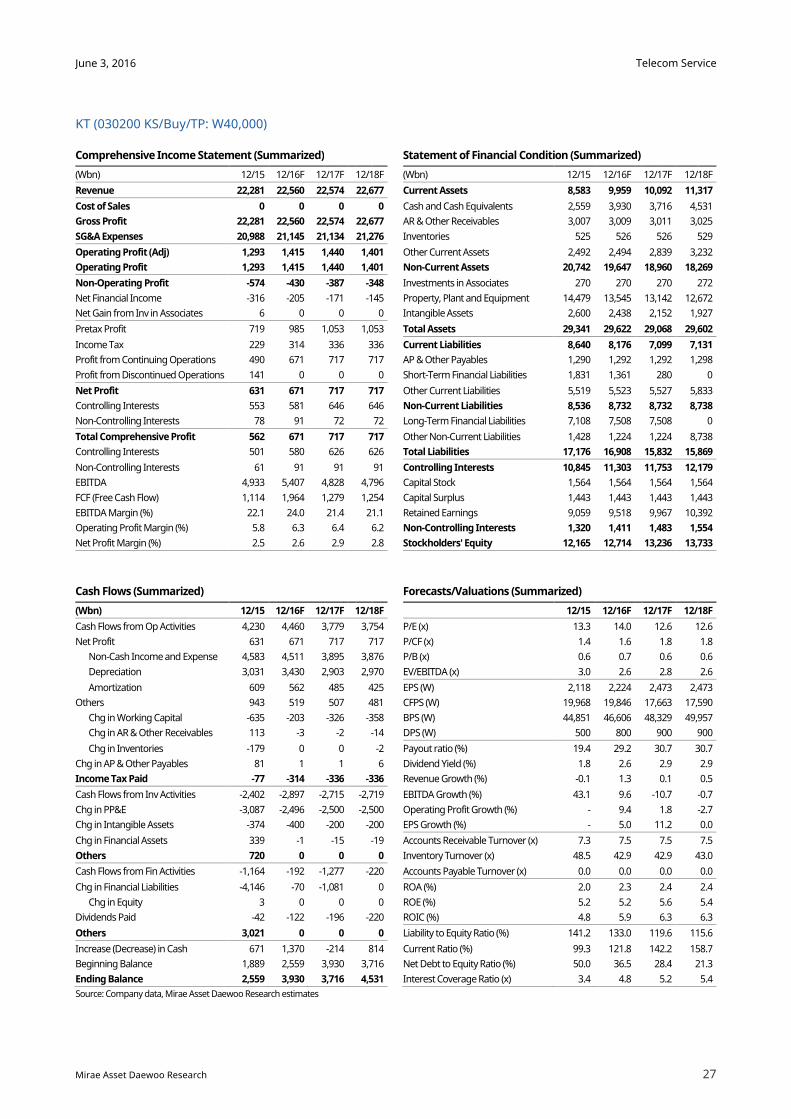
KT (030200 KS/Buy/TP: W40,000)
Comprehensive Income Statement (Summarized) Statement of Financial Condition (Summarized)
(Wbn) 12/15 12/16F 12/17F 12/18F (Wbn) 12/15 12/16F 12/17F 12/18F
Revenue 22,281 22,560 22,574 22,677 Current Assets 8,583 9,959 10,092 11,317
Cost of Sales 0 0 0 0 Cash and Cash Equivalents 2,559 3,930 3,716 4,531
Gross Profit 22,281 22,560 22,574 22,677 AR & Other Receivables 3,007 3,009 3,011 3,025
SG&A Expenses 20,988 21,145 21,134 21,276 Inventories 525 526 526 529
Operating Profit (Adj) 1,293 1,415 1,440 1,401 Other Current Assets 2,492 2,494 2,839 3,232
Operating Profit 1,293 1,415 1,440 1,401 Non-Current Assets 20,742 19,647 18,960 18,269
Non-Operating Profit -574 -430 -387 -348 Investments in Associates 270 270 270 272
Net Financial Income -316 -205 -171 -145 Property, Plant and Equipment 14,479 13,545 13,142 12,672
Net Gain from Inv in Associates 6 0 0 0 Intangible Assets 2,600 2,438 2,152 1,927
Pretax Profit 719 985 1,053 1,053 Total Assets 29,341 29,622 29,068 29,602
Income Tax 229 314 336 336 Current Liabilities 8,640 8,176 7,099 7,131
Profit from Continuing Operations 490 671 717 717 AP & Other Payables 1,290 1,292 1,292 1,298
Profit from Discontinued Operations 141 0 0 0 Short-Term Financial Liabilities 1,831 1,361 280 0
Net Profit 631 671 717 717 Other Current Liabilities 5,519 5,523 5,527 5,833
Controlling Interests 553 581 646 646 Non-Current Liabilities 8,536 8,732 8,732 8,738
Non-Controlling Interests 78 91 72 72 Long-Term Financial Liabilities 7,108 7,508 7,508 0
Total Comprehensive Profit 562 671 717 717 Other Non-Current Liabilities 1,428 1,224 1,224 8,738
Controlling Interests 501 580 626 626 Total Liabilities 17,176 16,908 15,832 15,869
Non-Controlling Interests 61 91 91 91 Controlling Interests 10,845 11,303 11,753 12,179
EBITDA 4,933 5,407 4,828 4,796 Capital Stock 1,564 1,564 1,564 1,564
FCF (Free Cash Flow) 1,114 1,964 1,279 1,254 Capital Surplus 1,443 1,443 1,443 1,443
EBITDA Margin (%) 22.1 24.0 21.4 21.1 Retained Earnings 9,059 9,518 9,967 10,392
Operating Profit Margin (%) 5.8 6.3 6.4 6.2 Non-Controlling Interests 1,320 1,411 1,483 1,554
Net Profit Margin (%) 2.5 2.6 2.9 2.8 Stockholders' Equity 12,165 12,714 13,236 13,733
Cash Flows (Summarized) Forecasts/Valuations (Summarized)
(Wbn) 12/15 12/16F 12/17F 12/18F 12/15 12/16F 12/17F 12/18F
Cash Flows from Op Activities 4,230 4,460 3,779 3,754 P/E (x) 13.3 14.0 12.6 12.6
Net Profit 631 671 717 717 P/CF (x) 1.4 1.6 1.8 1.8
Non-Cash Income and Expense 4,583 4,511 3,895 3,876 P/B (x) 0.6 0.7 0.6 0.6
Depreciation 3,031 3,430 2,903 2,970 EV/EBITDA (x) 3.0 2.6 2.8 2.6
Amortization 609 562 485 425 EPS (W) 2,118 2,224 2,473 2,473
Others 943 519 507 481 CFPS (W) 19,968 19,846 17,663 17,590
Chg in Working Capital -635 -203 -326 -358 BPS (W) 44,851 46,606 48,329 49,957
Chg in AR & Other Receivables 113 -3 -2 -14 DPS (W) 500 800 900 900
Chg in Inventories -179 0 0 -2 Payout ratio (%) 19.4 29.2 30.7 30.7
Chg in AP & Other Payables 81 1 1 6 Dividend Yield (%) 1.8 2.6 2.9 2.9
Income Tax Paid -77 -314 -336 -336 Revenue Growth (%) -0.1 1.3 0.1 0.5
Cash Flows from Inv Activities -2,402 -2,897 -2,715 -2,719 EBITDA Growth (%) 43.1 9.6 -10.7 -0.7
Chg in PP&E -3,087 -2,496 -2,500 -2,500 Operating Profit Growth (%) - 9.4 1.8 -2.7
Chg in Intangible Assets -374 -400 -200 -200 EPS Growth (%) - 5.0 11.2 0.0
Chg in Financial Assets 339 -1 -15 -19 Accounts Receivable Turnover (x) 7.3 7.5 7.5 7.5
Others 720 0 0 0 Inventory Turnover (x) 48.5 42.9 42.9 43.0
Cash Flows from Fin Activities -1,164 -192 -1,277 -220 Accounts Payable Turnover (x) 0.0 0.0 0.0 0.0
Chg in Financial Liabilities -4,146 -70 -1,081 0 ROA (%) 2.0 2.3 2.4 2.4
Chg in Equity 3 0 0 0 ROE (%) 5.2 5.2 5.6 5.4
Dividends Paid -42 -122 -196 -220 ROIC (%) 4.8 5.9 6.3 6.3
Others 3,021 0 0 0 Liability to Equity Ratio (%) 141.2 133.0 119.6 115.6
Increase (Decrease) in Cash 671 1,370 -214 814 Current Ratio (%) 99.3 121.8 142.2 158.7
Beginning Balance 1,889 2,559 3,930 3,716 Net Debt to Equity Ratio (%) 50.0 36.5 28.4 21.3
Ending Balance 2,559 3,930 3,716 4,531 Interest Coverage Ratio (x) 3.4 4.8 5.2 5.4
Source: Company data, Mirae Asset Daewoo Research estimates
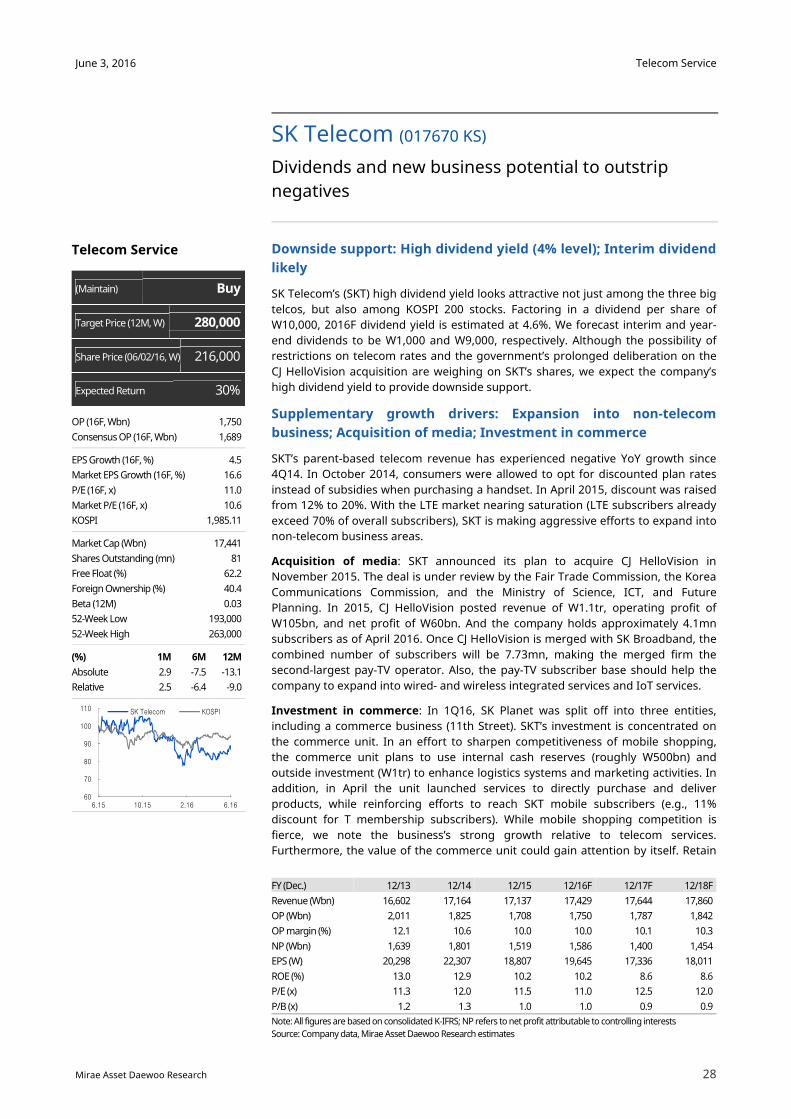
Telecom Service
28
June 3, 2016
Mirae Asset Daewoo Research
Downside support: High dividend yield (4% level); Interim dividend
likely
SK Telecom’s (SKT) high dividend yield looks attractive not just among the three big
telcos, but also among KOSPI 200 stocks. Factoring in a dividend per share of
W10,000, 2016F dividend yield is estimated at 4.6%. We forecast interim and year-
end dividends to be W1,000 and W9,000, respectively. Although the possibility of
restrictions on telecom rates and the government’s prolonged deliberation on the
CJ HelloVision acquisition are weighing on SKT’s shares, we expect the company’s
high dividend yield to provide downside support.
Supplementary growth drivers: Expansion into non-telecom
business; Acquisition of media; Investment in commerce
SKT’s parent-based telecom revenue has experienced negative YoY growth since
4Q14. In October 2014, consumers were allowed to opt for discounted plan rates
instead of subsidies when purchasing a handset. In April 2015, discount was raised
from 12% to 20%. With the LTE market nearing saturation (LTE subscribers already
exceed 70% of overall subscribers), SKT is making aggressive efforts to expand into
non-telecom business areas.
Acquisition of media: SKT announced its plan to acquire CJ HelloVision in
November 2015. The deal is under review by the Fair Trade Commission, the Korea
Communications Commission, and the Ministry of Science, ICT, and Future
Planning. In 2015, CJ HelloVision posted revenue of W1.1tr, operating profit of
W105bn, and net profit of W60bn. And the company holds approximately 4.1mn
subscribers as of April 2016. Once CJ HelloVision is merged with SK Broadband, the
combined number of subscribers will be 7.73mn, making the merged firm the
second-largest pay-TV operator. Also, the pay-TV subscriber base should help the
company to expand into wired- and wireless integrated services and IoT services.
Investment in commerce: In 1Q16, SK Planet was split off into three entities,
including a commerce business (11th Street). SKT’s investment is concentrated on
the commerce unit. In an effort to sharpen competitiveness of mobile shopping,
the commerce unit plans to use internal cash reserves (roughly W500bn) and
outside investment (W1tr) to enhance logistics systems and marketing activities. In
addition, in April the unit launched services to directly purchase and deliver
products, while reinforcing efforts to reach SKT mobile subscribers (e.g., 11%
discount for T membership subscribers). While mobile shopping competition is
fierce, we note the business’s strong growth relative to telecom services.
Furthermore, the value of the commerce unit could gain attention by itself. Retain
SK Telecom (017670 KS)
Dividends and new business potential to outstrip
negatives
FY (Dec.) 12/13 12/14 12/15 12/16F 12/17F 12/18F
Revenue (Wbn) 16,602 17,164 17,137 17,429 17,644 17,860
OP (Wbn) 2,011 1,825 1,708 1,750 1,787 1,842
OP margin (%) 12.1 10.6 10.0 10.0 10.1 10.3
NP (Wbn) 1,639 1,801 1,519 1,586 1,400 1,454
EPS (W) 20,298 22,307 18,807 19,645 17,336 18,011
ROE (%) 13.0 12.9 10.2 10.2 8.6 8.6
P/E (x) 11.3 12.0 11.5 11.0 12.5 12.0
P/B (x) 1.2 1.3 1.0 1.0 0.9 0.9
Note: All figures are based on consolidated K-IFRS; NP refers to net profit attributable to controlling interests
Source: Company data, Mirae Asset Daewoo Research estimates
Telecom Service
(Maintain) Buy
Target Price (12M, W) 280,000
Share Price (06/02/16, W) 216,000
Expected Return 30%
OP (16F, Wbn) 1,750
Consensus OP (16F, Wbn) 1,689
EPS Growth (16F, %) 4.5
Market EPS Growth (16F, %) 16.6
P/E (16F, x) 11.0
Market P/E (16F, x) 10.6
KOSPI 1,985.11
Market Cap (Wbn) 17,441
Shares Outstanding (mn) 81
Free Float (%) 62.2
Foreign Ownership (%) 40.4
Beta (12M) 0.03
52-Week Low 193,000
52-Week High 263,000
(%) 1M 6M 12M
Absolute 2.9 -7.5 -13.1
Relative 2.5 -6.4 -9.0
60
70
80
90
100
110
6.15 10.15 2.16 6.16
SK Telecom KOSPI

Telecom Service
29
June 3, 2016
Mirae Asset Daewoo Research
Buy with TP of W280,000; Our longer-term top pick
We maintain our Buy call with a target price of W280,000. In the short term, SKT
shares could be dragged down by uncertainties regarding regulatory risks and
expenses related to non-telecom businesses. However, if uncertainties ease this
year, we believe the stock will bounce back, aided by its deep correction relative to
telecom peers, 10-year-low foreign ownership level, and high dividend yield.
Table 15. SKT earnings trends and forecast (Wbn, %, ‘000 people)
1Q15 2Q15 3Q15 4Q15 1Q16 2Q16F 3Q16F 4Q16F 2014 2015 2016F
Revenue 4,240 4,256 4,261 4,379 4,229 4,329 4,369 4,503 17,164 17,137 17,429
Parent 3,133 3,144 3,142 3,138 3,098 3,179 3,182 3,176 13,013 12,557 12,635
Wireless 2,910 2,917 2,923 2,913 2,895 2,904 2,905 2,900 12,053 11,662 11,604
Other 224 227 219 225 203 274 277 277 960 895 1,031
Subsidiaries 1,107 1,112 1,119 1,241 1,131 1,151 1,187 1,326 4,151 4,580 4,794
Operating profit 403 413 491 402 402 438 474 436 1,825 1,708 1,750
OP margin (%) 9.5 9.7 11.5 9.2 9.5 10.1 10.8 9.7 10.6 10.0 10.0
Net profit 443 398 382 293 572 334 374 308 1,799 1,516 1,588
Net margin (%) 10.4 9.3 9.0 6.7 13.5 7.7 8.6 6.8 10.5 8.8 9.1
QoQ
Revenue -1.1 0.4 0.1 2.8 -3.4 2.4 0.9 3.1
Parent -1.5 0.4 -0.1 -0.1 -1.3 2.6 0.1 -0.2
Wireless -0.5 0.2 0.2 -0.3 -0.6 0.3 0.0 -0.2
Other -12.2 1.3 -3.5 2.7 -9.8 35.1 1.0 -0.1
Subsidiaries -0.2 0.4 0.7 10.9 -8.9 1.8 3.1 11.8
Operating profit -17.8 2.5 18.9 -18.1 0.1 9.0 8.1 -8.0
Net profit -12.0 -10.1 -4.0 -23.2 95.1 -41.7 11.9 -17.6
YoY
Revenue 0.9 -1.1 -2.4 2.1 -0.3 1.7 2.5 2.8 3.4 -0.2 1.7
Parent -4.0 -3.7 -4.9 -1.4 -1.1 1.1 1.3 1.2 1.2 -3.5 0.6
Wireless -4.2 -3.9 -4.3 -0.4 -0.5 -0.4 -0.6 -0.5 0.4 -3.2 -0.5
Other -1.3 -0.9 -12.0 -11.8 -9.4 20.8 26.5 23.0 12.7 -6.8 15.2
Subsidiaries 18.0 6.9 5.3 11.9 2.1 3.5 6.0 6.8 10.9 10.3 4.7
Operating profit 59.8 -24.4 -8.6 -18.0 -0.1 6.2 -3.5 8.5 -9.2 -6.4 2.5
Net profit 65.7 -20.0 -28.1 -41.7 29.2 -16.1 -2.1 5.0 11.8 -15.8 4.7
Key indicators
Wireless subscribers 28,026 28,313 28,474 28,626 28,921 29,075 29,152 29,229 28,279 28,626 29,229
LTE subscribers 17,447 17,937 18,465 18,980 19,526 20,432 20,884 21,337 16,737 18,980 21,337
Notes: All figures are based on consolidated K-IFRS; Incurred one-off cost of W110bn related to early retirement plan in 2Q15; Reflected gain of W314.7bn from sell-off of
stake in LOEN Entertainment
Source: Company data, Mirae Asset Daewoo Research
Figure 48. Downside support to shares expected in light of
high dividends (even relative to global peers)
Figure 49. Supplementing growth: Media (CJ HelloVision) and
commerce (11th Street) businesses are strengthening
Source: Company data, Mirae Asset Daewoo Research Source: Company data, Mirae Asset Daewoo Research
2
3
4
5
8,000
8,500
9,000
9,500
10,000
10,500
2014 2015 2016F
(%)(W)
DPS (L)
Dividend yield (R)
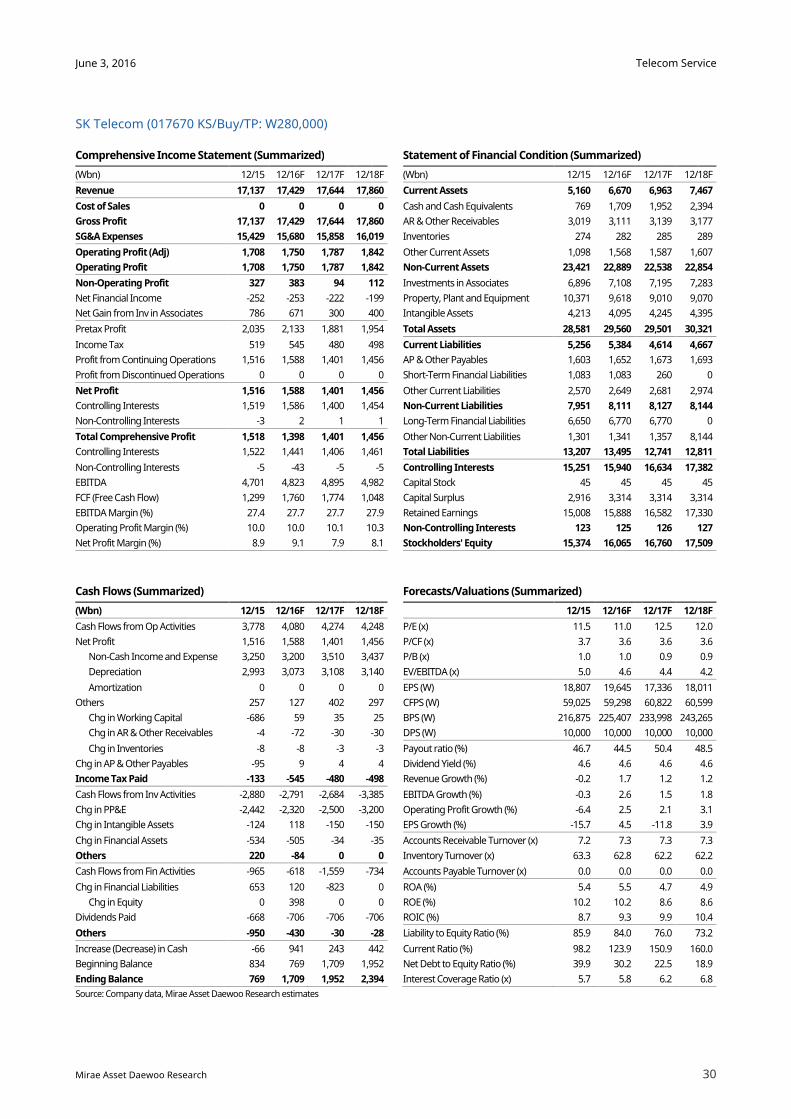
Telecom Service
30
June 3, 2016
Mirae Asset Daewoo Research
SK Telecom (017670 KS/Buy/TP: W280,000)
Comprehensive Income Statement (Summarized) Statement of Financial Condition (Summarized)
(Wbn) 12/15 12/16F 12/17F 12/18F (Wbn) 12/15 12/16F 12/17F 12/18F
Revenue 17,137 17,429 17,644 17,860 Current Assets 5,160 6,670 6,963 7,467
Cost of Sales 0 0 0 0 Cash and Cash Equivalents 769 1,709 1,952 2,394
Gross Profit 17,137 17,429 17,644 17,860 AR & Other Receivables 3,019 3,111 3,139 3,177
SG&A Expenses 15,429 15,680 15,858 16,019 Inventories 274 282 285 289
Operating Profit (Adj) 1,708 1,750 1,787 1,842 Other Current Assets 1,098 1,568 1,587 1,607
Operating Profit 1,708 1,750 1,787 1,842 Non-Current Assets 23,421 22,889 22,538 22,854
Non-Operating Profit 327 383 94 112 Investments in Associates 6,896 7,108 7,195 7,283
Net Financial Income -252 -253 -222 -199 Property, Plant and Equipment 10,371 9,618 9,010 9,070
Net Gain from Inv in Associates 786 671 300 400 Intangible Assets 4,213 4,095 4,245 4,395
Pretax Profit 2,035 2,133 1,881 1,954 Total Assets 28,581 29,560 29,501 30,321
Income Tax 519 545 480 498 Current Liabilities 5,256 5,384 4,614 4,667
Profit from Continuing Operations 1,516 1,588 1,401 1,456 AP & Other Payables 1,603 1,652 1,673 1,693
Profit from Discontinued Operations 0 0 0 0 Short-Term Financial Liabilities 1,083 1,083 260 0
Net Profit 1,516 1,588 1,401 1,456 Other Current Liabilities 2,570 2,649 2,681 2,974
Controlling Interests 1,519 1,586 1,400 1,454 Non-Current Liabilities 7,951 8,111 8,127 8,144
Non-Controlling Interests -3 2 1 1 Long-Term Financial Liabilities 6,650 6,770 6,770 0
Total Comprehensive Profit 1,518 1,398 1,401 1,456 Other Non-Current Liabilities 1,301 1,341 1,357 8,144
Controlling Interests 1,522 1,441 1,406 1,461 Total Liabilities 13,207 13,495 12,741 12,811
Non-Controlling Interests -5 -43 -5 -5 Controlling Interests 15,251 15,940 16,634 17,382
EBITDA 4,701 4,823 4,895 4,982 Capital Stock 45 45 45 45
FCF (Free Cash Flow) 1,299 1,760 1,774 1,048 Capital Surplus 2,916 3,314 3,314 3,314
EBITDA Margin (%) 27.4 27.7 27.7 27.9 Retained Earnings 15,008 15,888 16,582 17,330
Operating Profit Margin (%) 10.0 10.0 10.1 10.3 Non-Controlling Interests 123 125 126 127
Net Profit Margin (%) 8.9 9.1 7.9 8.1 Stockholders' Equity 15,374 16,065 16,760 17,509
Cash Flows (Summarized) Forecasts/Valuations (Summarized)
(Wbn) 12/15 12/16F 12/17F 12/18F 12/15 12/16F 12/17F 12/18F
Cash Flows from Op Activities 3,778 4,080 4,274 4,248 P/E (x) 11.5 11.0 12.5 12.0
Net Profit 1,516 1,588 1,401 1,456 P/CF (x) 3.7 3.6 3.6 3.6
Non-Cash Income and Expense 3,250 3,200 3,510 3,437 P/B (x) 1.0 1.0 0.9 0.9
Depreciation 2,993 3,073 3,108 3,140 EV/EBITDA (x) 5.0 4.6 4.4 4.2
Amortization 0 0 0 0 EPS (W) 18,807 19,645 17,336 18,011
Others 257 127 402 297 CFPS (W) 59,025 59,298 60,822 60,599
Chg in Working Capital -686 59 35 25 BPS (W) 216,875 225,407 233,998 243,265
Chg in AR & Other Receivables -4 -72 -30 -30 DPS (W) 10,000 10,000 10,000 10,000
Chg in Inventories -8 -8 -3 -3 Payout ratio (%) 46.7 44.5 50.4 48.5
Chg in AP & Other Payables -95 9 4 4 Dividend Yield (%) 4.6 4.6 4.6 4.6
Income Tax Paid -133 -545 -480 -498 Revenue Growth (%) -0.2 1.7 1.2 1.2
Cash Flows from Inv Activities -2,880 -2,791 -2,684 -3,385 EBITDA Growth (%) -0.3 2.6 1.5 1.8
Chg in PP&E -2,442 -2,320 -2,500 -3,200 Operating Profit Growth (%) -6.4 2.5 2.1 3.1
Chg in Intangible Assets -124 118 -150 -150 EPS Growth (%) -15.7 4.5 -11.8 3.9
Chg in Financial Assets -534 -505 -34 -35 Accounts Receivable Turnover (x) 7.2 7.3 7.3 7.3
Others 220 -84 0 0 Inventory Turnover (x) 63.3 62.8 62.2 62.2
Cash Flows from Fin Activities -965 -618 -1,559 -734 Accounts Payable Turnover (x) 0.0 0.0 0.0 0.0
Chg in Financial Liabilities 653 120 -823 0 ROA (%) 5.4 5.5 4.7 4.9
Chg in Equity 0 398 0 0 ROE (%) 10.2 10.2 8.6 8.6
Dividends Paid -668 -706 -706 -706 ROIC (%) 8.7 9.3 9.9 10.4
Others -950 -430 -30 -28 Liability to Equity Ratio (%) 85.9 84.0 76.0 73.2
Increase (Decrease) in Cash -66 941 243 442 Current Ratio (%) 98.2 123.9 150.9 160.0
Beginning Balance 834 769 1,709 1,952 Net Debt to Equity Ratio (%) 39.9 30.2 22.5 18.9
Ending Balance 769 1,709 1,952 2,394 Interest Coverage Ratio (x) 5.7 5.8 6.2 6.8
Source: Company data, Mirae Asset Daewoo Research estimates
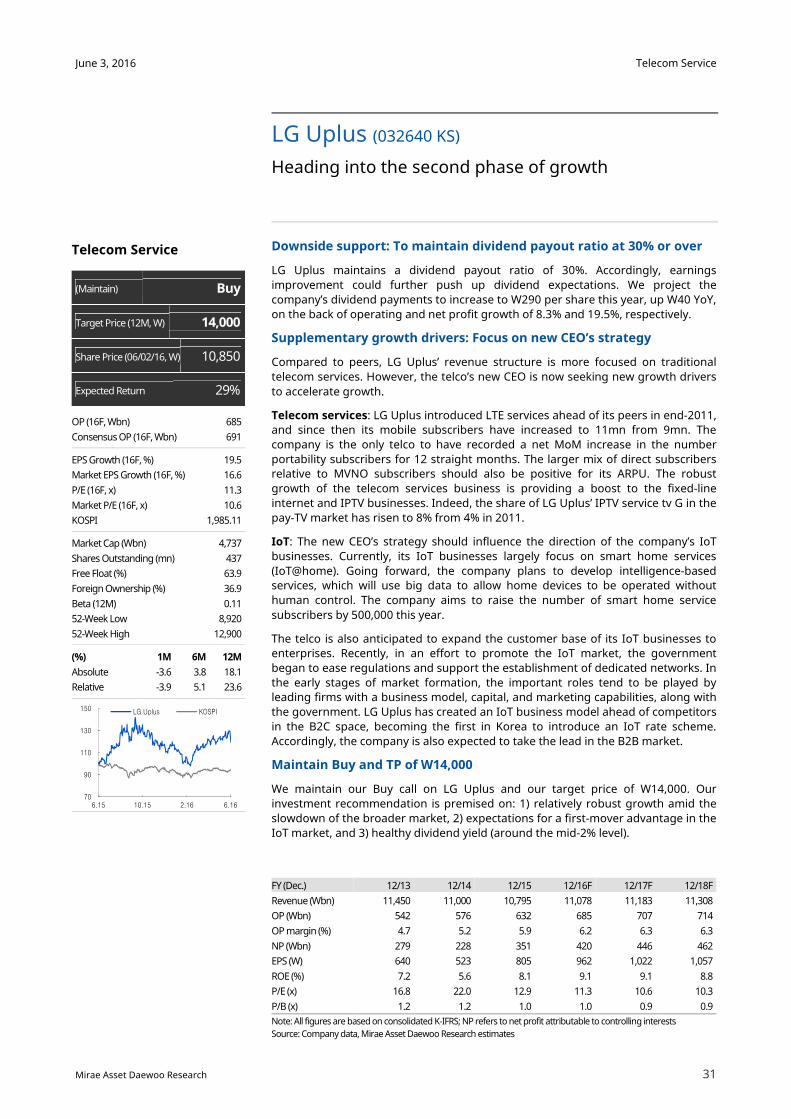
Telecom Service
31
June 3, 2016
Mirae Asset Daewoo Research
Downside support: To maintain dividend payout ratio at 30% or over
LG Uplus maintains a dividend payout ratio of 30%. Accordingly, earnings
improvement could further push up dividend expectations. We project the
company’s dividend payments to increase to W290 per share this year, up W40 YoY,
on the back of operating and net profit growth of 8.3% and 19.5%, respectively.
Supplementary growth drivers: Focus on new CEO’s strategy
Compared to peers, LG Uplus’ revenue structure is more focused on traditional
telecom services. However, the telco’s new CEO is now seeking new growth drivers
to accelerate growth.
Telecom services: LG Uplus introduced LTE services ahead of its peers in end-2011,
and since then its mobile subscribers have increased to 11mn from 9mn. The
company is the only telco to have recorded a net MoM increase in the number
portability subscribers for 12 straight months. The larger mix of direct subscribers
relative to MVNO subscribers should also be positive for its ARPU. The robust
growth of the telecom services business is providing a boost to the fixed-line
internet and IPTV businesses. Indeed, the share of LG Uplus’ IPTV service tv G in the
pay-TV market has risen to 8% from 4% in 2011.
IoT: The new CEO’s strategy should influence the direction of the company’s IoT
businesses. Currently, its IoT businesses largely focus on smart home services
(IoT@home). Going forward, the company plans to develop intelligence-based
services, which will use big data to allow home devices to be operated without
human control. The company aims to raise the number of smart home service
subscribers by 500,000 this year.
The telco is also anticipated to expand the customer base of its IoT businesses to
enterprises. Recently, in an effort to promote the IoT market, the government
began to ease regulations and support the establishment of dedicated networks. In
the early stages of market formation, the important roles tend to be played by
leading firms with a business model, capital, and marketing capabilities, along with
the government. LG Uplus has created an IoT business model ahead of competitors
in the B2C space, becoming the first in Korea to introduce an IoT rate scheme.
Accordingly, the company is also expected to take the lead in the B2B market.
Maintain Buy and TP of W14,000
We maintain our Buy call on LG Uplus and our target price of W14,000. Our
investment recommendation is premised on: 1) relatively robust growth amid the
slowdown of the broader market, 2) expectations for a first-mover advantage in the
IoT market, and 3) healthy dividend yield (around the mid-2% level).
LG Uplus (032640 KS)
Heading into the second phase of growth
FY (Dec.) 12/13 12/14 12/15 12/16F 12/17F 12/18F
Revenue (Wbn) 11,450 11,000 10,795 11,078 11,183 11,308
OP (Wbn) 542 576 632 685 707 714
OP margin (%) 4.7 5.2 5.9 6.2 6.3 6.3
NP (Wbn) 279 228 351 420 446 462
EPS (W) 640 523 805 962 1,022 1,057
ROE (%) 7.2 5.6 8.1 9.1 9.1 8.8
P/E (x) 16.8 22.0 12.9 11.3 10.6 10.3
P/B (x) 1.2 1.2 1.0 1.0 0.9 0.9
Note: All figures are based on consolidated K-IFRS; NP refers to net profit attributable to controlling interests
Source: Company data, Mirae Asset Daewoo Research estimates
Telecom Service
(Maintain) Buy
Target Price (12M, W) 14,000
Share Price (06/02/16, W) 10,850
Expected Return 29%
OP (16F, Wbn) 685
Consensus OP (16F, Wbn) 691
EPS Growth (16F, %) 19.5
Market EPS Growth (16F, %) 16.6
P/E (16F, x) 11.3
Market P/E (16F, x) 10.6
KOSPI 1,985.11
Market Cap (Wbn) 4,737
Shares Outstanding (mn) 437
Free Float (%) 63.9
Foreign Ownership (%) 36.9
Beta (12M) 0.11
52-Week Low 8,920
52-Week High 12,900
(%) 1M 6M 12M
Absolute -3.6 3.8 18.1
Relative -3.9 5.1 23.6
70
90
110
130
150
6.15 10.15 2.16 6.16
LG Uplus KOSPI
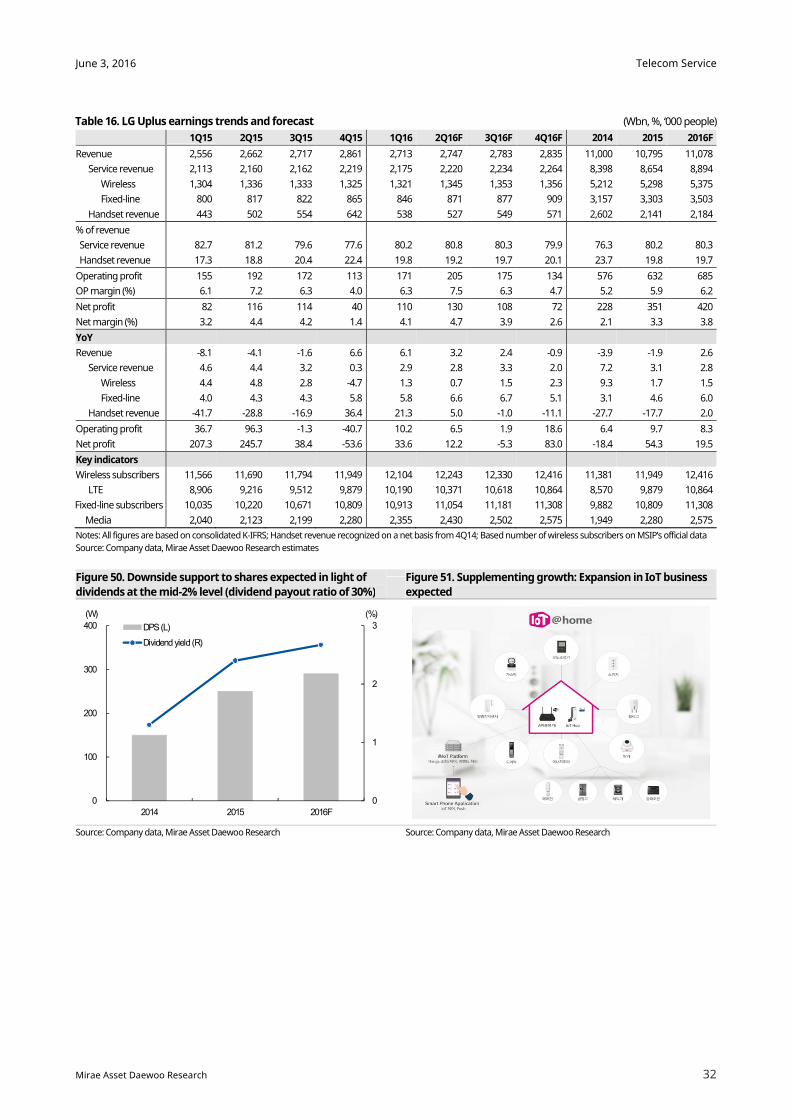
Telecom Service
32
June 3, 2016
Mirae Asset Daewoo Research
Table 16. LG Uplus earnings trends and forecast (Wbn, %, ‘000 people)
1Q15 2Q15 3Q15 4Q15 1Q16 2Q16F 3Q16F 4Q16F 2014 2015 2016F
Revenue 2,556 2,662 2,717 2,861 2,713 2,747 2,783 2,835 11,000 10,795 11,078
Service revenue 2,113 2,160 2,162 2,219 2,175 2,220 2,234 2,264 8,398 8,654 8,894
Wireless 1,304 1,336 1,333 1,325 1,321 1,345 1,353 1,356 5,212 5,298 5,375
Fixed-line 800 817 822 865 846 871 877 909 3,157 3,303 3,503
Handset revenue 443 502 554 642 538 527 549 571 2,602 2,141 2,184
% of revenue
Service revenue 82.7 81.2 79.6 77.6 80.2 80.8 80.3 79.9 76.3 80.2 80.3
Handset revenue 17.3 18.8 20.4 22.4 19.8 19.2 19.7 20.1 23.7 19.8 19.7
Operating profit 155 192 172 113 171 205 175 134 576 632 685
OP margin (%) 6.1 7.2 6.3 4.0 6.3 7.5 6.3 4.7 5.2 5.9 6.2
Net profit 82 116 114 40 110 130 108 72 228 351 420
Net margin (%) 3.2 4.4 4.2 1.4 4.1 4.7 3.9 2.6 2.1 3.3 3.8
YoY
Revenue -8.1 -4.1 -1.6 6.6 6.1 3.2 2.4 -0.9 -3.9 -1.9 2.6
Service revenue 4.6 4.4 3.2 0.3 2.9 2.8 3.3 2.0 7.2 3.1 2.8
Wireless 4.4 4.8 2.8 -4.7 1.3 0.7 1.5 2.3 9.3 1.7 1.5
Fixed-line 4.0 4.3 4.3 5.8 5.8 6.6 6.7 5.1 3.1 4.6 6.0
Handset revenue -41.7 -28.8 -16.9 36.4 21.3 5.0 -1.0 -11.1 -27.7 -17.7 2.0
Operating profit 36.7 96.3 -1.3 -40.7 10.2 6.5 1.9 18.6 6.4 9.7 8.3
Net profit 207.3 245.7 38.4 -53.6 33.6 12.2 -5.3 83.0 -18.4 54.3 19.5
Key indicators
Wireless subscribers 11,566 11,690 11,794 11,949 12,104 12,243 12,330 12,416 11,381 11,949 12,416
LTE 8,906 9,216 9,512 9,879 10,190 10,371 10,618 10,864 8,570 9,879 10,864
Fixed-line subscribers 10,035 10,220 10,671 10,809 10,913 11,054 11,181 11,308 9,882 10,809 11,308
Media 2,040 2,123 2,199 2,280 2,355 2,430 2,502 2,575 1,949 2,280 2,575
Notes: All figures are based on consolidated K-IFRS; Handset revenue recognized on a net basis from 4Q14; Based number of wireless subscribers on MSIP’s official data
Source: Company data, Mirae Asset Daewoo Research estimates
Figure 50. Downside support to shares expected in light of
dividends at the mid-2% level (dividend payout ratio of 30%)
Figure 51. Supplementing growth: Expansion in IoT business
expected
Source: Company data, Mirae Asset Daewoo Research Source: Company data, Mirae Asset Daewoo Research
0
1
2
3
0
100
200
300
400
2014 2015 2016F
(%)(W)
DPS (L)
Dividend yield (R)
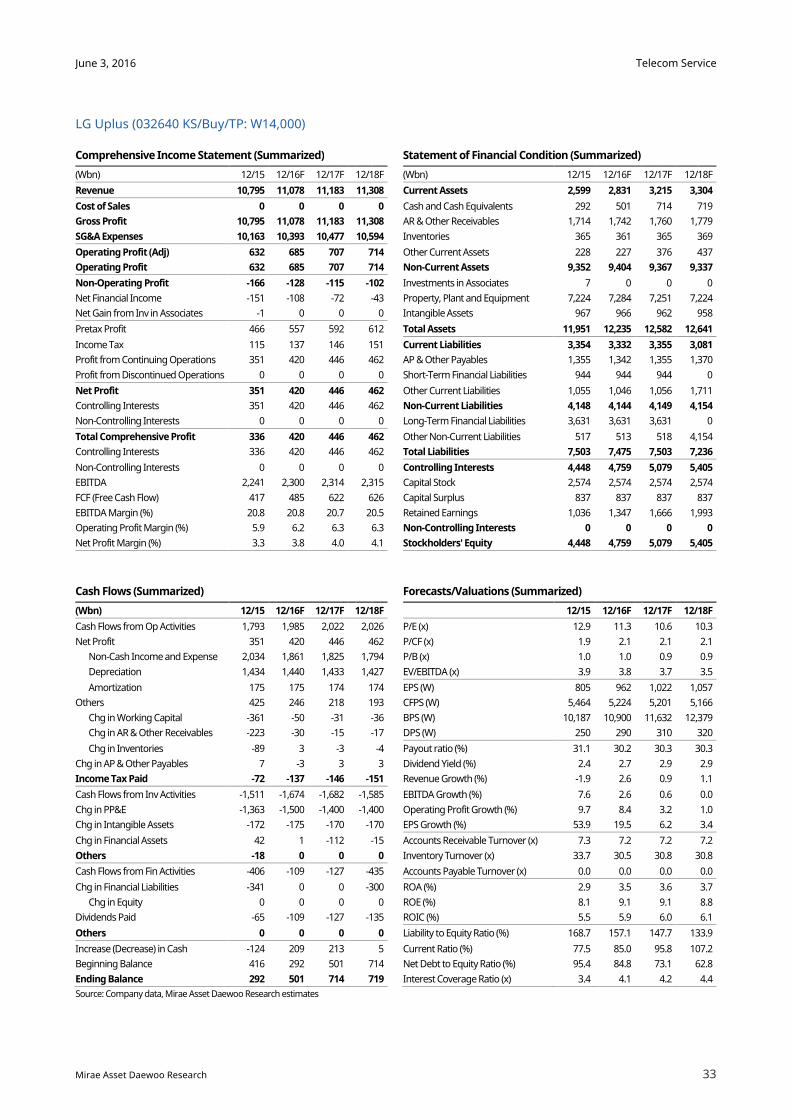
Telecom Service
33
June 3, 2016
Mirae Asset Daewoo Research
LG Uplus (032640 KS/Buy/TP: W14,000)
Comprehensive Income Statement (Summarized) Statement of Financial Condition (Summarized)
(Wbn) 12/15 12/16F 12/17F 12/18F (Wbn) 12/15 12/16F 12/17F 12/18F
Revenue 10,795 11,078 11,183 11,308 Current Assets 2,599 2,831 3,215 3,304
Cost of Sales 0 0 0 0 Cash and Cash Equivalents 292 501 714 719
Gross Profit 10,795 11,078 11,183 11,308 AR & Other Receivables 1,714 1,742 1,760 1,779
SG&A Expenses 10,163 10,393 10,477 10,594 Inventories 365 361 365 369
Operating Profit (Adj) 632 685 707 714 Other Current Assets 228 227 376 437
Operating Profit 632 685 707 714 Non-Current Assets 9,352 9,404 9,367 9,337
Non-Operating Profit -166 -128 -115 -102 Investments in Associates 7 0 0 0
Net Financial Income -151 -108 -72 -43 Property, Plant and Equipment 7,224 7,284 7,251 7,224
Net Gain from Inv in Associates -1 0 0 0 Intangible Assets 967 966 962 958
Pretax Profit 466 557 592 612 Total Assets 11,951 12,235 12,582 12,641
Income Tax 115 137 146 151 Current Liabilities 3,354 3,332 3,355 3,081
Profit from Continuing Operations 351 420 446 462 AP & Other Payables 1,355 1,342 1,355 1,370
Profit from Discontinued Operations 0 0 0 0 Short-Term Financial Liabilities 944 944 944 0
Net Profit 351 420 446 462 Other Current Liabilities 1,055 1,046 1,056 1,711
Controlling Interests 351 420 446 462 Non-Current Liabilities 4,148 4,144 4,149 4,154
Non-Controlling Interests 0 0 0 0 Long-Term Financial Liabilities 3,631 3,631 3,631 0
Total Comprehensive Profit 336 420 446 462 Other Non-Current Liabilities 517 513 518 4,154
Controlling Interests 336 420 446 462 Total Liabilities 7,503 7,475 7,503 7,236
Non-Controlling Interests 0 0 0 0 Controlling Interests 4,448 4,759 5,079 5,405
EBITDA 2,241 2,300 2,314 2,315 Capital Stock 2,574 2,574 2,574 2,574
FCF (Free Cash Flow) 417 485 622 626 Capital Surplus 837 837 837 837
EBITDA Margin (%) 20.8 20.8 20.7 20.5 Retained Earnings 1,036 1,347 1,666 1,993
Operating Profit Margin (%) 5.9 6.2 6.3 6.3 Non-Controlling Interests 0 0 0 0
Net Profit Margin (%) 3.3 3.8 4.0 4.1 Stockholders' Equity 4,448 4,759 5,079 5,405
Cash Flows (Summarized) Forecasts/Valuations (Summarized)
(Wbn) 12/15 12/16F 12/17F 12/18F 12/15 12/16F 12/17F 12/18F
Cash Flows from Op Activities 1,793 1,985 2,022 2,026 P/E (x) 12.9 11.3 10.6 10.3
Net Profit 351 420 446 462 P/CF (x) 1.9 2.1 2.1 2.1
Non-Cash Income and Expense 2,034 1,861 1,825 1,794 P/B (x) 1.0 1.0 0.9 0.9
Depreciation 1,434 1,440 1,433 1,427 EV/EBITDA (x) 3.9 3.8 3.7 3.5
Amortization 175 175 174 174 EPS (W) 805 962 1,022 1,057
Others 425 246 218 193 CFPS (W) 5,464 5,224 5,201 5,166
Chg in Working Capital -361 -50 -31 -36 BPS (W) 10,187 10,900 11,632 12,379
Chg in AR & Other Receivables -223 -30 -15 -17 DPS (W) 250 290 310 320
Chg in Inventories -89 3 -3 -4 Payout ratio (%) 31.1 30.2 30.3 30.3
Chg in AP & Other Payables 7 -3 3 3 Dividend Yield (%) 2.4 2.7 2.9 2.9
Income Tax Paid -72 -137 -146 -151 Revenue Growth (%) -1.9 2.6 0.9 1.1
Cash Flows from Inv Activities -1,511 -1,674 -1,682 -1,585 EBITDA Growth (%) 7.6 2.6 0.6 0.0
Chg in PP&E -1,363 -1,500 -1,400 -1,400 Operating Profit Growth (%) 9.7 8.4 3.2 1.0
Chg in Intangible Assets -172 -175 -170 -170 EPS Growth (%) 53.9 19.5 6.2 3.4
Chg in Financial Assets 42 1 -112 -15 Accounts Receivable Turnover (x) 7.3 7.2 7.2 7.2
Others -18 0 0 0 Inventory Turnover (x) 33.7 30.5 30.8 30.8
Cash Flows from Fin Activities -406 -109 -127 -435 Accounts Payable Turnover (x) 0.0 0.0 0.0 0.0
Chg in Financial Liabilities -341 0 0 -300 ROA (%) 2.9 3.5 3.6 3.7
Chg in Equity 0 0 0 0 ROE (%) 8.1 9.1 9.1 8.8
Dividends Paid -65 -109 -127 -135 ROIC (%) 5.5 5.9 6.0 6.1
Others 0 0 0 0 Liability to Equity Ratio (%) 168.7 157.1 147.7 133.9
Increase (Decrease) in Cash -124 209 213 5 Current Ratio (%) 77.5 85.0 95.8 107.2
Beginning Balance 416 292 501 714 Net Debt to Equity Ratio (%) 95.4 84.8 73.1 62.8
Ending Balance 292 501 714 719 Interest Coverage Ratio (x) 3.4 4.1 4.2 4.4
Source: Company data, Mirae Asset Daewoo Research estimates

Telecom Service
34
June 3, 2016
Mirae Asset Daewoo Research
APPENDIX 1
Important Disclosures & Disclaimers
2-Year Rating and Target Price History
Company (Code) Date Rating Target Price Company (Code) Date Rating Target Price
KT(030200) 06/03/2016 Buy 40,000 10/01/2014 Buy 380,000
05/02/2016 Buy 37,000 08/03/2014 Buy 310,000
01/31/2016 Buy 35,000 05/15/2014 Buy 290,000
11/01/2015 Trading Buy 35,000 LG Uplus(032640) 04/05/2016 Buy 14,000
08/02/2015 Buy 39,000 02/01/2016 Buy 13,000
01/20/2015 Buy 40,000 07/31/2015 Buy 15,000
10/01/2014 Buy 42,000 04/28/2015 Buy 14,000
05/15/2014 Buy 40,000 01/25/2015 Buy 16,000
SK Telecom(017670) 04/29/2016 Buy 280,000 10/01/2014 Buy 15,000
02/02/2016 Buy 300,000 07/31/2014 Buy 11,500
07/31/2015 Buy 350,000 05/15/2014 Buy 13,000
05/06/2015 Buy 360,000
Equity Ratings Distribution
BuyBuyBuyBuy Trading BuyTrading BuyTrading BuyTrading Buy HoldHoldHoldHold SellSellSellSell
68.29% 17.56% 14.15% 0.00%
* Based on recommendations in the last 12-months (as of March 31, 2016)
Disclosures
As of the publication date, Mirae Asset Daewoo Co., Ltd. and/or its affiliates do not have any special interest with the subject company and do not own 1%
or more of the subject company's shares outstanding.
Analyst Certification
The research analysts who prepared this report (the “Analysts”) are registered with the Korea Financial Investment Association and are subject to
Korean securities regulations. They are neither registered as research analysts in any other jurisdiction nor subject to the laws and regulations
thereof. Opinions expressed in this publication about the subject securities and companies accurately reflect the personal views of the Analysts
primarily responsible for this report. Mirae Asset Daewoo Co., Ltd. (“Mirae Asset Daewoo”) policy prohibits its Analysts and members of their
households from owning securities of any company in the Analyst’s area of coverage, and the Analysts do not serve as an officer, director or
advisory board member of the subject companies. Except as otherwise specified herein, the Analysts have not received any compensation or any
other benefits from the subject companies in the past 12 months and have not been promised the same in connection with this report. No part of
the compensation of the Analysts was, is, or will be directly or indirectly related to the specific recommendations or views contained in this report
but, like all employees of Mirae Asset Daewoo, the Analysts receive compensation that is impacted by overall firm profitability, which includes
revenues from, among other business units, the institutional equities, investment banking, proprietary trading and private client division. At the
time of publication of this report, the Analysts do not know or have reason to know of any actual, material conflict of interest of the Analyst or
Mirae Asset Daewoo except as otherwise stated herein.
Stock Ratings Industry Ratings
Buy : Relative performance of 20% or greater Overweight : Fundamentals are favorable or improving
Trading Buy : Relative performance of 10% or greater, but with volatility Neutral : Fundamentals are steady without any material changes
Hold : Relative performance of -10% and 10% Underweight : Fundamentals are unfavorable or worsening
Sell : Relative performance of -10%
Ratings and Target Price History (Share price (─), Target price (▬), Not covered (■), Buy (▲), Trading Buy (■), Hold (●), Sell (◆))
* Our investment rating is a guide to the relative return of the stock versus the market over the next 12 months.
* Although it is not part of the official ratings at Mirae Asset Daewoo Co., Ltd., we may call a trading opportunity in case there is a technical or short-term
material development.
* The target price was determined by the research analyst through valuation methods discussed in this report, in part based on the analyst’s estimate of
future earnings.
* The achievement of the target price may be impeded by risks related to the subject securities and companies, as well as general market and economic
conditions.
0
10,000
20,000
30,000
40,000
50,000
Jun 14 Jun 15 Jun 16
(W)KT
0
100,000
200,000
300,000
400,000
Jun 14 Jun 15 Jun 16
(W) SK Telecom
0
5,000
10,000
15,000
20,000
Jun 14 Jun 15 Jun 16
(W) LG Uplus
Telecom Service
35
June 3, 2016
Mirae Asset Daewoo Research
Disclaimers
This report is published by Mirae Asset Daewoo, a broker-dealer registered in the Republic of Korea and a member of the Korea Exchange.
Information and opinions contained herein have been compiled from sources believed to be reliable and in good faith, but such information has
not been independently verified and Mirae Asset Daewoo makes no guarantee, representation or warranty, express or implied, as to the fairness,
accuracy, completeness or correctness of the information and opinions contained herein or of any translation into English from the Korean
language. If this report is an English translation of a report prepared in the Korean language, the original Korean language report may have been
made available to investors in advance of this report. Mirae Asset Daewoo, its affiliates and their directors, officers, employees and agents do not
accept any liability for any loss arising from the use hereof. This report is for general information purposes only and it is not and should not be
construed as an offer or a solicitation of an offer to effect transactions in any securities or other financial instruments. The intended recipients of
this report are sophisticated institutional investors who have substantial knowledge of the local business environment, its common practices, laws
and accounting principles and no person whose receipt or use of this report would violate any laws and regulations or subject Mirae Asset
Daewoo and its affiliates to registration or licensing requirements in any jurisdiction should receive or make any use hereof. Information and
opinions contained herein are subject to change without notice and no part of this document may be copied or reproduced in any manner or form
or redistributed or published, in whole or in part, without the prior written consent of Mirae Asset Daewoo. Mirae Asset Daewoo, its affiliates and
their directors, officers, employees and agents may have long or short positions in any of the subject securities at any time and may make a
purchase or sale, or offer to make a purchase or sale, of any such securities or other financial instruments from time to time in the open market or
otherwise, in each case either as principals or agents. Mirae Asset Daewoo and its affiliates may have had, or may be expecting to enter into,
business relationships with the subject companies to provide investment banking, market-making or other financial services as are permitted
under applicable laws and regulations. The price and value of the investments referred to in this report and the income from them may go down
as well as up, and investors may realize losses on any investments. Past performance is not a guide to future performance. Future returns are not
guaranteed, and a loss of original capital may occur.
Distribution
United Kingdom: This report is being distributed by Daewoo Securities (Europe) Ltd. in the United Kingdom only to (i) investment professionals
falling within Article 19(5) of the Financial Services and Markets Act 2000 (Financial Promotion) Order 2005 (the “Order”), and (ii) high net worth
companies and other persons to whom it may lawfully be communicated, falling within Article 49(2)(A) to (E) of the Order (all such persons
together being referred to as “Relevant Persons”). This report is directed only at Relevant Persons. Any person who is not a Relevant Person should
not act or rely on this report or any of its contents.
United States: This report is distributed in the U.S. by Daewoo Securities (America) Inc., a member of FINRA/SIPC, and is only intended for major
institutional investors as defined in Rule 15a-6(b)(4) under the U.S. Securities Exchange Act of 1934. All U.S. persons that receive this document by
their acceptance thereof represent and warrant that they are a major institutional investor and have not received this report under any express or
implied understanding that they will direct commission income to Mirae Asset Daewoo or its affiliates. Any U.S. recipient of this document wishing
to effect a transaction in any securities discussed herein should contact and place orders with Daewoo Securities (America) Inc., which accepts
responsibility for the contents of this report in the U.S. The securities described in this report may not have been registered under the U.S.
Securities Act of 1933, as amended, and, in such case, may not be offered or sold in the U.S. or to U.S. persons absent registration or an applicable
exemption from the registration requirements.
Hong Kong: This document has been approved for distribution in Hong Kong by Daewoo Securities (Hong Kong) Ltd., which is regulated by the
Hong Kong Securities and Futures Commission. The contents of this report have not been reviewed by any regulatory authority in Hong Kong. This
report is for distribution only to professional investors within the meaning of Part I of Schedule 1 to the Securities and Futures Ordinance of Hong
Kong (Cap. 571, Laws of Hong Kong) and any rules made thereunder and may not be redistributed in whole or in part in Hong Kong to any person.
All Other Jurisdictions: Customers in all other countries who wish to effect a transaction in any securities referenced in this report should contact
Mirae Asset Daewoo or its affiliates only if distribution to or use by such customer of this report would not violate applicable laws and regulations
and not subject Mirae Asset Daewoo and its affiliates to any registration or licensing requirement within such jurisdiction.
Mirae Asset Daewoo International Network
Mirae Asset Daewoo Co., Ltd. (Seoul) Daewoo Securities (Hong Kong) Ltd. Daewoo Securities (America) Inc.
Head Office
34-3 Yeouido-dong, Yeongdeungpo-gu
Seoul 150-716
Korea
Two International Finance Centre
Suites 2005-2012
8 Finance Street, Central
Hong Kong, China
320 Park Avenue
31st Floor
New York, NY 10022
United States
Tel: 82-2-768-3026 Tel: 85-2-2845-6332 Tel: 1-212-407-1000
Daewoo Securities (Europe) Ltd. Daewoo Securities (Singapore) Pte., Ltd. Tokyo Representative Office
41st Floor, Tower 42
25 Old Broad St.
London EC2N 1HQ
United Kingdom
Six Battery Road #11-01
Singapore, 049909
7th Floor, Yusen Building
2-3-2 Marunouchi, Chiyoda-ku
Tokyo 100-0005
Japan
Tel: 44-20-7982-8000 Tel: 65-6671-9845 Tel: 81-3- 3211-5511
Beijing Representative Office Shanghai Representative Office Ho Chi Minh Representative Office
2401A, 24th Floor, East Tower, Twin Towers
B-12 Jianguomenwai Avenue
Chaoyang District, Beijing 100022
China
Room 38T31, 38F SWFC
100 Century Avenue
Pudong New Area, Shanghai 200120
China
Suite 2103, Saigon Trade Center
37 Ton Duc Thang St,
Dist. 1, Ho Chi Minh City,
Vietnam
Tel: 86-10-6567-9299 Tel: 86-21-5013-6392 Tel: 84-8-3910-6000
Daewoo Investment Advisory (Beijing) Co., Ltd. Daewoo Securities (Mongolia) LLC PT. Daewoo Securities Indonesia
2401B, 24th Floor, East Tower, Twin Towers
B-12 Jianguomenwai Avenue,
Chaoyang District, Beijing 100022
China
#406, Blue Sky Tower, Peace Avenue 17
1 Khoroo, Sukhbaatar District
Ulaanbaatar 14240
Mongolia
Equity Tower Building Lt.50
Sudirman Central Business District Jl.
Jendral Sudirman Kav. 52-53, Jakarta Selatan
Indonesia 12190
Tel: 86-10-6567-9699 Tel: 976-7011-0807 Tel: 62-21-515-1140