2nd day – 16 april 2016: seea agriculture forestry and ... in inventories = - 60.08 exports =...
TRANSCRIPT

2nd Day –16 April 2016: SEEA Agriculture Forestry and Fisheries Accounting Tools: Exercises onCombined Presentation, Physical Flow Accounts and Asset Accounts
This is a hands-on exercise section for course participant, divided into two parts:
Part I. Explanation and exercises on the SEEA Agriculture Reference CombinedPresentation, its scope and the economic and environmental variablesincluded in it. The first part of the presentation describes in details theReference Combined Presentation compilation method, using as exampleexisting national data from FAOSTAT and exploring availability of moredetailed national data from participants. Analytical uses and possibleextensions are explored.
Part II. Explanation and exercises on the two main SEEA AgricultureAccounting tools: the Physical Supply and Use Table and the Asset AccountsTable. Definitions and examples are provided to guide participants in thecompilation of these fundamental tables at national level. Availability of moredetailed national data is explored, and analytical uses and possibleextensions are discussed.
1

FAO Statistics Division
SEEA Agriculture Forestry and Fisheries Accounting Tools: Exercises onReference Combined Presentation,Physical Flow and Asset Accounts
15-17 April Kampala, Uganda
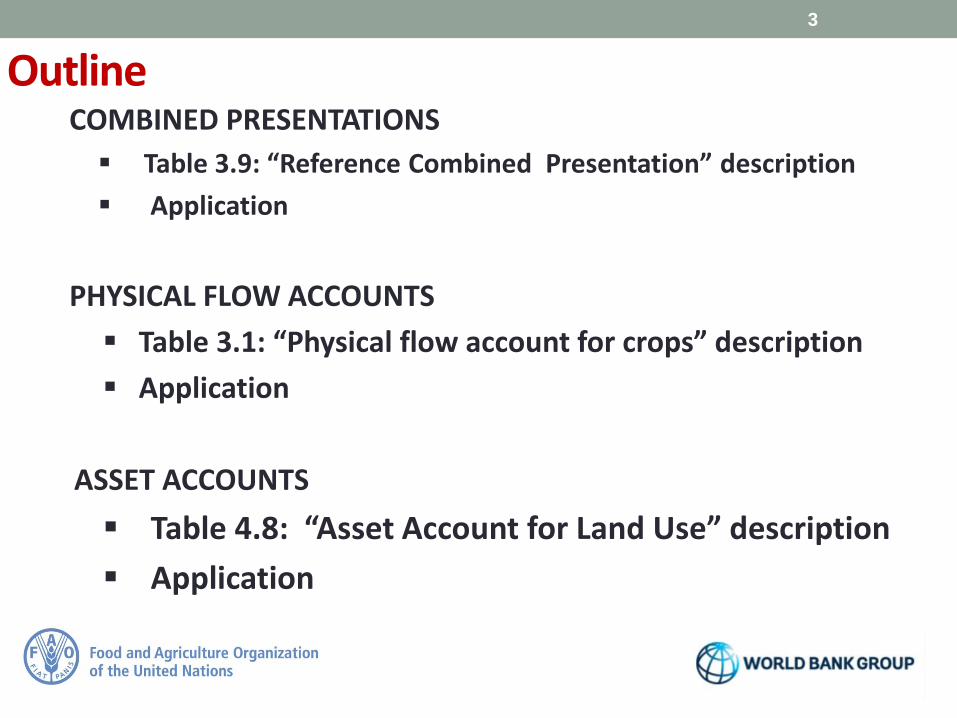
OutlineCOMBINED PRESENTATIONS
Table 3.9: “Reference Combined Presentation” description
Application
PHYSICAL FLOW ACCOUNTS
Table 3.1: “Physical flow account for crops” description
Application
ASSET ACCOUNTS
Table 4.8: “Asset Account for Land Use” description
Application
3

4
Combined Presentations

Basic statistics and data
5
COMBINED PRESENTATIONs
Base accounts
Combined presentations
Indicators and indicator sets
(agri-environmental / SDGs / thematic etc)

Not strictly accounts in that the information they contain does notneed to be in the same measurement unit
SEEA Agriculture includes 4 thematic combined presentations:
Activity and product specific inputs
Food product consumption and waste
Use of environmental assets
Cross industry and activity perspectives
…and:
Reference Combined Presentation
6
COMBINED PRESENTATIONs

Table 3.9 “Reference Combined Presentation” description
The SEEA-Agriculture Reference Combined Presentation is a cross cuttingperspective on a critical set of environmental and economic variables,based on the following structure: Land, Assets, Inputs, Outputs, TradeFlows, Population, Food availability and Environmental Impacts.
7
Land Asset Inputs OutputsTrade
Flows
Popul
ation
Food
Availa
bility
Environ
mental
Impacts

8
“Reference Combined Presentation”
Land Area
(000 ha)
Harvested Area
(000 ha)
Biomass stock
(million tonnes)
Number of
Heads (Stock)
(000 heads)
Producing
Animals (000
heads)
Assets
Water
WithdrawalEnergy Use Pesticides
(m3) (terajoules) N (000 tonnes) P205 (000 tonnes) K20 (000 tonnes) N (000 tonnes) P205 (000 tonnes) K20 (000 tonnes) (000 tonnes)
Synthentic Fertilizer
Inputs
Organic Fertilizer

“Reference Combined Presentation”
9
Gross Production
ValueValue added Total GDP
(000 tonnes) (m3)USD million
dollars (current)
USD million
dollars (current)
USD million
dollars (current)
Outputs
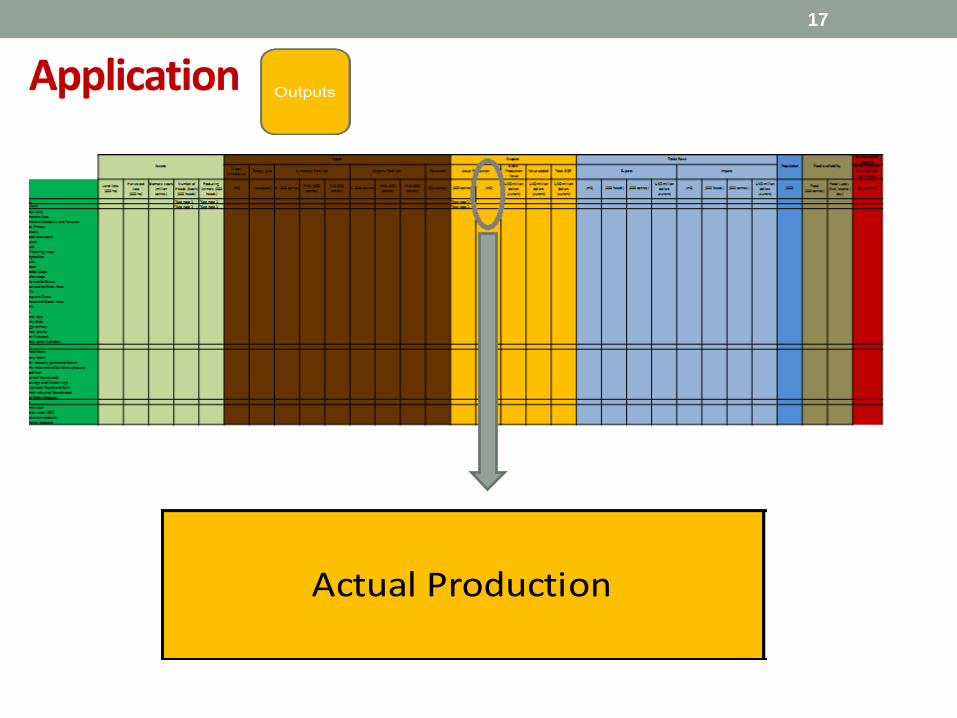
Actual Production
(m3) (000 heads) (000 tonnes)USD million
dollars (current)(m3) (000 heads) (000 tonnes)
USD million
dollars (current)
Trade flows
Exports Imports
Environmental
Impacts
GHG Emission (CO2
eq) from Agriculture
(000)Food (000
tonnes)
Food supply
(Kcal/capita /
day)
(gigagrams)
Food availabilityPopulation

10
Application Land Asset
Land Area
(000 ha)
TOTAL
Agriculture
Arable Land
Permanent Crop
Permanent Meadows and Pastures

http://faostat3.fao.org/download/R/RL/E
11
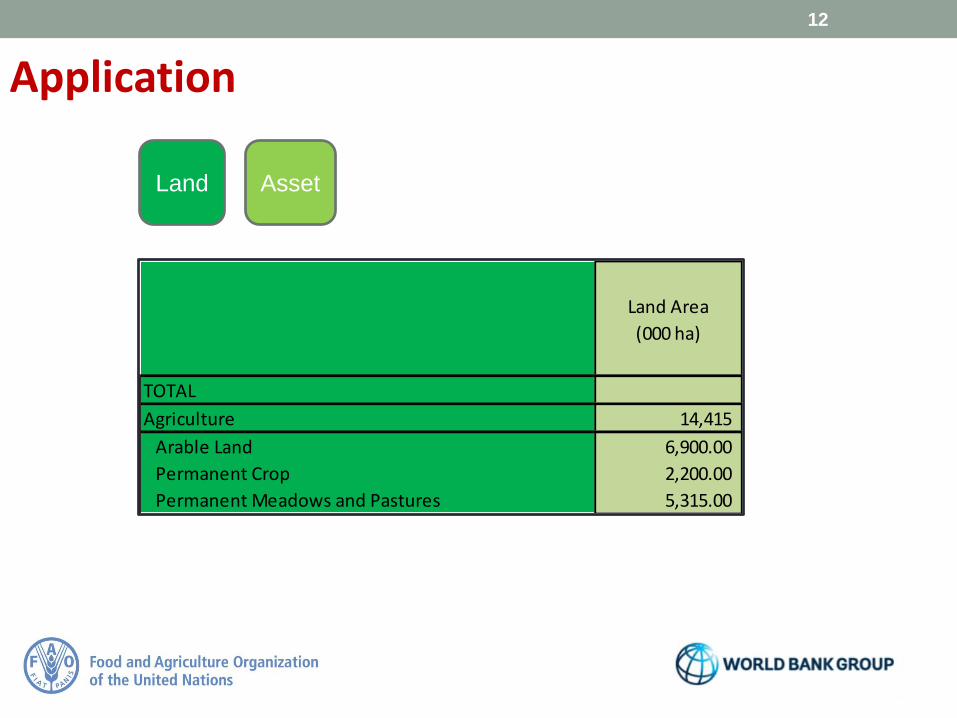
ApplicationLand area for Agriculture (LA) =
Arable land +Permanent Crops + Permanent meadows and pasture
Uganda, 2013 (000 ha):Arable land = 6 900 Permanent crops = 2 200Permanent meadows and pastures = 5 315
Therefore: LA = 6 900 + 2 200 + 5 315 = 14 415
12
Application
Land Area
(000 ha)
TOTAL
Agriculture 14,415
Arable Land 6,900.00
Permanent Crop 2,200.00
Permanent Meadows and Pastures 5,315.00
Land Asset

Application
13
Arable land: land under temporary agricultural crops (multiple-cropped areas arecounted only once), temporary meadows for mowing or pasture, land undermarket and kitchen gardens and land temporarily fallow (less than five years). Theabandoned land resulting from shifting cultivation is not included in this category.Arable land is not meant to indicate all land that is potentially cultivable
Permanent crops: land cultivated with long-term crops which do not have to bereplanted for several years (such as cocoa and coffee); land under trees and shrubsproducing flowers, such as roses and jasmine; and nurseries (except those forforest trees, which should be classified under "forest“)
Permanent meadows and pastures: land used permanently (five years or more) togrow herbaceous forage crops, either cultivated or growing wild (wild prairie orgrazing land)
Land Area
(000 ha)
14
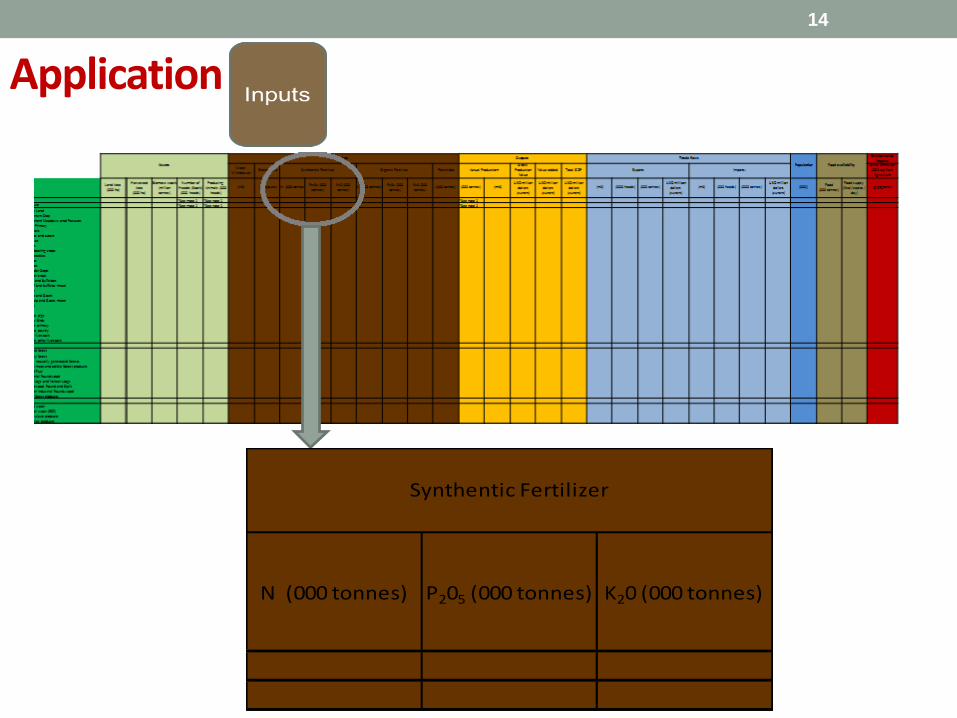
Application
N (000 tonnes) P205 (000 tonnes) K20 (000 tonnes)
Synthentic Fertilizer

ApplicationTotal Syntetic Fertilizers used in agriculture (TSF) =
Nitrogen fertilizers (N total nutrient)+ Phosphate Fertilizers (P205 totalnutrients)+ Potash Fertilizers (K20 total nutrients)
Uganda, 2013 (tonnes):
Nitrogen fertilizers (N total nutrient) = 9 040 +
Phosphate Fertilizers (P205 total nutrients) = 3 794 +
Potash Fertilizers (K20 total nutrients = 2 690
TFS = 15 524
15
http://faostat3.fao.org/download/R/RF/E

16
Assets
Land Area
(000 ha)
N (tonnes) P205 ( tonnes) K20 (tonnes)
TOTAL
Agriculture 14,415 9,040.00 3,794.00 2,690.00
Synthentic Fertilizer
Application
Land Asset
17
Actual Production
18
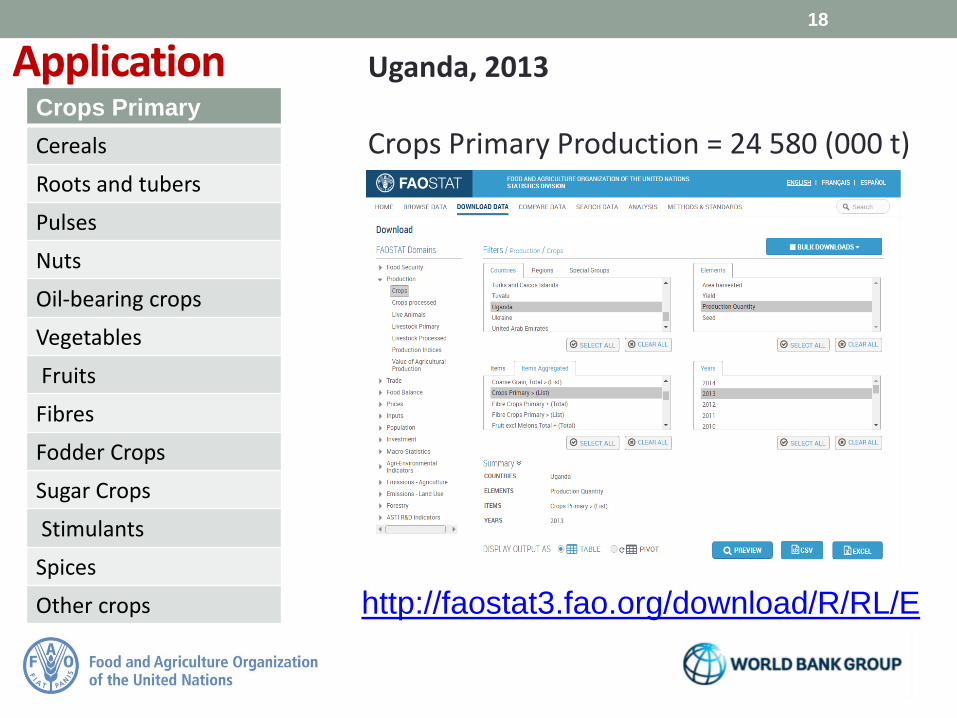
ApplicationCrops Primary
Cereals
Roots and tubers
Pulses
Nuts
Oil-bearing crops
Vegetables
Fruits
Fibres
Fodder Crops
Sugar Crops
Stimulants
Spices
Other crops
Uganda, 2013
Crops Primary Production = 24 580 (000 t)
http://faostat3.fao.org/download/R/RL/E

19
Trade
Flows
Trade flows
Exports Imports

Uganda, 2013
Imports Crops = 791 (000 t)
Value Crops Imports=
392 823 (000 US$)
Exports Crops = 470 (000 t)
Value Crops Exports=
839 256 (000 US$)
20
http://faostat3.fao.org/download/R/RF/E
21
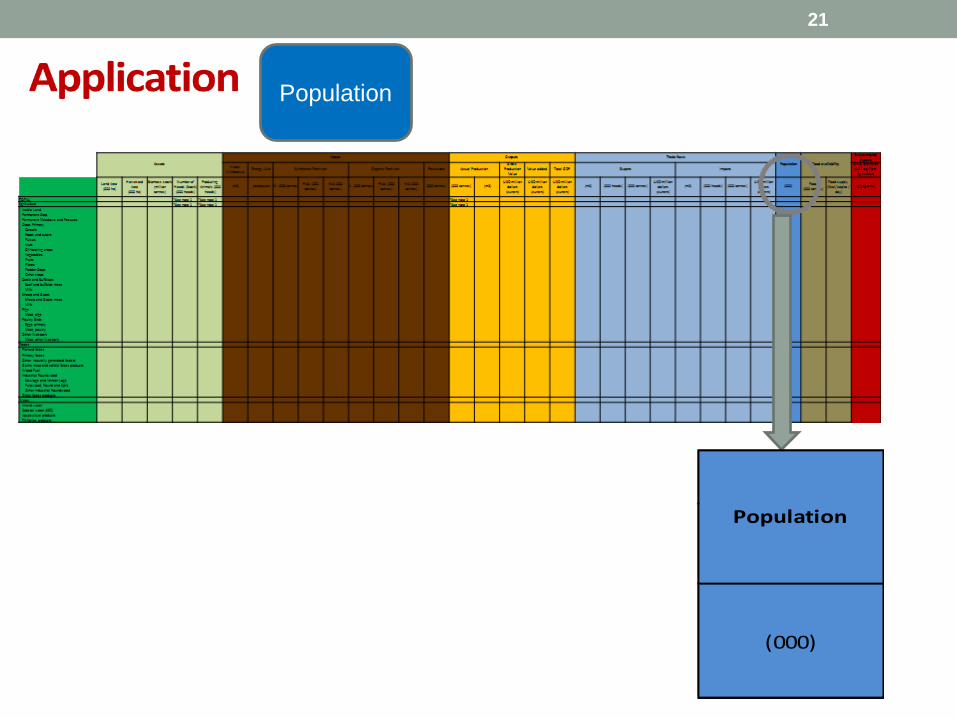
(000)
Population
Population

22
http://faostat3.fao.org/download/O/OA/E
Uganda, 2013
Population = 37 579 (000 people)
Urban = 5 801 (000 people)Rural = 31 778 (000 people)
0
5000
10000
15000
20000
25000
30000
35000
Uganda Population, 2013
UrbanRural
MU = 000 people
23
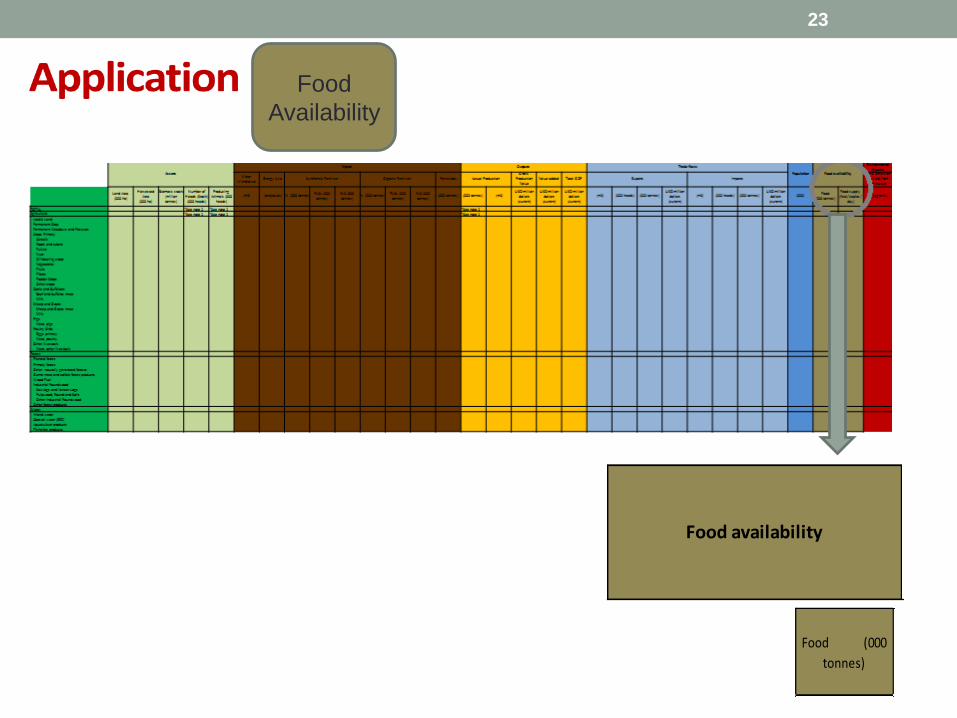
Food (000
tonnes)
Food availability
Food
Availability
24
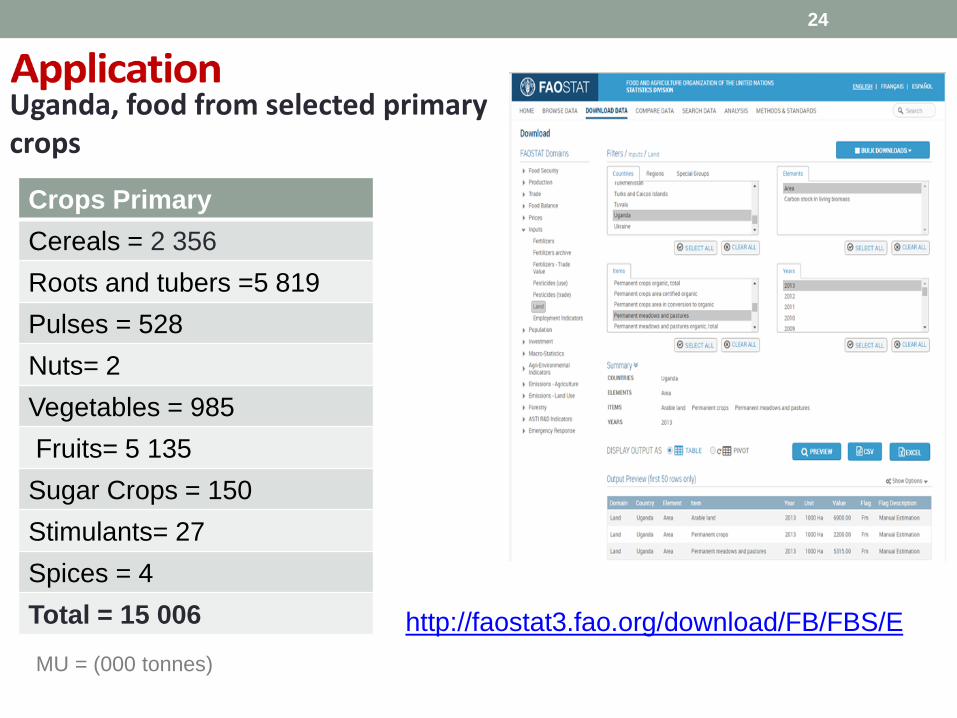
Uganda, food from selected primarycrops
Crops Primary
Cereals = 2 356
Roots and tubers =5 819
Pulses = 528
Nuts= 2
Vegetables = 985
Fruits= 5 135
Sugar Crops = 150
Stimulants= 27
Spices = 4
Total = 15 006
MU = (000 tonnes)
http://faostat3.fao.org/download/FB/FBS/E
25
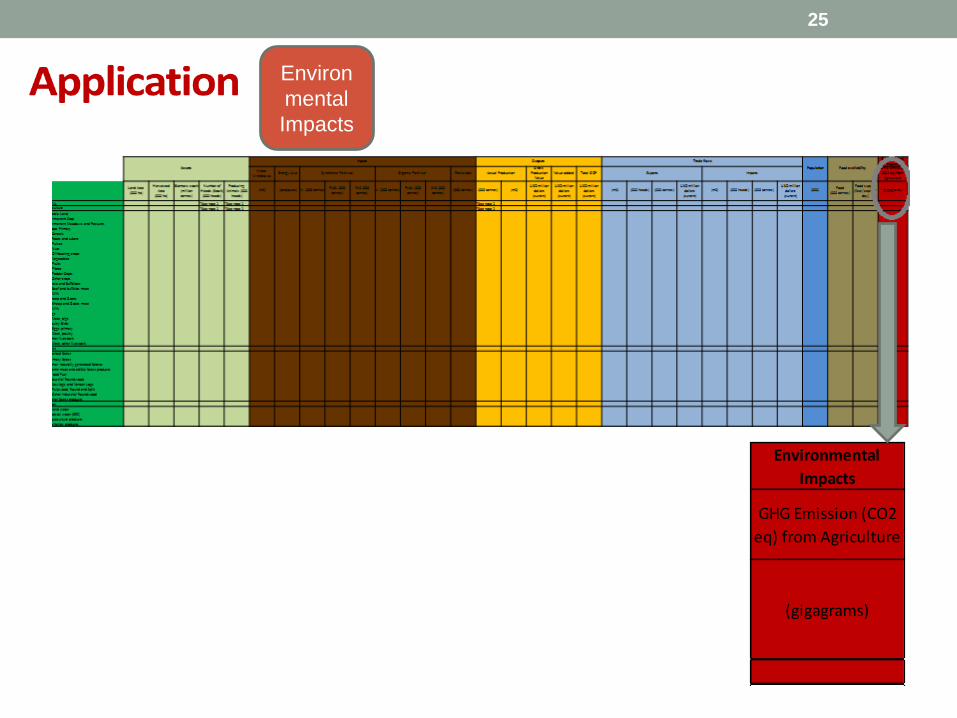
Environmental
Impacts
GHG Emission (CO2
eq) from Agriculture
(gigagrams)
Environ
mental
Impacts
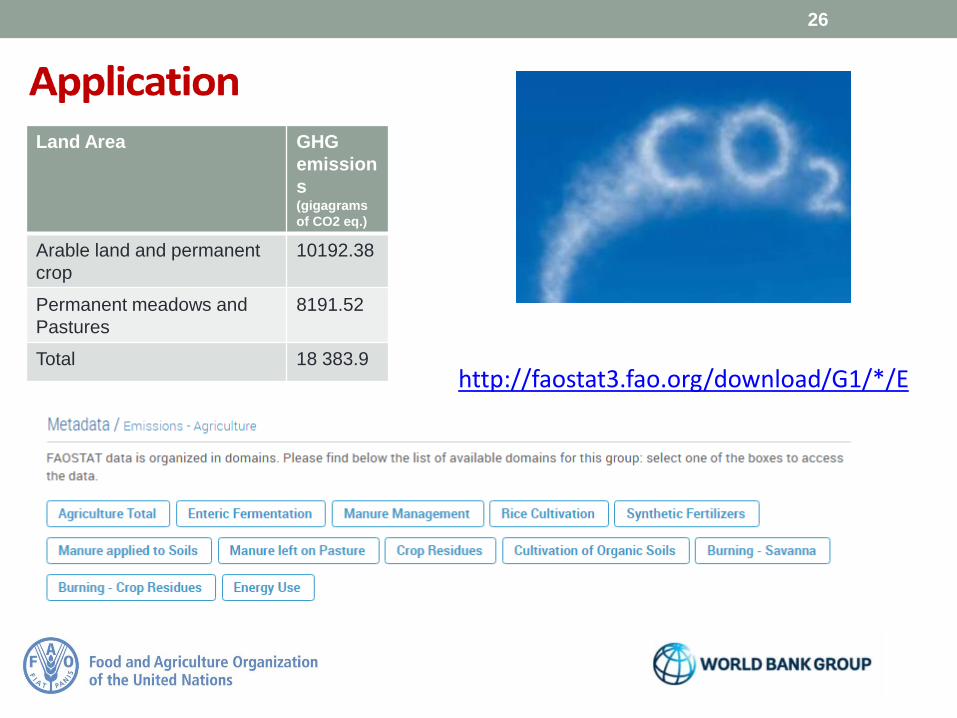
Land Area GHG
emission
s (gigagrams
of CO2 eq.)
Arable land and permanent
crop
10192.38
Permanent meadows and
Pastures
8191.52
Total 18 383.9
26
MU = Gigagrams
http://faostat3.fao.org/download/G1/*/E

27
Key environmental and economic information are available! Information can be used to derive indicator:
Agricultural GHG emissions/ Crop Production Agricultural GHG emissions/ Rural Population Agricultural GHG emissions/ Food (Primary crops)
QAQC with national and subnational data from the country Information to inform policy decision making on economic and
environmental issues
…..And then?
Background material/notes
The Reference Combined Presentation includes FAOSTAT
available and relevant information for:
Agriculture
Forestry
Fisheries
Data is available at: http://faostat3.fao.org/home/E
The Reference Combined Presentation refers to a Tier 1
approach
28

29
Physical Flow Accounts
Physical flow accounts
Record the flows of materialsand energy from theenvironment, within theeconomy, and back to theenvironment.
For example: the flows ofwater from the environmentto the economy, the use ofwater in the economy, and thepolluted or treated water backto the environment.
30
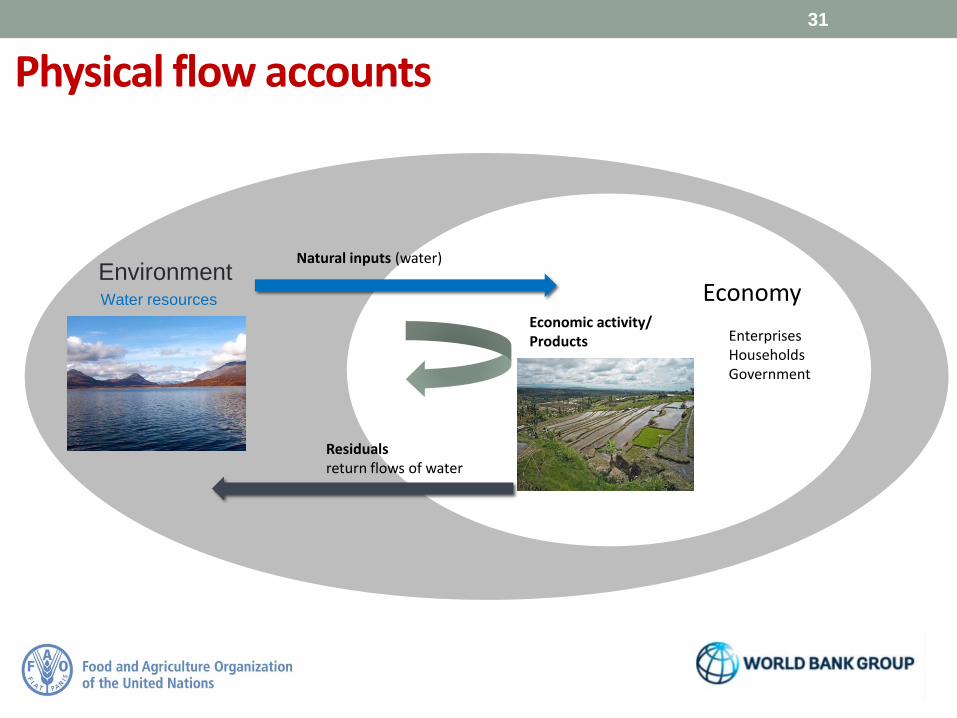
Physical flow accounts
Natural inputs (water)
Residualsreturn flows of water
EconomyEconomic activity/Products Enterprises
HouseholdsGovernment
Water resources
31
Environment
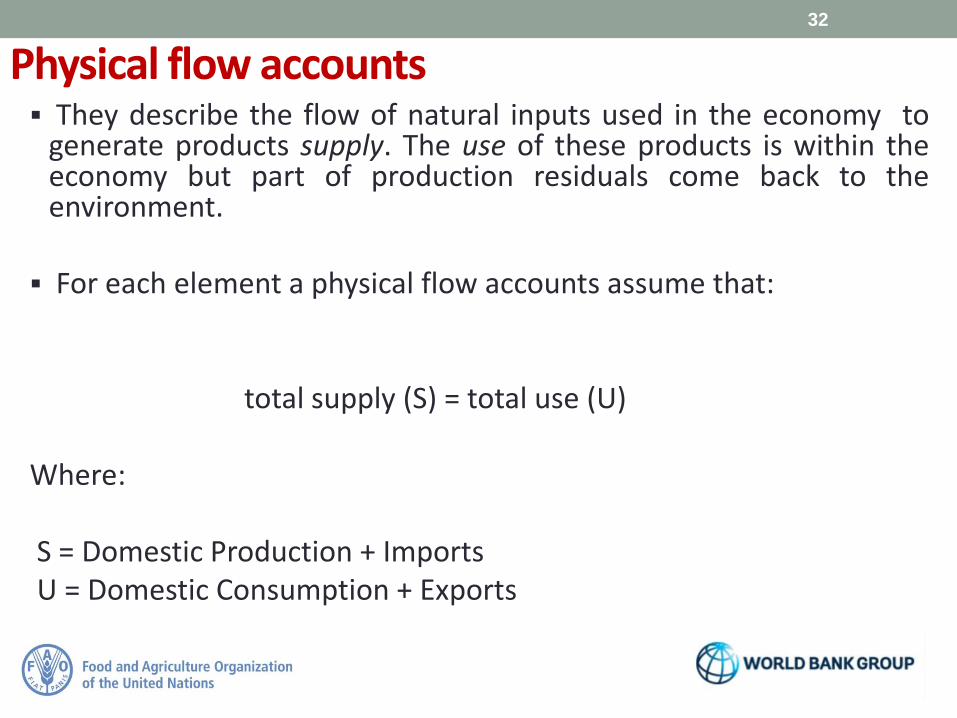
Physical flow accounts They describe the flow of natural inputs used in the economy to
generate products supply. The use of these products is within theeconomy but part of production residuals come back to theenvironment.
For each element a physical flow accounts assume that:
total supply (S) = total use (U)
Where:
S = Domestic Production + ImportsU = Domestic Consumption + Exports
32

Physical flow accounts
33
Data Domain Physical flow accounts
Agricultural products and related environmental assets
Physical flow account for crops Physical flow account for livestock products
Forestry products and related environmental assets
Physical flow account for timber products
Fisheries products and related environmental assets
Physical flow account for fish and aquatic products
Water resources Physical flow account for water abstraction Physical flow account for water distribution and use
Energy Physical flow account for energy use
Greenhouse gas emissions Physical flow account for greenhouse gas emissions
Fertilizers, nutrient flows and pesticides
Physical flow account for fertilizers Physical flow accounts for nitrogen and phosphorous Physical flow account for pesticides
Other economic data Monetary supply and use table for agricultural, forestry and fisheries products

Table 3.1 : “Physical flow account for crops” description
34
SUPPLY USE
Product Intermediate consumption HH consumption
Ag. Industry Manu. IndustryAgricul. Ind.
(Feed)
Agricul. Ind.
(Seed)
Generation
of energy
product
Food
Processing
Non-food
processingFood
Of which
food
waste
Other
uses
Post-
harvest
losses
Other
changes in
inventorie
s
Maize 376 376 1 377 293 1 121 9 -60.08 13.08 377
Maize (processed) N.A. 132 132 23 155 112 9 11 13.08 9.92 155
OUTPUT Changes in inventories
Export Total UseTotal
Supply
TOTAL
OUTPUTImports
Not applicable
Legend
MU= tonnes of raw maize equivalent
Data Source: FAOSTAT http://faostat3.fao.org/home/E

Total Supply = Total Output* + Imports
35
Product
Ag. Industry Manu. Industry
Maize 376 376 1 377
OUTPUT
Total
Supply
TOTAL
OUTPUTImports
Therefore:
Total Supply Maize = 376 + 1 = 377
Application
MU= tonnes of rawmaize equivalent
*Total Output = Ag. Industry
36
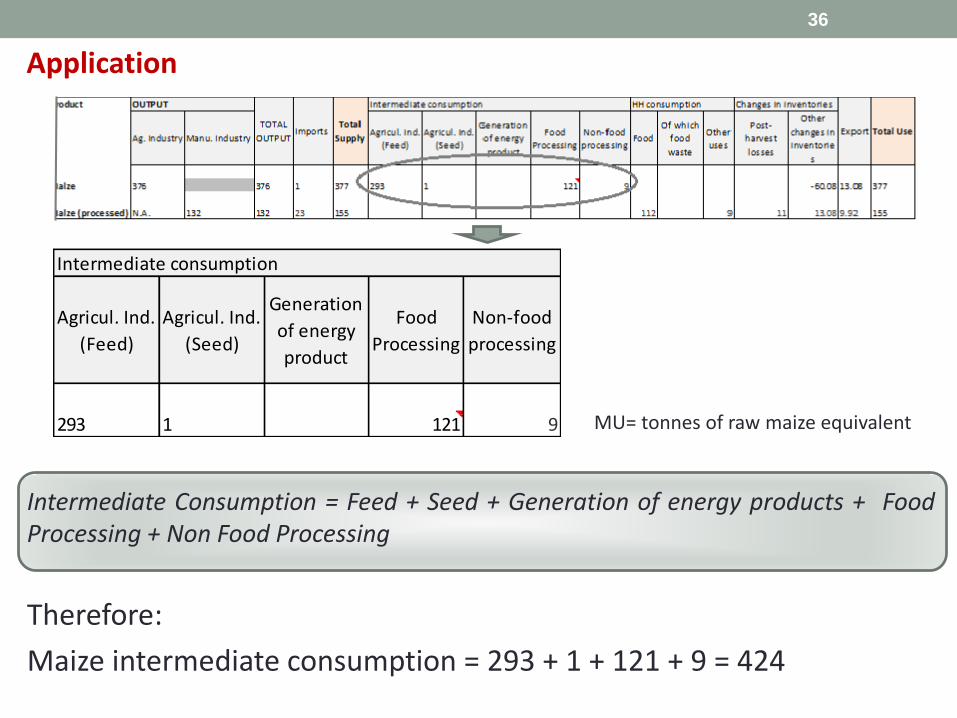
Intermediate consumption
Agricul. Ind.
(Feed)
Agricul. Ind.
(Seed)
Generation
of energy
product
Food
Processing
Non-food
processing
293 1 121 9
Intermediate Consumption = Feed + Seed + Generation of energy products + FoodProcessing + Non Food Processing
Therefore:
Maize intermediate consumption = 293 + 1 + 121 + 9 = 424
Application
MU= tonnes of raw maize equivalent
37
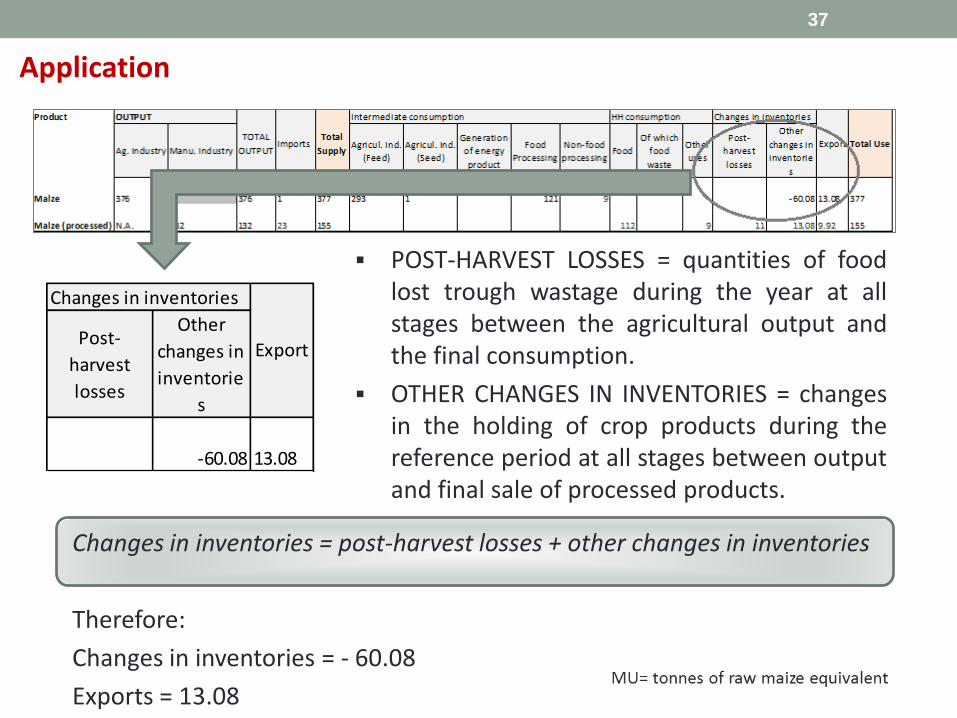
POST-HARVEST LOSSES = quantities of foodlost trough wastage during the year at allstages between the agricultural output andthe final consumption.
OTHER CHANGES IN INVENTORIES = changesin the holding of crop products during thereference period at all stages between outputand final sale of processed products.
Post-
harvest
losses
Other
changes in
inventorie
s
-60.08 13.08
Changes in inventories
Export
Changes in inventories = post-harvest losses + other changes in inventories
Therefore:
Changes in inventories = - 60.08
Exports = 13.08
Application

38
Total use = Intermediate consumption + HH consumption +Changes in inventories + Exports
Therefore:
Total use = 424 + (- 60.08) + 13.08 = 377
Total use = Total supply = 377
377
Total Use
Application

39
Product
Ag. Industry Manu. Industry
Maize (processed) 132 132 23 155
OUTPUT
Total
Supply
TOTAL
OUTPUTImports
Total supply = Total output + Imports
Where: Total output = Manu. industry
Therefore:
Total supply maize processed = 132+ 23 = 155
Application
40
HH consumption
Food
Of which
food
waste
Other
uses
112 9
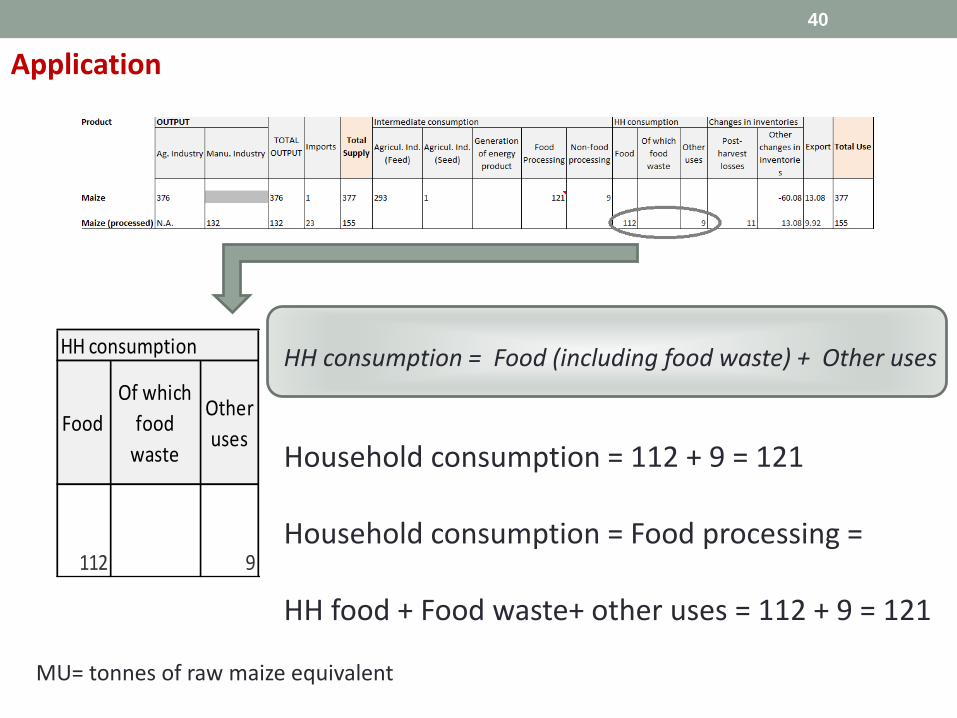
HH consumption = Food (including food waste) + Other uses
Household consumption = 112 + 9 = 121
Household consumption = Food processing =
HH food + Food waste+ other uses = 112 + 9 = 121
Application
MU= tonnes of raw maize equivalent
41
Post-
harvest
losses
Other
changes in
inventorie
s
11 13.08 9.92
Changes in inventories
Export
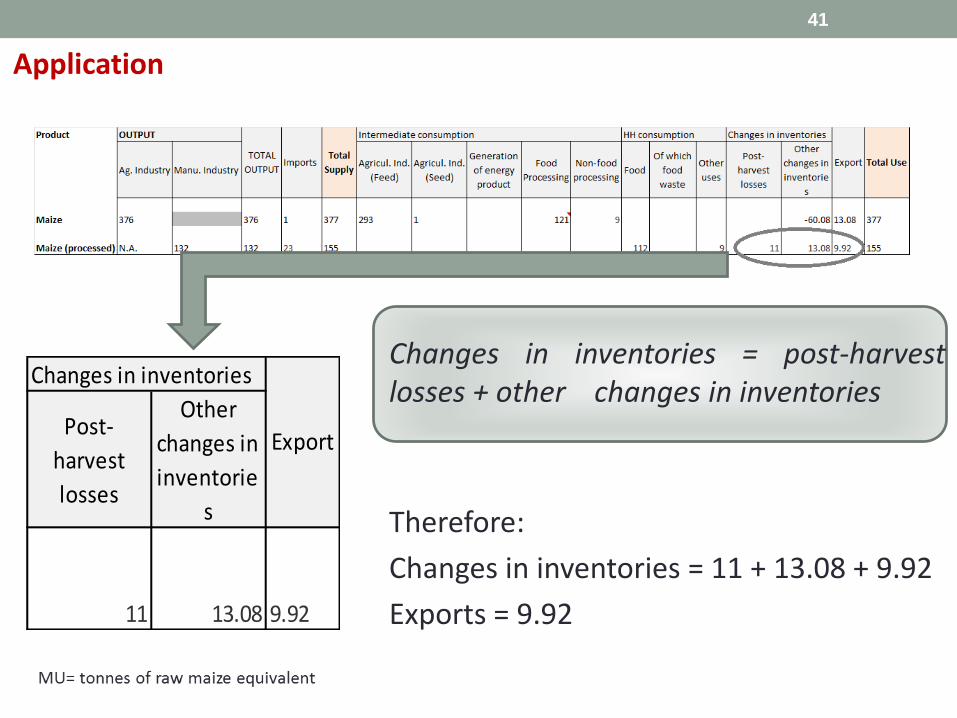
Changes in inventories = post-harvestlosses + other changes in inventories
Therefore:
Changes in inventories = 11 + 13.08 + 9.92
Exports = 9.92
Application

42
155
Total Use
Total use = Intermediate consumption + HHconsumption + Changes in inventories + Exports
Therefore:
Total Use = 121+ 24.08 + 9.92 = 155
Total Use = Total Supply = 155
Application

Selection of crops:
The scope of this physical flow table is all crops.
SEEA Agriculture, Forestry and Fisheries suggests that each countrydevelops physical flow accounts for crops that focus on eight to tenmost important crops.
Selection is not straightforward….
The most appropriate actor to do this selection in the country
43
Application
The measurement unit:
To record the raw and processed version of each crop, rawcommodity equivalent weight for each processed product willbe recorded.
Raw commodity equivalent for a processed product is theamount of raw commodity required to produce it.
44
Application

Agricultural industry = (ISIC* A) actual harvested productionfrom the field or orchard and gardens, excluding harvesting andthreshing losses and that part of crop not harvested for anyreason.
Manufacturing industry = (ISIC C) physical or chemicaltransformation of materials, substances, or components intonew products.
* International Standard Industrial Classification of all Economic Activities (ISIC).
45
Application
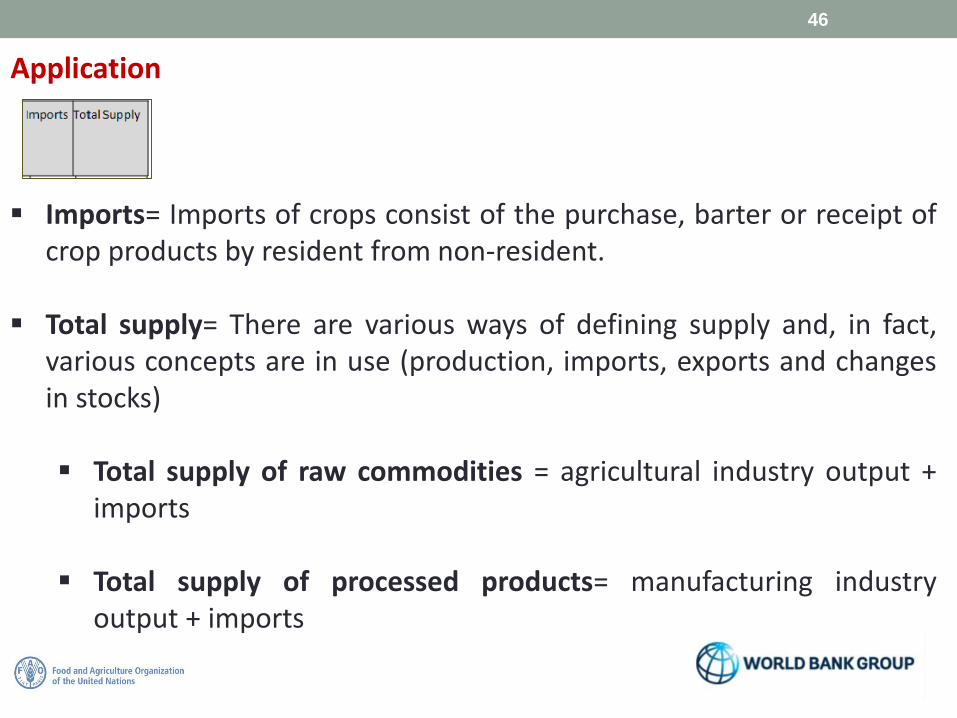
Imports= Imports of crops consist of the purchase, barter or receipt ofcrop products by resident from non-resident.
Total supply= There are various ways of defining supply and, in fact,various concepts are in use (production, imports, exports and changesin stocks)
Total supply of raw commodities = agricultural industry output +imports
Total supply of processed products= manufacturing industryoutput + imports
46
Application

Feed = quantity of product used for feeding livestock andpoultry during the reference period. The quantities areassumed to be raw.
Seed = quantity of product used for sowing or planting. Theentry also includes quantities used for sowing or plantingcrops harvested for fodder.
Generation of Energy Products = raw product used for thegeneration of energy products such as fuel, heat or electricity
47
Application

Food Processing= raw products used by economic units for physicalor chemical transformation into food and beverage products
Non Food Processing = raw product used by economic unit for theprocessing of non food products
48
Application
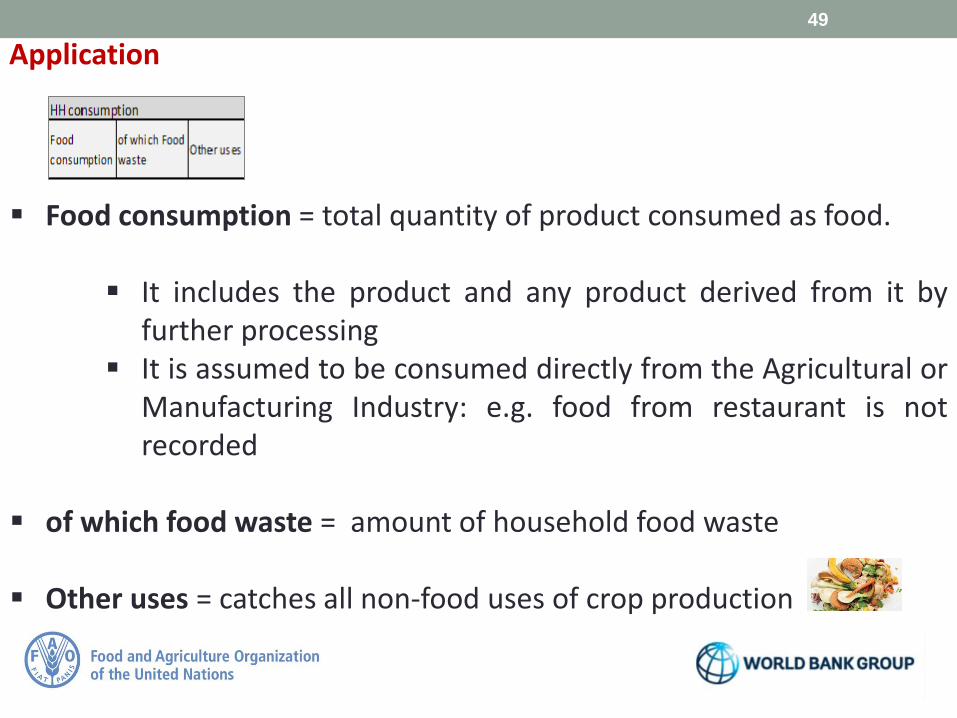
Food consumption = total quantity of product consumed as food.
It includes the product and any product derived from it byfurther processing
It is assumed to be consumed directly from the Agricultural orManufacturing Industry: e.g. food from restaurant is notrecorded
of which food waste = amount of household food waste
Other uses = catches all non-food uses of crop production
49
Application
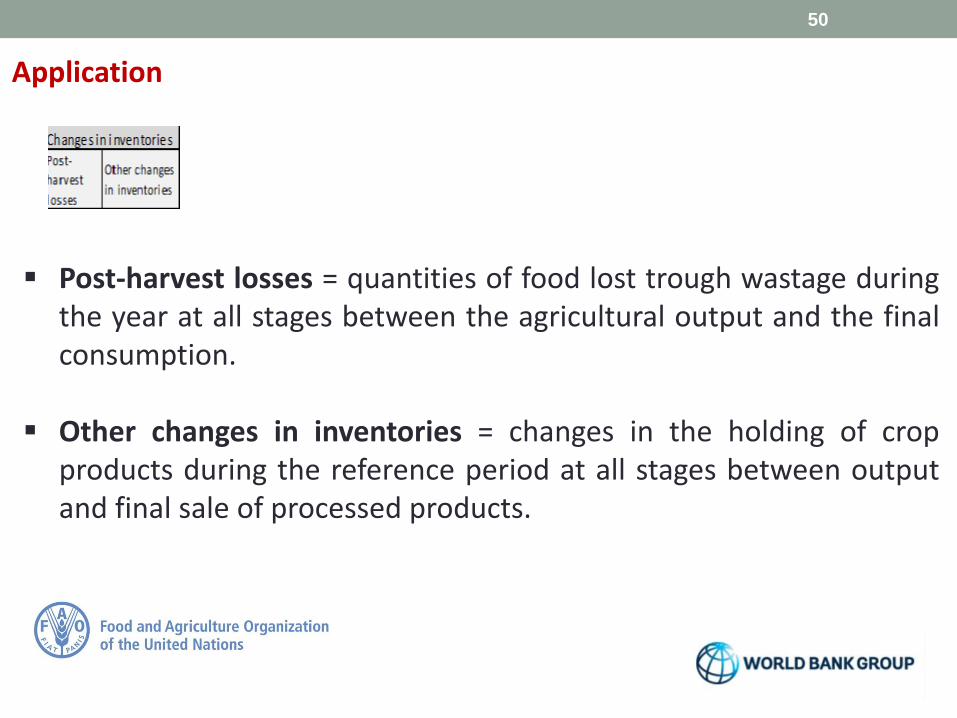
Post-harvest losses = quantities of food lost trough wastage duringthe year at all stages between the agricultural output and the finalconsumption.
Other changes in inventories = changes in the holding of cropproducts during the reference period at all stages between outputand final sale of processed products.
50
Application
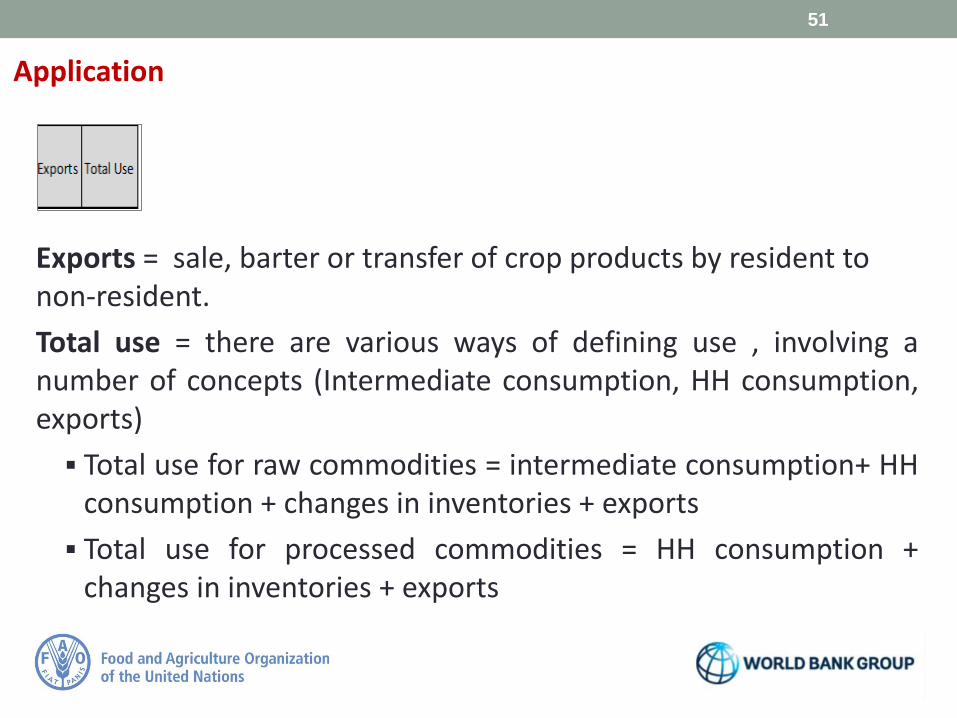
Exports = sale, barter or transfer of crop products by resident to non-resident.
Total use = there are various ways of defining use , involving anumber of concepts (Intermediate consumption, HH consumption,exports)
Total use for raw commodities = intermediate consumption+ HHconsumption + changes in inventories + exports
Total use for processed commodities = HH consumption +changes in inventories + exports
51
Application

SEEA Agriculture Forestry and Fisheries at:
http://unstats.un.org/unsd/envaccounting/seea.asp
FAOSTAT production domain at:
http://faostat3.fao.org/download/Q/*/E
FAOSTAT trade domain at:
http://faostat3.fao.org/download/T/*/E
FAOSTAT inputs domain at:
http://faostat3.fao.org/download/R/*/E
52
Background material/notes
53
Asset Accounts

Asset Accounts Asset accounts record
information on stocks ofassets at the beginning andend of an accountingperiod, and changes in themduring the accountingperiod.
The internal consistency ofasset accounts isdetermined by the identitythat the opening stock plusadditions to stock lessreductions in stock mustequal the closing stock.
54
Asset Accounts
55
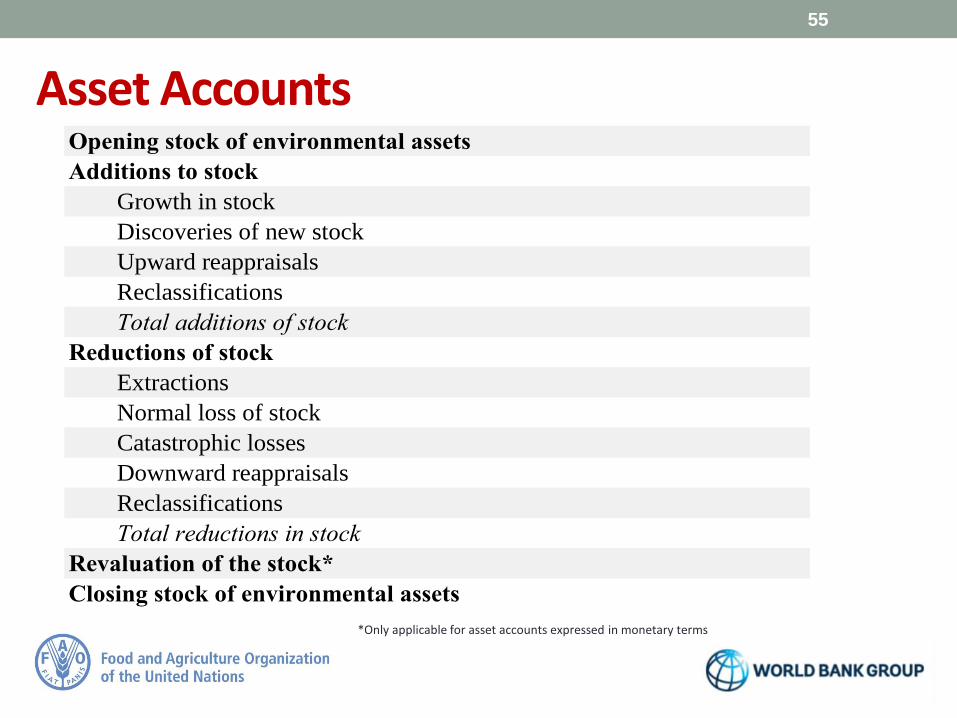
Growth in stock
Discoveries of new stock
Upward reappraisals
Reclassifications
Total additions of stock
Extractions
Normal loss of stock
Catastrophic losses
Downward reappraisals
Reclassifications
Total reductions in stock
Closing stock of environmental assets
Opening stock of environmental assets
Additions to stock
Reductions of stock
Revaluation of the stock*
*Only applicable for asset accounts expressed in monetary terms

Asset Accounts
56
SEEA Agriculture Forestry and Fisheries describes 10 asset accounts linked to the main SEEA Agriculture data domains:
Data Domain Asset Accounts
Agricultural products and related environmental assets
Asset account for livestock Asset account for plantations
Forestry products and related environmental assets
Asset account for forests Asset account for timber resources
Fisheries products and related environmental assets
Asset account for fish and other aquatic resources
Water resources Asset account for water resources
Land Asset account for land use Asset account for land cover
Soil resources Asset account for soil resources
Other economic data Extended production and income account
for agricultural, forestry and fisheries activities
Table 4.8: “Asset Account for Land Use” description
Land use in SEEA Agriculture Forestry and Fisheries reflects:
the activities undertaken
the institutional arrangements put in place in a given area forthe purposes of economic production or the maintenance andrestoration o environmental functions.
The Asset account for land use table records the opening andclosing stock of land in hectares, classified by type of land useand changes in land use over an accounting period throughadditions to stock and reductions in stock.
57

Land use classes
58
Table 4.8: “Asset Account for Land Use” description
Land area
Land used for agriculture
Land used for forestry
Land used for aquaculture
Use of built up areas
Land used for maintenance and restoration of environmental functions
Other uses of land nec
Land not in use
Inland water
Inland water used for aquaculture or holding facilities
Inland water used for maintenance and restoration of environmental functions
Other uses of inland nec
Inland not in use


Application
60
Land use classes
Arable Land
Permanent Crop
Land Arable land and permanenet crop (tot)
Permanent meadows and pastures (tot)
Agricultural Area (tot)
Forest Area
Land used for aquaculture
Use of built up areas
Land used for maintenance and restoration of
environmental functions
Other uses of land nec
Land not in use
Other Land
Land area (total)
Inland waters
Inland waters used for aquaculture or holding
facilities
Inland waters used for maintenance and restoration
of environmental functions
Other uses of inland waters nec
Inland waters not in use
Inland water (Total)
Additions to
stock
Reductions in
stock
Net changes in
stockOpening stock Closing stock

61
Application
Agricultural area (000ha) :
opening stock + addition to stock – reduction in stock = closing stocks
closing stock – opening stock = net changes in stock

62
Application
Uganda, 2012-2013 (000ha)
Agricultural land:
Opening stock: 14 465
Closing stock: 14 415
Net change in stock: - 50

FAO land use and irrigation questionnaire may be found at:
http://www.fao.org/economic/ess/ess-home/questionnaires/en/
It includes FAO definitions of land use classes
63
Background material/notes
Land use
6600 Country area (1) (1)=(2)+(26)+(30)
6601 Land area (2) (2)=(3)+(18)+(20)+(21)
6610 Agricultural area (3) (3)=(5)+(14)
6611 Agricultural area actually irrigated (4) (4)=(8)+(10)+(13)+(16)
6620 Arable land and Permanent crops (5) (5)=(6)+(12)
6621 Arable land (6) (6)=(7)+(9)+(11)
6630 Temporary crops (7)
6631 Temporary crops actually irrigated (8)
6633 Temporary meadows and pastures (9)
6634Temporary meadows and pastures actually
irrigated (10)
6640 Fallow land (temporary) (11)
6650 Permanent crops (12)
6651 Permanent crops actually irrigated (13)
6655 Permanent meadows and pastures (14) (14)=(15)+(17)
6656Permanent meadows and pastures - Cultivated
(15)
6657Permanent meadows and pastures - Cultivated
and actually irrigated (16)
6659Permanent meadows and pastures - Naturally
growing (17)
Land use
6600
6601
6610
CONCEPTS AND DEFINTIONS
Country area, area under the national sovereignty, including its land territory (land area plus inland waters), internal waters and territorial sea, excluding the contiguous
zone (Article 22, UNCLOS) and exclusive economic zone (Part V, UNCLOS).
Land area is the Country area excluding area under inland water bodies, internal waters and territorial sea.
Agricultural area, this category is the sum of areas under “Arable land and Permanent crops” and “Permanent pastures”.
SEEA Agriculture land use categories are
described in SEEA Agriculture, Forestry
and Fisheries, para 4.6, p 111-114