2q-2016 consolidated results conference call
TRANSCRIPT

2Q-2016 Consolidated Results Conference Call FULL IFRS
September 27, 2016
The IR Recognition granted by the Colombian Securities Exchange (Bolsa de Valores de Colombia S.A) is not a certification of the registered securities or the solvency of the issuer.
2
Banco de Bogotá is an issuer of securities in Colombia. As a financial institution, the Bank, as well as its financial subsidiaries, is subject to inspection and surveillance from the Superintendency of Finance of Colombia.
As an issuer of securities in Colombia, Banco de Bogotá is required to comply with periodic reporting requirements and corporate governance practices.
In 2009 the Colombian Congress enacted Law 1314 establishing the implementation of IFRS in Colombia. As a result, since January 1, 2015, financial entities and Colombian issuers of publicly traded securities, such as Banco de Bogotá, must prepare financial statements under IFRS, with some exceptions established by applicable regulation.
IFRS as applicable under Colombian regulations differs in certain aspects from IFRS as currently issued by the IASB
Our reports for 2015´s quarters had been presented in accordance with IFRS applicable in Colombia (Col IFRS). This report and 1Q16 were prepared with unaudited consolidated financial information, which is in accordance with IFRS as currently issued by the IASB.
At June 30th 2016, Banco de Bogota deconsolidated (ceded control of CFC to Grupo Aval) Corficolombiana. The bank now holds its 38.3% stake of Corficolombiana as an equity investment. For comparative analysis with previous periods, this report has a Pre-deconsolidation of 2Q-16 that reflects Banco de Bogotá´s consolidated figures including Corficolombiana as a subsidiary. Growths will be shown versus Pre-de-consolidation 2Q-16.
Details of the calculations of Non GAAP measures such as ROAA and ROAE, among others, are explained when required in this report.
Colombian peso/dollar annual devaluation as of June 30, 2016 was 12.3%. Quarterly revaluation was 2.7%. In this report, calculations of growth, excluding the exchange rate movement of the Colombian Peso, use the exchange rate as of June 30, 2016 (COP 2,919.01)
This report may include forward-looking statements and actual results may vary from those stated herein as a consequence of changes in general, economic and business conditions, changes in interest and currency rates and other risks factors. Recipients of this document are responsible for the assessment and use of the information provided herein. Banco de Bogotá will not have any obligation to update the information herein and shall not be responsible for any decision taken by investors in connection with this document. The content of this document is not intended to provide full disclosure on Banco de Bogotá or its subsidiaries.
In this document we refer to trillions as millions of millions and to billions as thousands of millions.
Disclaimer

3
2016 Second Quarter Performance Highlights
Profitability
Balance Sheet
Credit & Capital
Recurring Attributable Net Income for the period was $570.9 billion pesos, which represented a 15.8% increase versus the second quarter of 2015
• ROAA: 2.1% / ROAE: 17.1%
• Net Interest Margin: 5.3%
• Fee Income Ratio: 31.8%
• Efficiency Ratio: 46.0%
Key Metrics Commentary
• Cost of Risk1: 1.7%
• 90+ Days PDL Ratio: 1.6%
• Tier 1 Ratio2: 9.2%
• Total Solvency2: 14.0%
• Gross Loans: $92.5
• Total Deposits: $90.5
• Deposits / Net Loans: 1.00x
• Deposits % Funding: 72.7%
• ROAA steady; ROAE increased 30bps • NIM increased 30 bps due to Central Bank rate
hikes • Fee income increased 21.1% primarily due to
banking fees • Efficiency slightly deteriorated, up from 43.8%
• Gross Loans grew 14.3%, excluding FX growth was 9.0%
• Total Deposits grew 10.3%, excluding FX growth was 5.5%
• Deposits / Net Loans illustrates robust funding model, but decreased marginally from 1.04x
• Excluding non-recurring item, cost of risk post recoveries increased slightly by 10bps
• 90+ Days PDL Ratio stayed constant at 1.6% • Tier 1 Ratio increased by 140 bps and Total
Solvency increased by 290 bps. Both ratios well above regulatory minimums
Note: Changes / growths refer to Q2 2016 over Q2 2015, unless otherwise stated. All figures refer to Q2 2016 pre-deconsolidation of Corficolombiana. (1) Excluding Pacific non-recurring provisions; net of recoveries (2) Reflects an estimate of Banco de Bogotá’s solvency ratio taking into account the Shareholder’s meeting approval to capitalize the one-time $2.2 trillion gain derived from the
deconsolidation of Corficolombiana plus 50% of the recurring net income of the first semester of 2016.

4
-1%
0%
1%
2%
3%
4%
5%
6%
7%
8%
Jun-02 Jun-04 Jun-06 Jun-08 Jun-10 Jun-12 Jun-14 Jun-16
QoQ % YoY %
Unemployment (%)
GDP (YoY %) GDP growth by sector(YoY %)
Source: DANE, Fedesarrollo. Estimates Economic Research Banco de Bogotá.
2.0%
2.0% -0.1%
-7.1%
6.0%
-0.8%
1.0%
1.4%
0.1%
4.6%
2.3%
3.1% 2.4%
4.4%
0.1%
1.7%
7.8%
3.6%
0.5%
3.8%
2.4%
-10% 0% 10%
GDP
Agriculture
Mining
Industry
Electricity
Construction
Commerce
Transportation
Financial services
Social services
jun-16
jun-15
2014 2015 2016e
4.6% 3.1% 2.3%
Colombian Peso vs WTI US$/barrel
1,700
2,200
2,700
3,200
3,700
20
40
60
80
100
120
Jan
-15
Feb
-15
Ma
r-1
5
Ap
r-1
5
Ma
y-1
5
Jun
-15
Jul-
15
Au
g-1
5
Sep
-15
Oct-
15
No
v-1
5
De
c-1
5
Jan
-16
Feb
-16
Ma
r-1
6
Ap
r-1
6
Ma
y-1
6
Jun
-16
Jul-
16
Au
g-1
6
WTI (US$ - Lhs) COP Exchange Rate
Colombia: Economic activity has decelerated but a gradual pick-up is expected going forward
11.1%
9.8% 9.6%
8.4% 8.7% 8.6%
12.7%
11.5% 10.9%
9.9% 9.3%
8.8%
9.8%
2010 2011 2012 2013 2014 2015 2016
Unemployment as of December for each period
Unemployment as of July for each period

5
0%
1%
2%
3%
4%
5%
6%
Sep-10 Sep-11 Sep-12 Sep-13 Sep-14 Sep-15 Sep-16
BEI 2Y BEI 3Y
BEI 5Y Inflation target
0%
2%
4%
6%
8%
10%
Jun-10 Jun-11 Jun-12 Jun-13 Jun-14 Jun-15 Jun-16
Headline inflationCore inflation 4
Core and total inflation (YoY %)
Market-based inflation expectations - BEI (%)
Source: DANE, Banco de la República (BR). Estimates Economic Research Banco de Bogotá. (1) Average of four measures preferred by BR: 1) without foodstuff; 2) without foodstuff and regulated; 3) without foodstuff, public services and gasoline; and 4) core 20
Central bank interest rate vs. DTF rate (%)
8.1%
6.6%
3.2% 3.2% 3.3%
2%
3%
4%
5%
6%
7%
8%
Jun-10 Jun-11 Jun-12 Jun-13 Jun-14 Jun-15 Jun-16
Central bank rate DTF rate
7.75%
7.24%
Central Bank Rate
2014 2015 2016e
4.50% 5.75% 7.75%
Inflation
2014 2015 2016e
3.7% 6.8% 6.8% 2Q15 1Q16 2Q16
Average 2,496.45 3,263.49 2,993.00
End of period 2,598.68 3,000.63 2,919.01
2Q16 vs. 1Q16 2Q16 vs. 2Q15
Average 8.3% -19.9%
End of period 2.7% -12.3%
COP/USD Exchange Rate
Colombia: Dissipation of shocks, as well as central bank rate hikes
(1)
Positive change = COP appreciation Negative change = COP devaluation

6
-10%
-8%
-6%
-4%
-2%
0%
2%
4%
6%
Mar-00 Mar-04 Mar-08 Mar-12 Mar-16Current transfers Labor and investment income
Services balance Trade balance
Current account
-10%
-5%
0%
5%
-2,000
-1,000
0
1,000
Jun-10 Jun-11 Jun-12 Jun-13 Jun-14 Jun-15 Jun-16
Trade balance (USD M)
% GDP
Current Account (% GDP, quarterly)
Trade balance (USD M, % GDP, monthly) International reserves (USD M, months of imports)
Foreign investment: direct and portfolio* (USD M, monthly)
Source: DANE, Banco de la República. Estimates Economic Research Banco de Bogotá. * With information from Balanza cambiaria.
-USD810 M -3.4% GDP
-5.6%
-5.1%
2.2%
-1.7% -0.9%
284
383
1,110
0
500
1,000
1,500
2,000 Other sectors Oil and mining
(1,000)
0
1,000
2,000
Aug-10 Aug-11 Aug-12 Aug-13 Aug-14 Aug-15 Aug-16
Portfolio
6
7
8
9
10
11
12
13
0
10
20
30
40
50
Jun-01 Jun-03 Jun-05 Jun-07 Jun-09 Jun-11 Jun-13 Jun-15
International reserves (USD M)IR in months of importsHistorical average
12.3
47,123
8.4
Current account
2014 2015 2016e
-5.2% -6.4% -5.0%
Colombia: Balance of payments adjustment continues

7
Inflation (YoY %) Central bank interest rate (%)
GDP (YoY %)
Source: SECMCA, International Monetary Fund (IMF). Estimates Economic Research Banco de Bogotá. ES: El Salvador, HO: Honduras, CR: Costa Rica, GU: Guatemala, NI: Nicaragua, PA: Panama.
2.4
3.6 3.7 4.0 4.1
4.5
5.8
2.5
3.5
4.3 4.0 4.3
4.5
6.1
0
1
2
3
4
5
6
7
El Salvador Honduras CostaRica
Guatemala CentralAmerica
Nicaragua Panama
2015 2016f
-4
-2
0
2
4
6
8
10
Jul-14 Jan-15 Jul-15 Jan-16 Jul-16
CR PA GU NI HO ES CENAM
0.5 0.1
2.0 0.9
4.6 4.1
2.4
0
2
4
6
8
Aug-13 Aug-14 Aug-15 Aug-16
Costa Rica Honduras
Guatemala
1.75
3.0
5.50
Central America: Strong growth, stable inflation, low rates

8
150.0
17.6
2.2 134.6
2Q-16 Pre-deconsolidation
Deconsolidation ofCFC Assets
Difference betweenBV and FV of CFC
2Q-16 Post-deconsolidation
Total Assets
132.1
13.9
118.1
2Q-16 Pre-deconsolidation
Deconsolidation ofCFC Liabilities
2Q-16 Post-deconsolidation
Total Liabilities
4.4
3.6
0.8
2Q-16 Pre-deconsolidation
Third party stakes inCFC
2Q-16 Post-deconsolidation
Minority interest
13.5 0.0
2.2 15.7
2Q-16 Pre-deconsolidation
Deconsolidation ofCFC
Difference betweenBV and FV of CFC
2Q-16 Post-deconsolidation
Attribuitable Equity
Figures in PS Trillion
Impact of Deconsolidation of CFC in Banco de Bogotá’s Balance Sheet

9
Figures in Ps. Billion
919 1,019
100
2Q16 Pre-deconsolidation
Deconsolidation ofCFC
2Q16 Post-deconsolidation
NII post Cost of Risk 902 879
19
2Q16 Pre-deconsolidation
Deconsolidation ofCFC
2Q16 Post-deconsolidation
Net Fees 171
89
82
2Q16 Pre-deconsolidation
Deconsolidation ofCFC
2Q16 Post-deconsolidation
Trading Income
550
2,459
2,183
47 322
2Q16 Pre-deconsolidation
Difference between BVand FV of CFC
CFC vía Equity Method Deconsolidation of CFC 2Q16 Post-deconsolidation
Other Income 1,437 1,423
13
2Q16 Pre-deconsolidation
Deconsolidation ofCFC
2Q16 Post-deconsolidation
OPEX
224
46 178
2Q16 Pre-deconsolidation
Deconsolidation ofCFC
2Q16 Post-deconsolidation
Minority Interest
571
2,759 2,188
2Q16 Pre-deconsolidation
Deconsolidation ofCFC
2Q16 Post-deconsolidation
Attributable Net Income
307 218
89
2Q16 Pre-deconsolidation
Deconsolidation ofCFC
2Q16 Post-deconsolidation
Taxes
Impact of Deconsolidation of CFC in Banco de Bogotá’s Income Statement
899
10
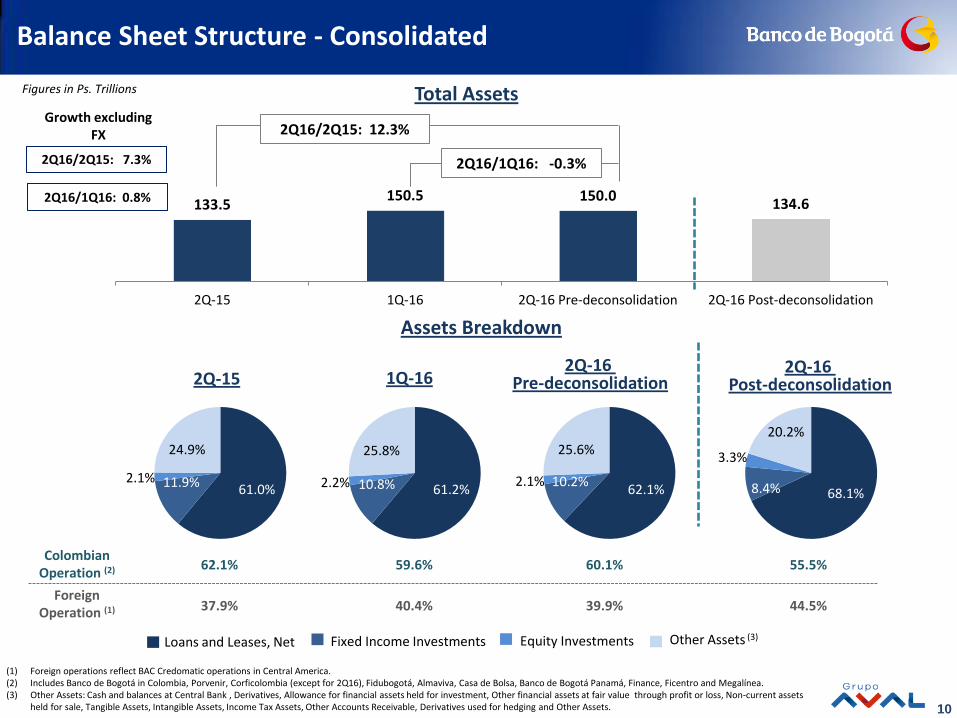
62.1% 10.2% 2.1%
25.6%
61.2% 10.8% 2.2%
25.8%
61.0% 11.9% 2.1%
24.9%
68.1% 8.4%
3.3%
20.2%
Foreign Operation (1)
Loans and Leases, Net Fixed Income Investments
133.5 150.5 150.0
134.6
2Q-15 1Q-16 2Q-16 Pre-deconsolidation 2Q-16 Post-deconsolidation
Total Assets
2Q-15 1Q-16 2Q-16
Pre-deconsolidation
37.9%
62.1%
44.5%
55.5%
2Q16/1Q16: -0.3%
2Q16/2Q15: 12.3%
40.4%
59.6%
Assets Breakdown
Other Assets (3)
Colombian Operation (2)
(1) Foreign operations reflect BAC Credomatic operations in Central America. (2) Includes Banco de Bogotá in Colombia, Porvenir, Corficolombia (except for 2Q16), Fidubogotá, Almaviva, Casa de Bolsa, Banco de Bogotá Panamá, Finance, Ficentro and Megalínea. (3) Other Assets: Cash and balances at Central Bank , Derivatives, Allowance for financial assets held for investment, Other financial assets at fair value through profit or loss, Non-current assets
held for sale, Tangible Assets, Intangible Assets, Income Tax Assets, Other Accounts Receivable, Derivatives used for hedging and Other Assets.
Equity Investments
2Q16/2Q15: 7.3%
2Q16/1Q16: 0.8%
Growth excluding FX
39.9%
60.1%
2Q-16 Post-deconsolidation
Figures in Ps. Trillions
Balance Sheet Structure - Consolidated

11
2Q-15 1Q-16 2Q-16Pre-deconsolidation
2Q-16Post-deconsolidation
Microcredit
Mortgage
Consumer
Commercial
81.0 91.5 92.5 91.4
2Q-15 1Q-16 2Q-16 Pre-deconsolidation 2Q-16 Post-deconsolidation
81.0 91.5 91.4
61.9%
26.2%
11.5%
0.4 %
61.9%
26.3%
11.4% 0.4%
64.0%
25.0%
10.6% 0.5%
2Q16/2Q15: 14.3%
2Q16/1Q16: 1.1%
Gross Loan Portfolio Breakdown
Gross Loan Portfolio
7.4
11.8
11.8
4.3
Growth (%) Excluding FX 2Q16/2Q15
2Q16/2Q15: 9.0%
2Q16/1Q16: 2.3%
Growth excluding FX
92.5
62.0%
26.2%
11.4%
0.4 %
10.8
19.6
22.9
4.3
Growth (%)
2Q16/2Q15
2.1
2.3
3.1
0.2
Growth (%) Excluding FX 2Q16/1Q16
Figures in Ps. Trillions
Loan Portfolio Breakdown by Business Segment - Consolidated

12
0.78x
1.14x 1.24x 1.28x
2Q-15 1Q-16 2Q-16 2Q-16Post-
deconsolidation
2.4% 2.4% 2.3%
(1) Annualized
30 days PDLs/ Gross Loans 90 days PDLs / Gross Loans
Cost of Risk (1)
Charge-offs (1) / Average 90 days PDLs Coverage
Allowances/ Gross Loans
0.9x 0.9x 0.9x 0.9x
1.5x 1.5x 1.5x 1.5x
2Q-15 1Q-16 2Q-16 2Q-16Post-
deconsolidation
Allowances / 30 days PDLs Allowances / 90 days PDLs
2.4%
0.85x
Excluding Pacific Rubiales
1.2% 1.8% 2.0%
Charge-offs / Average Loans
2.0%
2Q-16 Pre-deconsolidation 2Q-16
Pre-deconsolidation
2.6% 2.8% 2.7% 2.7%
1.6% 1.6% 1.6% 1.6%
2Q-15 1Q-16 2Q-16 2Q-16Post-
deconsolidation
30 days PDLs / Gross Loans 90 days PDLs / Gross Loans
2Q-16 Pre-
deconsolidation
(2)
1.6% 2.1% 2.0% 2.0%
1.7% 2.2% 2.1% 2.1%
2Q-15 1Q-16 2Q-16 2Q-16Post-
deconsolidation
Impairment loss (net of recoveries of charged-off assets) / Average Loans
Impairment loss / Average Loans
1.8%
Excluding Pacific Rubiales
1.7%
1.9%
1.8%
2Q-16 Pre-
deconsolidation
1.8%
1.7%
0.85x
Loan Portfolio Quality (1/3) – Consolidated

13
Colombia Central America
2Q15 1Q16 Pre- decon.
2Q16 Post- decon.
2Q16 2Q15 1Q16 2Q16
Delinquency Ratio
30 day PDLS / Gross Loans 2.7% 3.1% 3.1% 2.9% 2.3% 2.3% 2.3%
90 day PDLS / Gross Loans 1.9% 2.1% 2.0% 2.0% 1.0% 1.0% 1.0%
Cost of Risk (2)
Impairment Loss, net of recoveries of charge-off
1.6% 2.2% 2.2% 2.1% 1.5% 2.0% 1.8%
Excluding Pacific 1.7% 1.7% 1.7%
Impairment Loss 1.8% 2.3% 2.4% 2.3% 1.5% 2.0% 1.8%
Excluding Pacific 1.9% 1.9% 1.9%
Charge-Off Ratio (2)
Charge offs / 90 days PDLs 0.54x 0.94x 1.19x 1.25x 1.49x 1.64x 1.36x
Excluding Pacific 0.65x 0.65x
charge offs / Avg Loans 1.0% 1.9% 2.5% 2.5% 1.5% 1.7% 1.4%
Coverage
Allowance / 30 days PDLs 1.10x 1.00x 1.00x 1.00x 0.6x 0.6x 0.6x
Allowances / 90 days PDLs 1.60x 1.50x 1.50x 1.60x 1.30x 1.30x 1.30x
Allowances / Gross Loans 3.0% 3.2% 3.1% 3.1% 1.3% 1.3% 1.4%
(1) Includes Banco de Bogotá in Colombia, Corficolombiana (Except for 2Q16), Porvenir, Fidubogotá, Almaviva, Casa de Bolsa, Banco de Bogotá Panamá, Finance, Ficentro and Megalínea. (2) Annualized
Loan Portfolio Quality (2/3) – Colombia (1) and Central America

14
30 days PDLs 90 days PDLs
2Q-15 1Q-16 Pre- decon.
2Q16 Post- decon.
2Q16 2Q-15 1Q-16
Pre- decon. 2Q16
Post- decon. 2Q16
Commercial 1.7% 2.0% 2.0% 1.9% 1.3% 1.5% 1.5% 1.4%
Consumer 4.7% 4.5% 4.7% 4.6% 2.3% 2.0% 2.1% 2.1%
Mortgage 2.3% 2.5% 2.3% 2.3% 1.1% 1.2% 1.1% 1.1%
Microcredit 12.0% 12.2% 12.6% 12.6% 8.0% 7.8% 8.0% 8.0%
Total Loans 2.6% 2.8% 2.7% 2.7% 1.6% 1.6% 1.6% 1.6%
Coverage Ratio 0.92x 0.86x 0.87x 0.88x 1.51x 1.47x 1.47x 1.50x
Loan Portfolio Quality (3/3) – Consolidated

15
2Q-15 1Q-16 2Q-16 2Q-16Post-deconsolidation
Deposits
Banks and others
Interbank Borrowings
Long Term Bonds
2Q-15 1Q-16 2Q-16 2Q-16Post-deconsolidation
Time Deposits
Saving Accounts
Checking Accounts
Others
% 2Q-15 1Q-16 2Q-16 Pre-
deconsolidation 2Q-16 Post-
deconsolidation
74.0 73.8 72.7 77.3 14.0 15.9 16.0 15.4 6.5 4.9 4.6 1.6 5.4 5.4 6.7 5.6
% 2Q-15 1Q-16 2Q-16 Pre-
deconsolidation 2Q-16 Post-
deconsolidation
44.4 42.0 43.5 41.1 30.8 30.2 31.4 32.9 24.6 27.5 24.7 25.7 0.2 0.3 0.3 0.3
1.04x 1.04x 1.00x 0.98x
2Q-15 1Q-16 2Q-16Pre-deconsolidation
2Q-16Post-deconsolidation
82.0 92.6
2Q16/2Q15: 10.3%
2Q16/1Q16: -2.2%
87.4
Total Deposits Total Funding
(1) Other Deposits include: Deposits from other Banks and Correspondent Accounts, Banking Services Liabilities, Collection Banking Services and Other Deposit (2) Net Loans includes commercial, consumer, mortgages and microcredit. Deposits include checking, savings, time deposits and other deposits.
110.9 125.5
113.0
2Q16/2Q15: 12.3%
2Q16/1Q16: -0.8%
Deposits / Net Loans (%)(2)
Growth excluding FX
124.5
2Q16/2Q15: 7.4%
2Q16/1Q16: 0.3%
90.5
2Q16/2Q15: 5.5%
2Q16/1Q16: -1.1%
2Q-16 Pre-deconsolidation
2Q-16 Pre-deconsolidation
Growth excluding FX Figures in Ps. Trillions
Funding - Consolidated

16
(3)
7.8% 10.0%
6.8% 9.2%
3.3% 3.7%
6.3% 4.8%
2Q-15 1Q-16 2Q-16 Post Capitalization 2Q-16
Tier I Tier II
12.1 13.2 13.5 15.7
3.9 4.2 4.4 0.8
2Q-15 1Q-16 2Q-16Pro-forma
2Q-16Post-deconsolidation
Shareholders' Equity Non-controlling interest
11.1% 13.7%
Total:
9.0%
Tier I:
4.5%
12.1 13.2 13.5 15.7
2Q-15 1Q-16 2Q-16Pro-forma
2Q-16Post-
deconsolidation
13.0%
8.1% 7.6% 8.1%
12.0% 11.6%
16.0 17.4 16.5
2Q16/2Q15: 12.4%
2Q16/1Q16: 3.3%
2Q16/2Q15: 12.3%
2Q16/1Q16: 2.8%
Consolidated Capital Adequacy (2)
Shareholders ‘ Equity Attributable Equity + Minority Interest
Regulatory Minimum:
Tangible Capital Ratio (1)
Total Equity / Assets
(1) Tangible Capital ratio is calculated as Total Equity minus Goodwill and others Intangible Assets / Total Assets minus Goodwill and other Intangible Assets. (2) Capital Ratios are calculated under the methodology of Colombian Superintendency of finance. (3) Reflects an estimation of Banco de Bogotá’s Pre-deconsolidation solvency ratio now that the general shareholders has approved the capitalization of the extraordinary $2.2 trillion gain derived from the deconsolidation of Corficolombiana plus the capitalization of at least 50% of the recurring net income of the first semester of 2016.
14.0%
18.0
8.2%
12.3% 12.0%
2Q-16 Pre-deconsolidation
2Q-16 Pre-deconsolidation
Figures in Ps. Trillions
Equity and Capital Adequacy

17
(4)
0.9% 0.8% 1.5% 0.4%
6.0% 6.3% 6.1%
6.6%
5.0% 5.3% 5.3% 5.8%
2Q-15 1Q-16 2Q-16 2Q-16Post-deconsolidation
Net Interest Margin on Investments (2) Net Interest Margin on Loans (3)Net Interest Margin (4)
3.6% 4.2% 4.3%
Net Interest Income(1) (Billion COP)
Growth Rate
2Q-15 1Q-16 2Q-16 Pre-
deconsolidation 2Q-16 Post-
deconsolidation 2Q16/2Q15
Pre-deconsolidation 2Q16/1Q16
Pre-deconsolidation
1,227.8 1,494.8 1,484.8 1,523.9 20.9% -0.7%
Quarterly Net Interest Margin
Average Funding Cost / Total Int. Bearing Funding
Yield on fixed income
Yield on loans
4.5% 5.2% 4.6%
9.6% 10.7% 10.9%
4.6%
6.3%
10.9%
2Q-16 Pre-deconsolidation
Source: Banco de Bogotá. Consolidated Figures. (1) Net interest Margin include net interest income plus net trading income from investment securities held for trading (2) Investments' Net Interest Margin : Quarterly Net Interest income on fixed income securities, net trading income from equity and fixed income investment securities held for trading through
profit and on interbank and overnight funds to Average securities and Interbank and overnight fund. (3) Loans ‘ Net Interest Margin: Quarterly Net Interest Income on Loans, annualized/Quarterly average loans and financial leases. (4) Net Interest Income for the period, annualized / Average interest earning assets.
Net Interest Margin Consolidated
18
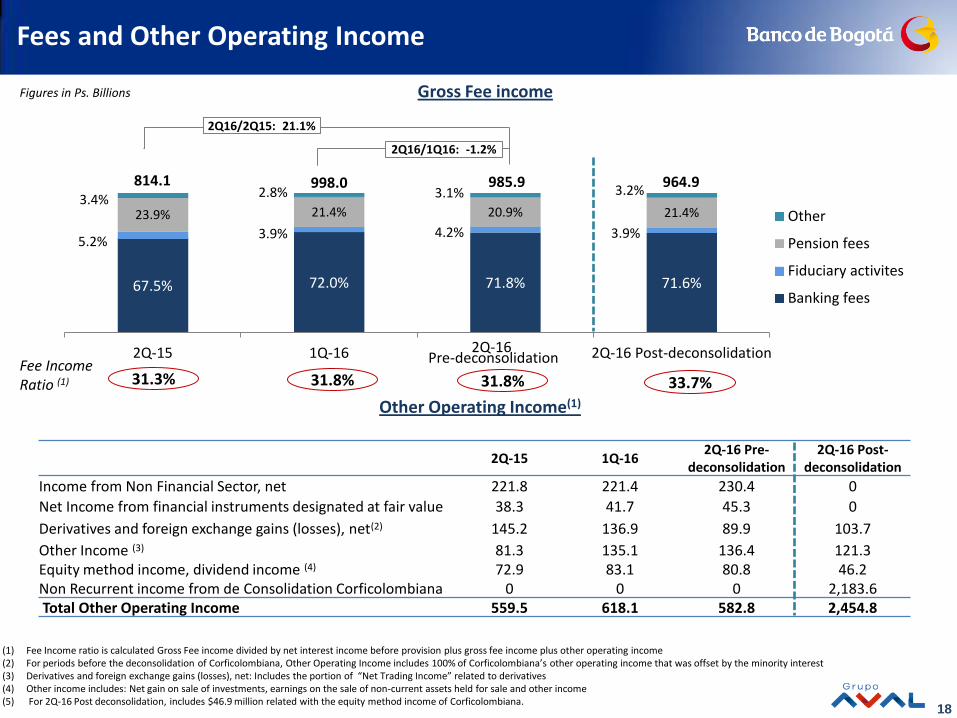
67.5% 72.0% 71.8% 71.6%
5.2% 3.9% 4.2% 3.9%
23.9% 21.4% 20.9% 21.4% 3.4% 2.8% 3.1% 3.2%
2Q-15 1Q-16 2Q-16 2Q-16 Post-deconsolidation
Other
Pension fees
Fiduciary activites
Banking fees
2Q-15 1Q-16 2Q-16 Pre-
deconsolidation 2Q-16 Post-
deconsolidation
Income from Non Financial Sector, net 221.8 221.4 230.4 0
Net Income from financial instruments designated at fair value 38.3 41.7 45.3 0
Derivatives and foreign exchange gains (losses), net(2) 145.2 136.9 89.9 103.7
Other Income (3) 81.3 135.1 136.4 121.3 Equity method income, dividend income (4) 72.9 83.1 80.8 46.2 Non Recurrent income from de Consolidation Corficolombiana 0 0 0 2,183.6 Total Other Operating Income 559.5 618.1 582.8 2,454.8
Gross Fee income
Other Operating Income(1)
(1) Fee Income ratio is calculated Gross Fee income divided by net interest income before provision plus gross fee income plus other operating income (2) For periods before the deconsolidation of Corficolombiana, Other Operating Income includes 100% of Corficolombiana’s other operating income that was offset by the minority interest (3) Derivatives and foreign exchange gains (losses), net: Includes the portion of “Net Trading Income” related to derivatives (4) Other income includes: Net gain on sale of investments, earnings on the sale of non-current assets held for sale and other income (5) For 2Q-16 Post deconsolidation, includes $46.9 million related with the equity method income of Corficolombiana.
2Q16/2Q15: 21.1%
2Q16/1Q16: -1.2%
814.1 998.0 964.9 985.9
2Q-16 Pre-deconsolidation
Figures in Ps. Billions
Fees and Other Operating Income
31.3% 31.8% 31.8% Fee Income Ratio (1) 33.7%

19
(2)
34.9% 31.6%
35.6%
2Q-15 1Q-16 2Q-16
(2)
43.3% 43.8% 46.0%
50.8%
2Q-15 1Q-16 2Q-16 2Q-16 Post-deconsolidation
1/ Calculated as Personnel plus administrative expenses divided by net interest income plus net trading income, other income and fees and other services income, net (excluding others) 2/ Efficiency for 1Q16 for Banco de Bogotá Consolidated, was calculated excluding the effect of Ps 191.5 billion of wealth tax paid during 2Q16. When included, efficiency would have been 49.9%, efficiency for 1Q16 for Banco de Bogotá Stand Alone, excluding the effect of Ps 138.2 billion of wealth tax paid during 1Q16. When included, efficiency would have been 41.8%.
Efficiency Ratio (1)
2Q-16 Pre-deconsolidation
Banco de Bogotá Stand Alone (1) Central America (1)
55.7% 55.5% 54.7%
2Q-15 1Q-16 2Q-16
2Q-16 Post-deconsolidation
Consolidated Efficiency Ratio

20
(3)
(3)
(3)
2.1%
1.5%
2.1% 1.8%
2Q-15 1Q-16 2Q-16 2Q-16Post-deconsolidation
16.8%
11.3%
17.1% 15.7%
2Q-15 1Q-16 2Q-16 2Q-16Post-deconsolidation
ROAA (1)
ROAE (2)
493.0 375.2 570.9 570.9
2Q-15 1Q-16 2Q-16 2Q-16Post-deconsolidation
(1) ROAA for each quarter is calculated as annualized Net Income divided by average of total assets. . ROAA for 1Q16 excludes the effect of Ps 191.5 billion of wealth.
(2) ROAE for each quarter is calculated as annualized Net Income attributable to shareholders divided by average attributable shareholders' equity. ROAE for 1Q16 excludes the effect of Ps 158.3 billion of attributable wealth tax .
(3) Non-recurrent income as a result of deconsolidation of CFC: includes $2,184 Ps. Billion of the difference between book value and fair value of Corficolombiana plus other income
Net Income attributable to controlling interest
533.6 x.x
Figures excluding wealth tax
2.0%
16.1%
2,759.2
Figures including Non Recurrent income for deconsolidation of CFC (3)
2Q-16 Pre-deconsolidation
2Q-16 Pre-deconsolidation
2Q-16 Pre-deconsolidation
Figures in Ps. Billions
Profitability