2q fy 2019-20 financial results - retail markets | telecom
TRANSCRIPT

2Q FY 2019-20 Financial Results
18 October 2019
2
Forward Looking Statements
This presentation contains forward-looking statements which may be identified by their use of words like
“plans,” “expects,” “will,” “anticipates,” “believes,” “intends,” “projects,” “estimates” or other words of similar
meaning. All statements that address expectations or projections about the future, including, but not limited
to, statements about the strategy for growth, product development, market position, expenditures, and
financial results, are forward-looking statements.
Forward-looking statements are based on certain assumptions and expectations of future events. The
companies referred to in this presentation cannot guarantee that these assumptions and expectations are
accurate or will be realized. The actual results, performance or achievements, could thus differ materially
from those projected in any such forward-looking statements. These companies assume no responsibility to
publicly amend, modify or revise any forward looking statements, on the basis of any subsequent
developments, information or events, or otherwise.

3
Consolidated Financial Results : 2Q FY20
Highest quarterly net profit aided by robust operating performance
➢ QoQ Revenue lower - 10% decline in crude,
partially offset by growth in consumer businesses
▪ Retail revenue up 8%, Digital Services up 5%
➢ QoQ O2C businesses benefited from stronger fuel
margins and higher volumes in petrochemicals
➢ QoQ Retail and Digital services EBITDA up 13.3%
and 8.5% respectively
➢ Lower tax provision on account of cut in MAT rate
➢ Standalone net profit at ₹ 9,702 crore, up 9.5 % YoY
and 7.4% QoQ
1Q FY20 (in ` Crore) 2Q FY20 2Q FY19% Change
Y-o-Y
% Change
Q-o-Q
172,956 Revenue 163,854 156,291 4.8% -5.3%
22,013 Segment EBITDA 23,169 21,641 7.1% 5.3%
10,104 Net Profit 11,262 9,516 18.3% 11.5%
4
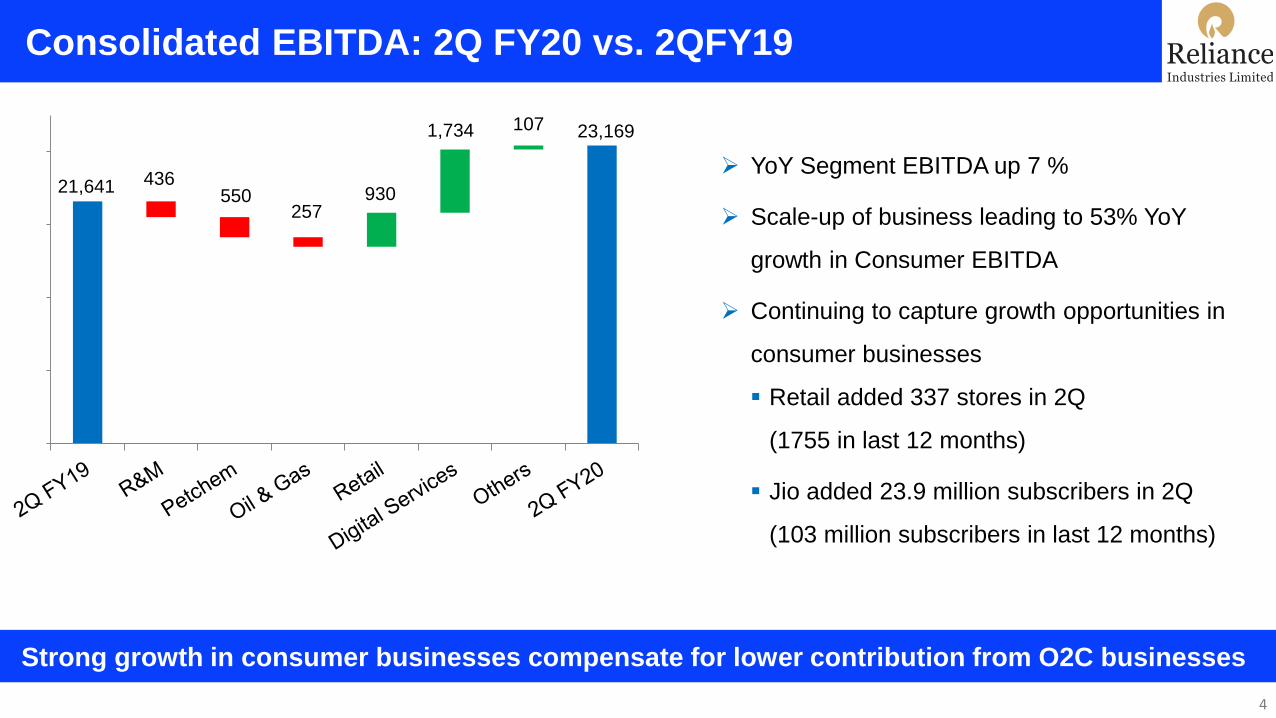
Consolidated EBITDA: 2Q FY20 vs. 2QFY19
Strong growth in consumer businesses compensate for lower contribution from O2C businesses
➢ YoY Segment EBITDA up 7 %
➢ Scale-up of business leading to 53% YoY
growth in Consumer EBITDA
➢ Continuing to capture growth opportunities in
consumer businesses
▪ Retail added 337 stores in 2Q
(1755 in last 12 months)
▪ Jio added 23.9 million subscribers in 2Q
(103 million subscribers in last 12 months)
21,641 436550
257930
1,734 107 23,169

5
Consolidated Segment EBITDA Mix: 2Q FY20 vs. 2Q FY19
Consumer businesses contribution at 33% (vs. 23%)
2Q FY19 2Q FY20
Refining, 28.2%
Petchem, 43.8%
Oil & Gas, 1.8%
Retail, 6.4%
Digital Services, 16.6%
Media & Others, 3.2%
Refining, 24.4%
Petchem, 38.5%Oil & Gas,
0.6%
Retail, 10.0%
Digital Services, 23.0%
Media & Others, 3.5%
6
Refining & Marketing – Operating Environment
➢ Heightened crude volatility, fear of major supply disruptions
▪ Despite spikes avg. crude price down 10% QoQ to $ 61.9/bbl on weakening demand
▪ Light crude supply, strong FO impacted differentials
➢ Sharp QoQ margin recovery across fuel basket
▪ Singapore GRM at $ 6.5/bbl (+$ 3.0/bbl)
▪ Diesel and Jet kero cracks up sharply - impact of IMO 2020 with storage build of complaint fuel
▪ Unplanned outages in North America, turnarounds in Asia and Saudi run cuts
➢ 2019 global oil demand growth tracking 1.0 mb/d (down from 1.3 mb/d at the start of the year)
➢ YoY India oil demand up 2.6%
▪ MS +8.0%%, HSD -0.2%, ATF -2.0%
Soft global macro impacting demand; Supply disruptions and IMO support margins

7
Refining & Marketing – Segment Performance
➢ Segment EBITDA up 10% QoQ
➢ RIL outperformed Singapore GRM by $ 2.9/bbl,
premium narrowed
▪ Stronger Fuel Oil crack benefiting Singapore GRM
▪ Lower availability of heavy grades resulting in higher
crude cost
➢ Refinery throughput of 16.7 MMT, down 4% QoQ
➢ 1,385 fuel retail outlets
▪ TPO at 305 KLPM
▪ Strong YoY volume growth: HSD (+14%) / MS (+17%)
vs. industry growth of (-0.2%) / (+8%)
6,095
5,152 5,659
9.5
8.1
9.4
0
2
4
6
8
10
-
2,000
4,000
6,000
8,000
2Q FY19 1Q FY20 2Q FY20
EBITDA (` crore) GRM ($/bbl)
Strength in fuel margins helped negate impact of lower crude throughput

8
Petrochemicals – Operating Environment
➢ Margin pressures with multiple headwinds
▪ New capacity additions in US and China
▪ US-China trade tensions and weaker global trade
▪ Increasing environmental related concerns
➢ Weak margins for key products
▪ PE (-9%), PP (-44%), PX (-13%), PTA (-16%)
➢ Domestic petrochemicals demand remained firm despite slower economic growth
▪ Polymer demand up 5% YoY - supported by packaging, and water management projects
▪ Polyester demand up 9% YoY - led by strong seasonal PET demand (+31%)
Well supplied markets and weaker economic activity led to subdued margin environment

9
Petrochemicals – Segment Performance
➢ Segment EBITDA up 1.3% QoQ
➢ Operating performance supported by
▪ Higher volumes at 9.9 MMT, up 13% QoQ
▪ Strength in POY (+8%), MEG (+10%), PVC (+29%)
▪ Beneficial impact of light feed cracking : Ethane &
ROGC
▪ Healthy by-product credit for integrated naphtha
crackers
➢ Polyester chain margins below 5-year average
▪ Supply led weakness in PX, moderation in PTA
margins
9,477 8,810 8,927
21.723.4 23.2
0
6
12
18
24
-
4,000
8,000
12,000
2Q FY19 1Q FY20 2Q FY20
EBITDA (` crore) EBITDA Margin (%)
Robust integration and feedstock flexibility help sustain performance
10
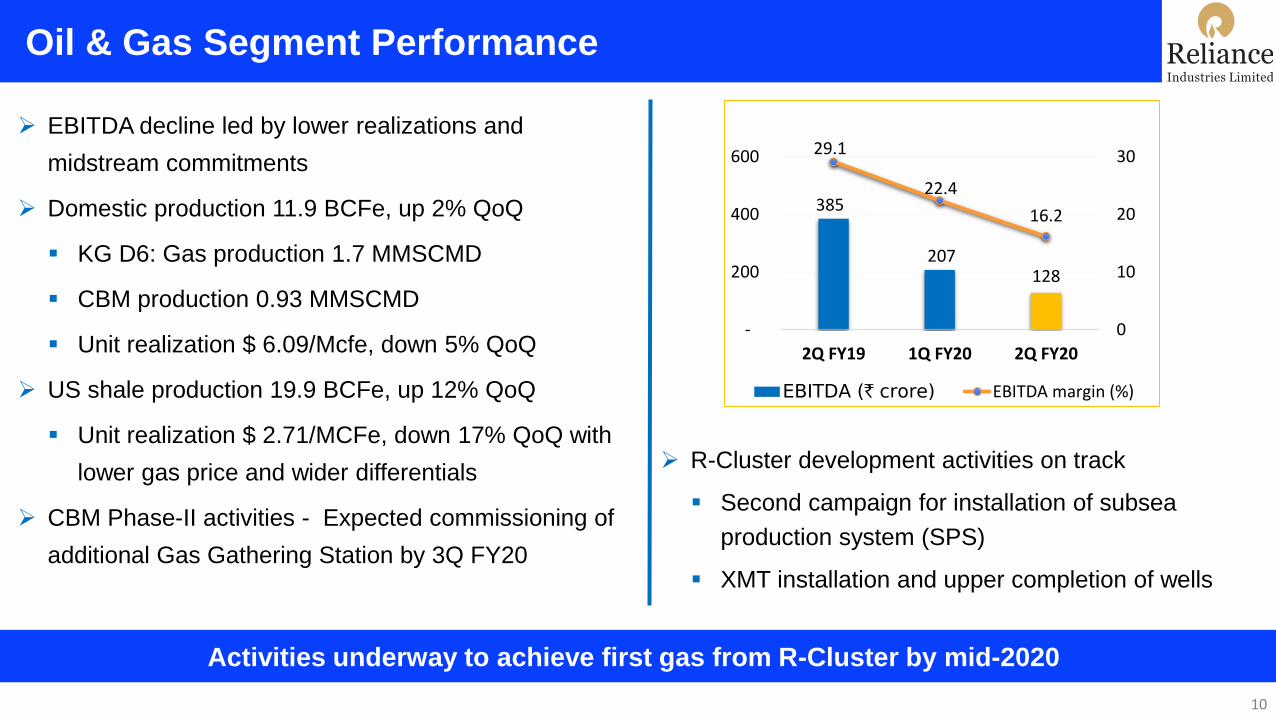
Oil & Gas Segment Performance
Activities underway to achieve first gas from R-Cluster by mid-2020
➢ EBITDA decline led by lower realizations and
midstream commitments
➢ Domestic production 11.9 BCFe, up 2% QoQ
▪ KG D6: Gas production 1.7 MMSCMD
▪ CBM production 0.93 MMSCMD
▪ Unit realization $ 6.09/Mcfe, down 5% QoQ
➢ US shale production 19.9 BCFe, up 12% QoQ
▪ Unit realization $ 2.71/MCFe, down 17% QoQ with
lower gas price and wider differentials
➢ CBM Phase-II activities - Expected commissioning of
additional Gas Gathering Station by 3Q FY20
385
207 128
29.1
22.4
16.2
0
10
20
30
-
200
400
600
2Q FY19 1Q FY20 2Q FY20
EBITDA (` crore) EBITDA margin (%)
➢ R-Cluster development activities on track
▪ Second campaign for installation of subsea
production system (SPS)
▪ XMT installation and upper completion of wells

11
Retail Segment Performance
14th straight quarter of revenue and profit growth
1,392
2,049 2,322 4.8
6.06.3
0
2
4
6
-
600
1,200
1,800
2,400
3,000
2Q FY19 1Q FY20 2Q FY20
EBITDA (` crore) EBITDA Margin (%)
➢ Trends Small Town crosses 100 store milestone
➢ SMART crosses 200 store milestone
➢ Hamley’s in India crossed a milestone of 100
stores
➢ Turnover at ₹ 41,202 crore, up 27% YoY, 7.9% QoQ
▪ Strong growth across consumption baskets amidst
consumption slowdown
▪ Strong LFL growth of 5-14%
▪ F&L, Consumer Electronics & Grocery demonstrated
higher growth at 35% YoY; now contributes >60% of the
business
➢ F&L, Consumer Electronics & Grocery EBITDA margin at
8.8% vs 7.0% last year, contributing 86% of overall
EBITDA
▪ Customer centricity enabling superior growth
▪ Scale and operational efficiencies in sourcing, supply
chain
▪ Expansion in Tier 3 & 4 markets, with early break-even
12
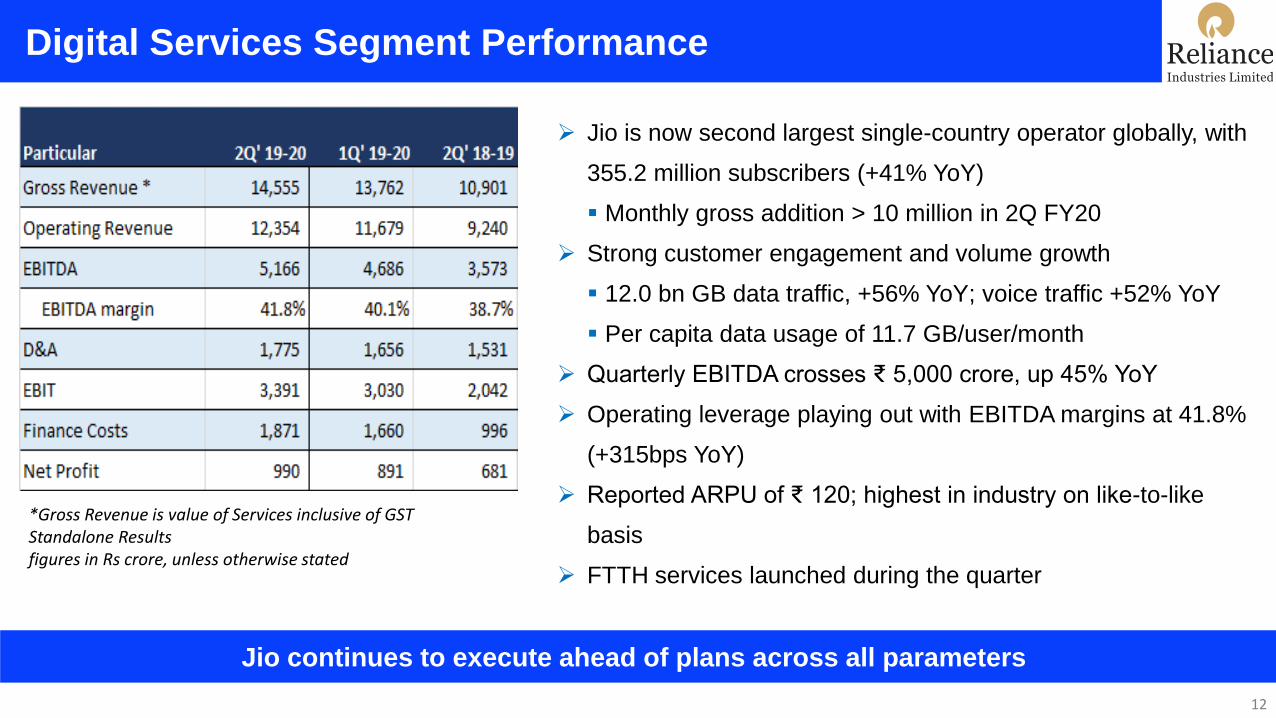
Digital Services Segment Performance
Jio continues to execute ahead of plans across all parameters
➢ Jio is now second largest single-country operator globally, with
355.2 million subscribers (+41% YoY)
▪ Monthly gross addition > 10 million in 2Q FY20
➢ Strong customer engagement and volume growth
▪ 12.0 bn GB data traffic, +56% YoY; voice traffic +52% YoY
▪ Per capita data usage of 11.7 GB/user/month
➢ Quarterly EBITDA crosses ₹ 5,000 crore, up 45% YoY
➢ Operating leverage playing out with EBITDA margins at 41.8%
(+315bps YoY)
➢ Reported ARPU of ₹ 120; highest in industry on like-to-like
basis
➢ FTTH services launched during the quarter
*Gross Revenue is value of Services inclusive of GSTStandalone Resultsfigures in Rs crore, unless otherwise stated

13
Reliance – Saudi Aramco Partnership for O2C Division
Strong synergies between global leaders in oil production and O2C
➢ Aramco will invest for a 20% stake in RIL’s O2C division at an EV of $75 billion
▪ O2C division comprises Refining and Petrochemicals assets, including Petro-retail JV with BP
➢ The investment is subject to due diligence, definitive agreements, regulatory and other customary approvals
Partnership
➢ Partnership to leverage strengths in feedstock integration, technology, project execution and product innovation
➢ Aramco to supply 500 kbpd of crude on a long term basis to RIL’s Jamnagar refinery
▪ Several grades of crude oil from super light to heavy better utilizing refinery capabilities
▪ Value creation through crude sourcing and supply security
➢ Aramco to participate in Indian market growth through stake in RIL’s strong domestic franchise
➢ O2C value chain to maximize margins and meet the evolving needs of consumers
▪ Supply of energy, base chemicals and new materials
Highlights

14
Reliance – BP : JV for fuel-retailing
Expansion of the existing nationwide network of 1,400 fuel retailing outlets to 5,500
➢ RIL and BP to form a petroleum retailing joint venture
▪ RIL to hold 51% and BP to hold 49%
➢ The joint venture will assume ownership of RIL’s existing fuel network and aviation fuel business
➢ The transaction is expected to complete in 1H CY20 subject to regulatory and other customary approvals
The Transaction
➢ To offer high quality differentiated fuels and services at its network of sites
➢ JV to benefit from RIL’s extensive retail business experience and digital connectivity through its Jio platform
➢ BP to bring in its international experience in convenience, fuel retailing and aviation operations
➢ JV to also benefit from access to competitive fuel supplies from RIL’s Jamnagar refining complex
JV Highlights

Refining &Marketing
15
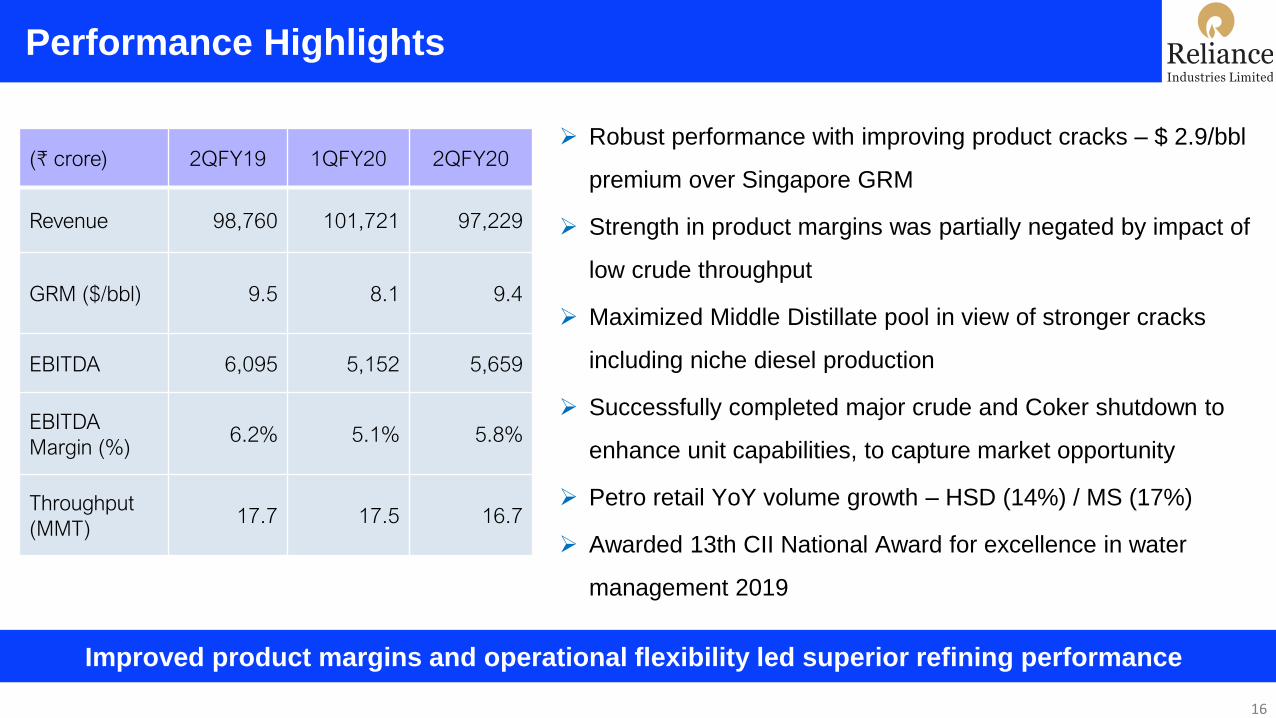
Performance Highlights
Improved product margins and operational flexibility led superior refining performance
(₹ crore) 2QFY19 1QFY20 2QFY20
Revenue 98,760 101,721 97,229
GRM ($/bbl) 9.5 8.1 9.4
EBITDA 6,095 5,152 5,659
EBITDA
Margin (%)6.2% 5.1% 5.8%
Throughput
(MMT)17.7 17.5 16.7
16
➢ Robust performance with improving product cracks – $ 2.9/bbl
premium over Singapore GRM
➢ Strength in product margins was partially negated by impact of
low crude throughput
➢ Maximized Middle Distillate pool in view of stronger cracks
including niche diesel production
➢ Successfully completed major crude and Coker shutdown to
enhance unit capabilities, to capture market opportunity
➢ Petro retail YoY volume growth – HSD (14%) / MS (17%)
➢ Awarded 13th CII National Award for excellence in water
management 2019
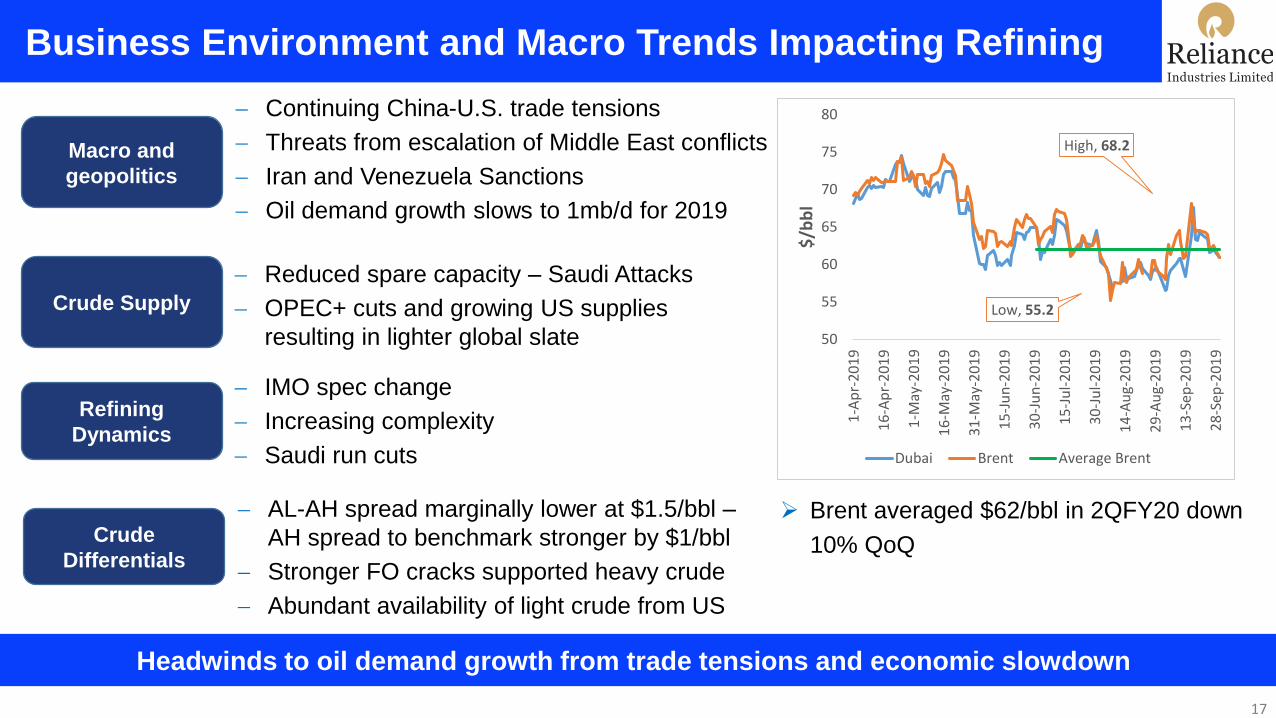
Business Environment and Macro Trends Impacting Refining
17
Headwinds to oil demand growth from trade tensions and economic slowdown
➢ Brent averaged $62/bbl in 2QFY20 down
10% QoQ
Crude Supply
Refining
Dynamics
Macro and
geopolitics
− Reduced spare capacity – Saudi Attacks
− OPEC+ cuts and growing US supplies
resulting in lighter global slate
− Continuing China-U.S. trade tensions
− Threats from escalation of Middle East conflicts
− Iran and Venezuela Sanctions
− Oil demand growth slows to 1mb/d for 2019
− IMO spec change
− Increasing complexity
− Saudi run cuts
High, 68.2
Low, 55.2
50
55
60
65
70
75
80
1-A
pr-
201
9
16
-Ap
r-2
01
9
1-M
ay-2
01
9
16
-May
-20
19
31
-May
-20
19
15
-Ju
n-2
01
9
30
-Ju
n-2
01
9
15
-Ju
l-2
01
9
30
-Ju
l-2
01
9
14
-Au
g-2
01
9
29
-Au
g-2
01
9
13
-Sep
-20
19
28
-Sep
-20
19
$/b
bl
Dubai Brent Average Brent
Crude
Differentials
− AL-AH spread marginally lower at $1.5/bbl –
AH spread to benchmark stronger by $1/bbl
− Stronger FO cracks supported heavy crude
− Abundant availability of light crude from US
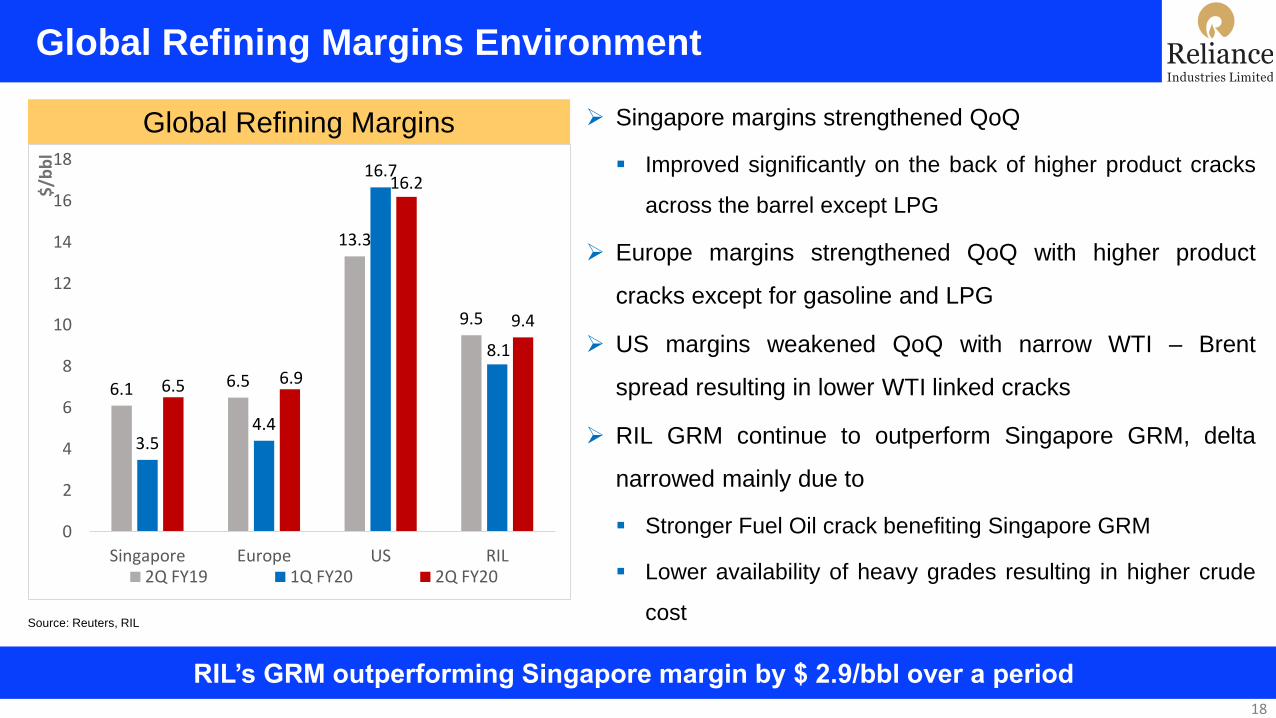
Global Refining Margins Environment
RIL’s GRM outperforming Singapore margin by $ 2.9/bbl over a period
➢ Singapore margins strengthened QoQ
▪ Improved significantly on the back of higher product cracks
across the barrel except LPG
➢ Europe margins strengthened QoQ with higher product
cracks except for gasoline and LPG
➢ US margins weakened QoQ with narrow WTI – Brent
spread resulting in lower WTI linked cracks
➢ RIL GRM continue to outperform Singapore GRM, delta
narrowed mainly due to
▪ Stronger Fuel Oil crack benefiting Singapore GRM
▪ Lower availability of heavy grades resulting in higher crude
cost
Global Refining Margins
Source: Reuters, RIL
18
6.1 6.5
13.3
9.5
3.5 4.4
16.7
8.1
6.5 6.9
16.2
9.4
0
2
4
6
8
10
12
14
16
18
Singapore Europe US RIL2Q FY19 1Q FY20 2Q FY20
$/b
bl

19
Refinery Product Margins
Strong rebound in fuel cracks driving regional marker margin
7.5
13 12.2
-9.1
-3.8
11.7
16.2 15.8
-7.8
-0.5
-15
-10
-5
0
5
10
15
20
Gasoline Gasoil Jet Kero Naphtha Fuel Oil
$/b
bl
1Q FY20 2Q FY20 ➢ Uplift in cracks across all products
▪ Mid-distillates cracks led by run-up to IMO
changes and unplanned refinery outages
▪ Gasoline strengthened on heavy seasonal
demand, PES outage and Saudi run-cuts
▪ FO cracks supported by ME power demand
and declining supply in anticipation of IMO
▪ Naphtha cracks improved marginally due to
increased gasoline blending demand
➢ Delay in refinery start-ups supported margins

20
Robust Domestic Fuel Demand Growth
Growth in domestic transportation fuel demand for RIL despite stable oil demand
6.9
18.8
2.0
7.5
18.8
2.0
-
5
10
15
20
25
MS HSD ATF
Q2 FY19 Q2 FY20
8%
-2.0%
MM
T
➢ India oil product demand grew 2.6% in 2Q FY20
▪ Preference for petrol driven vehicles due to narrow price
difference with diesel
▪ Heavy rainfall in the country has severely affected
economic activities
MM
T
➢ Higher captive and export sales with
optimized inventory levels
➢ Continued strong retail and bulk sales
despite stable domestic demand
Source: PPAC
Domestic Demand Y-o-Y RIL refinery product sales Y-o-Y
-0.2%
10.1
4.1
1.52.0
10.8
4.5
2.11.2
-
2.0
4.0
6.0
8.0
10.0
12.0
Exports Captive TransportationFuel
OtherDomestic
Q2 FY19 Q2 FY20

Domestic Marketing
Industry leading growth driven by strong customer proposition and strengthened network
➢ Strong YoY volume growth: HSD (14%) / MS (17%) vs. Industry growth of (-0.2%) / (+8%)
➢ Focused emphasis on big ticket Fleet Customers led to total growth of 36% YoY
➢ E-Com Network increased to 510 ROs; Over 350% YoY volume growth
21
➢ 11% YoY Volume growth in direct sales to airline partners against industry degrowth of 2%
➢ Driving ATF volumes via network growth, leveraging seasonal volumes, logistics optimization
➢ 34% YoY growth in Packed & Bulk LPG segments with strengthened network
➢ 14% YoY volume growth across sectors against industry growth of 2%
➢ Reinforced priority partner position with railways
➢20% YoY growth in Non-Railway sector with continued focus on STU and Infra segment
IMO 2020 – Significant Opportunity for Complex Refiners
IMO 2020 Implementation on track
➢ IMO implementation beginning to play out in product markets
▪ Strong diesel cracks and premium of VLSFO
▪ Growing premium for heavy sweet crudes
➢ Product market disruptions indicative of high compliance expected for IMO spec change
22
RIL Preparedness for IMO changes
➢ Major turnarounds completed in 1H FY20 and units stabilized
➢ Higher capacity Coker operation established, further enhancement planned in 4Q
➢ Feedstock sourcing being optimized to take advantage of changing market with suitable terming
➢ Widening of crude blend window to process opportunity blends
➢ Niche grades being launched to meet the changing market requirement

R&M Business Outlook
23
− Large capacity additions
1.6 mb/d (2019) and 1.0
mb/d (2020)
− Reduced heavy crude
supply due to sanctions
− Higher freight due to IMO
and COSCO Sanctions
− Oil demand to grow by
1.0 mb/d (2019) and 1.2
mb/d (2020)
− OPEC+ cuts,
geopolitical uncertainty,
trade tensions,
increased US supply
− Continued demand growth for
transportation fuels in EMs
− Additional distillate demand
from IMO spec change
− VGO diversion for IMO to
support gasoline in near term
− Sulfur discount on feedstocks
− RIL is well placed to take
advantage of emerging
market scenarios by
▪Enhanced coker capacity
prior to IMO
▪Versatile and flexible kit in
terms of feedstock and
products
▪Maximizing distillate yields
Challenges Macro trends Refining drivers Positioning
Constructive outlook with IMO spec change, reduced crude tightness, delays in new capacities

PetrochemicalsPolymers & Polyesters
24

Financial and Operating Performance
Source: RIL internal estimates 25
(₹ crore) 2QFY19 1QFY20 2QFY20
Production
(MMT)9.4 8.7 9.9
Revenue 43,745 37,611 38,538
EBITDA 9,477 8,810 8,927
EBITDA
Margin (%)21.7% 23.4% 23.2%
➢ QoQ volume growth of 13% offset margin weakness
▪ Volume growth led by polyester intermediates (+27%) with restart of
units after turnaround
➢ Feedstock flexibility and agile operations boosted performance
▪ Cost optimization through low cost ethane cracking and ROGC
▪ Healthy by-product credit benefitted integrated naphtha crackers
➢ Strength in agriculture and consumer related segments
▪ Vinyls and polyester helped offset margin weakness arising from
durables, packaging sectors
▪ QoQ margin higher in PVC (+29%), MEG (+10%), POY (+8%)
▪ QoQ margin lower in PP (-44%), PET (-17%), PTA (-16%),
PX (-13%), PE (-9%)
Robust integration and feedstock flexibility mitigating margin volatility

Business Environment 2Q FY20
Source: RIL internal estimates 26
Polymer Chain
➢ Continued US-China trade concerns offer opportunity for cost-efficient producers to capture market share
➢ Global Ethylene demand growth starting to lag global supply growth with significant capacity addition
➢ Integrated naphtha crackers in Asia regained edge amidst healthy by-product credit
➢ On-purpose PDH units in NE Asia restarted with healthy fundamentals; supporting new capacity builds
➢ Despite economic headwinds, India registered moderate polymer demand growth (~5% up YoY)
Polyester Chain
➢ Asian PX prices remained soft with volatile crude oil prices and excess supply in China
➢ Unplanned maintenance in Chinese PTA units helped sustained margins above 5-year avg
➢ Falling MEG port inventory in China and volatile energy markets supported prices and margins
➢ Domestic Polyester demand growth increased ~9% YoY led by firm PET and Filament demand

Cracker Feedstock Economics
0
200
400
600
800
1000
Integrated Ethane Cracker Integrated Propane Cracker Integrated Naphtha Cracker
High Butadiene co-
product credit
Seasonal Propane Winter Spike
US Ethane
Export
Terminal
Start-up
Gap Between Ethane & Naphtha/LPG
margins large at higher crude levels
Margin
strength with
lower
Feedstock
Prices
SE
A E
thyle
ne
Ma
rgin
s (
$ / M
T)
27
Feedstock flexibility provides a unique competitive advantage to RIL

Polymers
28

(Source: Platts, ICIS, IHS Markit)
➢ Well supplied global markets and weak sentiments led to subdued
operating rates and overall decline in prices
▪ HDPE margins over naphtha declined 9% QoQ
➢ US-China trade conflict impacting export demand from China
▪ ~56% PE finished goods export from China to US likely to be
impacted in 2019
➢ Domestic PE industry observing healthy growth (up 7% YoY)
▪ Demand from fertilizer packaging, water management projects
for irrigation and retail packaging – supported by good monsoon
➢ RIL PE production remained stable – ROGC LLDPE plant
undergone planned reliability shutdown
Polyethylene – Impacted by New Supplies
29
HDPE-Naphtha
557
461 419
0
200
400
600
800
2Q FY19 1Q FY20 2Q FY20
$/M
T
HDPE-Naphtha 5 Year Avg
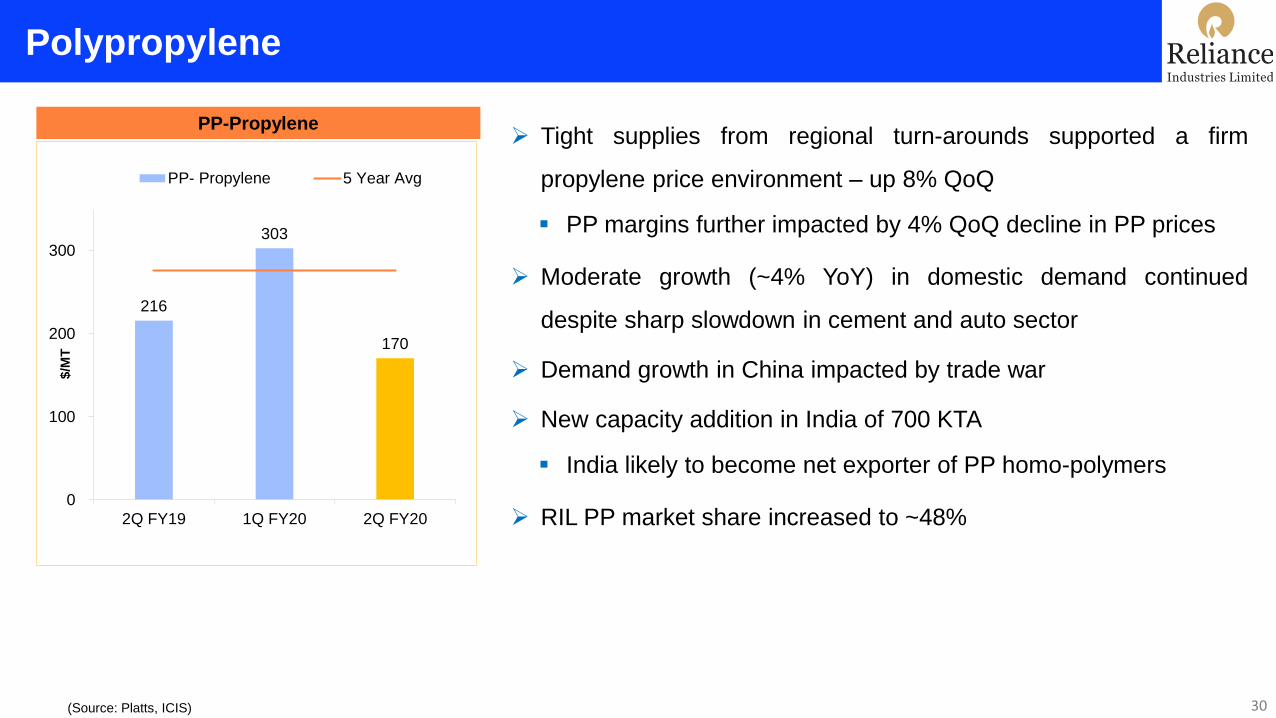
(Source: Platts, ICIS)
PP-Propylene➢ Tight supplies from regional turn-arounds supported a firm
propylene price environment – up 8% QoQ
▪ PP margins further impacted by 4% QoQ decline in PP prices
➢ Moderate growth (~4% YoY) in domestic demand continued
despite sharp slowdown in cement and auto sector
➢ Demand growth in China impacted by trade war
➢ New capacity addition in India of 700 KTA
▪ India likely to become net exporter of PP homo-polymers
➢ RIL PP market share increased to ~48%
Polypropylene
30
216
303
170
0
100
200
300
2Q FY19 1Q FY20 2Q FY20
$/M
T
PP- Propylene 5 Year Avg
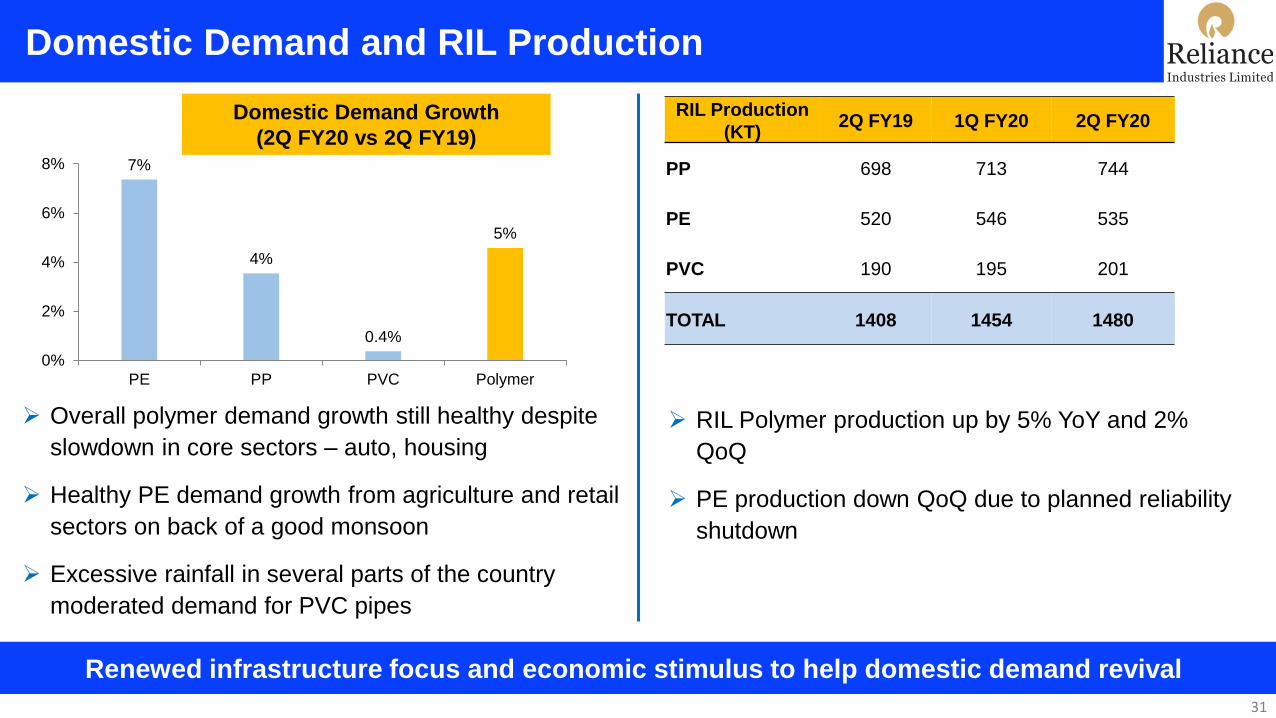
➢ Overall polymer demand growth still healthy despite
slowdown in core sectors – auto, housing
➢ Healthy PE demand growth from agriculture and retail
sectors on back of a good monsoon
➢ Excessive rainfall in several parts of the country
moderated demand for PVC pipes
Domestic Demand Growth
(2Q FY20 vs 2Q FY19)
7%
4%
0.4%
5%
0%
2%
4%
6%
8%
PE PP PVC Polymer
31
Domestic Demand and RIL Production
RIL Production
(KT)2Q FY19 1Q FY20 2Q FY20
PP 698 713 744
PE 520 546 535
PVC 190 195 201
TOTAL 1408 1454 1480
➢ RIL Polymer production up by 5% YoY and 2%
QoQ
➢ PE production down QoQ due to planned reliability
shutdown
Renewed infrastructure focus and economic stimulus to help domestic demand revival
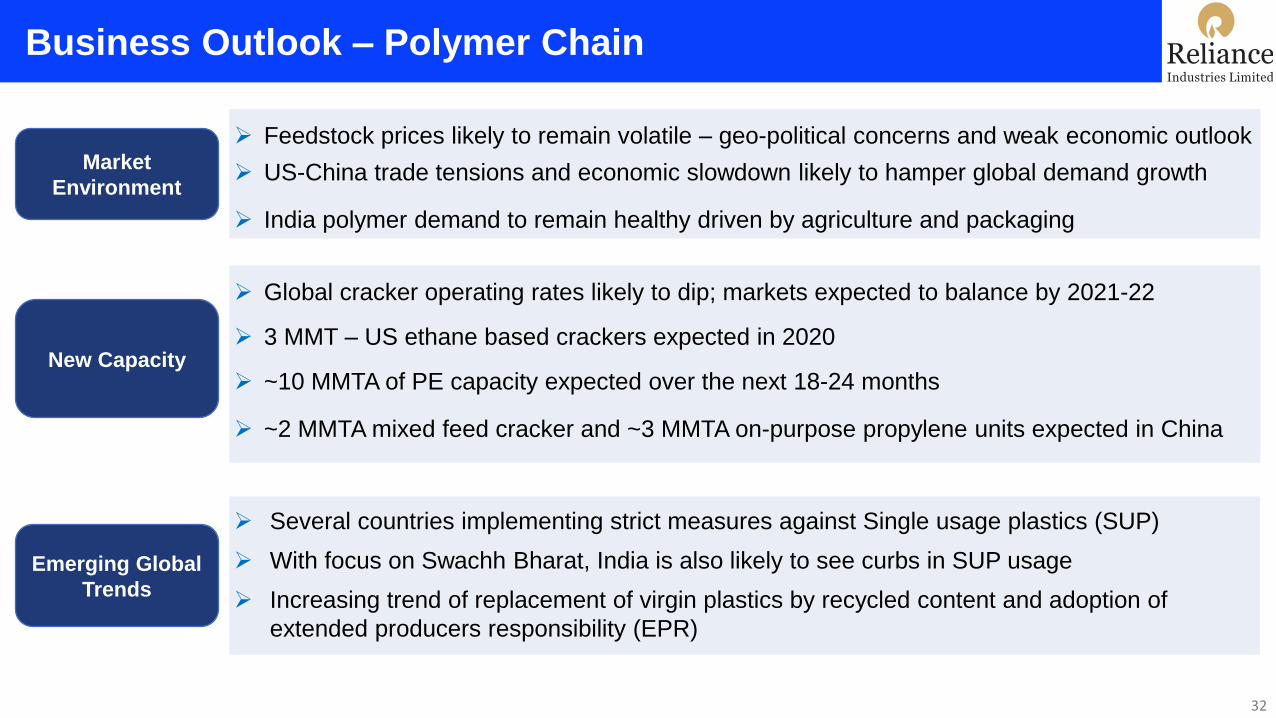
Business Outlook – Polymer Chain
32
➢ Feedstock prices likely to remain volatile – geo-political concerns and weak economic outlook
➢ US-China trade tensions and economic slowdown likely to hamper global demand growth
➢ India polymer demand to remain healthy driven by agriculture and packaging
➢ Global cracker operating rates likely to dip; markets expected to balance by 2021-22
➢ 3 MMT – US ethane based crackers expected in 2020
➢ ~10 MMTA of PE capacity expected over the next 18-24 months
➢ ~2 MMTA mixed feed cracker and ~3 MMTA on-purpose propylene units expected in China
Market
Environment
New Capacity
Emerging Global
Trends
➢ Several countries implementing strict measures against Single usage plastics (SUP)
➢ With focus on Swachh Bharat, India is also likely to see curbs in SUP usage
➢ Increasing trend of replacement of virgin plastics by recycled content and adoption of
extended producers responsibility (EPR)

Polyester Chain
33

Integrated Polyester Margin
0
100
200
300
400
500
600
700
800
900
2Q FY19 1Q FY20 2Q FY20
$/M
T
PX delta for PES PTA delta for PES
MEG delta for PES Wt. Avg PES delta
5 Yr Avg Chain Term Delta
*Last 5 year Avg Margin
Integrated operations aid weathering of market uncertainties
Chain margin Sustains With Lower Volatility QoQ
34
618
850
668
➢ PX price and margins under pressure
▪ Concerns around new supply and feedstock volatility
➢ Tight PTA supply supported prices, despite weak PX
▪ Margins above 5 year average supporting chain margin
➢ Reduction in port inventory and disciplined Chinese domestic
output improved MEG margins
➢ Polyester margins sustained in fluctuating raw material
environment
▪ Downstream polyester deltas above 5 year average

(Source: Platts, ICIS)
PSF-PTA/MEGPOY-PTA/MEG PET-PTA/MEG
320
286308
0
50
100
150
200
250
300
350
$/M
T
POY-PTA/MEG 5 Year Avg
144
185
167
0
50
100
150
200
250
$/M
T
PSF-PTA/MEG 5 Year Avg
204186
155
0
50
100
150
200
250
300
350
$/M
T
PET-PTA/MEG 5 Year Avg
➢ Low inventory levels, firm demand and weak intermediate prices supported POY margins
➢ PSF margins declined with subdued demand impacting end realizations
➢ Fluctuations in feedstock prices limited uptrend in PET prices, despite healthy seasonal demand
Polyester Delta Scenario
35

Domestic Demand Growth
(2Q FY20 vs 2Q FY19)
-1%
6%
31%
9%
PSF PFY PET Polyester
Domestic markets to continue healthy operating rates
Business Environment: Strong Revival
36
➢ Polyester demand growth at 9% YoY with low polyester price
▪ Producers maintained healthy operating rates
▪ PSF markets were stressed with increased imports from China
and ASEAN countries
➢ PET demand up 31% YoY – benefitting from rising beverage
consumption and extended summer
➢ RIL strategically maintains its market share with optimization of
product mix and increased exports

➢ Aromatics production increased 27% QoQ with higher capacity utilisation (planned turnaround in 1Q FY20)
➢ Polyester production stable amidst effective product mix and optimised inventory control
Production (KT) 2Q FY19 1Q FY20 2Q FY20
PX 1124 737 1186
PTA 1215 1180 1233
MEG 415 344 444
TOTAL 2755 2260 2863
Production (KT) 2Q FY19 1Q FY20 2Q FY20
POY 279 260 265
PSF 170 168 173
PET 289 295 292
TOTAL 738 723 730
RIL maintained its market leadership with high operating rate and efficient inventory management
Polyester Chain – Operational Highlights

➢ US-China trade dispute developments to have cascading effect across polyester chain
➢ PX markets to be guided by operational status of new capacities
➢ Rationalization of PTA operating rates in China likely to support margins
➢ Falling port inventories in MEG likely to support prices
➢ Polyester markets to witness healthy demand ahead of festive season and New Year holidays –
supporting prices and margins
Business Outlook – Polyester Chain
38

Oil & GasDomestic & Shale
39

Domestic E&P – Production Update
2Q FY20 (JV Production) KG D6 Panna Mukta CBM
Gas Production (Bcf) 5.45 11.69 3.03
Oil Production (mmbbl) - 0.96 -
Gas realization ($/mmbtu) 3.69 (GCV) 5.73 (NCV) 7.27(GCV)
Oil realization ($/bbl) - 63.94 -
Note: RIL share of total domestic production at 11.9 BCFe
KG D6
➢ Average Gas production from D1D3 field at 1.68 MMSCMD
➢ Field is in a late life stage and affected by low pressure and water ingress related challenges
Panna Mukta
➢ Average production : Gas at 3.6 MMSCMD; Oil at ~10,400 BOPD
➢ QoQ production up with higher number of production days and sustained well performance
CBM
➢ Produced 85.8 MMSCM (Average 0.93 MMSCMD) of Gas – 233 wells flowing
40

Other Updates
41
KG D6 – 3 Projects under development
On track for first gas in mid-2020. Key
development activities to start soon
• Second campaign for installation of
subsea production system (SPS)
• XMT installation and upper
completion of wells
• Tie in of 6 wells to SPS
• Top hole drilling completed for 3 out
of 5 wells
• Engineering and fabrication on
track for SPS
• First offshore installation campaign
planned in 3QFY20
• Engineering work for SPS, FPSO
and Subsea Installation in progress
• First phase of Drilling to commence
in 4QFY20
➢ Assignment of NIKO’s PI to RIL & BP is approved by GoI
CBM:
➢ Phase-II activities –Expected commissioning of additional Gas Gathering Station by 3Q FY20
➢ Hookup of 67 wells to be taken up progressively from 3Q FY20
OALP:
➢ Revenue Sharing Contract (RSC) signed for Block KG-UDWHP-2018/1 awarded to RIL and BP consortium
➢ Petroleum Exploration License (PEL) obtained and Joint Operating agreement under finalization with BP
R-Cluster Satellite Cluster MJ field

US Shale - Business Performance
42
2Q FY20 1Q FY20 2Q FY19% chg.
YoY1H FY20 1H FY19
% Chg vs.
1H FY19
Production (Bcfe) 19.9 17.8 21.2 -6% 37.7 45.0 -16%
Revenues ($ MM) 46 50 81 -43% 96 167 -43%
EBITDA ($ MM) -19 -14 13 -243% -33 32 -203%
➢ Blended realization down 17% QoQ and 33% YoY
▪ Decline across products : gas, condensate, NGLs
➢ Eagle Ford midstream commitments continue to
negatively impact EBITDA
➢ Volumes higher 11% QoQ driven by new wells put in
production
▪ 6 new wells in Marcellus and 8 in Eagle Ford
➢ 1 Rig and 1 Frac crew operational during 2Q FY20 in
each of the JVs
RelianceRetail
43
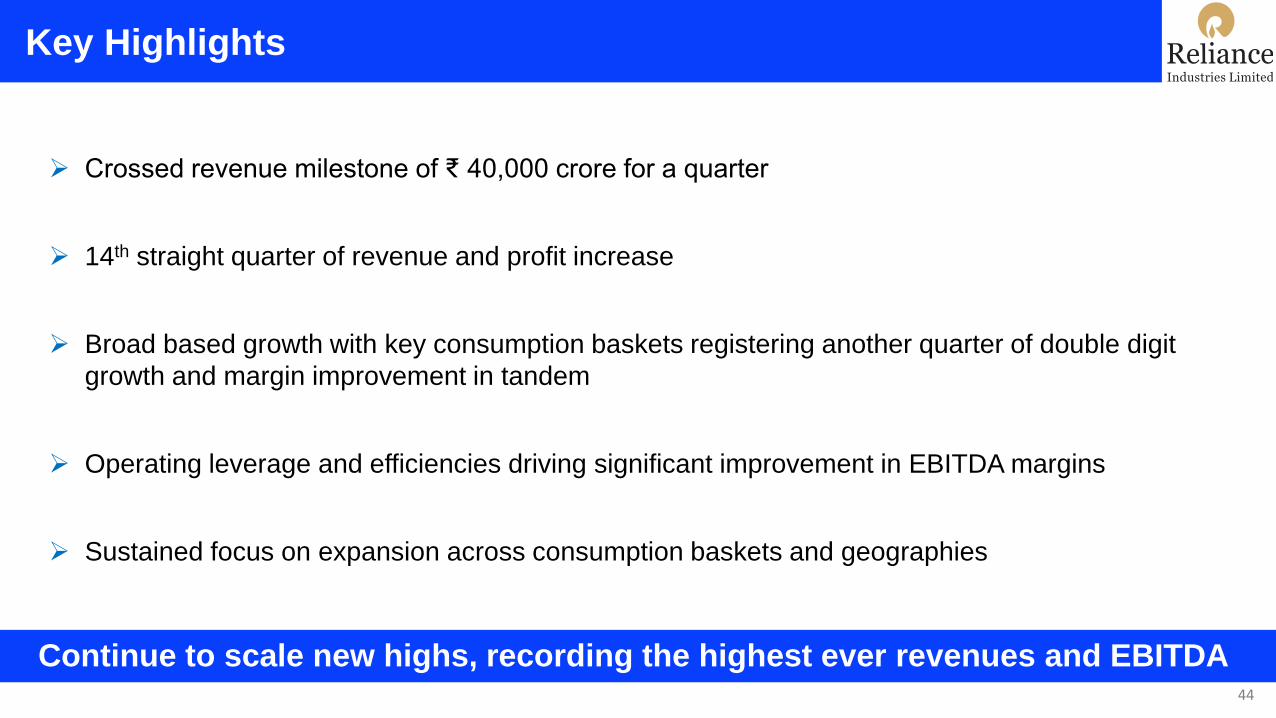
Key Highlights
Continue to scale new highs, recording the highest ever revenues and EBITDA
➢ Crossed revenue milestone of ₹ 40,000 crore for a quarter
➢ 14th straight quarter of revenue and profit increase
➢ Broad based growth with key consumption baskets registering another quarter of double digit
growth and margin improvement in tandem
➢ Operating leverage and efficiencies driving significant improvement in EBITDA margins
➢ Sustained focus on expansion across consumption baskets and geographies
44

Results Highlights
Strong growth in revenue and profit
2QFY20 2QFY19% Change wrt
2QFY19Metric 1HFY20 1HFY19
% Change wrt
1HFY19
41,202 32,436 27% Segment Gross Revenue 79,398 58,326 36%
36,972 28,832 28% Segment Net Revenue 71,209 51,940 37%
2,322 1,392 67% Segment EBITDA 4,371 2,598 68%
6.3% 4.8% + 150 bps Segment EBITDA Margin (%) 6.1% 5.0% + 110 bps
Quarterly Commentary
➢ Strong growth across consumption baskets amidst consumption slowdown
➢ Balanced growth coming from a healthy mix of LFL performance and new store openings
All Figures in ₹ Crore
45
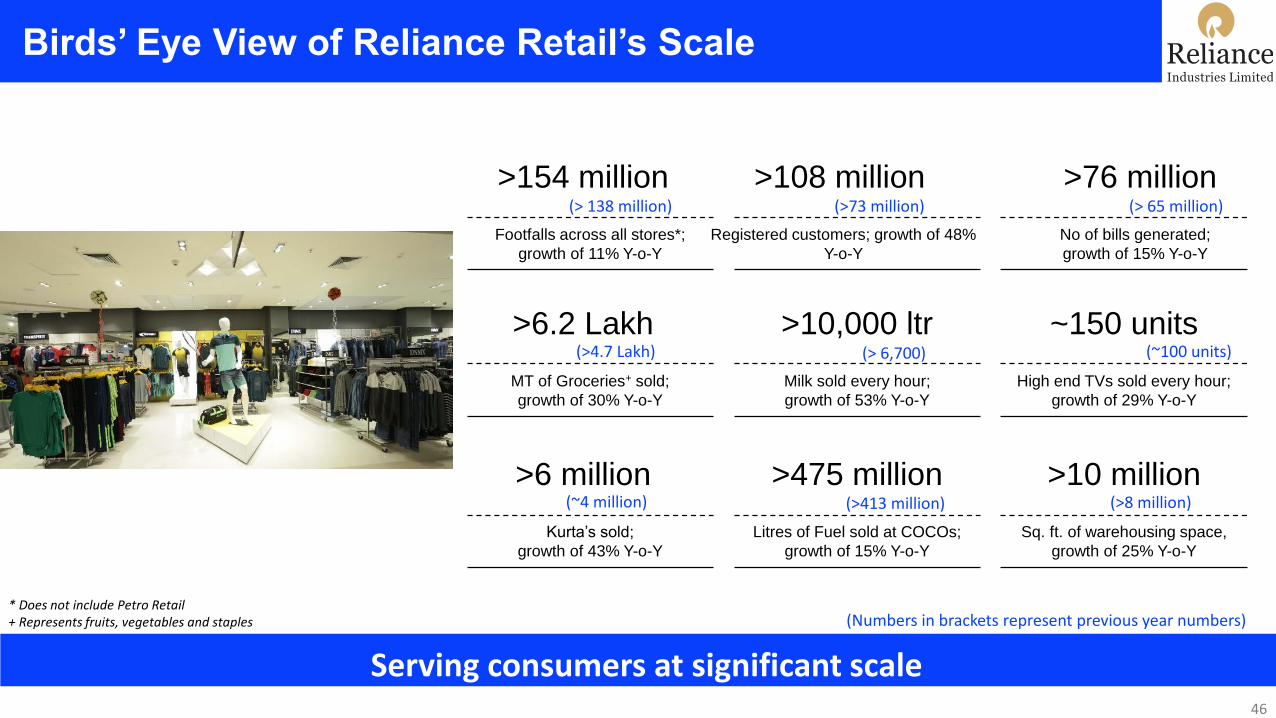
Serving consumers at significant scale
No of bills generated;
growth of 15% Y-o-Y
Footfalls across all stores*;
growth of 11% Y-o-Y
Milk sold every hour;
growth of 53% Y-o-Y
MT of Groceries+ sold;
growth of 30% Y-o-Y
High end TVs sold every hour;
growth of 29% Y-o-Y
Litres of Fuel sold at COCOs;
growth of 15% Y-o-Y
Kurta’s sold;
growth of 43% Y-o-Y
Sq. ft. of warehousing space,
growth of 25% Y-o-Y
>76 million>154 million
>10,000 ltr>6.2 Lakh ~150 units
>475 million >6 million >10 million
(> 138 million)
(>4.7 Lakh)
(~4 million) (>413 million)
(> 6,700)
(> 65 million)
(~100 units)
(>8 million)
(Numbers in brackets represent previous year numbers)* Does not include Petro Retail+ Represents fruits, vegetables and staples
Birds’ Eye View of Reliance Retail’s Scale
Registered customers; growth of 48%
Y-o-Y
>108 million(>73 million)
46

5,646 6,666 8,079
8,688 10,332
11,571
14,646
18,798
24,183
25,890
32,436 35,577 36,663
38,196 41,202
221 240 264 333 366 398 444 606
1,086 1,206
1,392
1,680 1,923
2,049
2,322
4Q 1Q 2Q 3Q 4Q 1Q 2Q 3Q 4Q 1Q 2Q 3Q 4Q 1Q 2Q
Sustaining Track Record of Growth and Profit
FY 2016-17 FY 2017-18
EBITDA
Gross Sales
47
Sales growth of
76% CAGR*
EBITDA growth of
96% CAGR*
* Annualised CAGR for 14 quarters
FY 2018-19 FY 2019-20
₹ Crores

Reliance Retail Store Network
Reliance Retail operates the most extensive store network in the country
Reliance Retail Store Count
*Does not include Petro Outlets
Consumption Baskets Sep 30, 2019 Sep 30, 2018
Fashion & Lifestyle 1,979 1,451
Consumer Electronics 8,249 7,126
Grocery 673 569
Total 10,901 9,146
Retail Area
In Mn SFT24.5 19.5
➢ Reliance Retail has the widest reach amongst
retailers with stores across 6,700+ cities & towns
➢ Added 337 stores during the quarter
➢ Rapid store expansion across all store concepts
➢ Trends Small Town crosses 100 store
milestone within 1 year of opening 1st store
➢ SMART crosses 200 store milestone;
launched 100 stores in last 15 months
➢ Hamley’s in India crossed a milestone of 100
stores
48

Key Drivers of Revenue Growth
Customer centricity enabling superior growth
➢ Rapid expansion of physical store presence and deepening roots in Tier 3 / Tier 4 markets
➢ Customer centric approach:
➢ Catchment focused assortment and wider choices
➢ Wide portfolio of store brands offering compelling value proposition
➢ Strengthening merchandising capabilities and closer ties with vendor partners
➢ Impactful consumer activations through new store openings and events
49

Key Drivers of EBITDA Margin Improvement
Operating leverage driving EBITDA margin
➢ Healthy like for like growth and improving sales
productivity across consumption baskets
➢ Scale and operational efficiencies in sourcing and
supply chain
➢ Expansion in Tier 3 / Tier 4 markets and early
break even in these markets
➢ Strengthening store brand portfolio across
categories
3.4%
4.8%
6.3%
2Q FY18 2Q FY19 2Q FY20
EBITDA Margin (%) Movement
50

Contribution from Consumption Baskets
11,032 13,221
3,076 3,257
10,532
13,459
5,426
8,147
2,370
3,119
2Q FY19 2Q FY20
Connectivity Petro Retail Consumer Electronics Grocery Fashion & Lifestyle
34%
10%
33%
17%
7%
8%
20%
33%
8%
32%
32,436
41,202
All Figures in ₹ Crore
% Mix % Mix
51

Fashion & Lifestyle
1,900+ Stores
400+ Cities
33 Mn+ Footfalls
in 2Q FY20
~50 International
Partner Brands
52
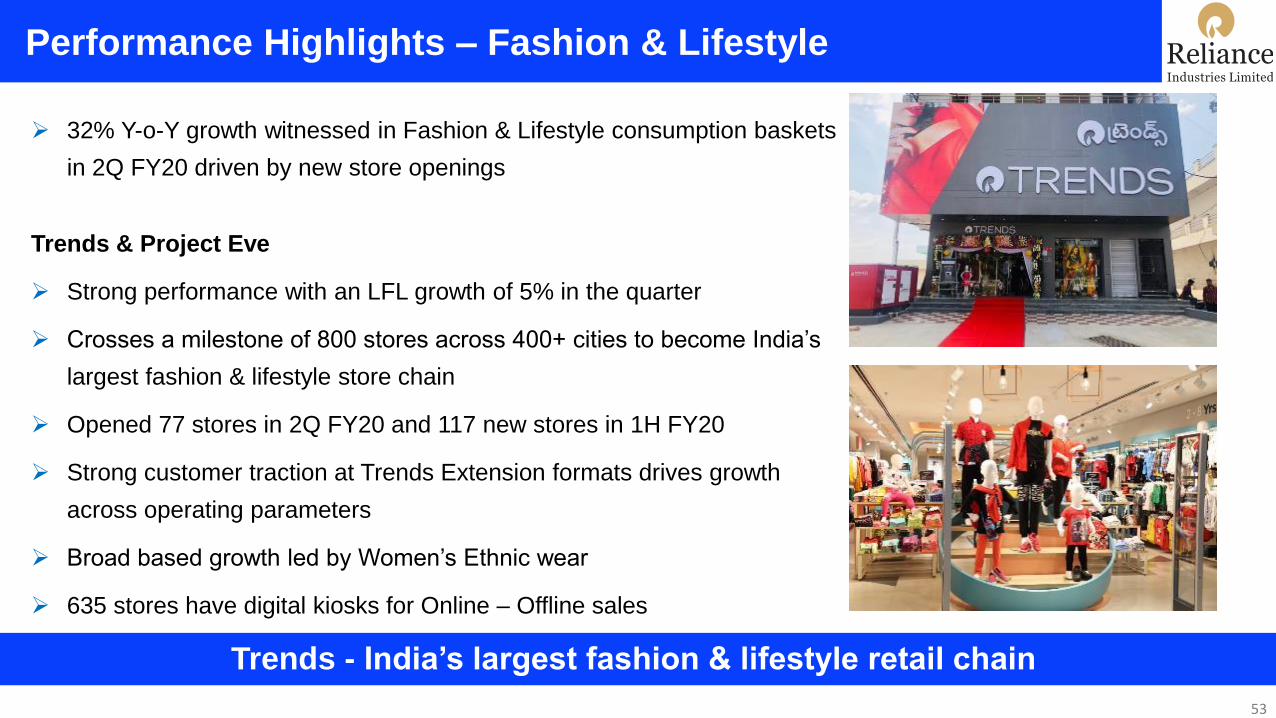
Performance Highlights – Fashion & Lifestyle
Trends - India’s largest fashion & lifestyle retail chain
➢ 32% Y-o-Y growth witnessed in Fashion & Lifestyle consumption baskets
in 2Q FY20 driven by new store openings
Trends & Project Eve
➢ Strong performance with an LFL growth of 5% in the quarter
➢ Crosses a milestone of 800 stores across 400+ cities to become India’s
largest fashion & lifestyle store chain
➢ Opened 77 stores in 2Q FY20 and 117 new stores in 1H FY20
➢ Strong customer traction at Trends Extension formats drives growth
across operating parameters
➢ Broad based growth led by Women’s Ethnic wear
➢ 635 stores have digital kiosks for Online – Offline sales
53
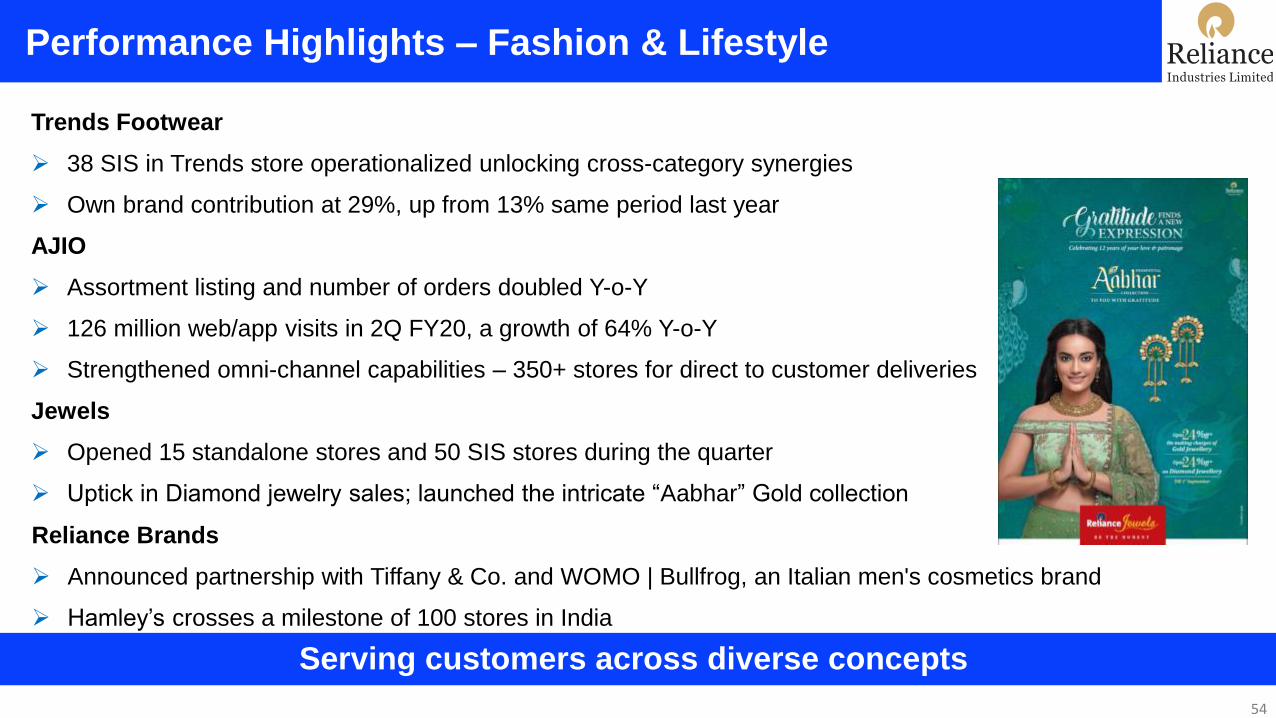
Performance Highlights – Fashion & Lifestyle
Serving customers across diverse concepts
Trends Footwear
➢ 38 SIS in Trends store operationalized unlocking cross-category synergies
➢ Own brand contribution at 29%, up from 13% same period last year
AJIO
➢ Assortment listing and number of orders doubled Y-o-Y
➢ 126 million web/app visits in 2Q FY20, a growth of 64% Y-o-Y
➢ Strengthened omni-channel capabilities – 350+ stores for direct to customer deliveries
Jewels
➢ Opened 15 standalone stores and 50 SIS stores during the quarter
➢ Uptick in Diamond jewelry sales; launched the intricate “Aabhar” Gold collection
Reliance Brands
➢ Announced partnership with Tiffany & Co. and WOMO | Bullfrog, an Italian men's cosmetics brand
➢ Hamley’s crosses a milestone of 100 stores in India
54

Consumer Electronics
8,000+ Stores
140 ResQ Service
Centers
6,700+ Cities
53 Mn+ Footfalls
in 2Q FY20
55
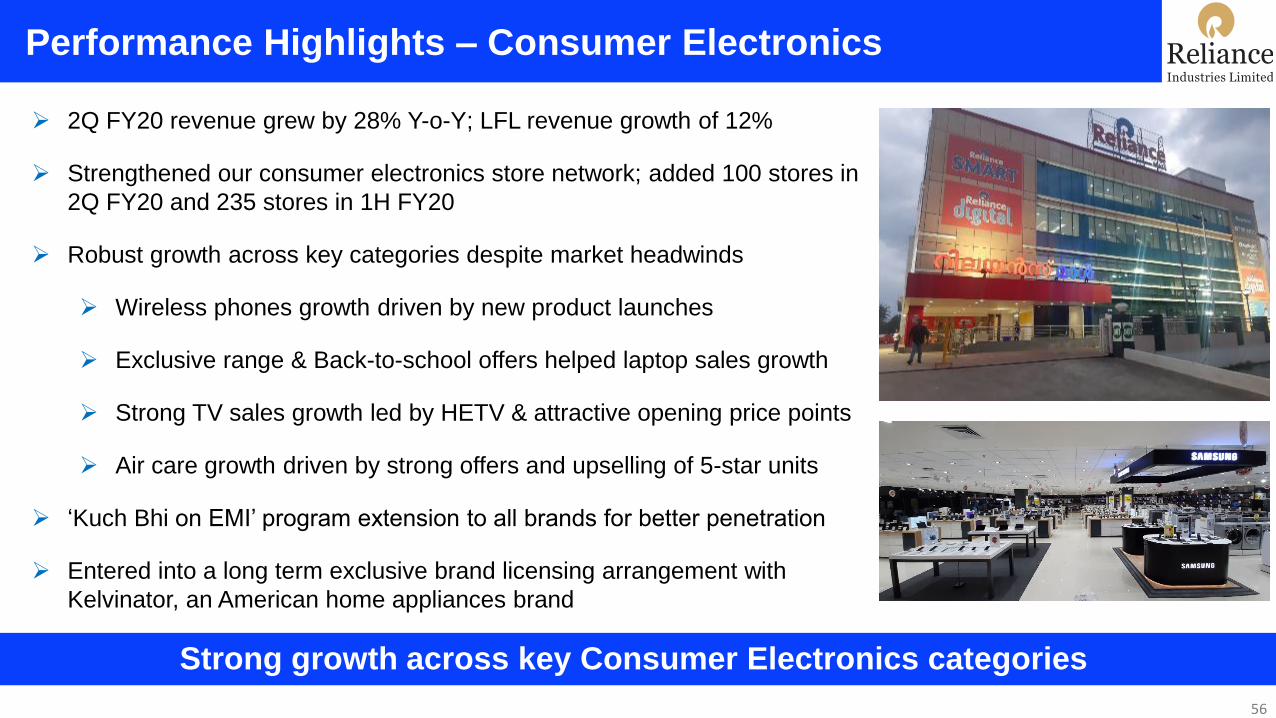
Performance Highlights – Consumer Electronics
Strong growth across key Consumer Electronics categories
➢ 2Q FY20 revenue grew by 28% Y-o-Y; LFL revenue growth of 12%
➢ Strengthened our consumer electronics store network; added 100 stores in
2Q FY20 and 235 stores in 1H FY20
➢ Robust growth across key categories despite market headwinds
➢ Wireless phones growth driven by new product launches
➢ Exclusive range & Back-to-school offers helped laptop sales growth
➢ Strong TV sales growth led by HETV & attractive opening price points
➢ Air care growth driven by strong offers and upselling of 5-star units
➢ ‘Kuch Bhi on EMI’ program extension to all brands for better penetration
➢ Entered into a long term exclusive brand licensing arrangement with
Kelvinator, an American home appliances brand
56

Performance Highlights – Consumer Electronics
Recorded highest ever daily sales during activation period
Golden Event Performance (10th to 15th Aug)
➢ Received over 3.6 million footfalls during ‘Digital India Sale’
➢ Strong sales growth recorded across segments
➢ 44% in Wireless Phones
➢ 38% in Laptop
➢ 117% in Air Care
➢ Specific interventions to heighten the customer experience (eg.
faster checkouts)
➢ Wider coverage for customer engagement across all channels
including print, TVC, radio, outdoor activation, online and CRM
57

Grocery
670+ Stores
13% share of Own
Brands
150+ Cities
60 Mn+ Footfalls in
2Q FY20
58

➢ 2Q FY20 revenue grew by 50% Y-o-Y; LFL revenue growth of 14%
➢ Opened 43 stores in 2Q FY20 and 65 stores in 1H FY20
➢ SMART stores crossed a milestone of 200 stores during the quarter
➢ Growth registered across all categories led by F&V, dairy and staples
➢ Strengthened store brand portfolio with new product launches
➢ Snactac Brand: Besan ladoo, Soan Papdi, Biscuits
➢ Goodlife Multigrain Atta, Petal Sanitary Pads and Shieldz Insecticide
➢ Received the Annapoorna Food Retailer of the Year Award 2019 conferred by
RAI and FICCI
Performance Highlights – Grocery
Accelerated expansion and strong LFL growth led to strong sales
59

Performance Highlights – Grocery
Registered strong sales growth of 46% on ‘Full Paisa Vasool’ event
Golden Events Performance (10th to 15th Aug)
➢ Received over 5.2 million footfalls during ‘Full Paisa Vasool’ Sale; increase in bills by 33%
➢ Registered strong growth across categories (staples: 58%, confectionery/snacks: 76%)
➢ Differentiated “Mix and Match” promotion across brands
60

Performance Highlights – Petro Retail Owned Outlets
Continues to deliver throughput higher than industry average
➢ 516 owned retail outlets operational as of Sep 30, 2019
➢ Witnessed strong volume growth YoY across petroleum
products
➢ HSD volume grew by 15% Y-o-Y
➢ MS volume grew by 17% Y-o-Y
➢ Roll out of BSVI Grade fuel in 11 Districts of Haryana
completed
➢ Trans-connect (loyalty program) customers contribute 36% of
sale
61

➢ Reliance Retail registered a strong performance underpinned by consistent strategy, sharp operational
execution and a robust business model
➢ Retail business recorded the highest ever revenues and EBITDA in a quarter
➢ In the context of a slowing growth environment, the business delivered robust revenue growth
➢ Strong improvement in operating profit with EBITDA growing at 67% and margin improving +150 bps
YoY
➢ Broad based growth with key Consumption Baskets registering another quarter of double digit growth and
margin improvement in tandem
➢ The business added 337 new stores during the quarter, taking the overall count to over 10,901 stores
Reliance Retail: 2Q FY 2019-20 Summary
Sustaining strong track record of performance: Consistent, Competitive, Profitable
62

Reliance Jio Infocomm Limited

Highlights
Jio continues to execute ahead of plans across all parameters64
1. Jio is World’s second largest single-country mobile operator
▪ Subscriber base at 355.2 million – net addition of 103 million in last 12 months
▪ JioPhone Diwali Offer to accelerate 2G to 4G transition
2. Crossed EBITDA of Rs 5,000 crore, with 41.8% ebitda margin
▪ On track to achieve 50% EBITDA margin
3. Robust data traffic growth of 56% YoY to 1202 crore GBs; voice traffic has grown 52% YoY
▪ Per capita data consumption of 11.7 GB per month
4. Investment cycle for Jio is now complete with mobility coverage nearing 99% of
population
1
2
3
4

Jio – Operator of Choice
Industry leading operating metrics –
usage numbers among the highest globally65
31.6 millionGross adds in 2Q FY20
240Customers added per
minute
11.7 GB/ 789 minsStrong Customer
engagement per month
Rs120Industry leading ARPU
(Like to Like)
Strong growth in data traffic (cr GBs)
378
771
1,202
Sep-17 Sep-18 Sep-19
CQGR 15.6%

Industry Leading Financial Metrics
Strong growth backed by operational efficiencies; key tailwinds in
place for FY20-2166
✓India’s largest mobile operator by revenue
Ebitda margin
41.8% (+315 bps YoY)
2QFY20 Revenue
Rs 12,354 crore
2QFY20 EBITDA
Rs 5,166 crore✓Improving Ebitda profile
✓Robust revenue growth
✓Operating leverage playing out
% growth YoY
33.7%
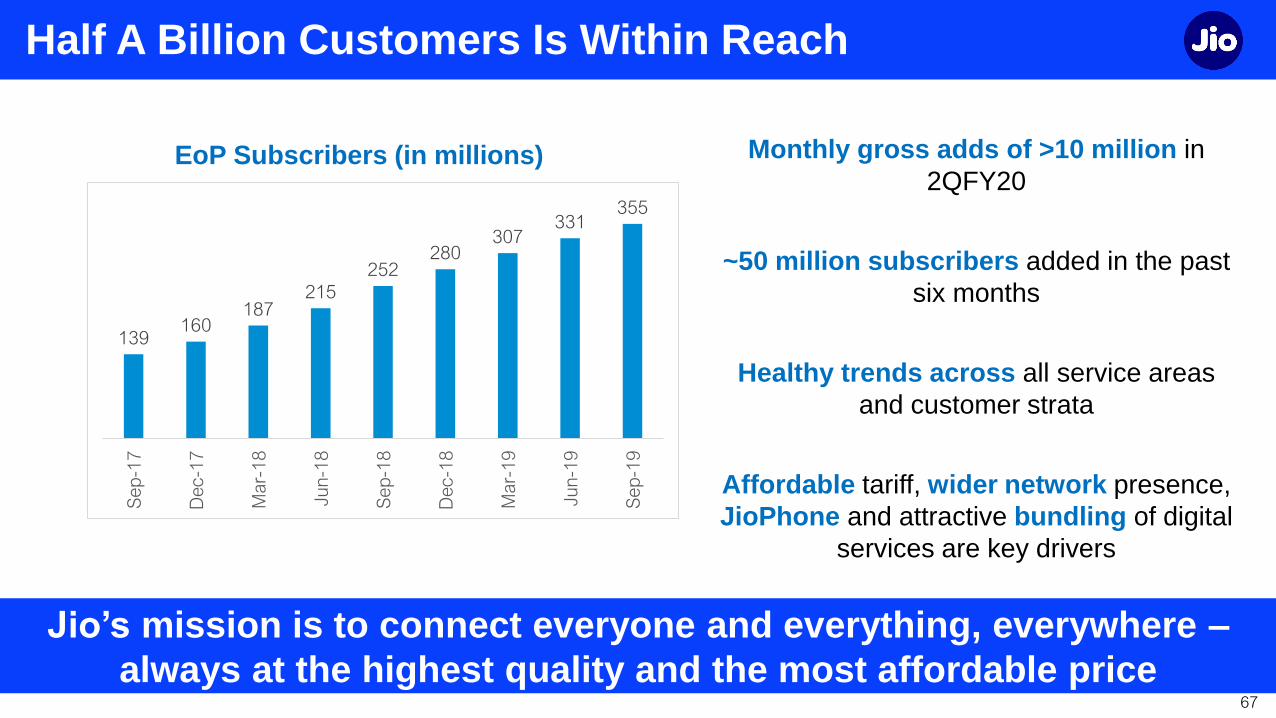
Half A Billion Customers Is Within Reach
Jio’s mission is to connect everyone and everything, everywhere –
always at the highest quality and the most affordable price67
Monthly gross adds of >10 million in
2QFY20
~50 million subscribers added in the past
six months
Healthy trends across all service areas
and customer strata
Affordable tariff, wider network presence,
JioPhone and attractive bundling of digital
services are key drivers
EoP Subscribers (in millions)
139160
187215
252280
307331
355
Se
p-1
7
Dec-1
7
Ma
r-1
8
Ju
n-1
8
Se
p-1
8
Dec-1
8
Ma
r-1
9
Ju
n-1
9
Se
p-1
9
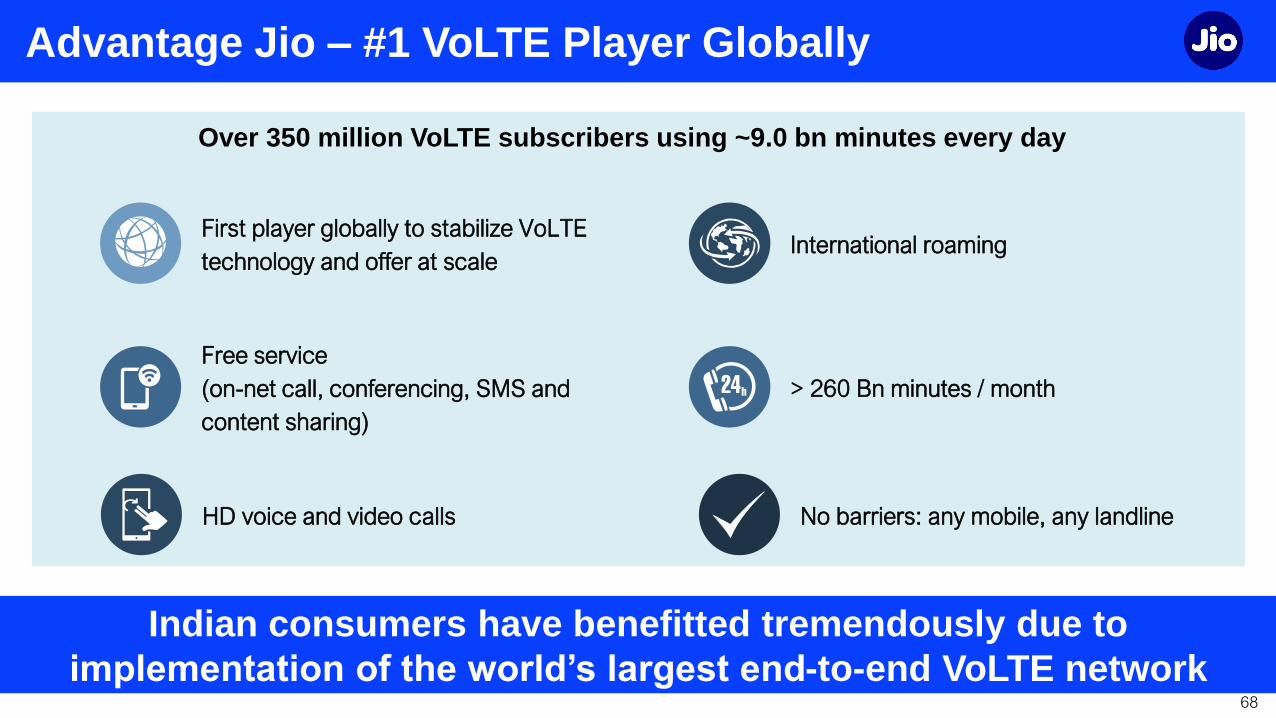
Advantage Jio – #1 VoLTE Player Globally
Indian consumers have benefitted tremendously due to
implementation of the world’s largest end-to-end VoLTE network68
Over 350 million VoLTE subscribers using ~9.0 bn minutes every day
> 260 Bn minutes / month
Free service
(on-net call, conferencing, SMS and
content sharing)
First player globally to stabilize VoLTE
technology and offer at scaleInternational roaming
HD voice and video calls No barriers: any mobile, any landline

Advantage Jio - Investment Cycle Is Complete
Multiple growth engines to bring true business potential to the fore69
➢ Invested ~Rs3.5 Lakh crore to create pan India digital infrastructure with largest fiber footprint
➢ Created world-class, legacy-free, fully scalable 4G Plus network
➢ With close to ~99% coverage, only demand driven investment required
➢ Platform set to benefit from operating leverage and superior returns

Advantage Jio – Network capacity and coverage
70
Jio has deployed > 750K eNodeBs across
800MHz, 1800MHz, and 2300MHz LTE bands
At current run rate, operator 2 and 3 would
take 3 / 18 years to catch-up, provided Jio
stopped adding capacity
Jio is the only operator with meaningful sub-
GHz LTE deployment
Besides higher RF capacity, extensive fiber
backhaul supports higher throughput
LTE Coverage & Capacity (radiating eNodeBs)
Jio Operator 1 Operator 2
Sub-GHz bands > 1GHz bands
~3.6x
~2.7x
Jio has significant lead in terms of coverage and capacity

Advantage Jio – Digital Ecosystem & Platforms
Holistic family of digital services platforms for all Indians71
Gateway App
Video
Music
Gaming and
EntertainmentCommunication
Home
Solutions
News
Others
Jio TV
Jio Saavn
Jio Chat
Jio News
VR and MR
Multi-Party
Video
Conferencing
Jio Smart
Home
Home
Security
Jio TV+
Jio Call
Jio Cloud
Jio Cinema
Jio Health Hub
Jio Net
Jio Security
My Jio
Jio Switch
Holistic Mobile First For all Indians

JioPhone Diwali Offer – To Accelerate 2G to 4G Transition
Digital inclusion for the underprivileged72
Over 70 million JioPhone subscribers
> 350 million subs still on 2G networks
To these subs, JioPhone made available at
special price of Rs 699
For the first 7 recharges, Jio will additionally
add Rs99 worth of data
“Jio will ensure that no Indian is deprived of
affordable Internet and the fruits of the Digital
Revolution”

FTTH Offering launched
Best bundled offering in the industry73
Plan Name Bronze Silver Gold Diamond Platinum Titanium
Monthly Plan ₹699 ₹849 ₹1,299 ₹2,499 ₹3,999 ₹8,499
Speed 100 Mbps 100 Mbps 250 Mbps 500 Mbps 1 Gbps 1 Gbps
Data
Unlimited
(100 GB+50
GB)
Unlimited
(200 GB+200
GB)
Unlimited
(500 GB+250
GB)
Unlimited
(1250 GB+250
GB)
Unlimited
(2,500 GB)
Unlimited
(5,000 GB)
Voice Free
TV Video Calling Included (worth ₹1,200/year)
Gaming Included (worth ₹1,200/year)
Home Networking Included
Device SecurityUp to 5 devices
(Worth ₹999/Year)
VR Experience
(IMMERSIVE)Platform Access Included
Premium ContentPlatform Access Included
(First-day first-show movies, special sports content)
Welcome Offer
Home DevicesIncluded Jio home gateway (worth ₹5,000) +Jio 4K set top box (worth ₹6,000)
OTT Applications
3 Months
JIOCINEMA &
JIOSAAVN
3 Months
OTT AppsAnnual subscription OTT & apps
1,600 Cities covered in First Phase
~700,000 route km of fiber to be
increased to ~1.1m route km
(built and under-development
fiber)
50%+ intra-city
Average age
<3 year
Extensive Fiber Infrastructure Jio Fiber Prepaid Plans

Transformative Microsoft Azure Partnership
74
Drive adoption of next-gen technology solution at scale

Recovery of Termination Charge
No change in tariff strategy; focus on building the digital ecosystem75
➢ Regulatory uncertainty around IUC charge compels recovery of termination charge of
6paise/ min
➢ Traffic asymmetry (cited as the only factor for revisiting IUC charges), is purely driven by tariff
differential for voice services and huge number of missed calls to Jio network
➢ For all recharges done by Jio customers effective 10th October, calls made to other mobile
operators to be charged at the prevailing IUC rate through top-up vouchers
▪ Additional data entitlement of equivalent value ensures no increase in tariff for
customers
▪ Applicable only till the time TRAI abolishes IUC, in line with present regulation
➢ Appropriate representations to be made to TRAI in the best interest of consumers

Update on InvIT Fund Raise
Brookfield and affiliates investing Rs 25,215 crore in Tower InvIT76
➢ Transaction for subscription of units of Tower InvIT by Brookfield Infrastructure Partners L.P. and
affiliates in final stages and to be completed shortly
▪ Brookfield Infrastructure Partners L.P. and affiliates to subscriber to units worth Rs 25,215
crore to be issued by the Tower InvIT
▪ Proceeds from the investment will be used to repay existing financial liabilities of RJIPL,
including loans extended by Reliance
➢ Ongoing discussions with potential investors for subscription of units of the Fibre InvIT
Appendix

Key Operating Metrics
78
➢ Healthy subscriber momentum
with gross adds at 31.6 million
➢ Double digit data volume growth,
with per capita usage at 11.7GB/
month
➢ ARPU impacted by subscriber
mix and shift to long-term value
packs, in line with recent trends
➢ Churn at 0.74% remains the
lowest in the industry
Reflect a high degree of customer acceptance

Key Financial Metrics
79
➢ Healthy revenue growth led by
subscriber additions
➢ Robust EBITDA margins despite
continued network expansion and
shifting of infra assets outside
➢ On track for target 50% EBITDA
margin
➢ FTTH and Enterprise businesses to
be key growth and margin tailwinds
over next few quarters*Gross Revenue is value of ServicesStandalone Resultsfigures in Rs crore, unless otherwise stated
Setting a strong foundation for future growth

Growth is Life . . . .
80