2q strategy 2020 - bp
TRANSCRIPT

43
Murray AuchinclossCFO
Thanks Giulia
43

So far today you have heard a lot about our beliefs and our strategy.
The strategy is enabled by a new and resilient financial framework comprising:
– A coherent approach to capital allocation with a new distribution policy and a clear set ofpriorities
– A resilient balance sheet
– A disciplined approach to investment allocation; and
– A relentless focus on executing our five-year business plan.
Together, we believe our strategy and our financial framework create a compelling investorproposition which offers committed distributions, profitable growth and sustainable value.
I will talk about each of these elements, but let me start by explaining how we aim to deliverlong-term value through our approach to capital allocation.
44
44
Anchored in a coherent frame
Purpose and core beliefs
Compelling investor
proposition
New strategyand sustainability
frame
Resilient financialframe
for all stakeholders

45
Coherent approach to capital allocation
Phase 1 Phase 2
Resilient dividend of 5.25 cents per share1
per quarter
Resilient dividend of 5.25 cents per share1
per quarter
De-lever to $35bn
Strong investment grade credit rating
Resilient hydrocarbons spend ~$9bn per year
Resilient hydrocarbons spend ~$9bn per year
Low carbon2 and convenience and mobilityspend ~$4-6bn per year
Low carbon2 and convenience and mobility spend ~$5-7bn per year
At least 60% of surplus3 as buybacks4
1
2
3
4
5
Clear priorities
(1) Intended to remain fixed at this level, subject to board discretion each quarter (2) Low carbon electricity and energy (3) Surplus refers to surplus of sources of cash including operating cash flow, JV loan repayments and divestment proceeds, over uses, including leases, Gulf of Mexico oil spill payments, hybrid servicing costs, dividend payments and cash capital expenditure (4) At least 60% of surplus cash as buyback once net debt has reduced to $35bn and subject to maintaining a strong investment grade credit rating, as defined in bp’s Press Release dated 4th August 2020
Over the past few months, we have come to the conclusion that:
– The economic consequences of COVID-19 make the world uncertain
– With that uncertainty, too much pressure exists on the balance sheet and we need totake action to strengthen it
– Our dividend must be resilient; and
– We need to invest adequately in the energy transition to support our ambition andstrategy.
All of which must be underpinned by a coherent approach to capital allocation.
This has been further reinforced following the extensive engagement we have had with ourshareholders over recent months.
As a result, we have taken the decision to reset our distribution policy
This all leads to a clear set of priorities, with a phased approach to how we will allocate oursources of cash, including divestment proceeds:
– First, funding our reset and resilient dividend, intended to remain fixed at 5.25 cents perordinary share per quarter
– Second, our focus on deleveraging the balance sheet to protect our investment gradecredit rating. The first step is to de-leverage to $35 billion net debt, maintaining a stronginvestment grade credit rating thereafter
– Third, allocating sufficient capital to advance our energy transition strategy, with thisallocation intended to rise once our near-term deleveraging target is achieved
45

– Fourth, investing appropriately in our resilient and valuablehydrocarbons business to generate sustainable cash flow; and
– Fifth, committing to return at least 60% of surplus cash as buybacks,after having reached $35 billion net debt and subject to maintaining astrong investment grade credit rating. This provides direct leverage tocash flow upside and further enforces investment discipline
I will now talk about each of these priorities in detail.
45

46
$35bn target
30-40% across the cycle
$12bn hybrid
2022
Maintaining a strong investment grade credit rating
(1) Chart presented at $50/bbl Brent (2020 real) and bp planning assumptions(2) Cash cover ratio: funds from operating activities over expanded debt, including leases, Gulf of Mexico oil spill liabilities and decommissioning liabilities(3) Operating cash flow excluding post-tax DWH payments, adding JV loan repayments, deducting lease payments, organic and inorganic cash capex at the low end of the $14-
16bn capital frame, dividend and hybrid coupon. Assuming an average of around $11/bbl RMM and $3.00/mmBtu Henry Hub (2020 real)
Clear objectives1
Net Debt $bn Cash cover2
Strong progress
~$12bn hybrid bond issue
$1.8bn 1H20 divestment proceeds
Delivery underpinned
2021-25 cash balance point~$40/bbl3
$25bn 2H20-2025 divestment proceeds
Turning first to balance sheet.
We believe a resilient balance sheet is the foundation to pay the reset dividend and advanceour strategy.
In the near-term we target de-leveraging to $35 billion of net debt.
Thereafter, our target is a strong investment grade credit rating. A good indicator for this isthe cash cover ratio, which we aim to keep within a 30-40% range through the cycle,although this is not a target.
Our gearing target is now retired as it is not representative of how we manage our balancesheet as part of our financial framework. However, we will continue to report this metric assome investors find it useful.
We have already made substantial progress toward our net debt target with the $11.9 billionhybrid bond issuance and $1.8 billion of divestment proceeds during the first half of 2020.
Looking forward, delivery of these objectives is firmly underpinned, and we expect to showfurther progress as we deliver our business plan. We believe our financial frame enables usto manage our average 2021-25 cash balance point to around $40 Brent, assuming anaverage RMM around $11 and Henry Hub at $3 in 2020 real terms.
Deleveraging our balance sheet will be supported by a target of $25 billion of divestmentproceeds between the second half of 2020 and 2025. This includes proceeds from therecently announced $5 billion petrochemicals divestment and from the sale of our upstreamAlaska business.
We are also creating resilience through evolving our long-term capital structure, and wehave made progress during the first-half with the issuance of hybrid bonds and 30 year debt.
46

Recognising the growing pool of investors with a desire to finance theenergy transition, we are also increasingly thinking about how to embracethat as part of a sustainable financing framework. We will talk more aboutthis in the coming months.
46

47
Committed distributions
Resilient dividend intended to stay fixed at
5.25 cents per share per quarter1
Commitment to return at least 60% of surplus3
cash flow via buybacks
– once net debt target achieved; and – subject to maintaining a strong investment
grade credit rating
Remainder of surplus at board discretion
BuybacksDividend
42c/share
c/share
Brent price $/bbl
Clear policy Per share2 distributions
(1) Intended to remain fixed at this level, subject to board discretion each quarter(2) Per share distributions: dividend per share plus total buyback expenditure divided by projected share count(3) Surplus refers to surplus of sources of cash including operating cash flow, JV loan repayments and divestment proceeds, over uses, including leases, Gulf of
Mexico oil spill payments, hybrid servicing costs, dividend payments and cash capital expenditure, as defined in bp’s Press Release dated 4th August 2020
As we have already announced, today we have introduced a new distribution policycomprising a reset and resilient dividend and buyback commitment.
Our first priority is a resilient dividend of 5.25 cents per ordinary share per quarter that weintend to remain fixed at this level. To be clear, it is not a progressive dividend.
This is supplemented by a commitment to distribute at least 60% of surplus cash throughshare buybacks once our net debt target is achieved and subject to maintaining a stronginvestment grade credit rating. The remainder of any surplus cash flow will be allocated atboard discretion
This creates a more flexible model for shareholder returns and results in comparabledistributions at around $55 per barrel while also offering increased exposure to investmentin the energy transition.
47

48
Investment allocation drives value growth
Strategic alignment
Returns
Volatility / ratability
Integration
Sustainability
Risk
Optimising returns and net asset value, balancing:
– short-term free cash flow
– medium-term growth
– long-term sustainable value
Boundaries set by capital frame and the 10 aims
Central allocation across individual business units
Stringent, differentiated hurdle rates
More agile decision-making and reallocation
Investment criteria Sustainable value growthDisciplined process
As our strategy has changed, we have also refreshed our investment allocation process toalign with a re-invented bp.
As you would expect, it starts with a core set of six investment criteria; balancing strategicalignment, returns, volatility, integration value, sustainability and risk.
Resource allocation is done in a more agile way, across our individual businesses.
We have lowered our central case assumptions for oil prices, and significantly increased ourcarbon price.
And we have set stringent hurdle rates.
– First, a payback of less than ten years for all investments in upstream oil, refining and forfuels retail in mature markets
– Second, a payback of less than 15 years for upstream gas
– Third, we have a range of sector specific internal rate of return hurdles for transition andlow carbon investments between 10% and 15%; and
– For renewable power, we look for returns of around 10% - aspiring to do better throughintegration and trading optimisation.
All of this is then optimised to make sure we are adequately trading off returns versus netpresent value, balancing short, medium and long-term value growth.
48

49
Performing while transforming – 2021-25 business planDisciplined expenditure
$14-16bn per year1 investment including inorganics
Relentless execution
Scaling our low carbon electricity and energy
Expanding our convenience and mobility offer
Maximising value from resilient and focused hydrocarbons
Strong growth in EBIDA4
per shareStrong and
improving ROACE5Investing at scale in the
energy transition
Includes $5-7bn per year² investment in low carbon electricity and energy and convenience and mobility
$2.5bn cash cost reductions by end 2021³ on track. Ambition of $3-4bn reductions by 2023
Active portfolio management
$25bn 2H20-2025 divestment programme4
2020 and 2021 proceeds well underpinned by transactions announced or in-progress
Executing on an identified hopper of assets to high-grade our portfolio
(1) $13-15bn per annum until reaching net debt target of $35bn (2) $4-6bn per annum until reaching net debt target of $35bn (3) Relative to 2019(4) Divestment programme refers to divestment proceeds received in the period (5) EBIDA: Underlying replacement cost profit before interest and tax, add back depreciation, depletion and amortization and exploration expenditure written-off (net of non-operating items), less taxation on an underlying replacement cost basis (6) ROACE: return on average capital employed as defined in bp’s 2019 annual report
Successfully delivering our financial frame means ‘Performing while we Transform’.
Our 2021-2025 business plan is intended to deliver on this, combining strong growth inEBIDA per share and growing returns with investment at scale in the energy transition.
Our business plan is defined by three elements.
First. A disciplined approach to expenditure.
As I have already outlined, our investment plans are aligned with our strategy and based onstrict economic appraisal. Per year, including inorganics, we plan to invest:
– $13-15 billion until we reach our net debt target, expecting to be at the lower end of thatrange in the near-term
– And $14-16 billion thereafter
– These ranges include around $9 billion allocated to resilient and focusedhydrocarbons to sustain our cash generation; and
– Spend of $4-6 billion rising to $5-7 billion on low carbon electricity and energy andconvenience and mobility
In addition, we are in action to drive our cash cost base structurally lower.
As we reinvent bp we are on track to deliver $2.5 billion of cash cost reductions by the endof 2021 compared to our 2019 base. With an ambition of delivering $3-4 billion of total cashcost reductions by 2023, a reduction of around 20%.
These are structural reductions enabled by reinventing bp as a leaner, more agile, digitally-enabled organisation. They are focused not only on fewer people, but on eliminating wasteand driving supply chain efficiencies. Despite all the strides we have made so far, we
49

continue to have a long way to go.
Second. An active approach to portfolio management as we high-grade ourportfolio to advance our strategic aims.
– From the second half of 2020 to 2025 we target $25 billion ofdivestment proceeds.
– Near-term planned proceeds are well underpinned by announced or in-progress transactions, with medium-term proceeds supported by ahopper of identified assets.
And third, the relentless execution of a business plan founded onestablished and growing businesses that underpin our confidence in our2025 targets.
Let me now provide you with more detail on the operational drivers of ourbusiness plan.
49
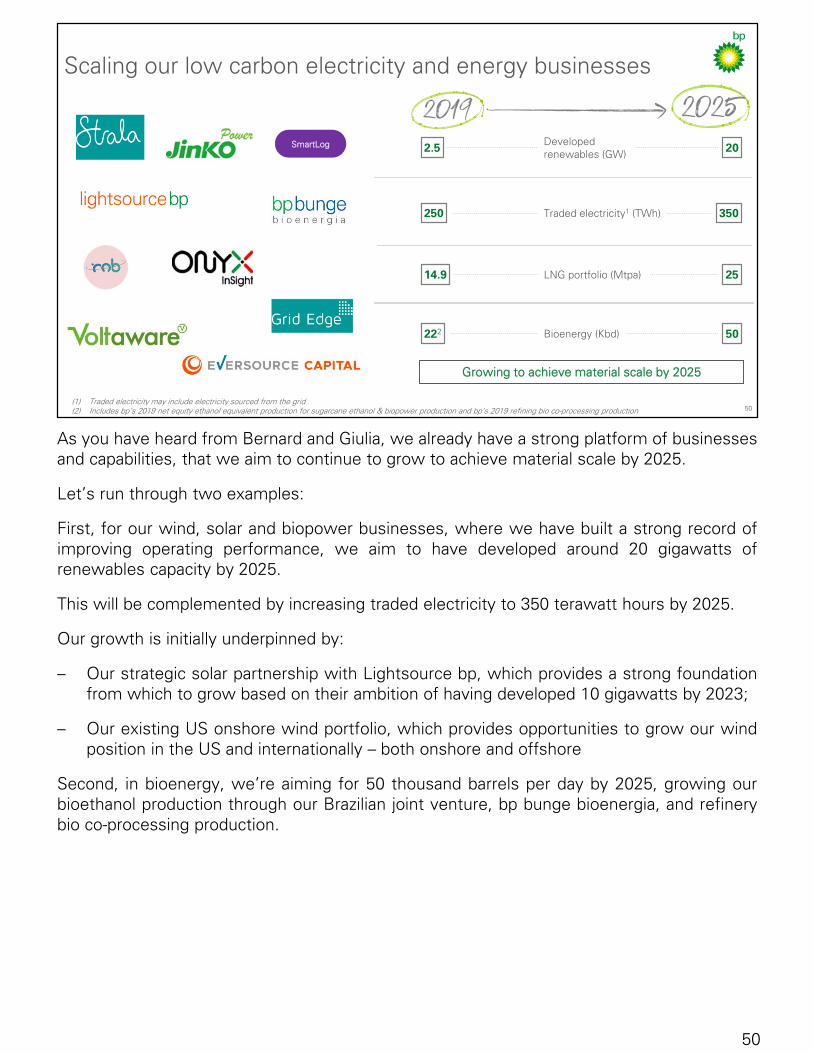
As you have heard from Bernard and Giulia, we already have a strong platform of businessesand capabilities, that we aim to continue to grow to achieve material scale by 2025.
Let’s run through two examples:
First, for our wind, solar and biopower businesses, where we have built a strong record ofimproving operating performance, we aim to have developed around 20 gigawatts ofrenewables capacity by 2025.
This will be complemented by increasing traded electricity to 350 terawatt hours by 2025.
Our growth is initially underpinned by:
– Our strategic solar partnership with Lightsource bp, which provides a strong foundationfrom which to grow based on their ambition of having developed 10 gigawatts by 2023;
– Our existing US onshore wind portfolio, which provides opportunities to grow our windposition in the US and internationally – both onshore and offshore
Second, in bioenergy, we’re aiming for 50 thousand barrels per day by 2025, growing ourbioethanol production through our Brazilian joint venture, bp bunge bioenergia, and refinerybio co-processing production.
50
50
Scaling our low carbon electricity and energy businesses
202.5 Developed renewables (GW)
350250 Traded electricity1 (TWh)
2514.9 LNG portfolio (Mtpa)
50222 Bioenergy (Kbd)
(1) Traded electricity may include electricity sourced from the grid(2) Includes bp’s 2019 net equity ethanol equivalent production for sugarcane ethanol & biopower production and bp’s 2019 refining bio co-processing production
US onshore wind
SmartLog
Growing to achieve material scale by 2025

Across convenience and mobility we have strong brands, differentiated offers and strategicpartnerships which have underpinned our track record of earnings growth and robustreturns. This, and the plans we have in place across our businesses, give us the confidencein continued earnings and cash growth.
Today we have more than 10 million customer touchpoints per day and we aim to increasethis to more than 15 million by 2025. We intend to do this by delivering customer-centricintegrated products and services, underpinned by innovation, digital platforms and strategicpartnerships.
In growth markets, we have around 1,300 sites in the fast-growing economies of China,Mexico and Indonesia. And, we just completed our joint venture with Reliance Industries tocreate a world-class retail, mobility and aviation partnership in India, under the brand Jio-bp.This is a key driver of our plans to grow our network of bp branded retails sites in thesemarkets to more than 7,000 by 2025.
In established OECD markets we are investing to re-fresh our convenience offer to providean enhanced customer experience, including aiming to grow our network of conveniencesites, with our differentiated offer, to over 2,300 by 2025
We expect to grow the share of margin from convenience and electrification to around 35%by 2025.
51
51
Expanding our convenience and mobility offer
(1) As a ratio of total consumer energy (retail fuels and electrification) and convenience margin (excludes equity accounted entities)
Customer touchpoints per day
bp retail sites in growth markets
Strategic convenience sites
Margin from convenience and electrification1
EV charge points
Castrol revenues
>15m
7,000
>2,300
~35%
>25,000
$7.5bn
>10m
1,270
>1,600
~25%
>7,500
$6.5bn
Customer centric growth with robust returns

In resilient and focused hydrocarbons we will be managing the business for cash andreturns, not volume.
By combining the operational management of our upstream and refining operations we willseek to improve safety and efficiency as we share best practices and leverage digitalcapabilities.
In upstream oil and gas we continue to build on our track record of major project delivery.And in line with prior guidance we expect to reach 900 thousand barrels of oil equivalent perday of new major project production in 2021.
– In 2020 we expect to start up Raven and plan for the accelerated start up of Ghazeer.
– As a result of COVID-19 we now expect Mad Dog 2, Cassia Compression and TangguhExpansion Project to start in 2022.
As we complete this phase of project development, absolute capital investment will fall.This reflects both portfolio actions and an increasing focus on near-field opportunities -projects with faster payback periods and higher rates of return.
We expect underlying production to be broadly flat in 2025, relative to 2019. However,headline production will depend on divestments, but is expected to be lower as we continueto high-grade our portfolio in-line with our strategy.
Even after portfolio activity, we expect the combination of lower unit production costs,improving plant reliability and lower capital intensity to underpin growth in cash flow.
Turning to Refining.
Here we intend to high-grade the portfolio to deliver first quartile net cash margin and
52
52
Maximising value from resilient and focused hydrocarbons
Upstream production1 (mmboed)
Unit production costs2 ($/boe)
Refining throughput (mmbbl/d)
Capex ($bn)
Refining availability4
Plant reliability3
~2
~6
<1.5
~9
96%
96%
2.6
~7
1.7
~13
~95%
94%
Advantaged refining portfolio
Atlantis Ph3 KG D6 R-Series Vorlich Raven Khazzan Ph2
2020 2023+ ACE GTA Ph1 Cypre Seagull
KG D6 Satellites Thunder Horse S.
Exp Ph2 Manuel Zinia 2
2021 2022 Mad Dog Ph2 Herschel KG D6 MJ Matapal Platina Tangguh Expansion Cassia Compression
Track record of major project delivery
Major Projects online
24developed
700mboed
Delivering
by end-2021
900mboed
Delivering
Refineries delivered >96% average availability in 2018-19
4underlying earnings growth in 2018-2025
~1bndelivered by 2019
>50%
(1) This and all other 2025 metrics are stated after expected impact of divestments(2) Upstream unit metrics exclude production from equity accounted entities(3) bp-operated upstream plant reliability(4) bp-operated refining availability
Providing a solid foundation

sustainable EBIDA generation.
– We aim to grow earnings per barrel through continued delivery ofbusiness improvement plans focused on reliability, cost efficiency,advantaged feedstock and commercial optimisation
– We also plan to roll-out intelligent operations to deliver world classproductivity, leading availability and digitally-enabled supplyoptimisation
– We plan to build on our strong track record of refining availabilitytargeting bp-operated refining availability of over 96% by 2025; and
– We intend to grow our underlying earnings by around $1 billion by 2025versus 2018, with more than half of this growth already delivered.
52

53
2021-25 business plan outcomes
5-6% underlying EBIDA2 CAGR4
7-9% per share EBIDA2
per share CAGR4 12-14% group ROACE5 in
2025
Underlying1 EBIDA2 growth EBIDA2 per share growth3 Strong and growing ROACE5
$51 $50-60 $51 $50-60 $64 $50-602H19-1H20 20252H19-1H20 2025 2019 2025
$bn c/share %
(1) Underlying: Before impact of planned divestments(2) EBIDA: Underlying replacement cost profit before interest and tax, add back depreciation, depletion and amortization and exploration expenditure written-off (net of non-operating
items), less taxation on an underlying replacement cost basis(3) Buyback modelled across a range of share prices; EBIDA after impact of planned divestments(4) CAGR: compound annual growth rate(5) ROACE: return on average capital employed as defined in bp’s 2019 annual report
In summary, we expect our 2021-25 business plan to result in strong growth in EBIDA pershare and strong and improving ROACE.
On an underlying basis, before planned divestments, we expect our business plan to deliver5-6% annual EBIDA growth, driven primarily by our legacy businesses.
As we have outlined, an important part of our strategy and business plan is portfolio high-grading. After allowing for the impact of portfolio change and reflecting the expected impactof our share buyback commitment, we expect to achieve headline annual growth of 7-9% inEBIDA per share.
And based on expected higher profitability combined with an expected improvement incapital efficiency and our disciplined focus on investment allocation, we expect to seestrong and growing returns, with ROACE rising to 12-14% in 2025.
53

54
Resilient dividend
Deleverage
Investment3
Buybacks
Surplus after buybacks
Clear priorities for uses of cash
(1) Sources of cash includes Operating cash flow at $50-60/bbl Brent (2020 real) and bp planning assumptions plus JV loan repayments and divestment proceeds, deducting leases, Gulf of Mexico oil spill payments and hybrid servicing costs (2) Dividend per quarter, intended to remain fixed at this level, subject to board discretion each quarter (3) Investment refers to organic and inorganic capital expenditure (4) At least 60% of surplus cash as buyback after having reached $35bn Net Debt and subject to maintaining a strong investment grade credit rating, as defined in bp’s Press Release dated 4th August 2020
2021-25 sources of cash¹
At least 60%of surplus4
To $35bn net debt
5.25 c/share2
per quarter
Phase 1 ~$13-15bn per yearPhase 2 ~$14-16bn per year
Before I close, I want to share what our plan looks like in practice over the next five years.Assuming an oil price of $50-60 Brent and including divestment proceeds, this slide showshow we intend to:
– Pay a resilient dividend
– De-leverage our balance sheet
– Invest at scale in the energy transition
– Invest in our resilient hydrocarbons business
– And distribute surplus cash flow through share buybacks with the remainder of anysurplus allocated according to board discretion
This provides a clear articulation of how we think about our priorities for uses of cash.
54

55
Our new investor proposition
(1) Intended to remain fixed at this level, subject to board discretion each quarter (2) At least 60% of surplus cash as buyback after having reached $35bn Net Debt and subject to maintaining a strong investment grade credit rating, as defined in bp’s Press Release dated 4th August 2020 (3) EBIDA: Underlying replacement cost profit before interest and tax, add back depreciation, depletion and amortization and exploration expenditure written-off (net of non-operating items), less taxation on an underlying RC basis (4) 2H19/1H20-2025, $50-60/bbl Brent (2020 real), at bp planning assumptions (5) ROACE: return on average capital employed as defined in bp’s 2019 annual report, by 2025, $50-60/bbl (2020 real), at bp planning assumptions (6) By 2025
Profitablegrowth
Committeddistributions
Sustainablevalue
Resilient dividend of 5.25 cents per
share per quarter1
7-9% EBIDA3
per share CAGR4
>60% surpluscash as share
buybacks2
>20% capital employed
in transition6
Growing ROACE to
12-14%5
In summary, you have heard a lot today on our strategy and financial frame. Taken togetherwe believe this will deliver a compelling investor proposition. A proposition that balances:
– committed distributions
– profitable growth; and
– sustainable long-term value as we transition from IOC to IEC.
This is underpinned by the measures we have talked about today which are summarised onthis slide and which are all in service of delivering long term shareholder value.
Let me now hand back to Bernard who will conclude today’s presentation.
55