2q12 and 1h12 results conference call presentation
TRANSCRIPT
Strategic
Plan
Investor Relations
Villa Flora - Sumaré – São Paulo
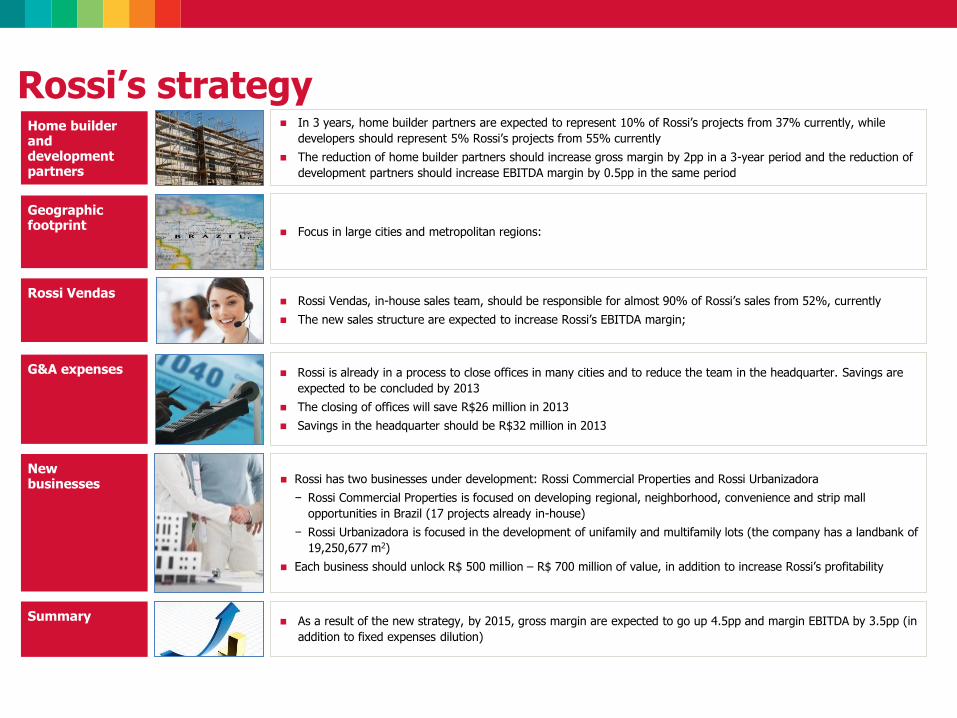
Rossi is already in a process to close offices in many cities and to reduce the team in the headquarter. Savings are
expected to be concluded by 2013
The closing of offices will save R$26 million in 2013
Savings in the headquarter should be R$32 million in 2013
Rossi Vendas, in-house sales team, should be responsible for almost 90% of Rossi’s sales from 52%, currently
The new sales structure are expected to increase Rossi’s EBITDA margin;
As a result of the new strategy, by 2015, gross margin are expected to go up 4.5pp and margin EBITDA by 3.5pp (in
addition to fixed expenses dilution)
Focus in large cities and metropolitan regions:
In 3 years, home builder partners are expected to represent 10% of Rossi’s projects from 37% currently, while
developers should represent 5% Rossi’s projects from 55% currently
The reduction of home builder partners should increase gross margin by 2pp in a 3-year period and the reduction of
development partners should increase EBITDA margin by 0.5pp in the same period
Home builder and development partners
Geographic footprint
Rossi Vendas
G&A expenses
Summary
Rossi has two businesses under development: Rossi Commercial Properties and Rossi Urbanizadora
− Rossi Commercial Properties is focused on developing regional, neighborhood, convenience and strip mall
opportunities in Brazil (17 projects already in-house)
− Rossi Urbanizadora is focused in the development of unifamily and multifamily lots (the company has a landbank of
19,250,677 m2)
Each business should unlock R$ 500 million – R$ 700 million of value, in addition to increase Rossi’s profitability
New businesses
Rossi’s strategy
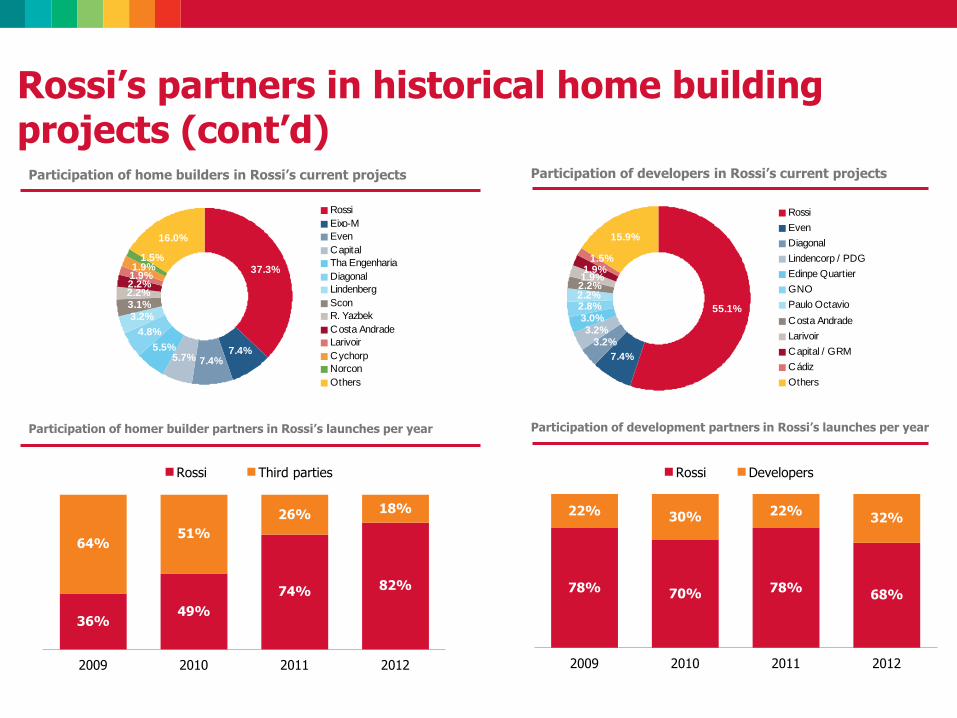
Participation of homer builder partners in Rossi’s launches per year Participation of development partners in Rossi’s launches per year
37.3%
7.4%7.4%5.7%
5.5%
4.8%
3.2%3.1%2.2%2.2%1.9%
16.0%
1.5%1.9%
Rossi
Eixo-M
Even
Capital
Tha Engenharia
Diagonal
Lindenberg
Scon
R. Yazbek
Costa Andrade
Larivoir
Cychorp
Norcon
Others
55.1%
7.4%
3.2%3.2%
3.0%2.8%2.2%2.2%1.9%1.9%
15.9%
1.5%
Rossi
Even
Diagonal
Lindencorp / PDG
Edinpe Quartier
GNO
Paulo Octavio
Costa Andrade
Larivoir
Capital / GRM
Cádiz
Others
Rossi’s partners in historical home building projects (cont’d)
Participation of home builders in Rossi’s current projects Participation of developers in Rossi’s current projects
36% 49%
74% 82%
64% 51%
26% 18%
2009 2010 2011 2012
Rossi Third parties
78% 70% 78% 68%
22% 30% 22% 32%
2009 2010 2011 2012
Rossi Developers
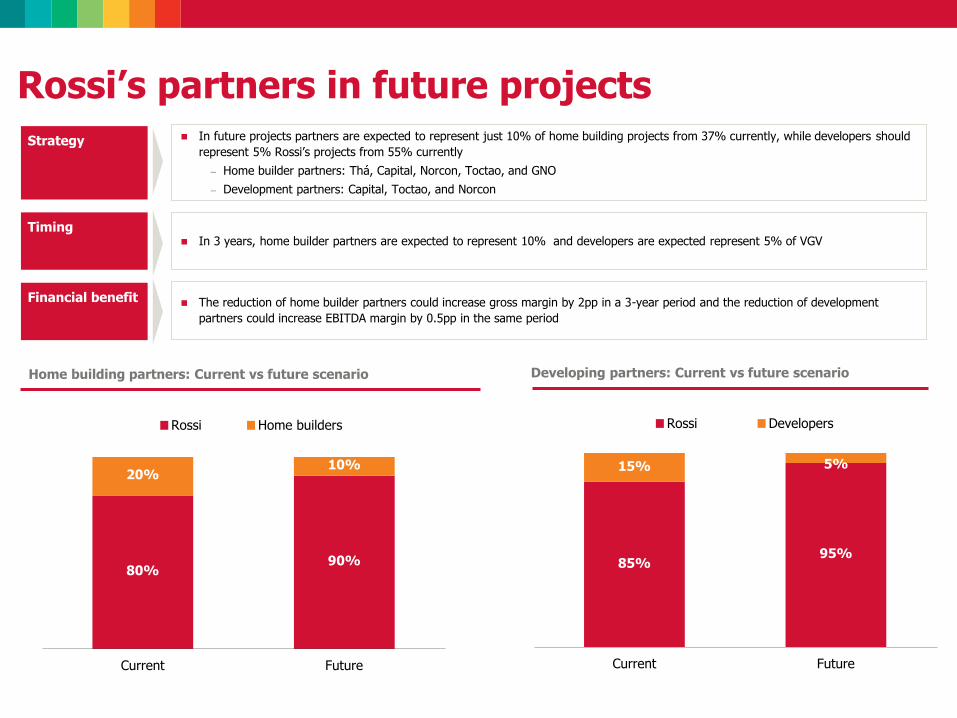
80% 90%
20% 10%
Current Future
Rossi Home builders
85% 95%
15% 5%
Current Future
Rossi Developers
Rossi’s partners in future projects
Home building partners: Current vs future scenario Developing partners: Current vs future scenario
In future projects partners are expected to represent just 10% of home building projects from 37% currently, while developers should
represent 5% Rossi’s projects from 55% currently
– Home builder partners: Thá, Capital, Norcon, Toctao, and GNO
– Development partners: Capital, Toctao, and Norcon
Strategy
In 3 years, home builder partners are expected to represent 10% and developers are expected represent 5% of VGV Timing
The reduction of home builder partners could increase gross margin by 2pp in a 3-year period and the reduction of development
partners could increase EBITDA margin by 0.5pp in the same period
Financial benefit
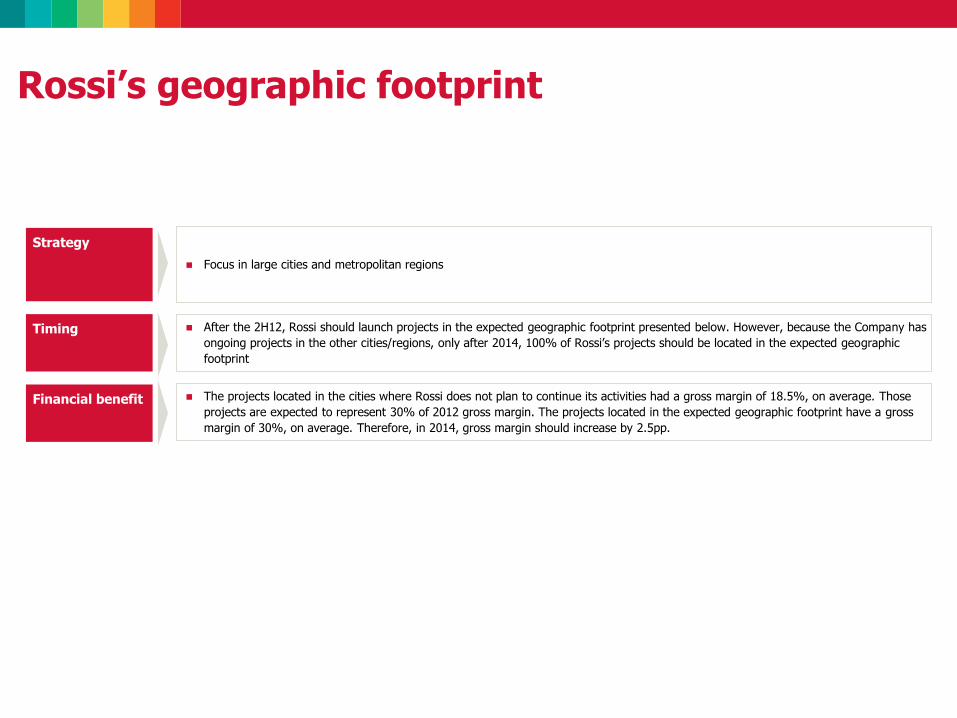
Rossi’s geographic footprint
Focus in large cities and metropolitan regions
Strategy
After the 2H12, Rossi should launch projects in the expected geographic footprint presented below. However, because the Company has
ongoing projects in the other cities/regions, only after 2014, 100% of Rossi’s projects should be located in the expected geographic
footprint
Timing
The projects located in the cities where Rossi does not plan to continue its activities had a gross margin of 18.5%, on average. Those
projects are expected to represent 30% of 2012 gross margin. The projects located in the expected geographic footprint have a gross
margin of 30%, on average. Therefore, in 2014, gross margin should increase by 2.5pp.
Financial benefit
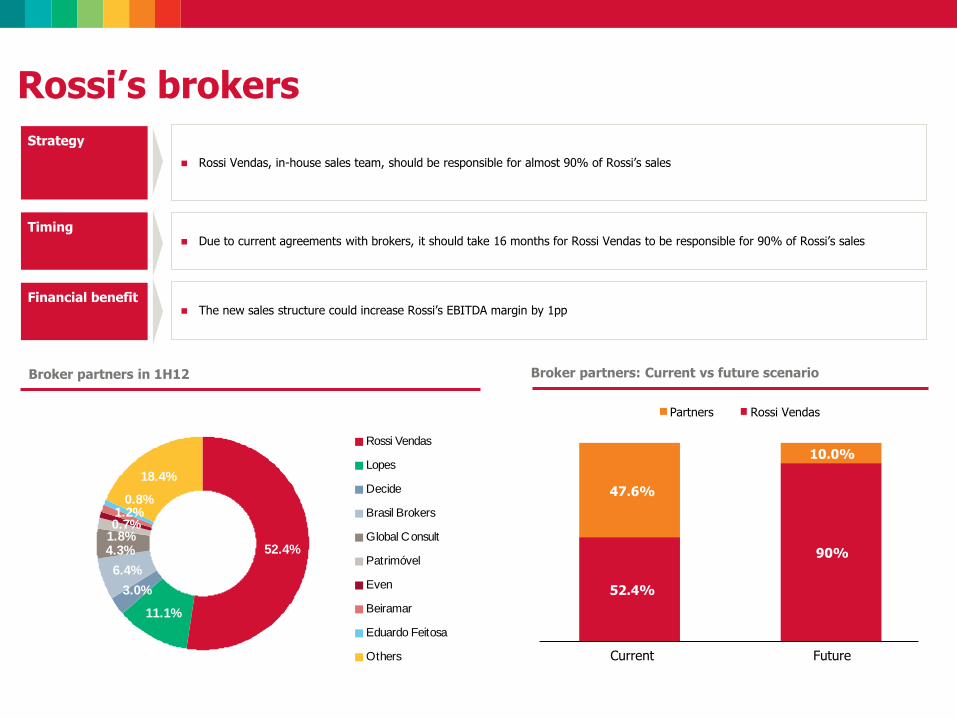
52.4%
11.1%
3.0%
6.4%
18.4%
1.8%0.7%
4.3%
1.2%0.8%
Rossi Vendas
Lopes
Decide
Brasil Brokers
Global Consult
Patrimóvel
Even
Beiramar
Eduardo Feitosa
Others
Rossi’s brokers
Rossi Vendas, in-house sales team, should be responsible for almost 90% of Rossi’s sales
Strategy
Due to current agreements with brokers, it should take 16 months for Rossi Vendas to be responsible for 90% of Rossi’s sales Timing
The new sales structure could increase Rossi’s EBITDA margin by 1pp Financial benefit
Broker partners in 1H12 Broker partners: Current vs future scenario
52.4%
90%
47.6%
10.0%
Current Future
Partners Rossi Vendas
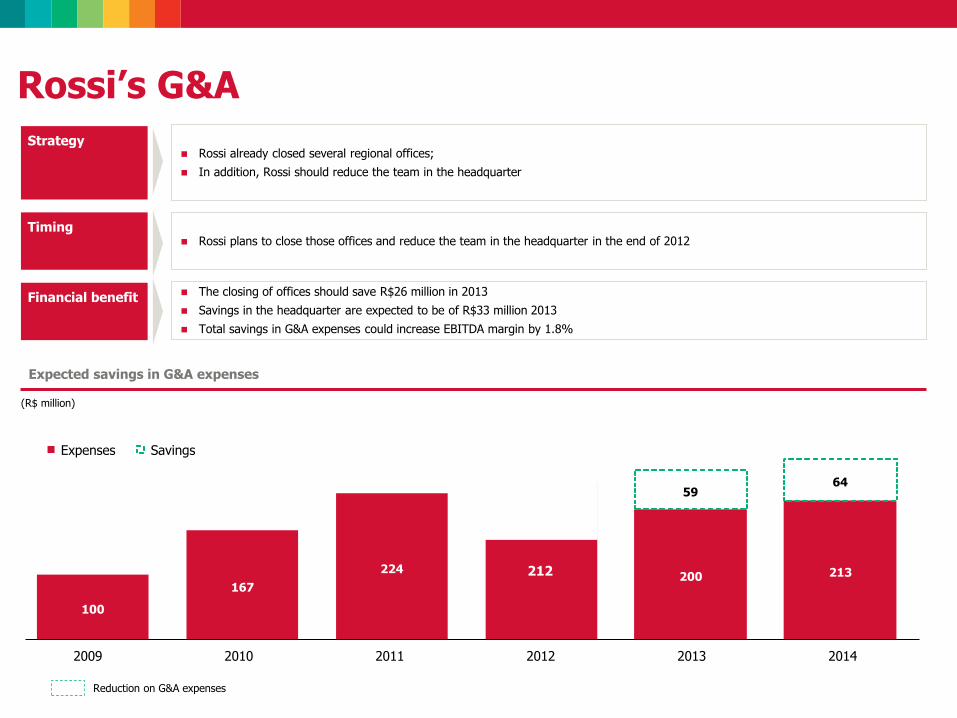
(R$ million)
Reduction on G&A expenses
Rossi’s G&A
Rossi already closed several regional offices;
In addition, Rossi should reduce the team in the headquarter
Strategy
Rossi plans to close those offices and reduce the team in the headquarter in the end of 2012 Timing
The closing of offices should save R$26 million in 2013
Savings in the headquarter are expected to be of R$33 million 2013
Total savings in G&A expenses could increase EBITDA margin by 1.8%
Financial benefit
Expected savings in G&A expenses
2009 2010 2011 2012 2013 2014
Savings Expenses
100
167
224 241 200 213
59 64
212
RS
SC
PR
SP
MG
GO
MT
AC
AM
RR
RO BA
PI
MA PA
AP
TO
CE RN
PE
AL SE
MS
RJ
ES
DF
PB
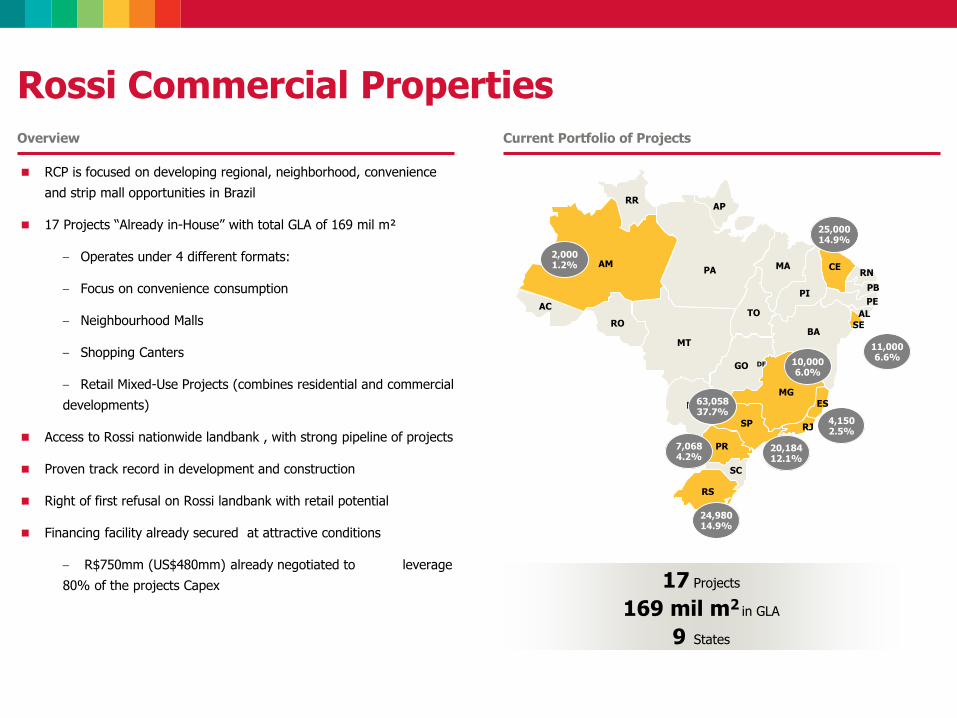
17 Projects
169 mil m2 in GLA
9 States
RCP is focused on developing regional, neighborhood, convenience
and strip mall opportunities in Brazil
17 Projects “Already in-House” with total GLA of 169 mil m²
– Operates under 4 different formats:
– Focus on convenience consumption
– Neighbourhood Malls
– Shopping Canters
– Retail Mixed-Use Projects (combines residential and commercial
developments)
Access to Rossi nationwide landbank , with strong pipeline of projects
Proven track record in development and construction
Right of first refusal on Rossi landbank with retail potential
Financing facility already secured at attractive conditions
– R$750mm (US$480mm) already negotiated to leverage
80% of the projects Capex
4,150 2.5%
25,000 14.9%
20,184 12.1%
24,980 14.9%
63,058 37.7%
10,000 6.0%
2,000 1.2%
11,000 6.6%
7,068 4.2%
Rossi Commercial Properties Current Portfolio of Projects Overview
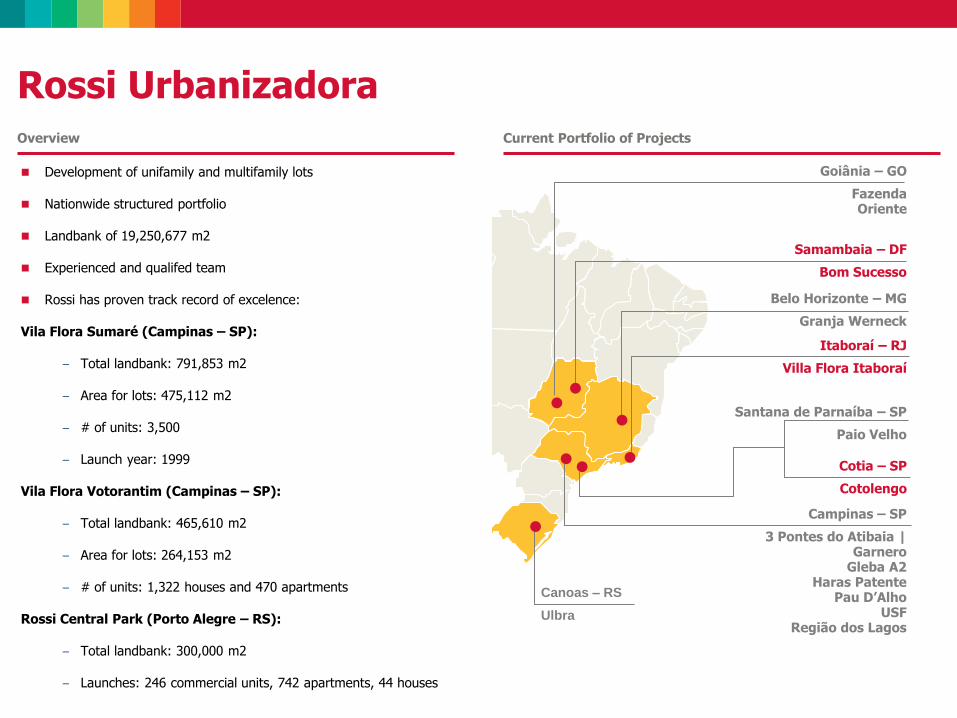
Canoas – RS
Ulbra
Goiânia – GO
Fazenda Oriente
Campinas – SP
3 Pontes do Atibaia | Garnero
Gleba A2 Haras Patente
Pau D’Alho USF
Região dos Lagos
Santana de Parnaíba – SP
Paio Velho
Cotia – SP
Cotolengo
Belo Horizonte – MG
Granja Werneck
Itaboraí – RJ
Villa Flora Itaboraí
Samambaia – DF
Bom Sucesso
Rossi Urbanizadora Current Portfolio of Projects Overview
Development of unifamily and multifamily lots
Nationwide structured portfolio
Landbank of 19,250,677 m2
Experienced and qualifed team
Rossi has proven track record of excelence:
Vila Flora Sumaré (Campinas – SP):
– Total landbank: 791,853 m2
– Area for lots: 475,112 m2
– # of units: 3,500
– Launch year: 1999
Vila Flora Votorantim (Campinas – SP):
– Total landbank: 465,610 m2
– Area for lots: 264,153 m2
– # of units: 1,322 houses and 470 apartments
Rossi Central Park (Porto Alegre – RS):
– Total landbank: 300,000 m2
– Launches: 246 commercial units, 742 apartments, 44 houses
10 10 10
Financial
Performance
Rossi Mais Reserva Especial | Belo Horizonte – BH
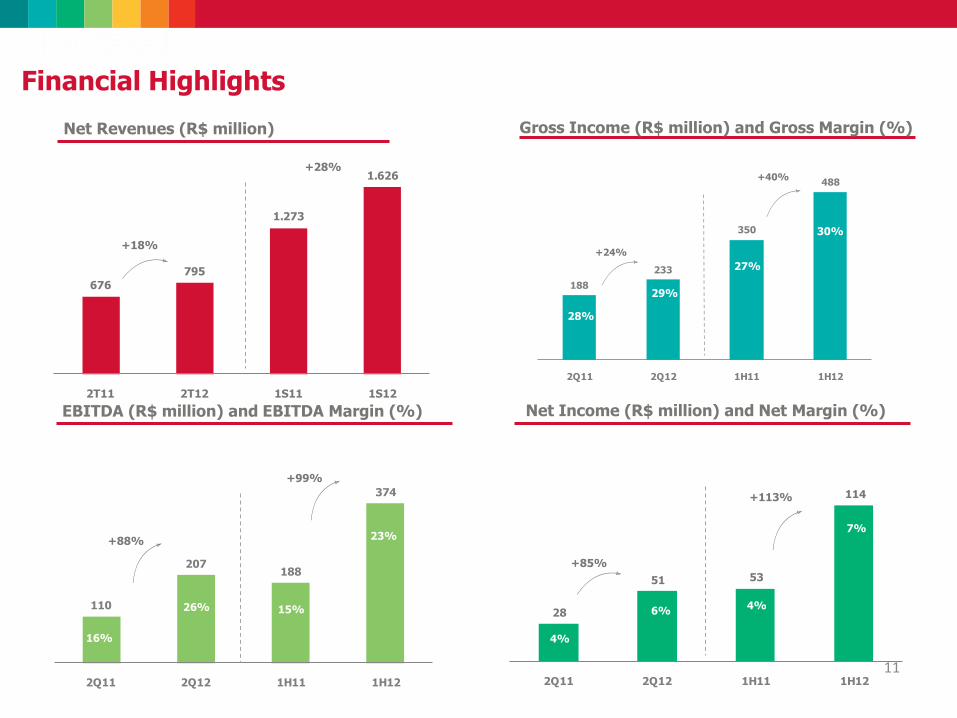
676
795
1.273
1.626
2T11 2T12 1S11 1S12
+18%
+28%
110
207188
374
2Q11 2Q12 1H11 1H12
+88%
+99%
28
51 53
114
2Q11 2Q12 1H11 1H12
+113%
+85%
188
233
350
488
2Q11 2Q12 1H11 1H12
+24%
+40%
Financial Highlights
11
Net Revenues (R$ million) Gross Income (R$ million) and Gross Margin (%)
EBITDA (R$ million) and EBITDA Margin (%) Net Income (R$ million) and Net Margin (%)
28%
29%
27%
30%
16%
26% 15%
23%
4%
6% 4%
7%
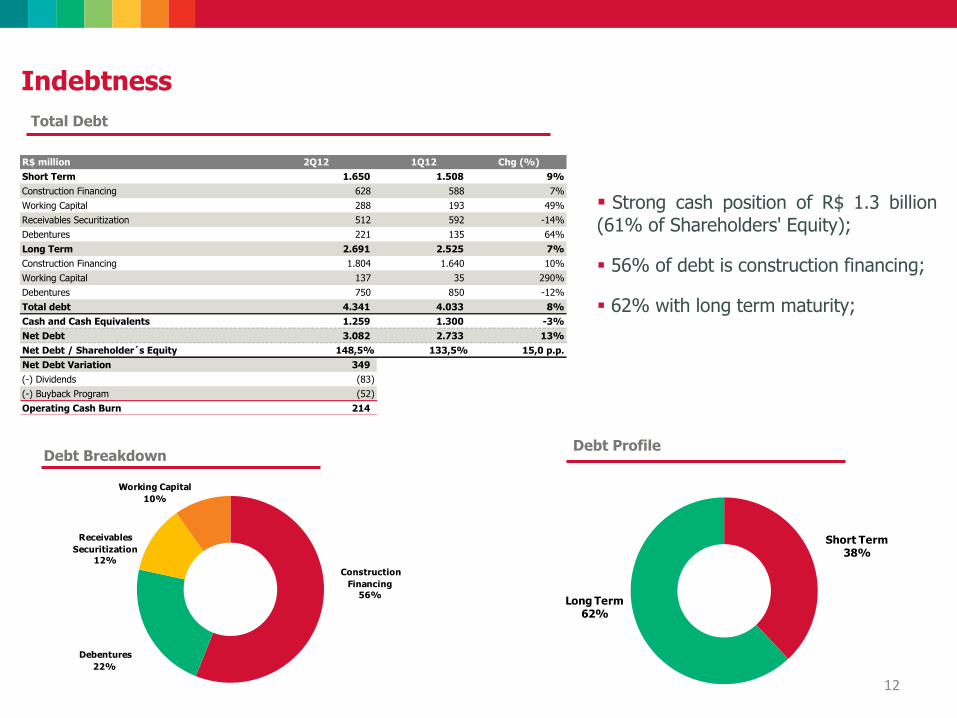
Construction
Financing
56%
Debentures
22%
Receivables
Securitization
12%
Working Capital
10%
Short Term38%
Long Term62%
12
Indebtness
Total Debt
Debt Breakdown Debt Profile
Strong cash position of R$ 1.3 billion (61% of Shareholders' Equity);
56% of debt is construction financing;
62% with long term maturity;
R$ million 2Q12 1Q12 Chg (%)
Short Term 1.650 1.508 9%
Construction Financing 628 588 7%
Working Capital 288 193 49%
Receivables Securitization 512 592 -14%
Debentures 221 135 64%
Long Term 2.691 2.525 7%
Construction Financing 1.804 1.640 10%
Working Capital 137 35 290%
Debentures 750 850 -12%
Total debt 4.341 4.033 8%
Cash and Cash Equivalents 1.259 1.300 -3%
Net Debt 3.082 2.733 13%
Net Debt / Shareholder´s Equity 148,5% 133,5% 15,0 p.p.
Net Debt Variation 349
(-) Dividends (83)
(-) Buyback Program (52)
Operating Cash Burn 214
675
1.1451.110
508
209
13
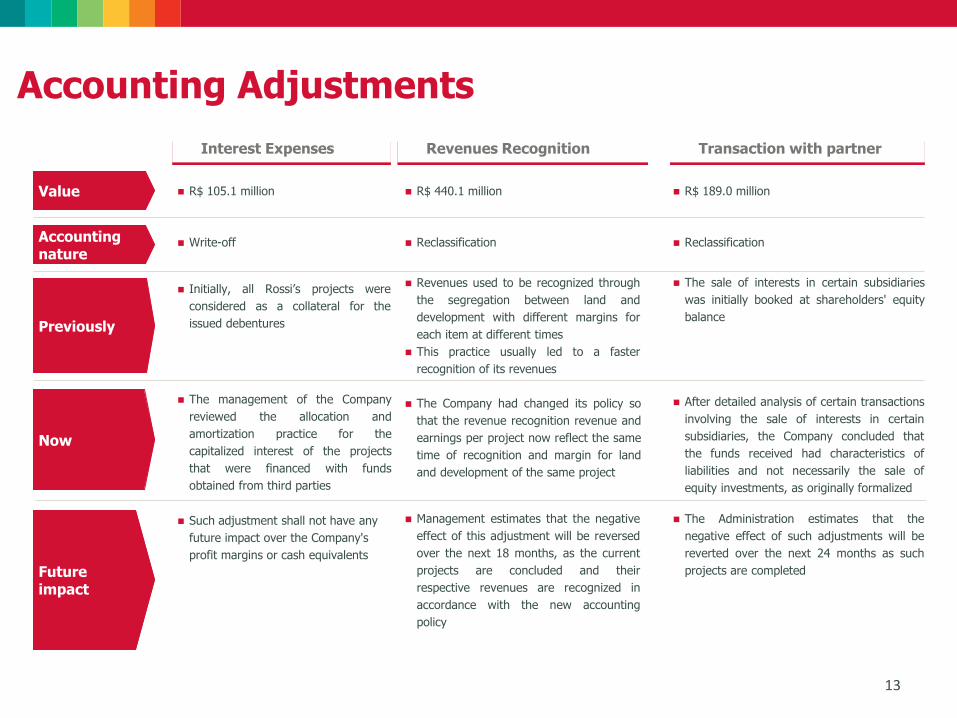
R$ 189.0 million Value R$ 440.1 million
Accounting nature
Reclassification Reclassification
Previously
Revenues used to be recognized through
the segregation between land and
development with different margins for
each item at different times
This practice usually led to a faster
recognition of its revenues
The sale of interests in certain subsidiaries
was initially booked at shareholders' equity
balance
Now
The Company had changed its policy so
that the revenue recognition revenue and
earnings per project now reflect the same
time of recognition and margin for land
and development of the same project
After detailed analysis of certain transactions
involving the sale of interests in certain
subsidiaries, the Company concluded that
the funds received had characteristics of
liabilities and not necessarily the sale of
equity investments, as originally formalized
Future impact
Management estimates that the negative
effect of this adjustment will be reversed
over the next 18 months, as the current
projects are concluded and their
respective revenues are recognized in
accordance with the new accounting
policy
The Administration estimates that the
negative effect of such adjustments will be
reverted over the next 24 months as such
projects are completed
Revenues Recognition Transaction with partner
R$ 105.1 million
Write-off
Initially, all Rossi’s projects were
considered as a collateral for the
issued debentures
The management of the Company
reviewed the allocation and
amortization practice for the
capitalized interest of the projects
that were financed with funds
obtained from third parties
Such adjustment shall not have any
future impact over the Company's
profit margins or cash equivalents
Interest Expenses
Accounting Adjustments
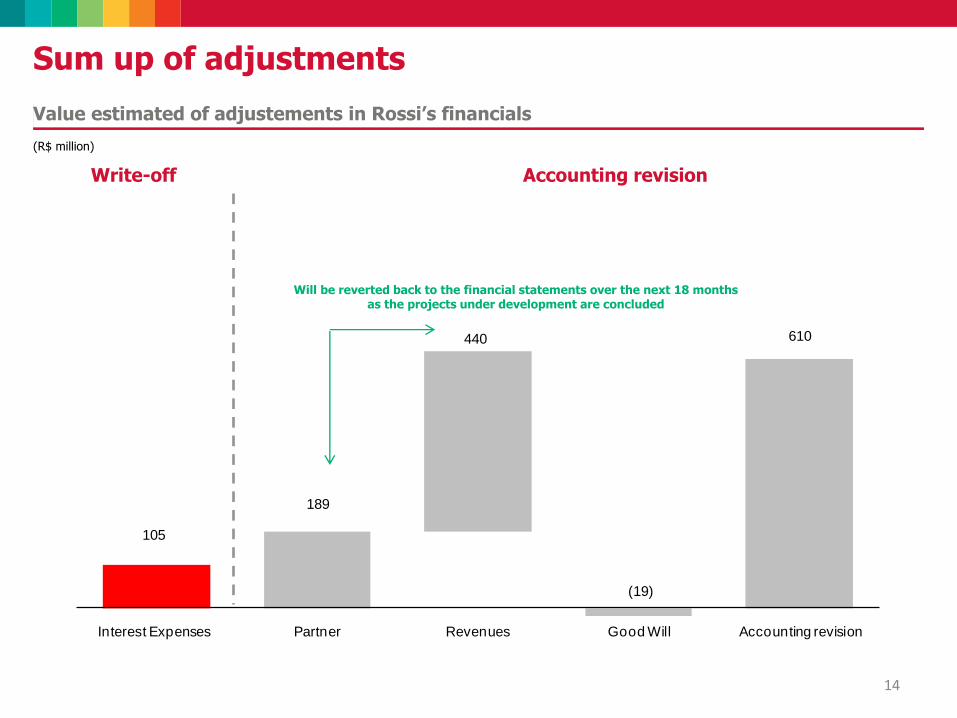
105
189
440
(19)
610
Interest Expenses Partner Revenues Good Will Accounting revision
14
Sum up of adjustments
(R$ million)
Value estimated of adjustements in Rossi’s financials
Write-off Accounting revision
Will be reverted back to the financial statements over the next 18 months as the projects under development are concluded
15
Equipe de RI
Thank You!
Equipe de RI Tel. (55 11) 4058-2502 [email protected] www.rossiresidencial.com.br/ri

16 16 16
Q&A