2q14 institutional presentation
TRANSCRIPT
Institutional PresentationInstitutional Presentation 2Q14

Profile and History
Pine
History
Business Strategy
Competitive Landscape
Focus Always on the Client
Corporate Credit
FICC
Pine Investimentos
Summary
2/31Investor Relations | 2Q14 |
Pine Investimentos
Rating Upgrades
Highlights and Results
Corporate Governance and PINE4
Organizational Structure
Corporate Governance
Committees
PINE4
Social Investment and Responsibility

Profile and History
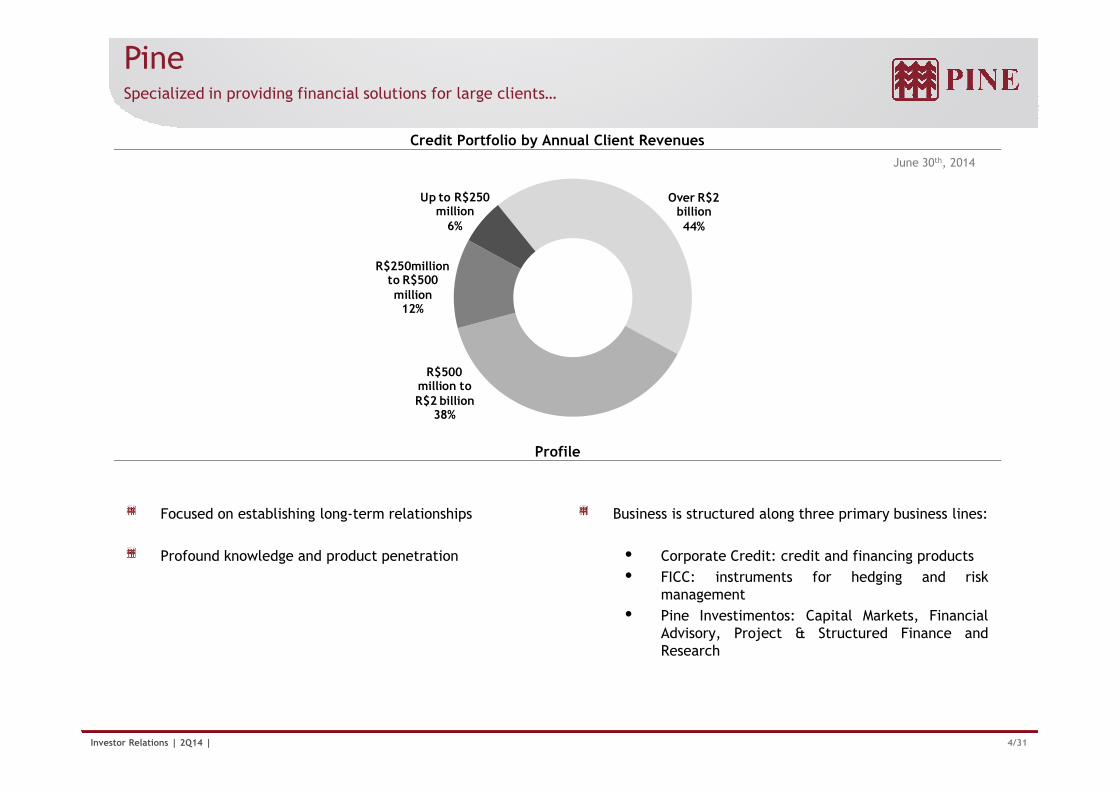
PineSpecialized in providing financial solutions for large clients…
Credit Portfolio by Annual Client Revenues
June 30th, 2014
Over R$2 billion44%
R$500 million to R$2 billion
R$250million to R$500 million
12%
Up to R$250 million
6%
4/31Investor Relations | 2Q14 |
Profile
Focused on establishing long-term relationships
Profound knowledge and product penetration
Business is structured along three primary business lines:
• Corporate Credit: credit and financing products
• FICC: instruments for hedging and riskmanagement
• Pine Investimentos: Capital Markets, FinancialAdvisory, Project & Structured Finance andResearch
R$2 billion38%
801 827 825
867
1,015
1,220 1,272 1,270
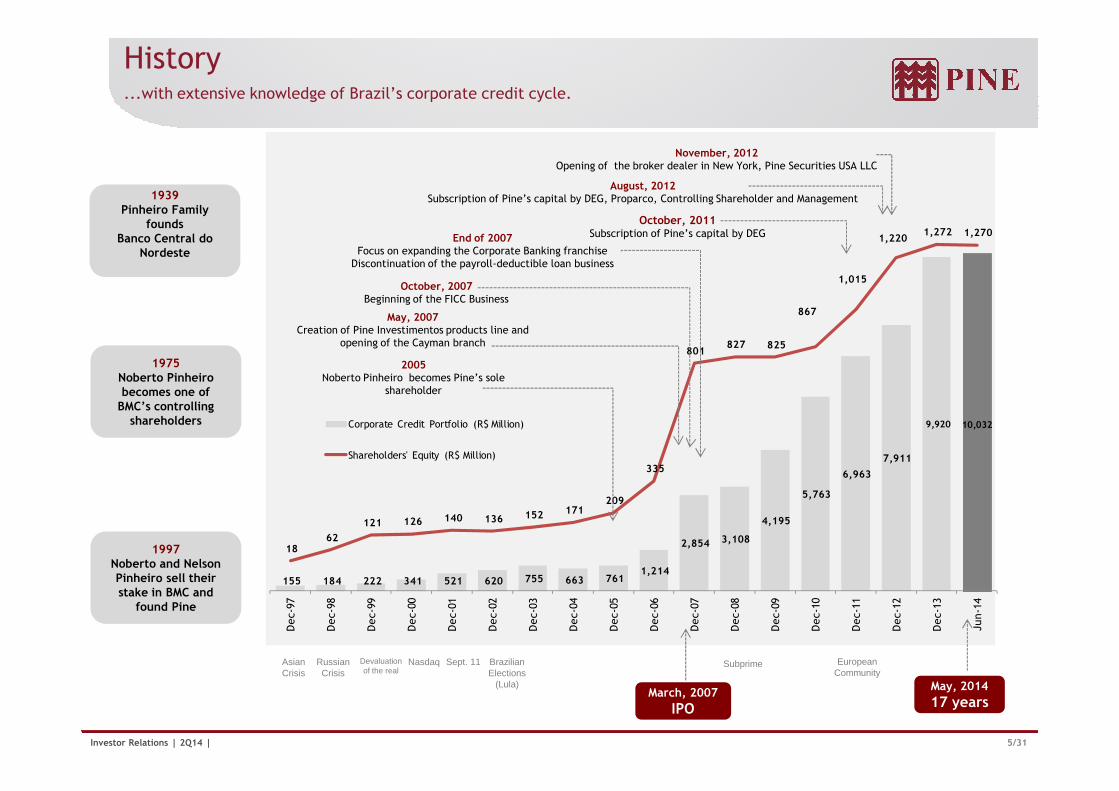
...with extensive knowledge of Brazil’s corporate credit cycle.
History
1939Pinheiro Family
foundsBanco Central do
Nordeste
1975Noberto Pinheiro becomes one of
End of 2007Focus on expanding the Corporate Banking franchise
Discontinuation of the payroll-deductible loan business
May, 2007Creation of Pine Investimentos products line and
opening of the Cayman branch
2005Noberto Pinheiro becomes Pine’s sole
shareholder
October, 2007Beginning of the FICC Business
October, 2011Subscription of Pine’s capital by DEG
August, 2012 Subscription of Pine’s capital by DEG, Proparco, Controlling Shareholder and Management
November, 2012Opening of the broker dealer in New York, Pine Securities USA LLC
5/31Investor Relations | 2Q14 |
155 184 222 341 521 620 755 663 761 1,214
2,854 3,108
4,195
5,763
6,963
7,911
9,920 10,032
18 62
121 126 140 136 152 171 209
335
Dec-
97
Dec-
98
Dec-
99
Dec-
00
Dec-
01
Dec-
02
Dec-
03
Dec-
04
Dec-
05
Dec-
06
Dec-
07
Dec-
08
Dec-
09
Dec-
10
Dec-
11
Dec-
12
Dec-
13
Jun-1
4
Corporate Credit Portfolio (R$ Million)
Shareholders' Equity (R$ Million)
1997Noberto and Nelson Pinheiro sell their stake in BMC and
found Pine
becomes one of BMC’s controlling
shareholders
Devaluationof the real
Nasdaq Sept. 11 Brazilian Elections
(Lula)
SubprimeAsian Crisis
Russian Crisis
European Community
shareholder
March, 2007
IPO
May, 2014
17 years

Business Strategy
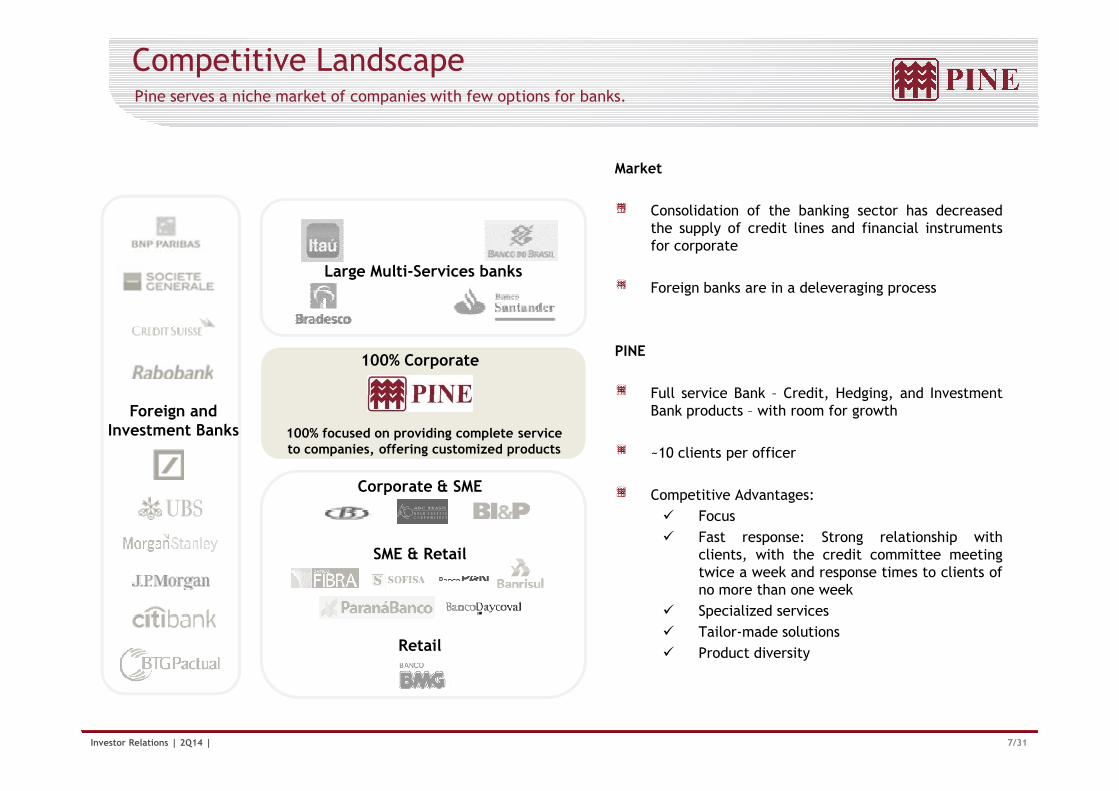
Competitive LandscapePine serves a niche market of companies with few options for banks.
100% Corporate
Large Multi-Services banks
Market
Consolidation of the banking sector has decreasedthe supply of credit lines and financial instrumentsfor corporate
Foreign banks are in a deleveraging process
PINE
Full service Bank – Credit, Hedging, and Investment
7/31Investor Relations | 2Q14 |
100% focused on providing complete service to companies, offering customized products
Corporate & SME
SME & Retail
Retail
Full service Bank – Credit, Hedging, and InvestmentBank products – with room for growth
~10 clients per officer
Competitive Advantages:
� Focus
� Fast response: Strong relationship withclients, with the credit committee meetingtwice a week and response times to clients ofno more than one week
� Specialized services
� Tailor-made solutions
� Product diversity
Foreign and Investment Banks
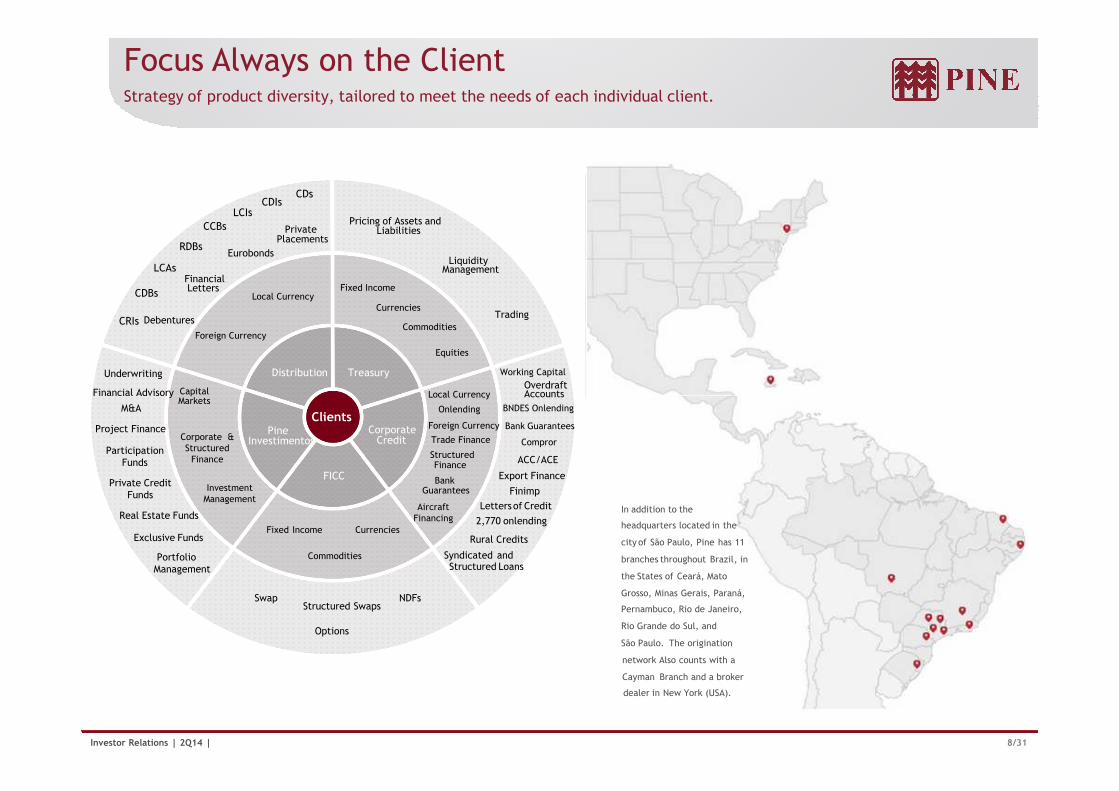
Focus Always on the ClientStrategy of product diversity, tailored to meet the needs of each individual client.
Working Capit
CDIs
OverdraftAccounts
Fixed Income
Currencies
Commodities
Equities
CDBs
CDs
RDBs
LCAs
LCIs
DebenturesCRIs
CCBs
Eurobonds
PrivatePlacements
Financial Letters
TreasuryDistribution
Capital Markets
Financial Advisory
Local Currency
Foreign Currency
Pricing of Assets and Liabilities
LiquidityManagement
Trading
Local Currency
Working CapitalUnderwriting
8/31Investor Relations | 2Q14 |
BankGuarantees
Exclusive Funds
Portfolio Management
Swap NDFsStructured Swaps
BNDES Onlending
Bank Guarantees
Compror
ACC/ACE
Export Finance
Finimp
Lettersof Credit
2,770 onlending
Accounts
Syndicated andStructured Loans
ClientsCorporate
Credit
FICC
PineInvestimentos
Capital Markets
Financial Advisory
Fixed Income Currencies
Commodities
Local Currency
Onlending
Foreign Currency
Trade FinanceParticipation
Funds
Options
Corporate & Structured
Finance
M&A
Project Finance
StructuredFinance
Private Credit Funds
Real Estate Funds
Rural Credits
AircraftFinancing
Investment Management
In addition to the
headquarters located in the
city of São Paulo, Pine has 11
branches throughout Brazil, in
the States of Ceará, Mato
Grosso, Minas Gerais, Paraná,
Pernambuco, Rio de Janeiro,
Rio Grande do Sul, and
São Paulo. The origination
network Also counts with a
Cayman Branch and a broker
dealer in New York (USA).
Corporate Credit
Actions Credit Committee
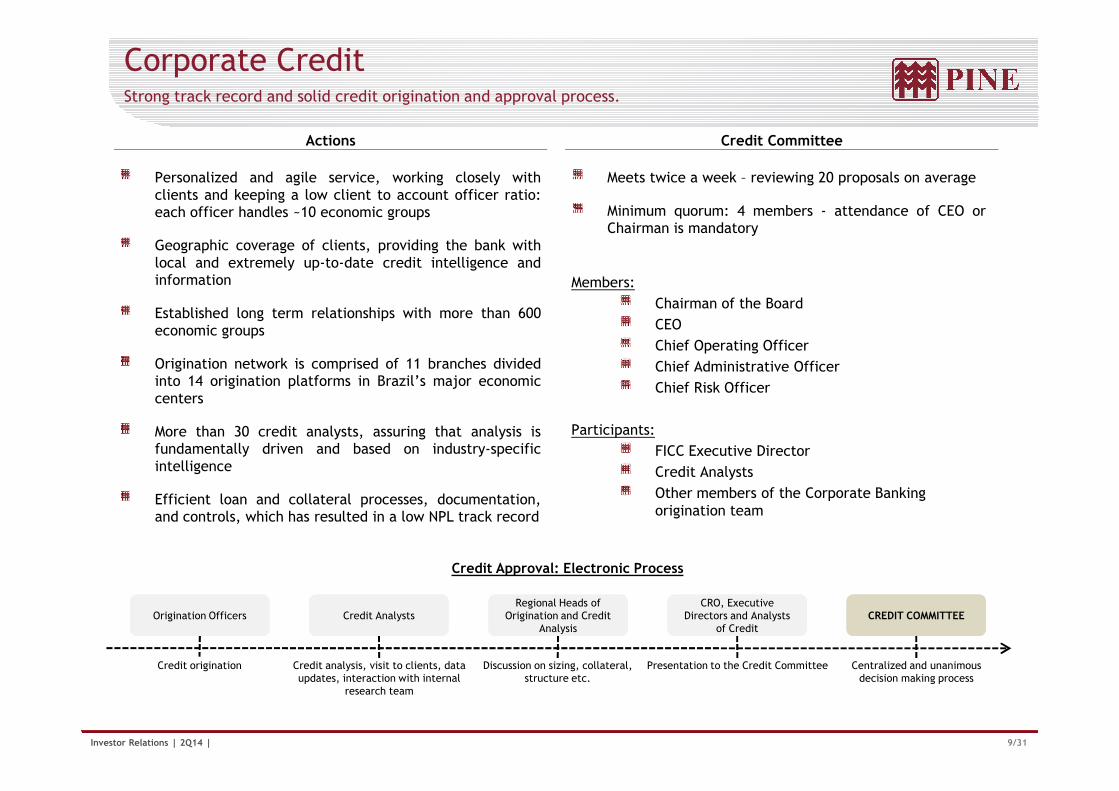
Strong track record and solid credit origination and approval process.
Meets twice a week – reviewing 20 proposals on average
Minimum quorum: 4 members - attendance of CEO orChairman is mandatory
Members:
Chairman of the Board
CEO
Chief Operating Officer
Chief Administrative Officer
Chief Risk Officer
Personalized and agile service, working closely withclients and keeping a low client to account officer ratio:each officer handles ~10 economic groups
Geographic coverage of clients, providing the bank withlocal and extremely up-to-date credit intelligence andinformation
Established long term relationships with more than 600economic groups
Origination network is comprised of 11 branches dividedinto 14 origination platforms in Brazil’s major economiccenters
9/31Investor Relations | 2Q14 |
Credit Approval: Electronic Process
Origination OfficersOrigination Officers
Credit origination Credit analysis, visit to clients, data updates, interaction with internal
research team
Credit AnalystsCredit AnalystsRegional Heads of
Origination and Credit Analysis
Regional Heads of Origination and Credit
Analysis
Presentation to the Credit Committee
CRO, Executive Directors and Analysts
of Credit
CRO, Executive Directors and Analysts
of Credit
Centralized and unanimous decision making process
CREDIT COMMITTEE CREDIT COMMITTEE
Chief Risk Officer
Participants:
FICC Executive Director
Credit Analysts
Other members of the Corporate Banking origination team
centers
More than 30 credit analysts, assuring that analysis isfundamentally driven and based on industry-specificintelligence
Efficient loan and collateral processes, documentation,and controls, which has resulted in a low NPL track record
Discussion on sizing, collateral, structure etc.
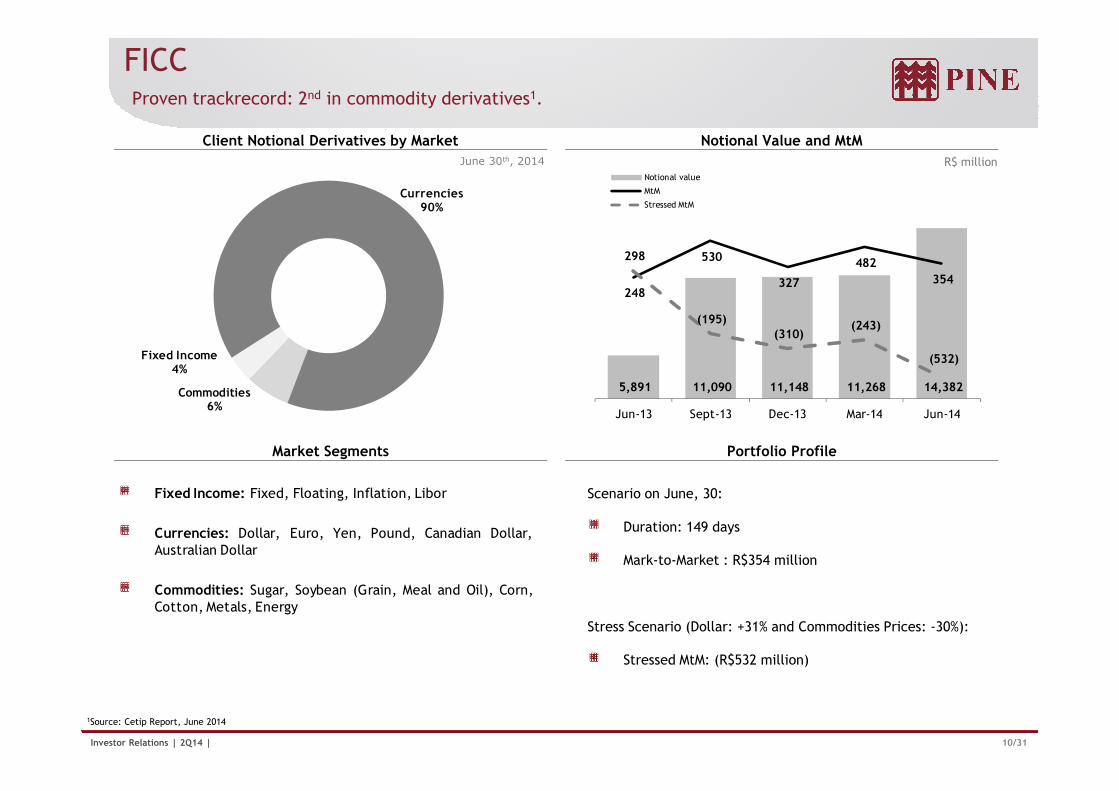
Commodities
Fixed Income4%
Currencies90%
5,891 11,090 11,148 11,268 14,382
248
530
327
482
354
298
(195)(310)
(243)
(532)
Notional value
MtM
Stressed MtM
June 30th, 2014 R$ million
FICCProven trackrecord: 2nd in commodity derivatives1.
Client Notional Derivatives by Market Notional Value and MtM
10/31Investor Relations | 2Q14 |
Commodities6%
Jun-13 Sept-13 Dec-13 Mar-14 Jun-14
Market Segments Portfolio Profile
1Source: Cetip Report, June 2014
Scenario on June, 30:
Duration: 149 days
Mark-to-Market : R$354 million
Stress Scenario (Dollar: +31% and Commodities Prices: -30%):
Stressed MtM: (R$532 million)
Fixed Income: Fixed, Floating, Inflation, Libor
Currencies: Dollar, Euro, Yen, Pound, Canadian Dollar,Australian Dollar
Commodities: Sugar, Soybean (Grain, Meal and Oil), Corn,Cotton, Metals, Energy
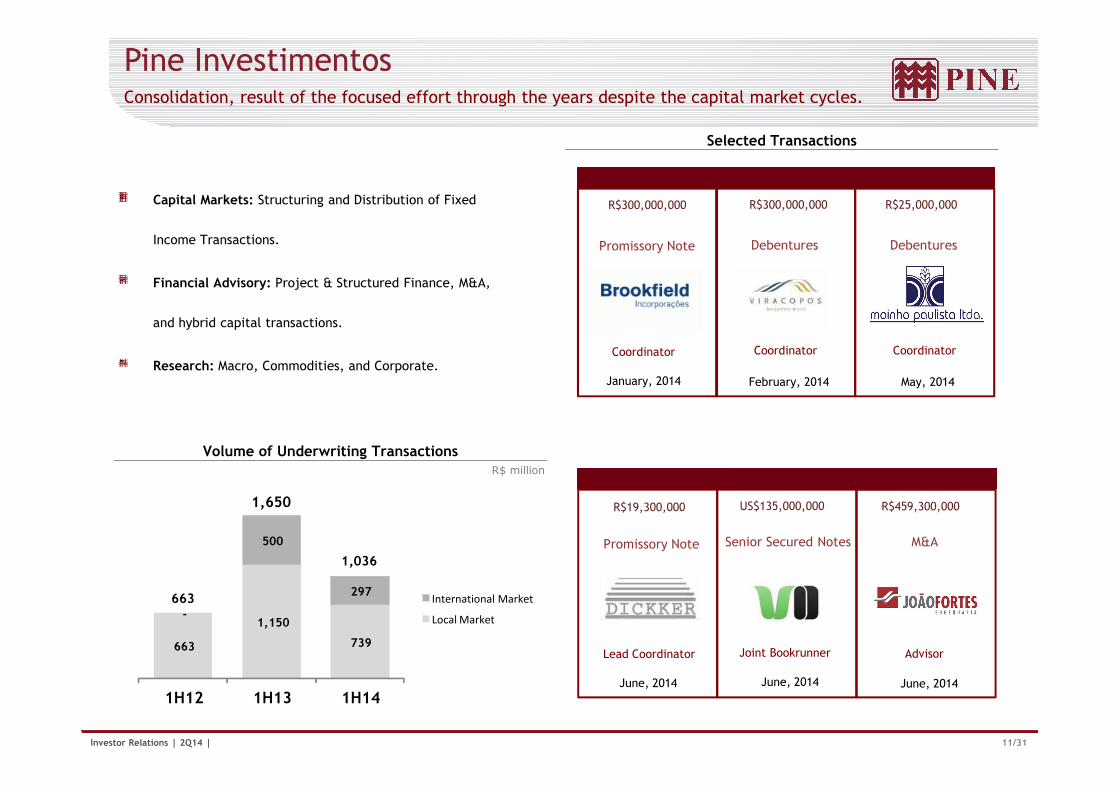
R$300,000,000
January, 2014
Coordinator
Pine Investimentos
Selected Transactions
Consolidation, result of the focused effort through the years despite the capital market cycles.
Promissory Note
R$300,000,000
February, 2014
Debentures
Coordinator
R$25,000,000
May, 2014
Debentures
Coordinator
Capital Markets: Structuring and Distribution of Fixed
Income Transactions.
Financial Advisory: Project & Structured Finance, M&A,
and hybrid capital transactions.
Research: Macro, Commodities, and Corporate.
11/31Investor Relations | 2Q14 |
R$ million
Volume of Underwriting Transactions
R$19,300,000
June, 2014
Lead Coordinator
Promissory Note
US$135,000,000
June, 2014
Joint Bookrunner
Senior Secured Notes
R$459,300,000
June, 2014
M&A
Advisor663
1,150
739
-
500
297
1H12 1H13 1H14
International Market
Local Market
1,036
663
1,650
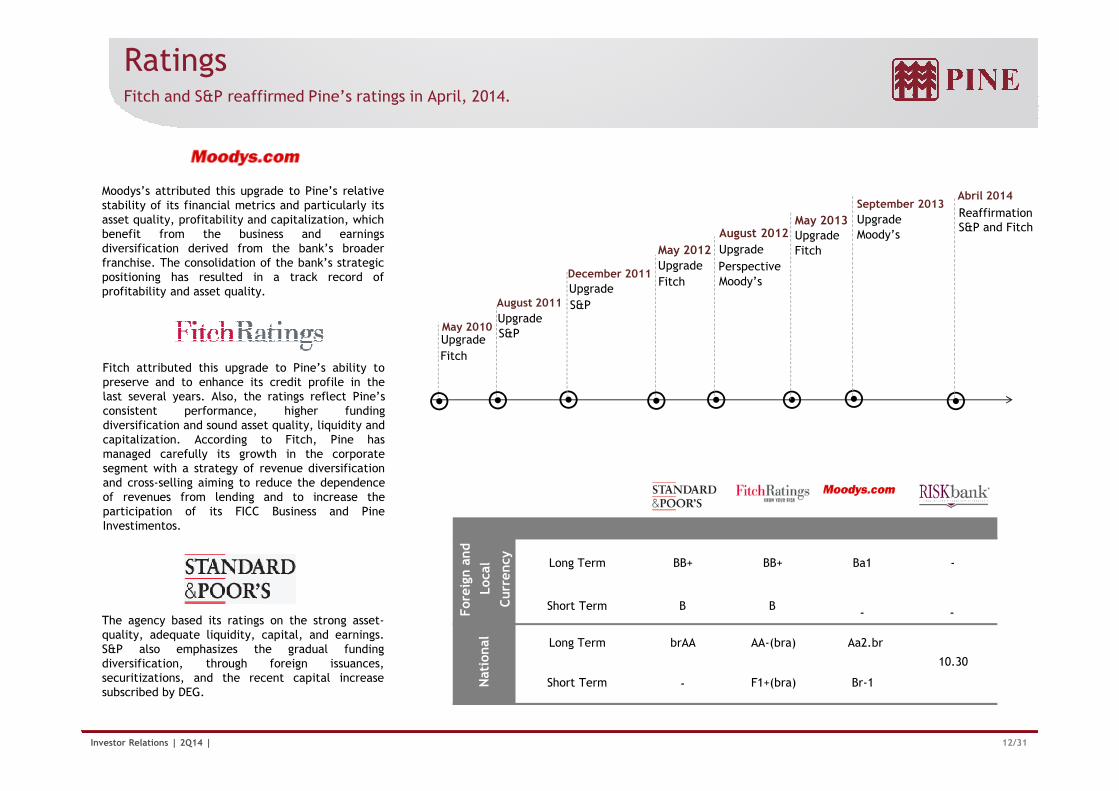
RatingsFitch and S&P reaffirmed Pine’s ratings in April, 2014.
Moodys’s attributed this upgrade to Pine’s relativestability of its financial metrics and particularly itsasset quality, profitability and capitalization, whichbenefit from the business and earningsdiversification derived from the bank’s broaderfranchise. The consolidation of the bank’s strategicpositioning has resulted in a track record ofprofitability and asset quality.
Fitch attributed this upgrade to Pine’s ability topreserve and to enhance its credit profile in thelast several years. Also, the ratings reflect Pine’s
August 2011
UpgradeS&P
December 2011
Upgrade
S&P
May 2012
Upgrade
Fitch
� � �
May 2010Upgrade
Fitch
� � �
August 2012
Upgrade
Perspective Moody’s
May 2013Upgrade
Fitch
�
September 2013
Upgrade
Moody’s
�
Abril 2014
ReaffirmationS&P and Fitch
12/31Investor Relations | 2Q14 |
The agency based its ratings on the strong asset-quality, adequate liquidity, capital, and earnings.S&P also emphasizes the gradual fundingdiversification, through foreign issuances,securitizations, and the recent capital increasesubscribed by DEG.
last several years. Also, the ratings reflect Pine’sconsistent performance, higher fundingdiversification and sound asset quality, liquidity andcapitalization. According to Fitch, Pine hasmanaged carefully its growth in the corporatesegment with a strategy of revenue diversificationand cross-selling aiming to reduce the dependenceof revenues from lending and to increase theparticipation of its FICC Business and PineInvestimentos.
� � �� � �
Long Term BB+ BB+ Ba1 -
Short Term B B- -
Long Term brAA AA-(bra) Aa2.br
Short Term - F1+(bra) Br-1
Fore
ign a
nd
Loca
l
Curr
ency
Nati
onal
10.30
� �

Highlights and Results
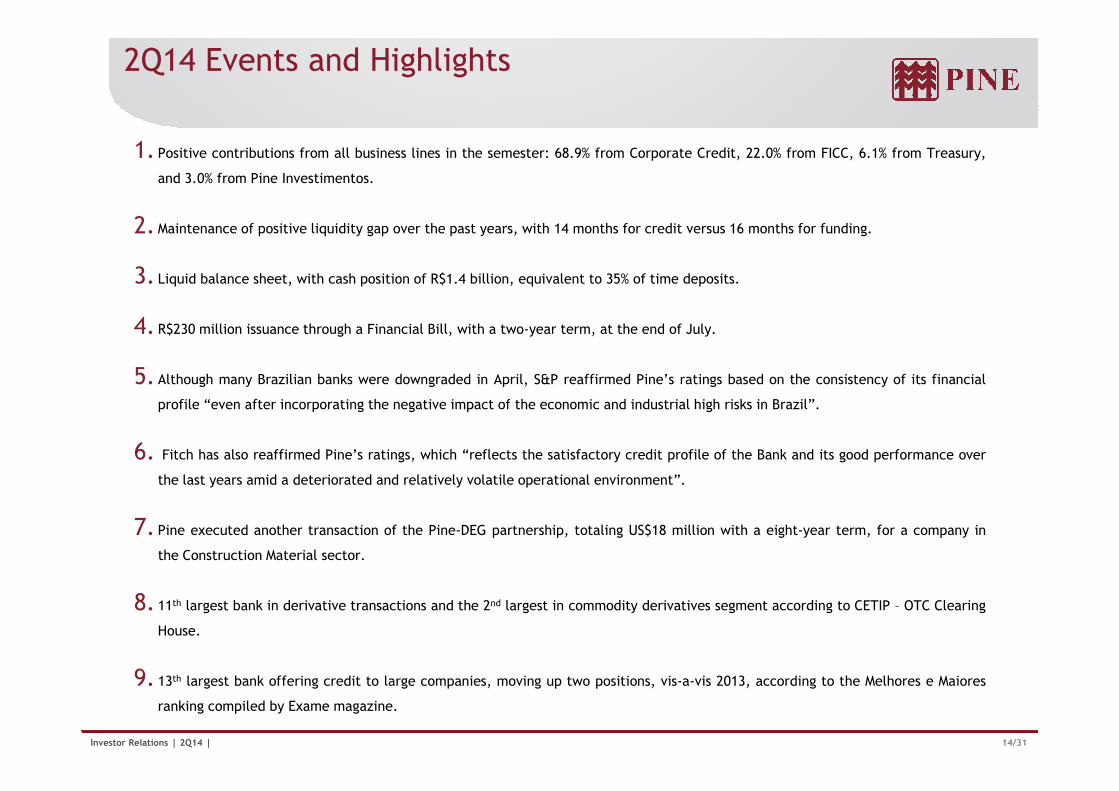
2Q14 Events and Highlights
1. Positive contributions from all business lines in the semester: 68.9% from Corporate Credit, 22.0% from FICC, 6.1% from Treasury,
and 3.0% from Pine Investimentos.
2.Maintenance of positive liquidity gap over the past years, with 14 months for credit versus 16 months for funding.
3. Liquid balance sheet, with cash position of R$1.4 billion, equivalent to 35% of time deposits.
4. R$230 million issuance through a Financial Bill, with a two-year term, at the end of July.
5. Although many Brazilian banks were downgraded in April, S&P reaffirmed Pine’s ratings based on the consistency of its financial
profile “even after incorporating the negative impact of the economic and industrial high risks in Brazil”.
14/31Investor Relations | 2Q14 |
profile “even after incorporating the negative impact of the economic and industrial high risks in Brazil”.
6. Fitch has also reaffirmed Pine’s ratings, which “reflects the satisfactory credit profile of the Bank and its good performance over
the last years amid a deteriorated and relatively volatile operational environment”.
7. Pine executed another transaction of the Pine-DEG partnership, totaling US$18 million with a eight-year term, for a company in
the Construction Material sector.
8. 11th largest bank in derivative transactions and the 2nd largest in commodity derivatives segment according to CETIP – OTC Clearing
House.
9. 13th largest bank offering credit to large companies, moving up two positions, vis-a-vis 2013, according to the Melhores e Maiores
ranking compiled by Exame magazine.
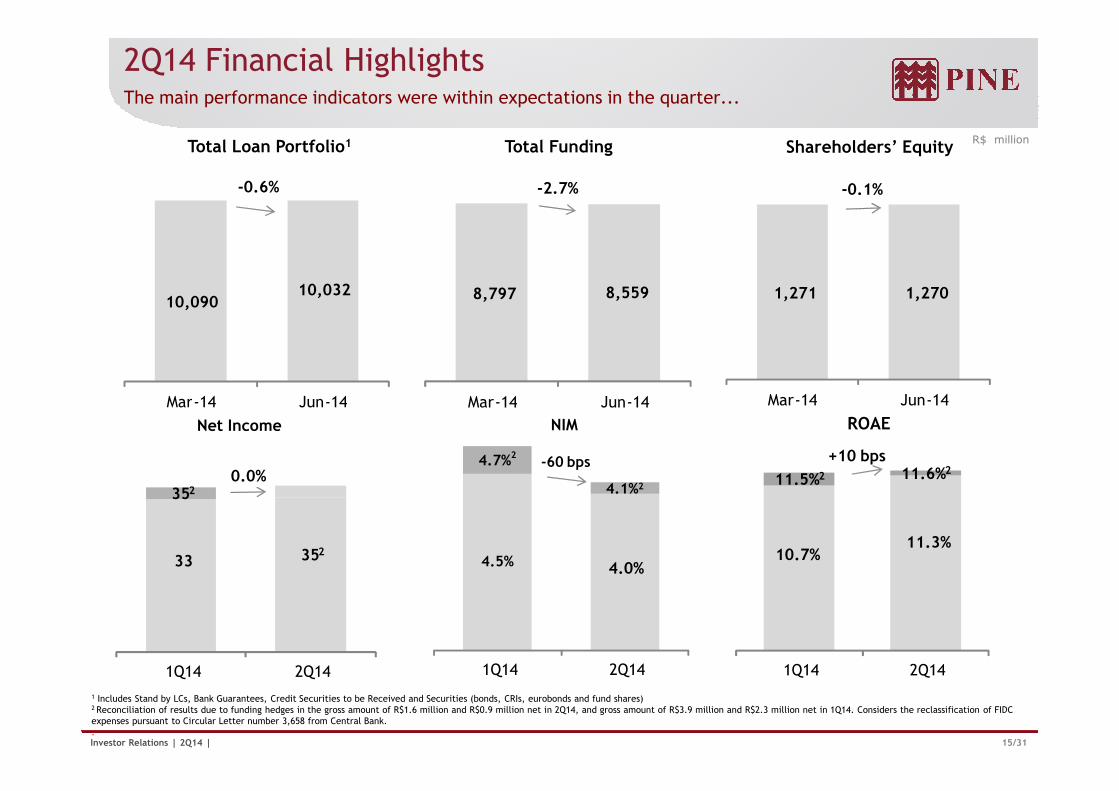
2Q14 Financial Highlights
R$ million
The main performance indicators were within expectations in the quarter...
10,090 10,032
Mar-14 Jun-14
Total Loan Portfolio1
-0.6%
8,797 8,559
Mar-14 Jun-14
Total Funding
-2.7%
1,271 1,270
Mar-14 Jun-14
Shareholders’ Equity
-0.1%
15/31Investor Relations | 2Q14 |
1 Includes Stand by LCs, Bank Guarantees, Credit Securities to be Received and Securities (bonds, CRIs, eurobonds and fund shares)2 Reconciliation of results due to funding hedges in the gross amount of R$1.6 million and R$0.9 million net in 2Q14, and gross amount of R$3.9 million and R$2.3 million net in 1Q14. Considers the reclassification of FIDC expenses pursuant to Circular Letter number 3,658 from Central Bank..
Mar-14 Jun-14 Mar-14 Jun-14 Mar-14 Jun-14
33 352
352
1Q14 2Q14
Net Income
0.0%
4.5% 4.0%
4.7%2
4.1%2
1Q14 2Q14
NIM
-60 bps
10.7%11.3%
11.5%2 11.6%2
1Q14 2Q14
ROAE
+10 bps
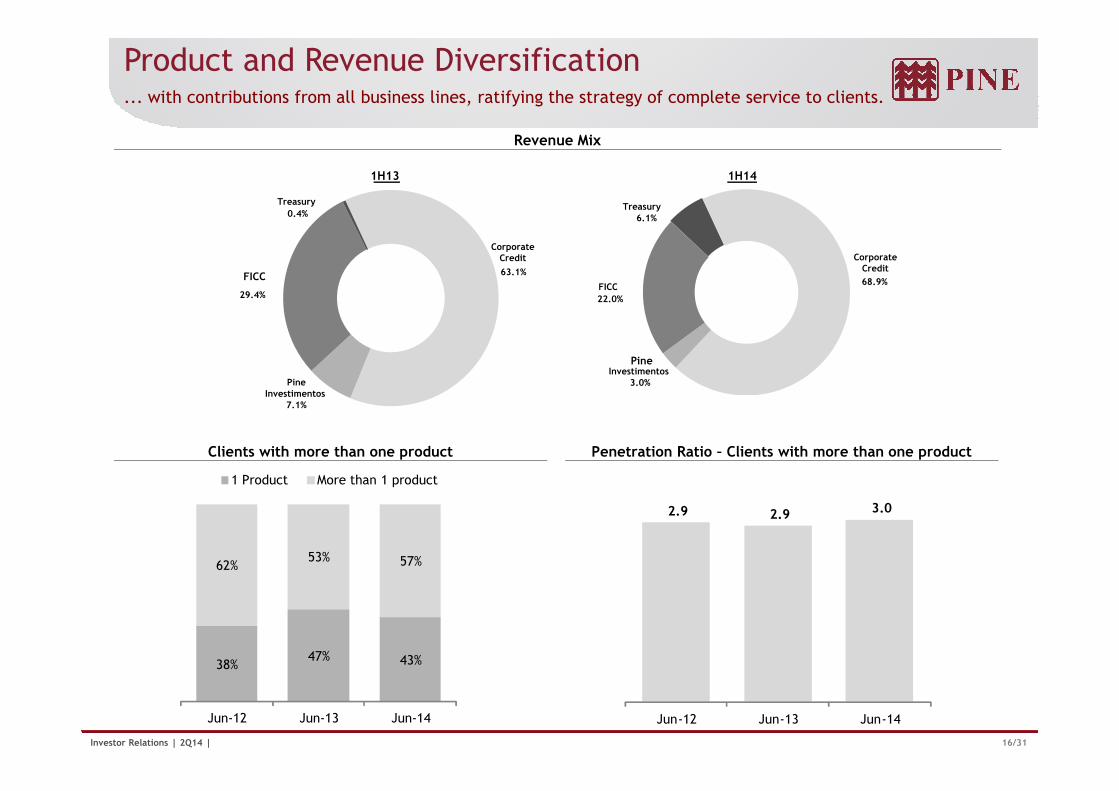
Product and Revenue Diversification... with contributions from all business lines, ratifying the strategy of complete service to clients.
Revenue Mix
CorporateCredit
63.1%
Pine Investimentos
FICC
29.4%
Treasury
0.4%
1H13
Corporate Credit
68.9%
Pine Investimentos
3.0%
FICC
22.0%
Treasury6.1%
1H14
16/31Investor Relations | 2Q14 |
Clients with more than one product Penetration Ratio – Clients with more than one product
Investimentos7.1%
38%47% 43%
62%53% 57%
Jun-12 Jun-13 Jun-14
1 Product More than 1 product
2.9 2.9 3.0
Jun-12 Jun-13 Jun-14
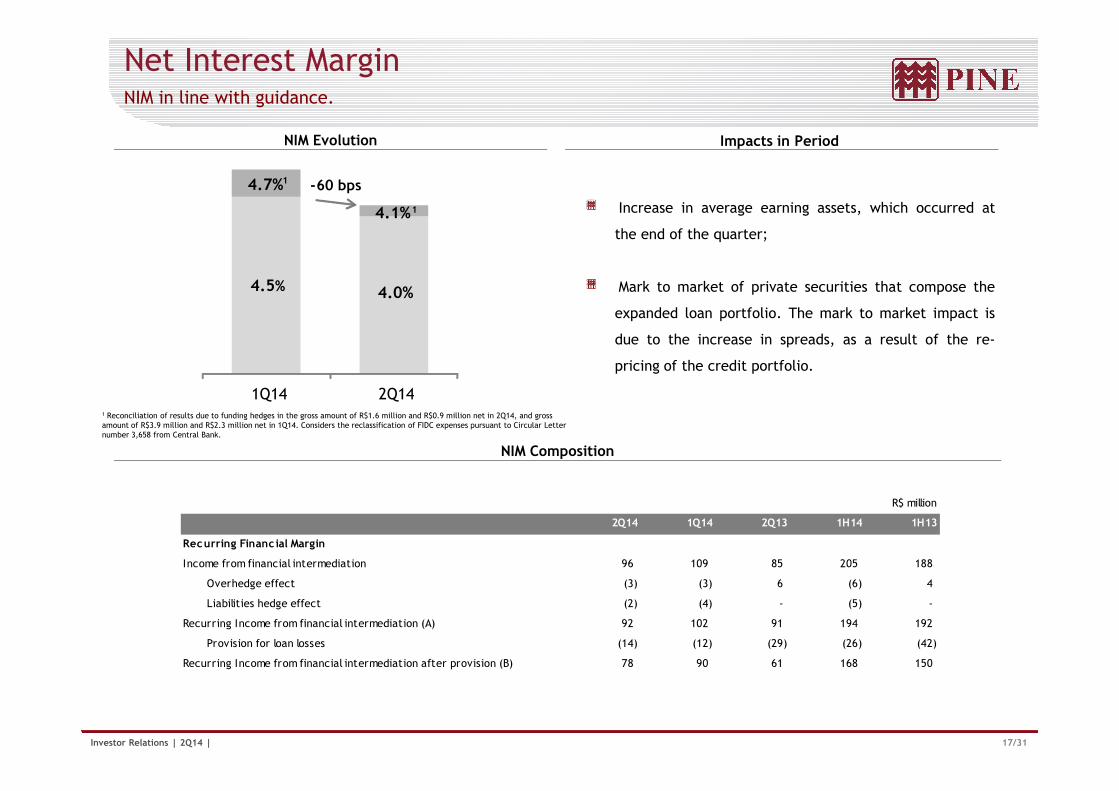
Net Interest Margin
NIM Evolution Impacts in Period
NIM in line with guidance.
Increase in average earning assets, which occurred at
the end of the quarter;
Mark to market of private securities that compose the
expanded loan portfolio. The mark to market impact is
due to the increase in spreads, as a result of the re-
pricing of the credit portfolio.
4.5% 4.0%
4.7%1
4.1%1
1Q14 2Q14
-60 bps
17/31Investor Relations | 2Q14 |
NIM Composition
1Q14 2Q141 Reconciliation of results due to funding hedges in the gross amount of R$1.6 million and R$0.9 million net in 2Q14, and grossamount of R$3.9 million and R$2.3 million net in 1Q14. Considers the reclassification of FIDC expenses pursuant to Circular Letter number 3,658 from Central Bank.
R$ million
2Q14 1Q14 2Q13 1H14 1H13
Recurring Financ ial Margin
Income from financial intermediation 96 109 85 205 188
Overhedge effect (3) (3) 6 (6) 4
Liabilities hedge effect (2) (4) - (5) -
Recurring Income from financial intermediation (A) 92 102 91 194 192
Provision for loan losses (14) (12) (29) (26) (42)
Recurring Income from financial intermediation after provision (B) 78 90 61 168 150
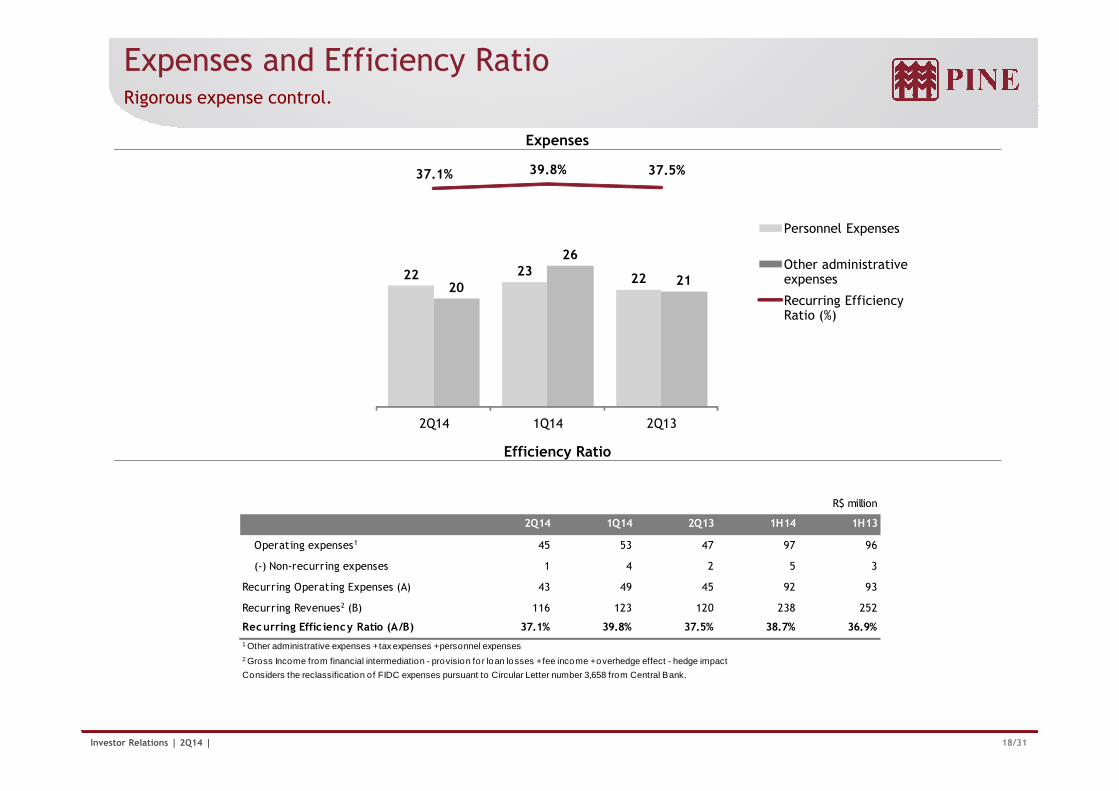
Expenses and Efficiency Ratio
Expenses
Rigorous expense control.
22 2322
20
26
21
37.1% 39.8% 37.5%
- 80,0%
- 60,0%
- 40,0%
- 20,0%
0,0%
20,0%
40,0%
60,0%
5
10
15
20
25
30
35
40
45
50
Personnel Expenses
Other administrative expenses
Recurring EfficiencyRatio (%)
18/31Investor Relations | 2Q14 |
Efficiency Ratio
- 100,0%0
2Q14 1Q14 2Q13
R$ million
2Q14 1Q14 2Q13 1H14 1H13
Operating expenses1 45 53 47 97 96
(-) Non-recurring expenses 1 4 2 5 3
Recurring Operating Expenses (A) 43 49 45 92 93
Recurring Revenues2 (B) 116 123 120 238 252
Recurring Effic iency Ratio (A/B) 37.1% 39.8% 37.5% 38.7% 36.9%
1 Other administrative expenses + tax expenses + personnel expenses
Considers the reclassification of FIDC expenses pursuant to Circular Letter number 3,658 from Central Bank.
2 Gross Income from financial intermediation - provision fo r loan losses + fee income + overhedge effect - hedge impact
R$ million
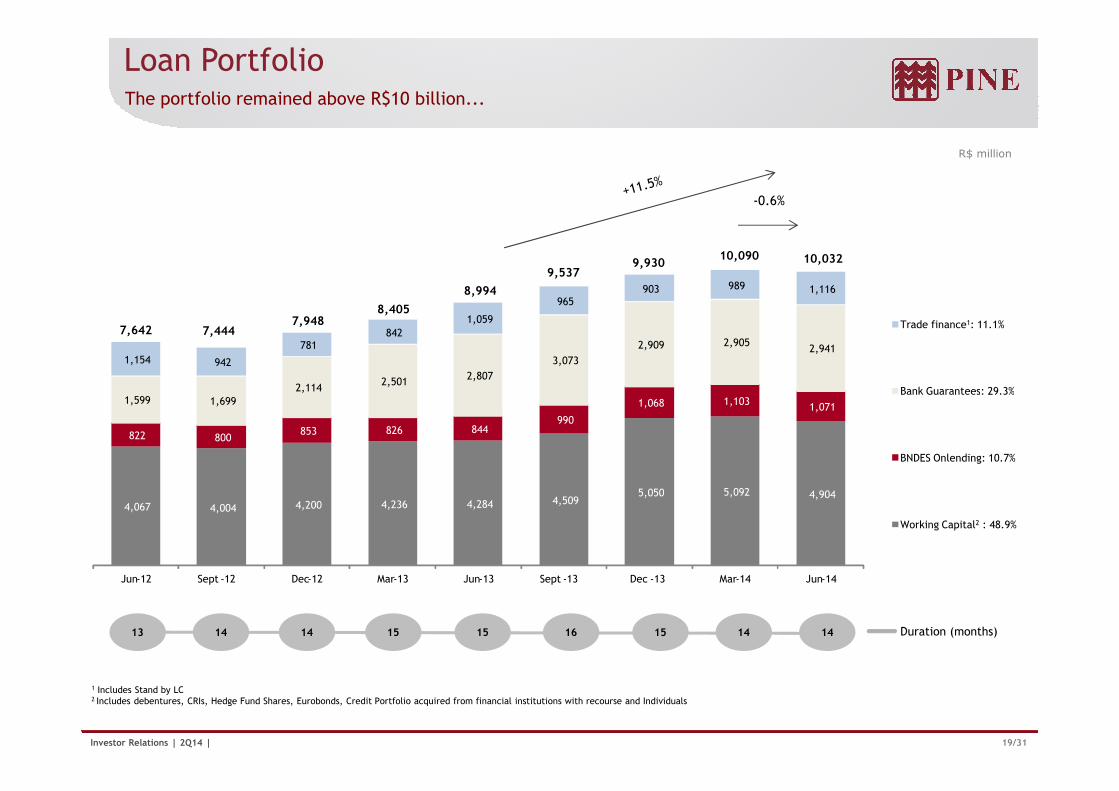
Loan PortfolioThe portfolio remained above R$10 billion...
-0.6%
7,642 7,4447,948
8,405
8,994
9,5379,930
10,090 10,032
1,103 1,599 1,699 2,114
2,501 2,807
3,073
2,909 2,905 2,941
1,154 942
781 842
1,059
965 903 989 1,116
Trade finance1: 11.1%
Bank Guarantees: 29.3%
19/31Investor Relations | 2Q14 |
1 Includes Stand by LC2 Includes debentures, CRIs, Hedge Fund Shares, Eurobonds, Credit Portfolio acquired from financial institutions with recourse and Individuals
4,067 4,004 4,200 4,236 4,284 4,509 5,050 5,092 4,904
822 800 853 826 844
990
1,068 1,103 1,071
1,599 1,699
Jun-12 Sept -12 Dec-12 Mar-13 Jun-13 Sept -13 Dec -13 Mar-14 Jun-14
Bank Guarantees: 29.3%
BNDES Onlending: 10.7%
Working Capital2 : 48.9%
13 14 14 15 1515 16 14 14 Duration (months)
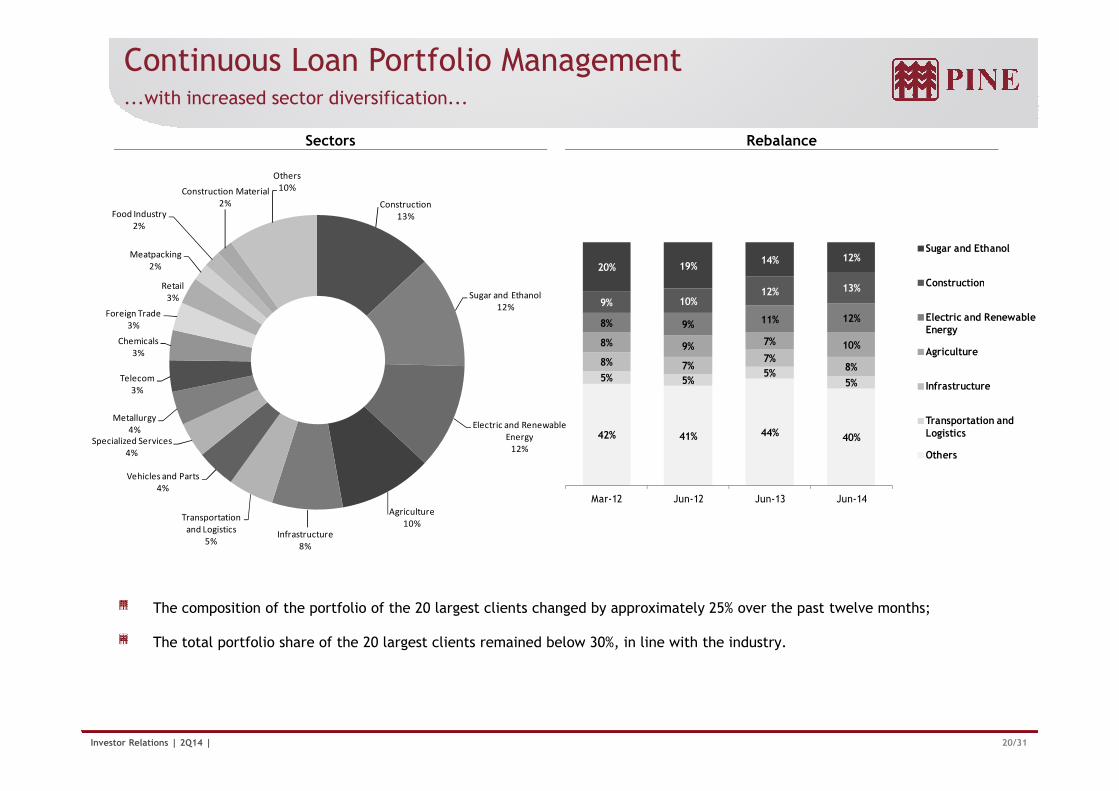
Continuous Loan Portfolio Management
Sectors Rebalance
...with increased sector diversification...
5%5%
5%5%8%
7%7%8%
10%7%9%8%
12%11%9%8%
13%12%10%9%
12%14%19%20%
Sugar and Ethanol
Construction
Electric and Renewable Energy
Agriculture
Infrastructure
Construction
13%
Sugar and Ethanol
12%
Telecom
3%
Chemicals
3%
Foreign Trade
3%
Retail
3%
Meatpacking
2%
Food Industry
2%
Construction Material
2%
Others
10%
20/31Investor Relations | 2Q14 |
The composition of the portfolio of the 20 largest clients changed by approximately 25% over the past twelve months;
The total portfolio share of the 20 largest clients remained below 30%, in line with the industry.
40%44%41%42%
Jun-14Jun-13Jun-12Mar-12
Transportation and Logistics
Others
Electric and Renewable
Energy
12%
Agriculture
10%
Infrastructure
8%
Transportation
and Logistics
5%
Vehicles and Parts
4%
Specialized Services
4%
Metallurgy
4%
3%
June 30, 2014
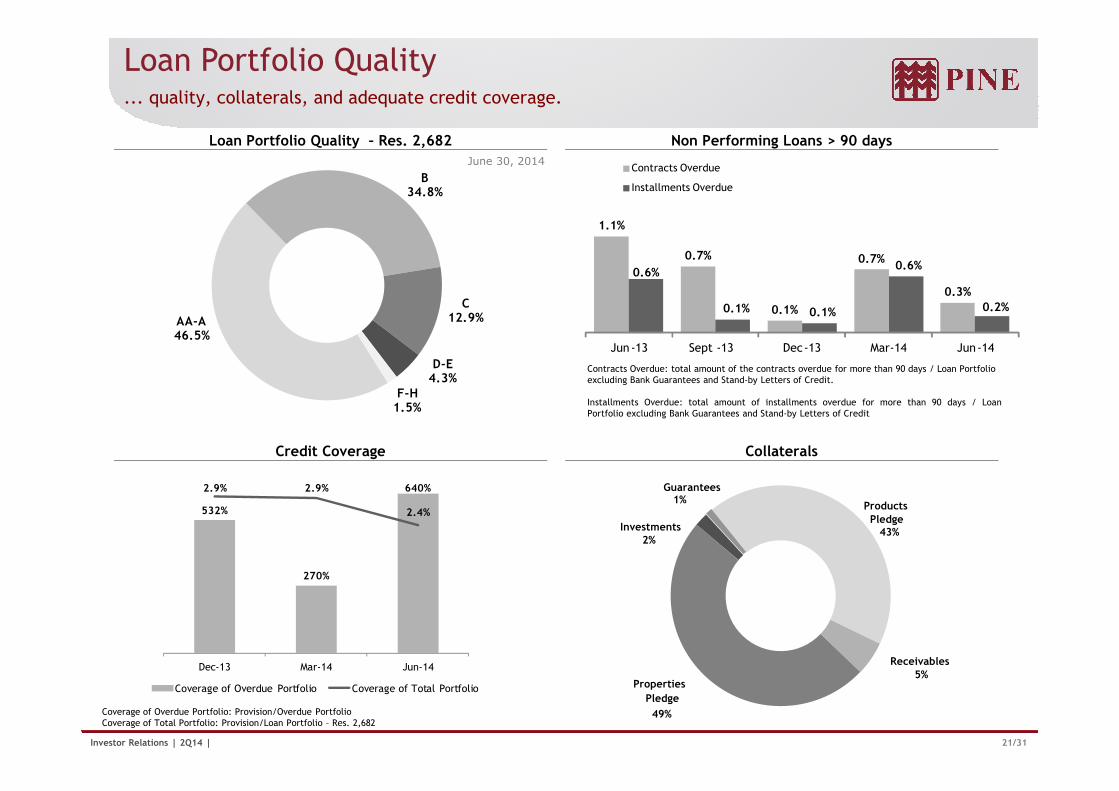
Contracts Overdue: total amount of the contracts overdue for more than 90 days / Loan Portfolioexcluding Bank Guarantees and Stand-by Letters of Credit.
Loan Portfolio Quality... quality, collaterals, and adequate credit coverage.
Loan Portfolio Quality – Res. 2,682 Non Performing Loans > 90 days
1.1%
0.7%
0.1%
0.7%
0.3%
0.6%
0.1% 0.1%
0.6%
0.2%
0,0%
0,5%
1,0%
1,5%
2,0%
Jun-13 Sept -13 Dec-13 Mar-14 Jun-14
Contracts Overdue
Installments Overdue
AA-A46.5%
B34.8%
C12.9%
D-E4.3%
F-H
21/31Investor Relations | 2Q14 |
Installments Overdue: total amount of installments overdue for more than 90 days / LoanPortfolio excluding Bank Guarantees and Stand-by Letters of Credit
Coverage of Overdue Portfolio: Provision/Overdue PortfolioCoverage of Total Portfolio: Provision/Loan Portfolio – Res. 2,682
Credit Coverage Collaterals
ProductsPledge
43%
Receivables5%
Properties
Pledge
49%
Investments2%
Guarantees1%
F-H1.5%
532%
270%
640%2.9% 2.9%
2.4%
0.0%
0.5%
1.0%
1.5%
2.0%
2.5%
3.0%
-50%
50%
150%
250%
350%
450%
550%
650%
Dec-13 Mar-14 Jun-14
Coverage of Overdue Portfolio Coverage of Total Portfolio
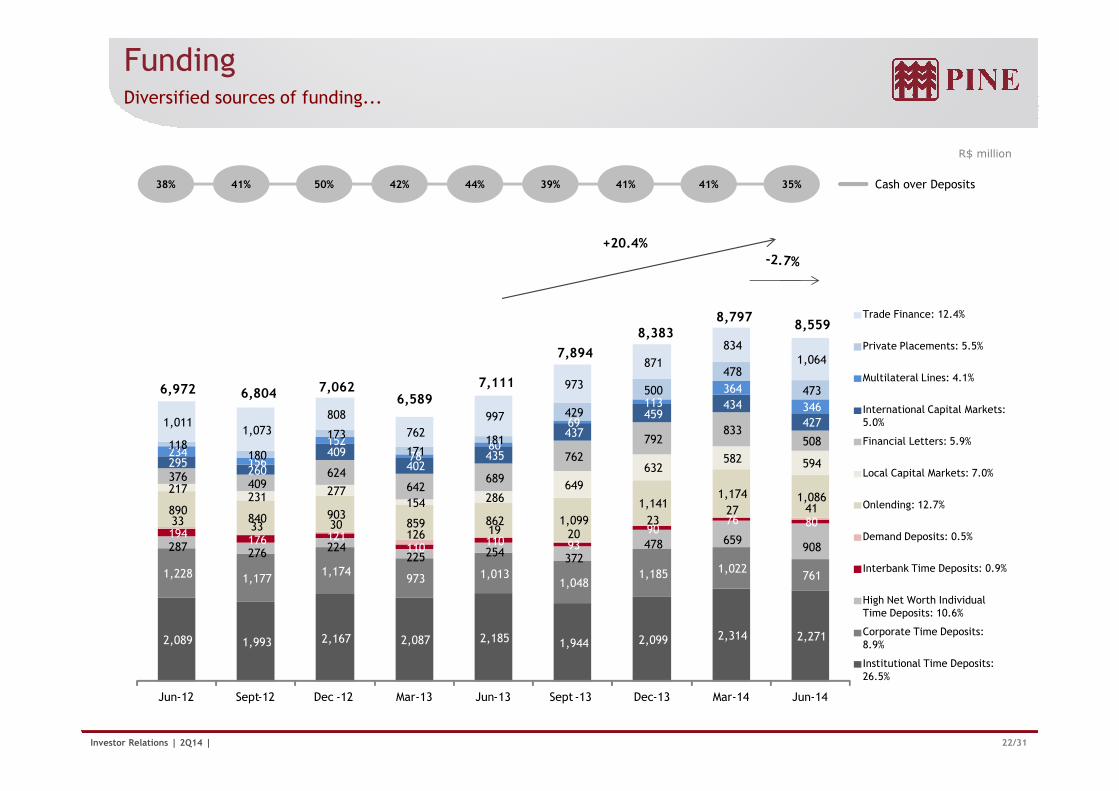
R$ million
+20.4%
FundingDiversified sources of funding...
38% 41% 50% 42% 41%44% 39% 41% 35% Cash over Deposits
113 364 500
478
473 973
871
834 1,064
6,972 6,804 7,062 6,589
7,111
7,894
8,383 8,797
8,559 Trade Finance: 12.4%
Private Placements: 5.5%
Multilateral Lines: 4.1%
22/31Investor Relations | 2Q14 |
2,089 1,993 2,167 2,087 2,185 1,944 2,099 2,314 2,271
1,228 1,177 1,174
973 1,013 1,048
1,185 1,022 761
287 276 224
225 254 372
478 659 908
194 176 121
110 110 93
90 76 80 33 33 30
126 19 20 23
27 41 890 840 903
859 862 1,099
1,141 1,174 1,086
217231
277 154 286
649
632 582 594
376409
624 642
689
762
792 833
508
295 260
409 402
435
437
459 434
427
234 156
152
78 80
69
113 346
118 180
173
171 181
429
500 473
1,011 1,073
808
762
997
6,972 6,804 6,589
Jun-12 Sept-12 Dec -12 Mar-13 Jun-13 Sept-13 Dec-13 Mar-14 Jun-14
International Capital Markets: 5.0%
Financial Letters: 5.9%
Local Capital Markets: 7.0%
Onlending: 12.7%
Demand Deposits: 0.5%
Interbank Time Deposits: 0.9%
High Net Worth Individual Time Deposits: 10.6%
Corporate Time Deposits: 8.9%
Institutional Time Deposits: 26.5%
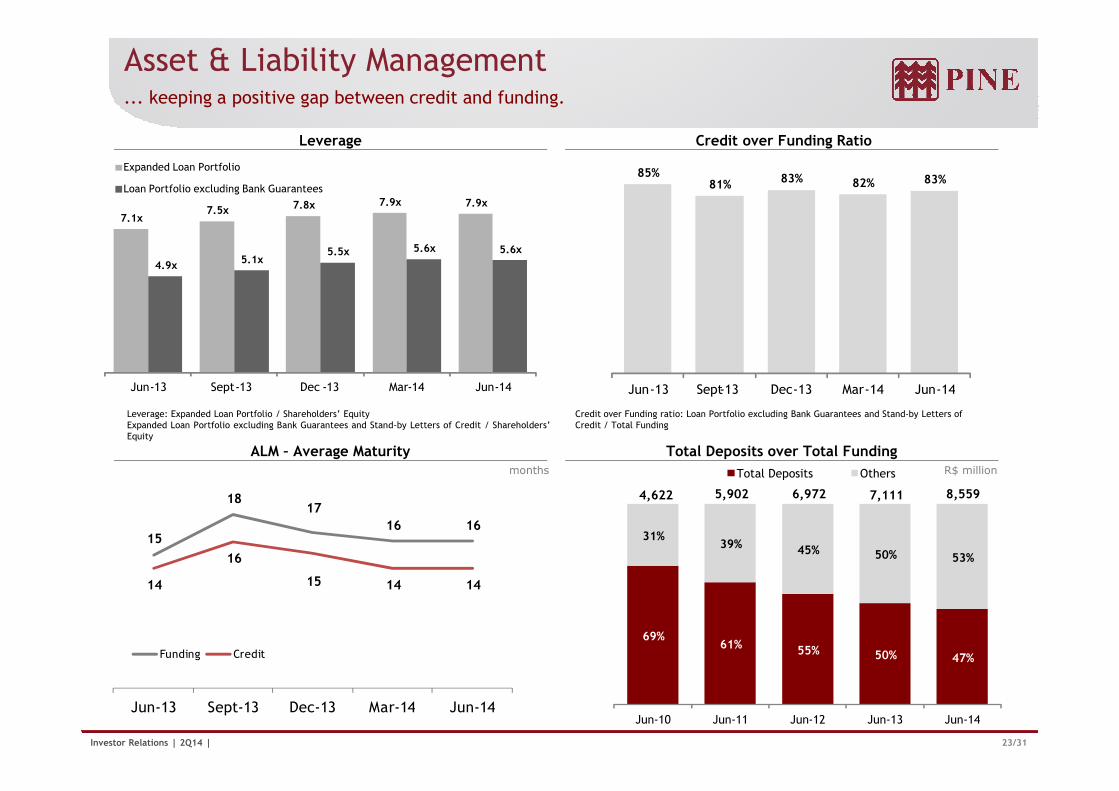
Asset & Liability Management... keeping a positive gap between credit and funding.
Leverage Credit over Funding Ratio
7.1x 7.5x 7.8x 7.9x 7.9x
4.9x 5.1x
5.5x 5.6x 5.6x
-
1,0
2,0
3,0
4,0
5,0
6,0
7,0
8,0
9,0
10,0
Jun-13 Sept-13 Dec -13 Mar-14 Jun-14
Expanded Loan Portfolio
Loan Portfolio excluding Bank Guarantees
85%81% 83% 82% 83%
Jun-13 Sept-13 Dec-13 Mar-14 Jun-14
23/31Investor Relations | 2Q14 |
15
18 17
16 16
14
16
15 14 14
Jun-13 Sept-13 Dec-13 Mar-14 Jun-14
Funding Credit
Leverage: Expanded Loan Portfolio / Shareholders’ EquityExpanded Loan Portfolio excluding Bank Guarantees and Stand-by Letters of Credit / Shareholders’Equity
Credit over Funding ratio: Loan Portfolio excluding Bank Guarantees and Stand-by Letters ofCredit / Total Funding
ALM – Average Maturity Total Deposits over Total FundingR$ millionmonths
8,5594,622 5,902 6,972 7,111
69%61% 55% 50% 47%
31%39% 45% 50% 53%
Jun-10 Jun-11 Jun-12 Jun-13 Jun-14
Total Deposits Others
Jun-13 Sept-13 Dec-13 Mar-14 Jun-14
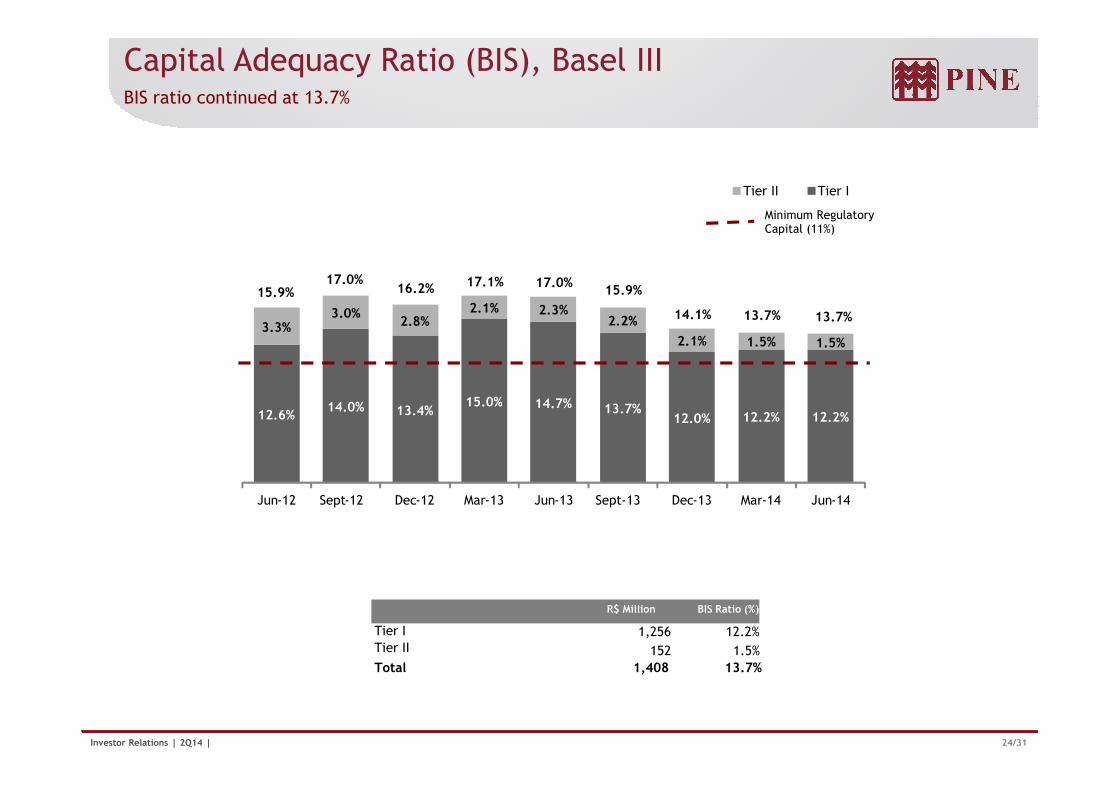
Capital Adequacy Ratio (BIS), Basel III BIS ratio continued at 13.7%
15.0% 14.7%
3.3%3.0%
2.8%2.1% 2.3%
2.2%
2.1% 1.5% 1.5%
15.9%17.0%
16.2% 17.1% 17.0%15.9%
14.1% 13.7% 13.7%
Tier II Tier I
Minimum Regulatory Capital (11%)
24/31Investor Relations | 2Q14 |
R$ Million BIS Ratio (%)
Tier I 1,256 12.2%Tier II 152 1.5%
Total 1,408 13.7%
12.6%14.0% 13.4%
15.0% 14.7% 13.7%12.0% 12.2% 12.2%
Jun-12 Sept-12 Dec-12 Mar-13 Jun-13 Sept-13 Dec-13 Mar-14 Jun-14

Corporate Governance and PINE4
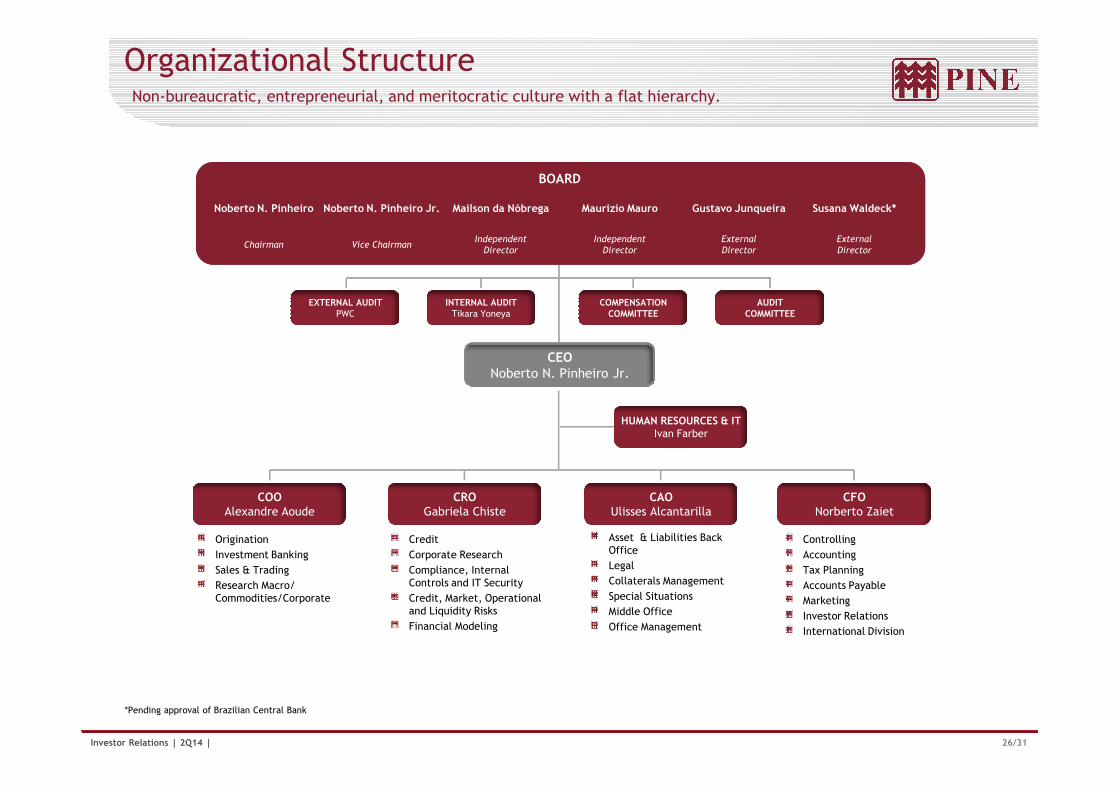
Organizational StructureNon-bureaucratic, entrepreneurial, and meritocratic culture with a flat hierarchy.
CEONoberto N. Pinheiro Jr.
INTERNAL AUDITTikara Yoneya
COMPENSATION COMMITTEE
AUDIT COMMITTEE
EXTERNAL AUDITPWC
Noberto N. Pinheiro Noberto N. Pinheiro Jr. Mailson da Nóbrega Maurizio Mauro Gustavo Junqueira Susana Waldeck*
Chairman Vice ChairmanIndependent
DirectorIndependent
DirectorExternalDirector
ExternalDirector
BOARD
26/31Investor Relations | 2Q14 |
COO Alexandre Aoude
CROGabriela Chiste
CAOUlisses Alcantarilla
CFONorberto Zaiet
HUMAN RESOURCES & ITIvan Farber
*Pending approval of Brazilian Central Bank
Origination
Investment Banking
Sales & Trading
Research Macro/ Commodities/Corporate
Credit
Corporate Research
Compliance, Internal Controls and IT Security
Credit, Market, Operational and Liquidity Risks
Financial Modeling
Asset & Liabilities Back Office
Legal
Collaterals Management
Special Situations
Middle Office
Office Management
Controlling
Accounting
Tax Planning
Accounts Payable
Marketing
Investor Relations
International Division
Corporate GovernancePine commits to best corporate governance practices…
Two Independent Members and Two External Member on the Board of Directors
Mailson Ferreira da Nóbrega: Brazil’s Finance Minister from 1988 to 1990
Maurizio Mauro: Former CEO of Booz Allen Hamilton and Grupo Abril
Gustavo Junqueira: Former Head of Pine Investimentos, Member of the Board of Directors atEZTEC, Financial Advisor at Arsenal Investimentos and CFO at Gradiente Eletrônica
Harumi Susana Ueta Waldeck*: Former CFO of Pine, with over 17 years of experience at thecompany. She brings the day-to-day experience to the Board.
27/31Investor Relations | 2Q14 |
São Paulo Stock Exchange (BM&FBOVESPA) Level 2 Corporate Governance
Audit and Compensation Committee reporting directly to the Board of Directors
100% tag along rights for all shareholders, including non-voting shares
Arbitration procedures for fast settlement of litigation cases
First Brazilian bank to release BR GAAP and IFRS quarterly
*Pending approval of Brazilian Central Bank
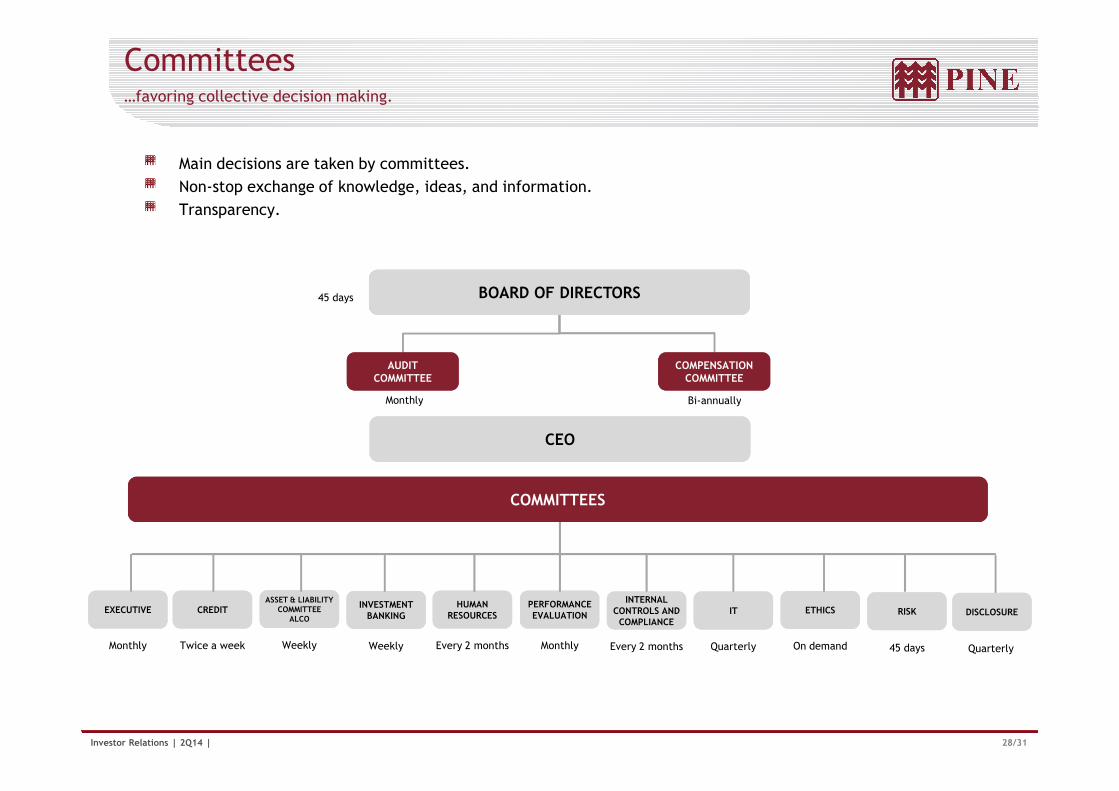
Committees…favoring collective decision making.
Main decisions are taken by committees.
Non-stop exchange of knowledge, ideas, and information.
Transparency.
Bi-annuallyMonthly
AUDIT COMMITTEE
BOARD OF DIRECTORS
COMPENSATION COMMITTEE
45 days
28/31Investor Relations | 2Q14 |
CEO
Bi-annuallyMonthly
CREDITASSET & LIABILITY
COMMITTEE ALCO
EXECUTIVEHUMAN
RESOURCESINVESTMENT
BANKINGPERFORMANCE EVALUATION IT ETHICS
COMPLIANCE
INTERNAL CONTROLS AND
COMPLIANCERISK
Twice a week WeeklyMonthly Every 2 monthsWeekly Monthly Quarterly On demandEvery 2 months 45 days
COMMITTEES
DISCLOSURE
Quarterly
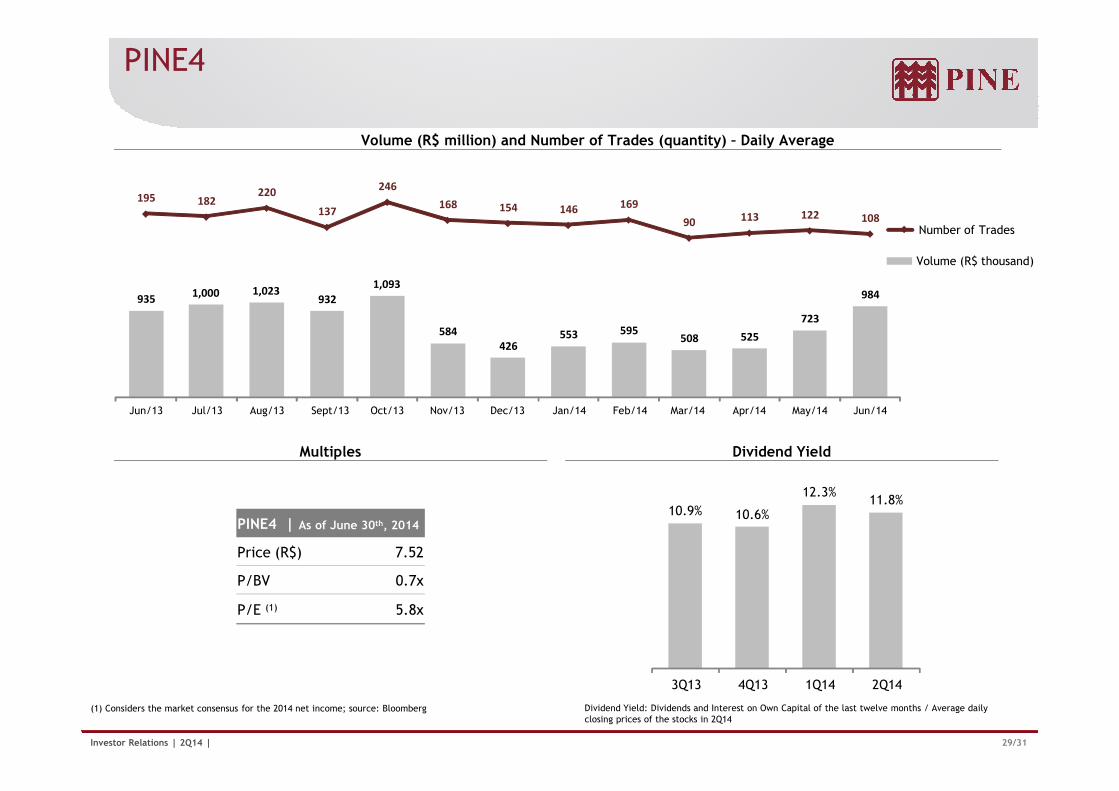
PINE4
Volume (R$ million) and Number of Trades (quantity) – Daily Average
935 1,000 1,023
932
1,093
584
426 553 595
508 525
723
984
195 182 220
137
246
168 154 146 169
90 113 122 108
Volume (R$ thousand)
Number of Trades
29/31Investor Relations | 2Q14 |
PINE4 | As of June 30th, 2014
Price (R$) 7.52
P/BV 0.7x
P/E (1) 5.8x
(1) Considers the market consensus for the 2014 net income; source: Bloomberg Dividend Yield: Dividends and Interest on Own Capital of the last twelve months / Average dailyclosing prices of the stocks in 2Q14
Multiples Dividend Yield
Jun/13 Jul/13 Aug/13 Sept/13 Oct/13 Nov/13 Dec/13 Jan/14 Feb/14 Mar/14 Apr/14 May/14 Jun/14
10.9% 10.6%
12.3%11.8%
3Q13 4Q13 1Q14 2Q14

Social Investment and ResponsibilityFocus on the short, medium and long term.
Partnerships
The UN initiative mobilizes the international businesscommunity to adopt fundamental and internationallyaccepted values in their business practices in the areasof human rights, labor relations, environment andcombating corruption, which are reflected in tenprinciples. Since October 2012
Responsible Credit
“Lists of Exceptions”: the Bank does not finance projects or thoseorganizations that damage the environment, are involved in illegallabor practices or produce, sell or use products, substances or activitiesconsidered prejudicial to society.
System of environmental monitoring, financed by the IADB andcoordinated by FGV, and internally-produced sustainability reports forcorporate loans
Principles applied to Project Finance transactions wheretotal project capital costs exceed US$10 million and arebased on International Finance Corporation PerformanceStandards on social and environmental sustainability andon the World Bank Group Environmental, Health, andSafety Guidelines (EHS Guidelines). Since December/2012
Protocolo Verde – “Green Protocol”, an agreementbetween FEBRABAN and the Ministry of the Environment
30/31Investor Relations | 2Q14 |
Social Investment Recognition
Most Green Bank
Recognized by the International Finance Corporation (IFC), privateagency programs of the World Bank as the most "green" bank as a resultof its transactions under the Global Trade Finance Program (GTFP) andits onlending to companies focused on renewable energy and ethanol
Efficiency Energy
Recognition by World Bank for support in the Energy Efficiency sector.
between FEBRABAN and the Ministry of the Environmentto support development that does not compromise futuregenerations.
Exhibition and sponsorship of Brazilian artists, for instance Paulo von Poser and
Miguel Rio Branco, in addition to sponsoring and supporting films and
documentaries such as Quebrando o Tabu (Fernando Henrique Cardoso on the
drug war), O Brasil deu certo, e agora? (idealized by Mailson da Nóbrega), Além
da Estrada (Charly Braun) and others.
Investor Relations
Noberto N. Pinheiro Jr.
CEO
Norberto Zaiet Junior
CFO/IRO
Raquel Varela
Head of Investor Relations
Alejandra Hidalgo
Investor Relations Manager
31/31Investor Relations | 2Q14 |
This report may contain forward-looking statements concerning the business prospects, projections of operating and financial results and growth outlook of PINE. These are merelyprojections and as such are based solely on management’s expectations regarding the future of the business. These statements depend substantially on market conditions, theperformance of the sector and the Brazilian economy (political and economic changes, volatility in interest and exchange rates, technological changes, inflation, financialdisintermediation, competitive pressures on products and prices and changes in tax legislation) and therefore are subject to change without prior notice..
Luiz Máximo
Investor Relations Specialist
Ana Lopes
Investor Relations Analyst
Phone: +55-11-3372-5343
www.pine.com/ir