2q14 quarterly earnings - samsung sdi official site
TRANSCRIPT

2Q14 QUARTERLY EARNINGS
July 25, 2014
This material is produced based on IFRS and assumptions and statements made could be different from actual results.
2Q14 Quarterly Earnings (Energy Solution)
2
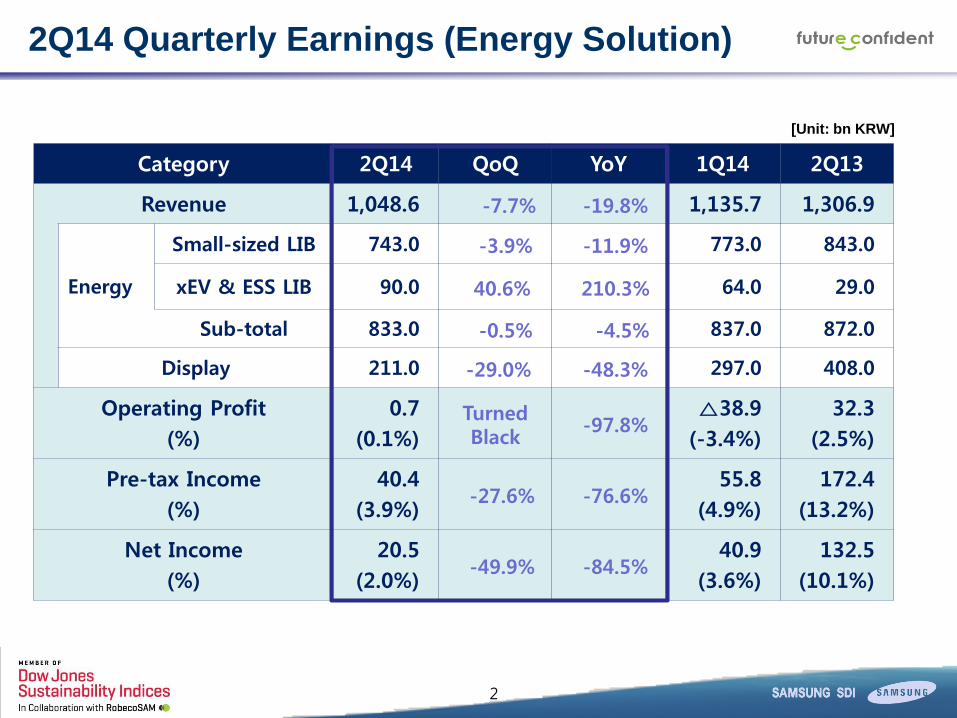
[Unit: bn KRW]
Category 2Q14 QoQ YoY 1Q14 2Q13
Revenue 1,048.6 -7.7% -19.8% 1,135.7 1,306.9
Energy
Small-sized LIB 743.0 -3.9% -11.9% 773.0 843.0
xEV & ESS LIB 90.0 40.6% 210.3% 64.0 29.0
Sub-total 833.0 -0.5% -4.5% 837.0 872.0
Display 211.0 -29.0% -48.3% 297.0 408.0
Operating Profit
(%)
0.7
(0.1%) Turned Black
-97.8% △38.9
(-3.4%)
32.3
(2.5%)
Pre-tax Income
(%)
40.4
(3.9%) -27.6% -76.6%
55.8
(4.9%)
172.4
(13.2%)
Net Income
(%)
20.5
(2.0%) -49.9% -84.5%
40.9
(3.6%)
132.5
(10.1%)

2Q14 Quarterly Earnings (Materials)
[Unit: bn KRW]
Category 2Q14 QoQ YoY 1Q14 2Q13
Revenue 1,060.8 1.2% -9.0% 1,048.6 1,165.3
Chemicals 694.9 1.7% -5.0% 683.5 731.1
Electronic Materials 365.9 0.2% -15.7% 365.1 434.2
Operating Profit
(%)
29.3
(2.8%) 15.8% -60.3%
25.3
(2.4%)
73.8
(6.3%)
Pre-tax Income
(%)
31.0
(2.9%) 38.4% -52.7%
22.4
(2.1%)
65.5
(5.6%)
Net Income
(%)
4.7
(0.4%) -75.0% -91.1%
18.8
(1.8%)
52.9
(4.5%)
3

2Q14 Financial Status
※ Cash & Cash equiv. including short-term financial instruments
[Unit: bn KRW]
Category Energy Solution Materials
2Q14 QoQ 1Q14 2Q14 QoQ 1Q14
Assets 10,874.9 240.1 10,634.8 4,805.0 62.2 4,742.8
Liabilities 2,922.3 -125.2 3,047.5 1,569.5 -77.8 1,647.3
Equity 7,952.6 365.3 7,587.3 3,235.5 140.0 3,095.5
Cash & Cash equiv. 821.0 163.4 657.6 887.8 171.1 716.7
Debt 1,164.2 -8.5 1,172.7 963.2 -57.9 1,021.1
4

ANALYSIS & OUTLOOK

Small-sized LIB
6
2Q14 Analysis 2H14 Outlook
≫ 2Q Shipment enlarged
- China sales up by twice in YoY
thanks to strong S/Phone demand
- Solid sales growth led by the US power
tool makers
- Continue to improve product mix through
new applications
≫ Estimate 2.45bn cell(+5% YoY ) LIB demand
- New S/Phone, Tablet PC by a major player
- 4G expansion in China acting as
S/Phone growth engine
- Year-end promotion by US power tool
makers to boost demand
≫ China & Non-IT sales increase, leading
revolutionary products such as Wearable
to maximize both top and bottom lines
xEV
7
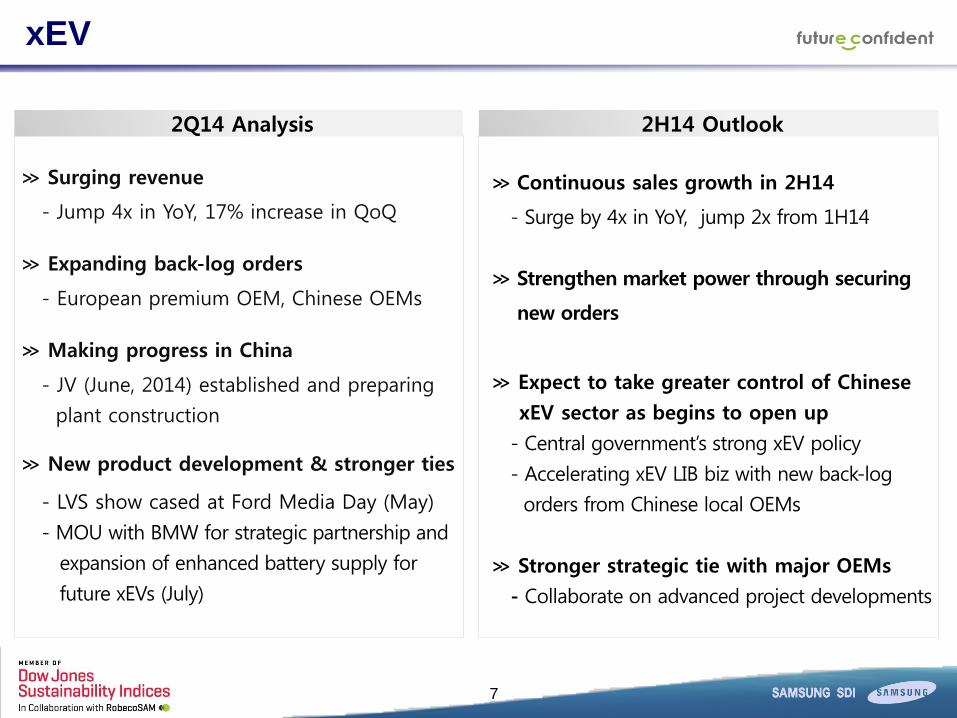
≫ Surging revenue
- Jump 4x in YoY, 17% increase in QoQ
≫ Expanding back-log orders
- European premium OEM, Chinese OEMs
≫ Making progress in China
- JV (June, 2014) established and preparing
plant construction
≫ New product development & stronger ties
- LVS show cased at Ford Media Day (May)
- MOU with BMW for strategic partnership and
expansion of enhanced battery supply for
future xEVs (July)
≫ Continuous sales growth in 2H14
- Surge by 4x in YoY, jump 2x from 1H14
≫ Strengthen market power through securing
new orders
≫ Expect to take greater control of Chinese
xEV sector as begins to open up
- Central government’s strong xEV policy
- Accelerating xEV LIB biz with new back-log
orders from Chinese local OEMs
≫ Stronger strategic tie with major OEMs
- Collaborate on advanced project developments
2Q14 Analysis 2H14 Outlook

ESS
8
2Q14 Analysis 2H14 Outlook
≫ North American utility market to widen
- Target to win landmark orders throughout
partnership with SIs & PDs
- Participate Solar Power International 2014
for aggressive order activities (Introduce
ESS solutions for Commercial/Utility)
≫ Focus sales growth in Residential/Utility
- New residential All-in-one model(GER/UK)
- Ship new high-energy utility model(1.5MWh/40ft)
≫ To win Utility projects globally and UPS
orders from local/overseas Samsung
affiliates
※ SI(System Integrator), PD(Project Developer)
※
≫ Revenue from Residential/Utility increased
- Upturn Residential sales in Japan thanks to
re-introduction of government subsidy
- Supply MWs to EU/Australian utility firms
∙ 11MWh (UKPN, England)
∙ 1MWh (SP-Ausnet (ABB), Aus)
≫ Won the largest ESS order
- W1tn worth of battery pack contract from
Nichicon(Japan) for residential ESS
≫ Secured Utility project in China
≫ Established entrance platform targeting
China and emerging markets

Chemicals
2Q14 Analysis 2H14 Outlook
≫ Further improvements with strong
seasonality and better product mix
- Revenue growth is expected
driven by cyclical upturn and strategic
sales expansion in HA/Automobiles/China
- Build stable profit structure propelled
by sales growth of artificial marbles and
high-margin resins
≫ Sales and profit increased
- Despite the volume increase of
synthetic resins in QoQ,
improvement was limited due to
strong KRW & PC line maintenance
- Artificial marbles sales & profit increased
as capacity expansion completed in 1H
9

Electronic Materials
2Q14 Analysis 2H14 Outlook
≫ Profit improved despite the limited sales
growth
- Solid Semi materials sales growth
in virtue of strong end demand
- Polarizer film turned into profit in June
as TV polarizer shipment increased
- PV paste earnings slowed down amid
silver price decline and weak demand
≫ Expect improved earnings led by
semi materials and polarizer sales increase
- Earnings expect to improve amid
continuous sales increase of semi materials
and recovery of the solar cell paste market
- Margin of display materials including polarizer
expect to improve driven by profit turn-
around in polarizer business as shipment
for large-size panel and UHD TV increases
10

Appendix
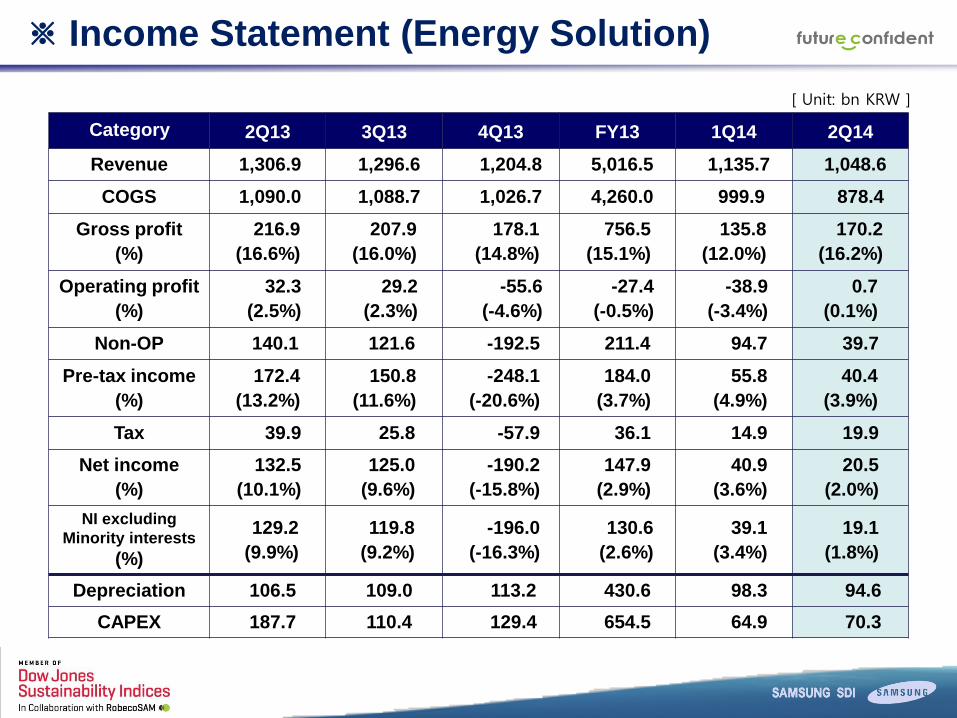
※ Income Statement (Energy Solution)
[ Unit: bn KRW ]
Category 2Q13 3Q13 4Q13 FY13 1Q14 2Q14
Revenue 1,306.9 1,296.6 1,204.8 5,016.5 1,135.7 1,048.6
COGS 1,090.0 1,088.7 1,026.7 4,260.0 999.9 878.4
Gross profit
(%)
216.9
(16.6%)
207.9
(16.0%)
178.1
(14.8%)
756.5
(15.1%)
135.8
(12.0%)
170.2
(16.2%)
Operating profit
(%)
32.3
(2.5%)
29.2
(2.3%)
-55.6
(-4.6%)
-27.4
(-0.5%)
-38.9
(-3.4%)
0.7
(0.1%)
Non-OP 140.1 121.6 -192.5 211.4 94.7 39.7
Pre-tax income
(%)
172.4
(13.2%)
150.8
(11.6%)
-248.1
(-20.6%)
184.0
(3.7%)
55.8
(4.9%)
40.4
(3.9%)
Tax 39.9 25.8 -57.9 36.1 14.9 19.9
Net income
(%)
132.5
(10.1%)
125.0
(9.6%)
-190.2
(-15.8%)
147.9
(2.9%)
40.9
(3.6%)
20.5
(2.0%)
NI excluding
Minority interests
(%)
129.2
(9.9%)
119.8
(9.2%)
-196.0
(-16.3%)
130.6
(2.6%)
39.1
(3.4%)
19.1
(1.8%)
Depreciation 106.5 109.0 113.2 430.6 98.3 94.6
CAPEX 187.7 110.4 129.4 654.5 64.9 70.3

※ Balance Sheet (Energy Solution)
[ Unit: bn KRW ]
Category 2Q13 3Q13 FY13 1Q14 2Q14
Total assets 11,001.1 10,847.4 10,555.7 10,634.8 10,874.9
Current assets 2,523.0 2,153.5 2,063.2 1,955.3 2,087.0
Quick assets 1,926.0 1,629.0 1,537.4 1,456.0 1,555.2
Inventory 597.0 524.5 525.8 499.3 531.9
Non-current assets 8,478.1 8,693.9 8,492.5 8,679.5 8,787.9
Investment assets 5,933.6 6,190.8 6,355.3 6,553.8 6,711.9
Tangible assets 2,172.7 2,136.6 1,788.0 1,772.2 1,729.2
Intangible assets 166.8 168.5 167.1 168.1 166.6
Other assets 205.0 198.0 182.1 185.4 180.2
Total Liabilities 3,476.7 3,200.7 3,013.3 3,047.5 2,922.3
Current liabilities 1,949.4 1,624.0 1,527.0 1,506.5 1,337.7
Non-current liabilities 1,527.3 1,576.7 1,486.3 1,541.0 1,584.6
Shareholders’ equity 7,524.4 7,646.7 7,542.4 7,587.3 7,952.6
Paid-in capital 240.7 240.7 240.7 2,407 240.7
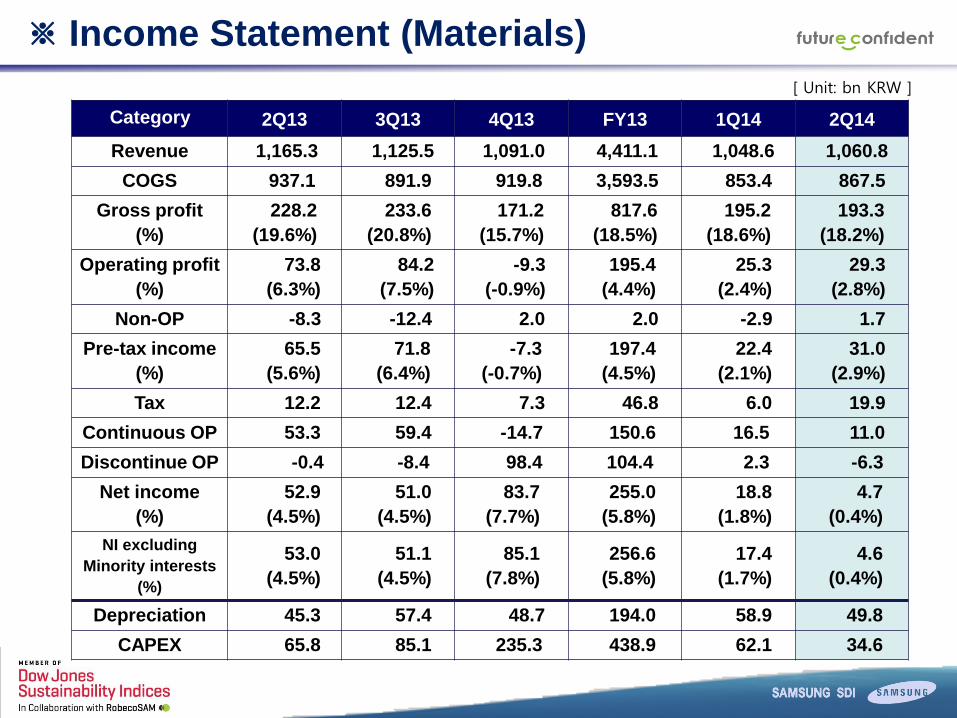
※ Income Statement (Materials)
[ Unit: bn KRW ]
Category 2Q13 3Q13 4Q13 FY13 1Q14 2Q14
Revenue 1,165.3 1,125.5 1,091.0 4,411.1 1,048.6 1,060.8
COGS 937.1 891.9 919.8 3,593.5 853.4 867.5
Gross profit
(%)
228.2
(19.6%)
233.6
(20.8%)
171.2
(15.7%)
817.6
(18.5%)
195.2
(18.6%)
193.3
(18.2%)
Operating profit
(%)
73.8
(6.3%)
84.2
(7.5%)
-9.3
(-0.9%)
195.4
(4.4%)
25.3
(2.4%)
29.3
(2.8%)
Non-OP -8.3 -12.4 2.0 2.0 -2.9 1.7
Pre-tax income
(%)
65.5
(5.6%)
71.8
(6.4%)
-7.3
(-0.7%)
197.4
(4.5%)
22.4
(2.1%)
31.0
(2.9%)
Tax 12.2 12.4 7.3 46.8 6.0 19.9
Continuous OP 53.3 59.4 -14.7 150.6 16.5 11.0
Discontinue OP -0.4 -8.4 98.4 104.4 2.3 -6.3
Net income
(%)
52.9
(4.5%)
51.0
(4.5%)
83.7
(7.7%)
255.0
(5.8%)
18.8
(1.8%)
4.7
(0.4%)
NI excluding
Minority interests
(%)
53.0
(4.5%)
51.1
(4.5%)
85.1
(7.8%)
256.6
(5.8%)
17.4
(1.7%)
4.6
(0.4%)
Depreciation 45.3 57.4 48.7 194.0 58.9 49.8
CAPEX 65.8 85.1 235.3 438.9 62.1 34.6

※ Balance Sheet (Materials)
[ Unit: bn KRW ]
Category 2Q13 3Q13 FY13 1Q14 2Q14
Total assets 5,051.9 5,264.8 4,987.8 4,742.8 4,805.0
Current assets 1,851.5 2,324.7 1,882.9 1,631.2 1,693.2
Quick assets 921.5 1,884.5 1,491.0 1,252.1 1,352.6
Inventory 930.0 440.2 391.9 379.1 340.6
Non-current assets 3,200.4 2,940.1 3,104.9 3,111.6 3,111.8
Investment assets 827.5 884.0 775.7 801.6 839.9
Tangible assets 1,768.8 1,556.2 1,561.4 1,548.0 1,533.0
Intangible assets 496.5 484.7 744.6 739.1 716.6
Other assets 107.6 15.2 23.2 22.9 22.3
Total liabilities 2,078.4 2,201.4 1,897.0 1,647.3 1,569.5
Current liabilities 1,064.0 1,251.2 1,002.1 838.0 718.7
Non-current liabilities 1,014.4 950.2 894.9 809.3 850.8
Shareholders’ equity 2,973.5 3,063.4 3,090.8 3,095.5 3,235.5
Paid-in capital 262.2 262.2 262.2 262.2 262.2
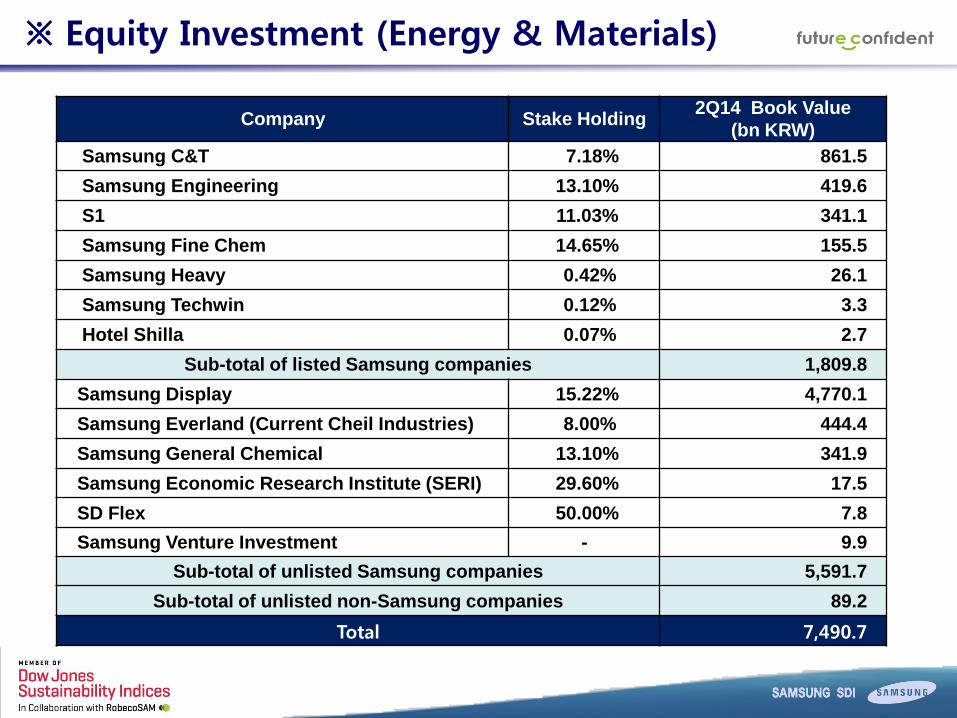
※ Equity Investment (Energy & Materials)
Company Stake Holding 2Q14 Book Value
(bn KRW)
Samsung C&T 7.18% 861.5
Samsung Engineering 13.10% 419.6
S1 11.03% 341.1
Samsung Fine Chem 14.65% 155.5
Samsung Heavy 0.42% 26.1
Samsung Techwin 0.12% 3.3
Hotel Shilla 0.07% 2.7
Sub-total of listed Samsung companies 1,809.8
Samsung Display 15.22% 4,770.1
Samsung Everland (Current Cheil Industries) 8.00% 444.4
Samsung General Chemical 13.10% 341.9
Samsung Economic Research Institute (SERI) 29.60% 17.5
SD Flex 50.00% 7.8
Samsung Venture Investment - 9.9
Sub-total of unlisted Samsung companies 5,591.7
Sub-total of unlisted non-Samsung companies 89.2
Total 7,490.7