2q14 results presentation
TRANSCRIPT
August 08th, 2014
2Q14 Results
2
Disclaimer
The stand-alone and consolidated financial statements were prepared in accordance with the accounting
principles adopted in Brazil, which include corporation law, the pronouncements, instructions and
interpretations issued by the Accounting Pronouncements Committee (CPC) and the regulations of the
Securities and Exchange Commission of Brazil (CVM), combined with specific legislation issued by the
National Electric Power Agency (ANEEL). As the industry regulator, ANEEL has powers to regulate the
concessions. The results are usually presented in both IFRS and former formats in order to permit
comparisons with other periods. However, the results presented in “Regulatory” format are not audited.
ALUPAR uses the audited results based on the IFRS principles to declare dividends.
The forward-looking statements contained in this document relating to the business outlook, projections of
operational and financial results and the growth prospects of ALUPAR are merely projections, and as such
are based exclusively on management’s expectations for the future of the business. These expectations
depend materially on changes in market conditions and the performance of the Brazilian economy, the
sector and international markets and therefore are subject to change without prior notice.
3
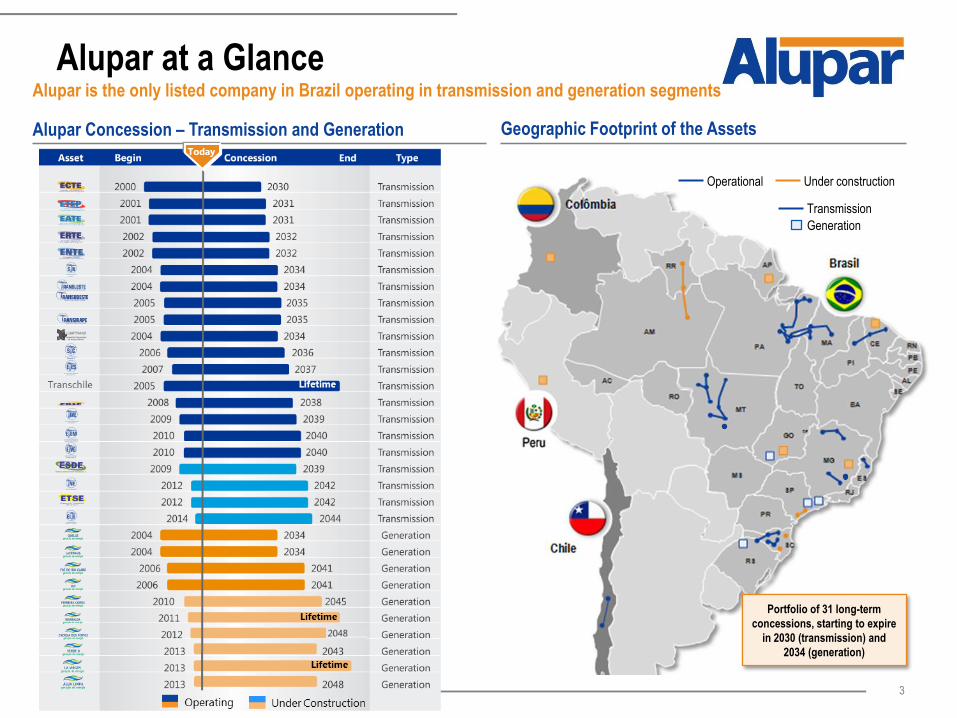
Alupar at a GlanceAlupar is the only listed company in Brazil operating in transmission and generation segments
Geographic Footprint of the Assets
Portfolio of 31 long-term
concessions, starting to expire
in 2030 (transmission) and
2034 (generation)
Alupar Concession – Transmission and Generation
Operational Under construction
Transmission
Generation
4
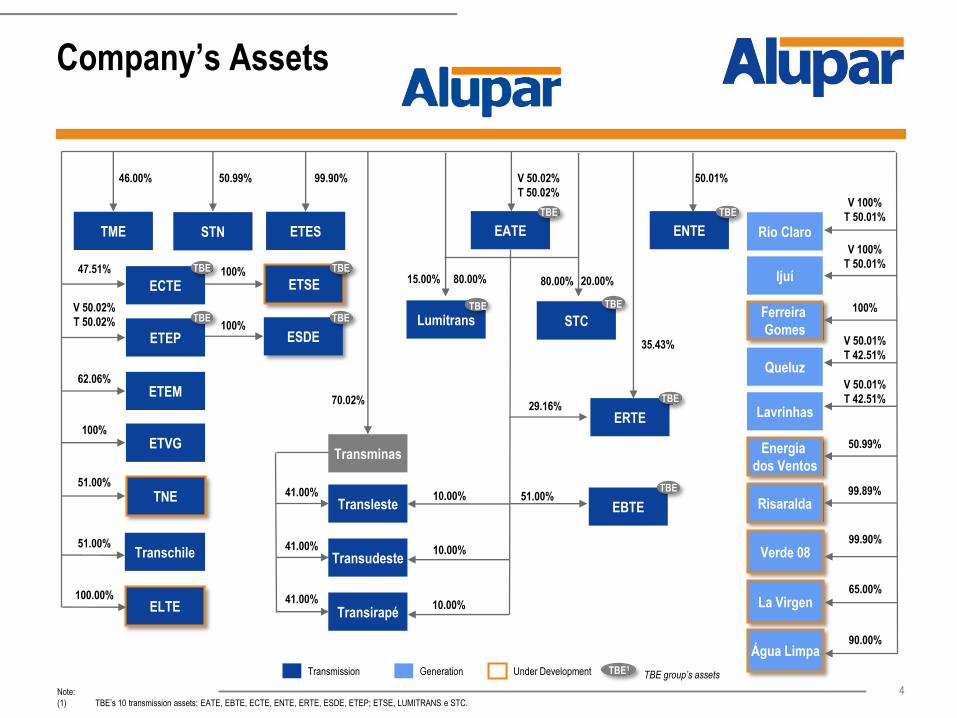
Company’s Assets
Note:
(1) TBE’s 10 transmission assets: EATE, EBTE, ECTE, ENTE, ERTE, ESDE, ETEP; ETSE, LUMITRANS e STC.
Generation Under Development TBE1TBE group’s assetsTransmission
STC
TBE
V 50.01%
T 42.51%
100%
50.01%V 50.02%
T 50.02%V 100%
T 50.01%
70.02%
V 50.01%
T 42.51%
99.90%
41.00%
41.00%
41.00%
Transminas
Lavrinhas
47.51%
50.99%
V 50.02%
T 50.02%
51.00%
80.00%15.00% 80.00% 20.00%
Transirapé
Transleste
Rio Claro
Ijuí
Queluz
Transudeste
Lumitrans
ETES
29.16%
V 100%
T 50.01%
STN ENTEEATE
ECTE
ERTE
ETEP
ETEM62.06%
ETVG
ESDE
Ferreira
Gomes
100%
TNE51.00%
Risaralda99.89%
100%
ETSE100%
46.00%
TME
50.99%Energia
dos Ventos
51.00%Transchile
TBE
TBE
TBE
TBE
TBE
TBE TBE
TBE
10.00%
10.00% Verde 0899.90%
La Virgen65.00%
Água Limpa90.00%
ELTE100.00%
10.00%
EBTE
TBE
35.43%
5
Alupar’s Business Culture
Financial Discipline
Responsible and Sustainable Growth
Efficient Capital Structure
Corporate Governance and Transparency
Skilled and Motivated Team
6
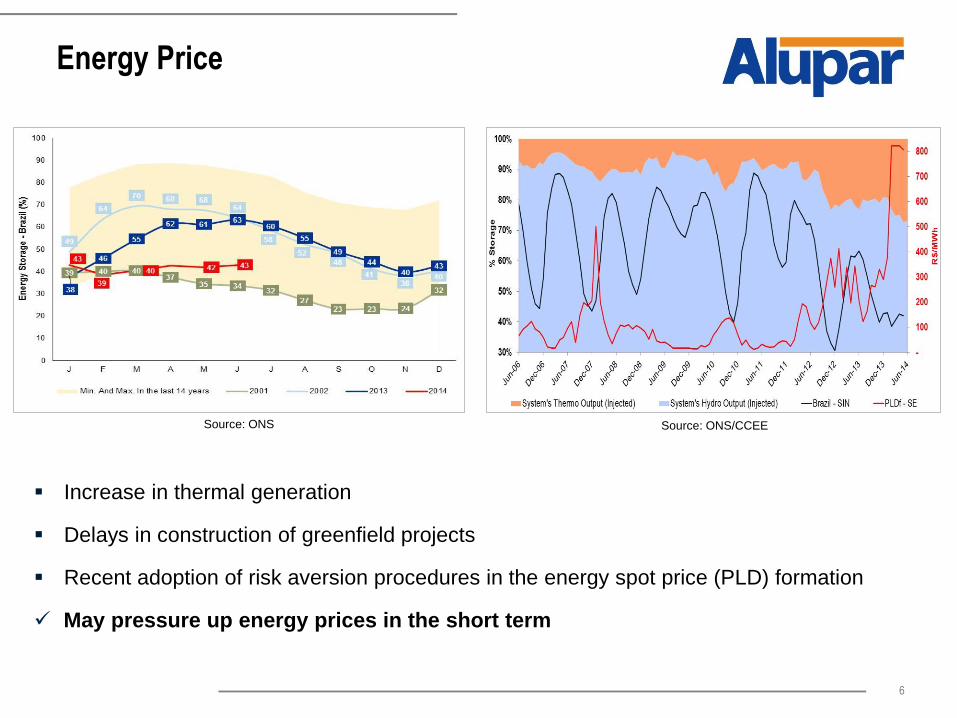
Energy Price
-- Increase in thermal generation
Delays in construction of greenfield projects
Recent adoption of risk aversion procedures in the energy spot price (PLD) formation
May pressure up energy prices in the short term
Source: ONS/CCEESource: ONS
7
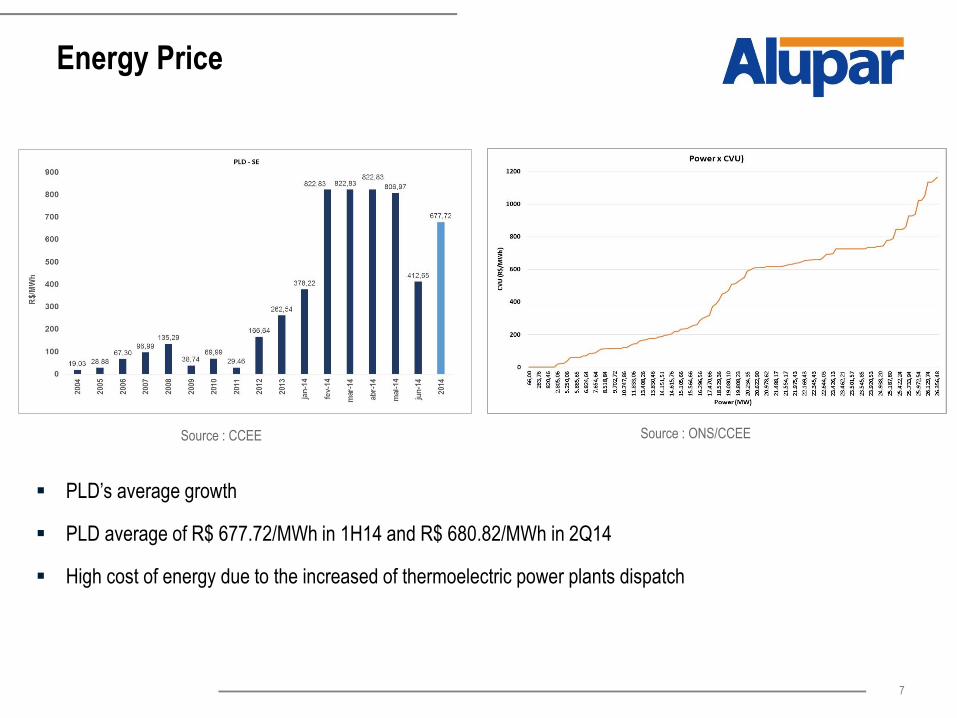
Energy Price
-
Source : ONS/CCEESource : CCEE
PLD’s average growth
PLD average of R$ 677.72/MWh in 1H14 and R$ 680.82/MWh in 2Q14
High cost of energy due to the increased of thermoelectric power plants dispatch
Financial Highlights
9
Financial Highlights - Consolidated
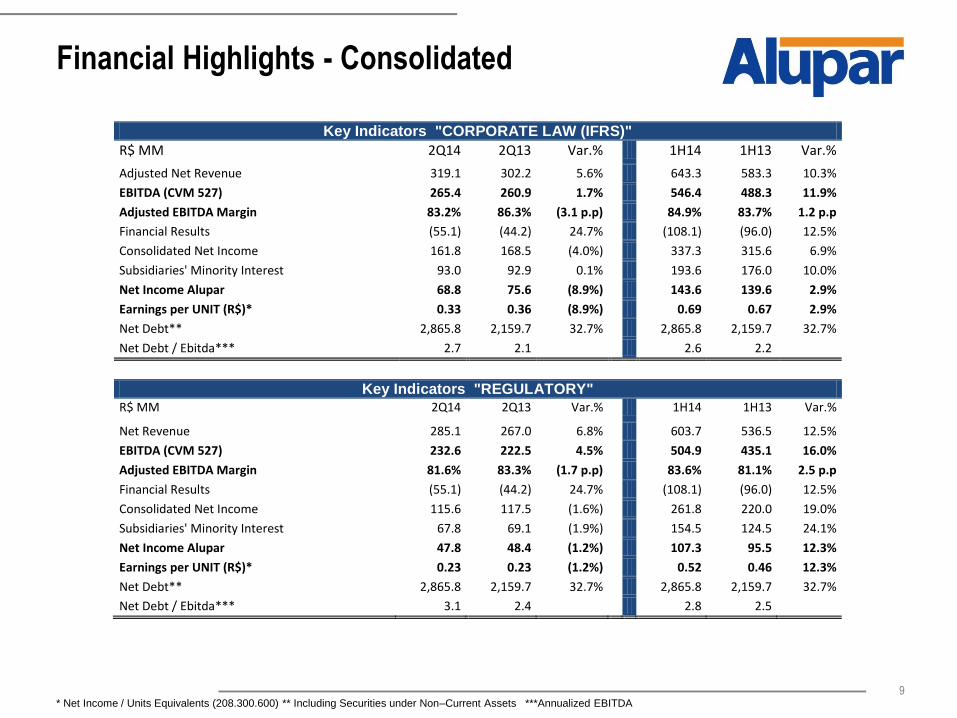
Key Indicators "CORPORATE LAW (IFRS)"
R$ MM 2Q14 2Q13 Var.% 1H14 1H13 Var.%
Adjusted Net Revenue 319.1 302.2 5.6% 643.3 583.3 10.3%
EBITDA (CVM 527) 265.4 260.9 1.7% 546.4 488.3 11.9%
Adjusted EBITDA Margin 83.2% 86.3% (3.1 p.p) 84.9% 83.7% 1.2 p.p
Financial Results (55.1) (44.2) 24.7% (108.1) (96.0) 12.5%
Consolidated Net Income 161.8 168.5 (4.0%) 337.3 315.6 6.9%
Subsidiaries' Minority Interest 93.0 92.9 0.1% 193.6 176.0 10.0%
Net Income Alupar 68.8 75.6 (8.9%) 143.6 139.6 2.9%
Earnings per UNIT (R$)* 0.33 0.36 (8.9%) 0.69 0.67 2.9%
Net Debt** 2,865.8 2,159.7 32.7% 2,865.8 2,159.7 32.7%
Net Debt / Ebitda*** 2.7 2.1 2.6 2.2
Key Indicators "REGULATORY" R$ MM 2Q14 2Q13 Var.% 1H14 1H13 Var.%
Net Revenue 285.1 267.0 6.8% 603.7 536.5 12.5%
EBITDA (CVM 527) 232.6 222.5 4.5% 504.9 435.1 16.0%
Adjusted EBITDA Margin 81.6% 83.3% (1.7 p.p) 83.6% 81.1% 2.5 p.p
Financial Results (55.1) (44.2) 24.7% (108.1) (96.0) 12.5%
Consolidated Net Income 115.6 117.5 (1.6%) 261.8 220.0 19.0%
Subsidiaries' Minority Interest 67.8 69.1 (1.9%) 154.5 124.5 24.1%
Net Income Alupar 47.8 48.4 (1.2%) 107.3 95.5 12.3%
Earnings per UNIT (R$)* 0.23 0.23 (1.2%) 0.52 0.46 12.3%
Net Debt** 2,865.8 2,159.7 32.7% 2,865.8 2,159.7 32.7%
Net Debt / Ebitda*** 3.1 2.4 2.8 2.5
* Net Income / Units Equivalents (208.300.600) ** Including Securities under Non–Current Assets ***Annualized EBITDA
10
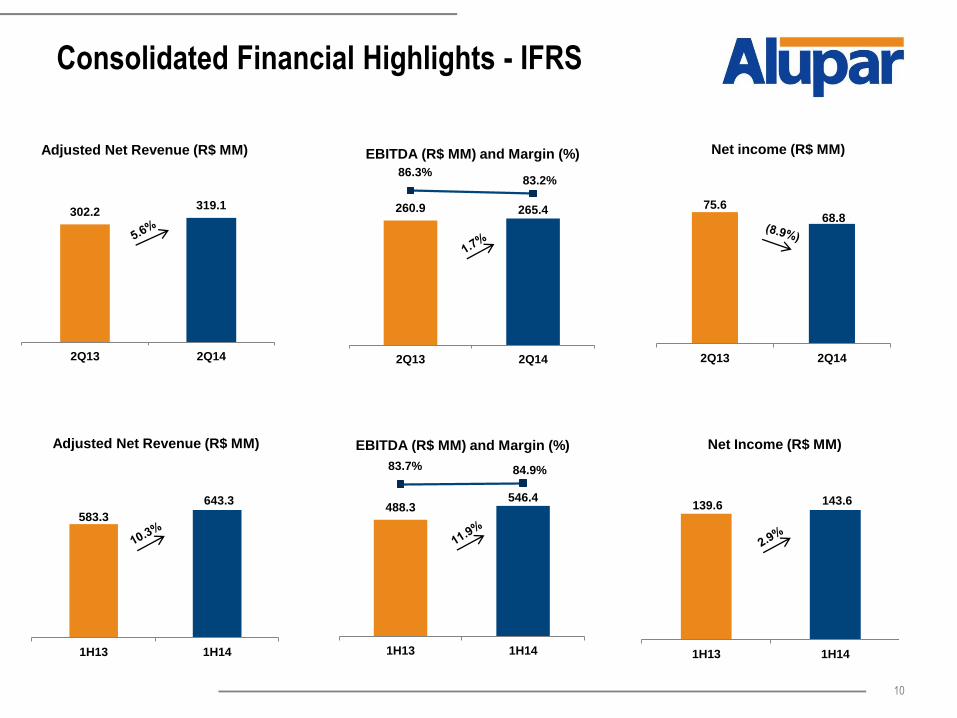
Consolidated Financial Highlights - IFRS
260.9 265.4
86.3%83.2%
2Q13 2Q14
EBITDA (R$ MM) and Margin (%)
75.668.8
2Q13 2Q14
Net income (R$ MM)
302.2319.1
2Q13 2Q14
Adjusted Net Revenue (R$ MM)
139.6 143.6
1H13 1H14
Net Income (R$ MM)
583.3
643.3
1H13 1H14
Adjusted Net Revenue (R$ MM)
488.3546.4
83.7% 84.9%
1H13 1H14
EBITDA (R$ MM) and Margin (%)
11
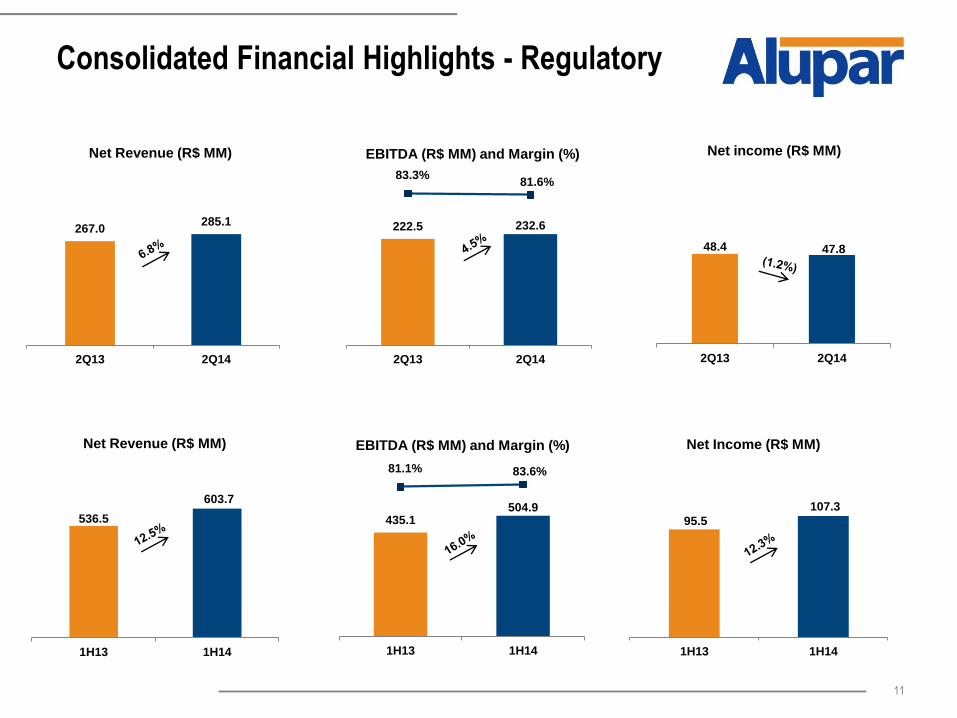
Consolidated Financial Highlights - Regulatory
222.5 232.6
83.3%81.6%
2Q13 2Q14
EBITDA (R$ MM) and Margin (%)
48.4 47.8
2Q13 2Q14
Net income (R$ MM)
267.0285.1
2Q13 2Q14
Net Revenue (R$ MM)
95.5
107.3
1H13 1H14
Net Income (R$ MM)
536.5
603.7
1H13 1H14
Net Revenue (R$ MM)
435.1504.9
81.1% 83.6%
1H13 1H14
EBITDA (R$ MM) and Margin (%)
12
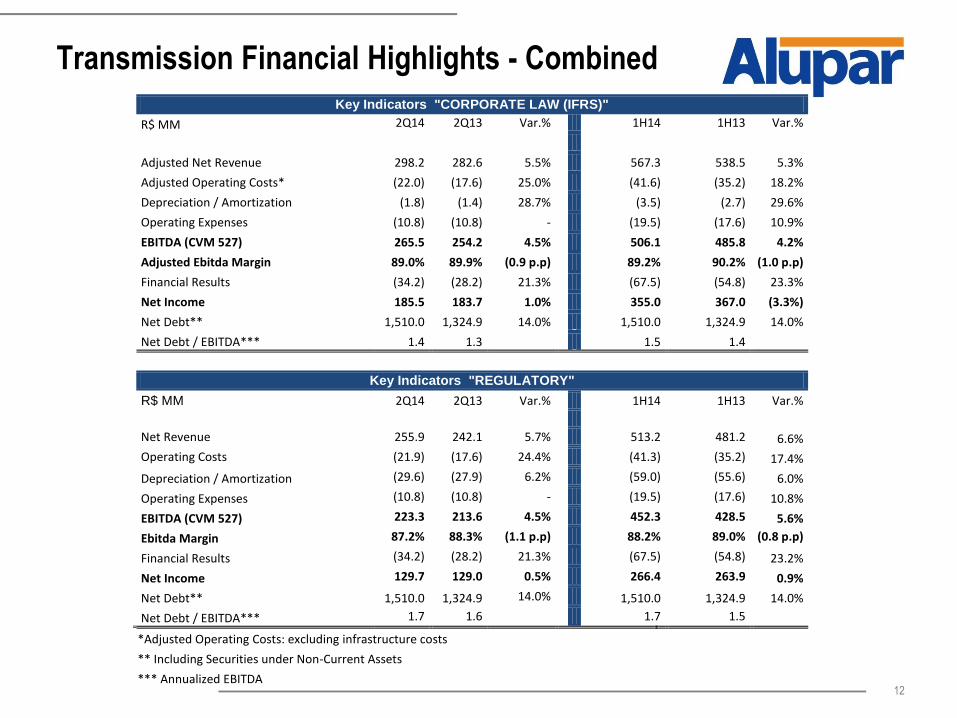
Transmission Financial Highlights - Combined
Key Indicators "CORPORATE LAW (IFRS)"
R$ MM 2Q14 2Q13 Var.% 1H14 1H13 Var.%
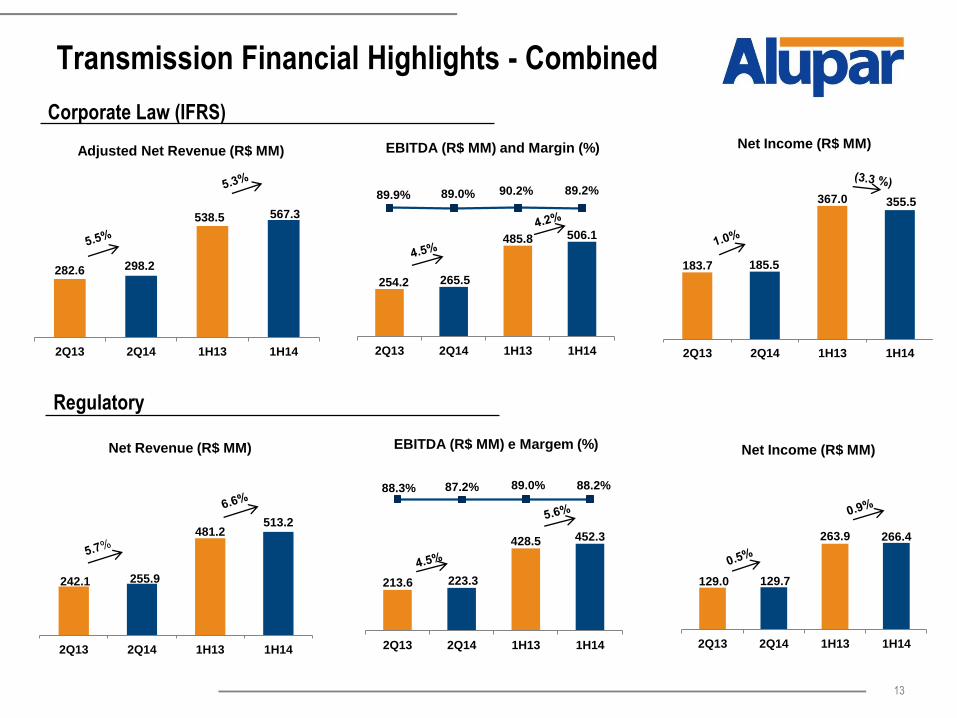
Adjusted Net Revenue 298.2 282.6 5.5% 567.3 538.5 5.3%
Adjusted Operating Costs* (22.0) (17.6) 25.0% (41.6) (35.2) 18.2%
Depreciation / Amortization (1.8) (1.4) 28.7% (3.5) (2.7) 29.6%
Operating Expenses (10.8) (10.8) - (19.5) (17.6) 10.9%
EBITDA (CVM 527) 265.5 254.2 4.5% 506.1 485.8 4.2%
Adjusted Ebitda Margin 89.0% 89.9% (0.9 p.p) 89.2% 90.2% (1.0 p.p)
Financial Results (34.2) (28.2) 21.3% (67.5) (54.8) 23.3%
Net Income 185.5 183.7 1.0% 355.0 367.0 (3.3%)
Net Debt** 1,510.0 1,324.9 14.0% 1,510.0 1,324.9 14.0%
Net Debt / EBITDA*** 1.4 1.3 1.5 1.4
Key Indicators "REGULATORY"
R$ MM 2Q14 2Q13 Var.% 1H14 1H13 Var.%
Net Revenue 255.9 242.1 5.7% 513.2 481.2 6.6%
Operating Costs (21.9) (17.6) 24.4% (41.3) (35.2) 17.4%
Depreciation / Amortization (29.6) (27.9) 6.2% (59.0) (55.6) 6.0%
Operating Expenses (10.8) (10.8) - (19.5) (17.6) 10.8%
EBITDA (CVM 527) 223.3 213.6 4.5% 452.3 428.5 5.6%
Ebitda Margin 87.2% 88.3% (1.1 p.p) 88.2% 89.0% (0.8 p.p)
Financial Results (34.2) (28.2) 21.3% (67.5) (54.8) 23.2%
Net Income 129.7 129.0 0.5% 266.4 263.9 0.9%
Net Debt** 1,510.0 1,324.9 14.0% 1,510.0 1,324.9 14.0%
Net Debt / EBITDA*** 1.7 1.6 1.7 1.5
*Adjusted Operating Costs: excluding infrastructure costs
** Including Securities under Non-Current Assets
*** Annualized EBITDA
13
Transmission Financial Highlights - Combined
Corporate Law (IFRS)
282.6 298.2
538.5 567.3
2Q13 2Q14 1H13 1H14
Adjusted Net Revenue (R$ MM)
242.1 255.9
481.2513.2
2Q13 2Q14 1H13 1H14
Net Revenue (R$ MM)
129.0 129.7
263.9 266.4
2Q13 2Q14 1H13 1H14
Net Income (R$ MM)
Regulatory
254.2 265.5
485.8 506.1
89.9% 89.0% 90.2% 89.2%
2Q13 2Q14 1H13 1H14
EBITDA (R$ MM) and Margin (%)
213.6 223.3
428.5 452.3
88.3% 87.2% 89.0% 88.2%
2Q13 2Q14 1H13 1H14
EBITDA (R$ MM) e Margem (%)
183.7 185.5
367.0 355.5
2Q13 2Q14 1H13 1H14
Net Income (R$ MM)
14
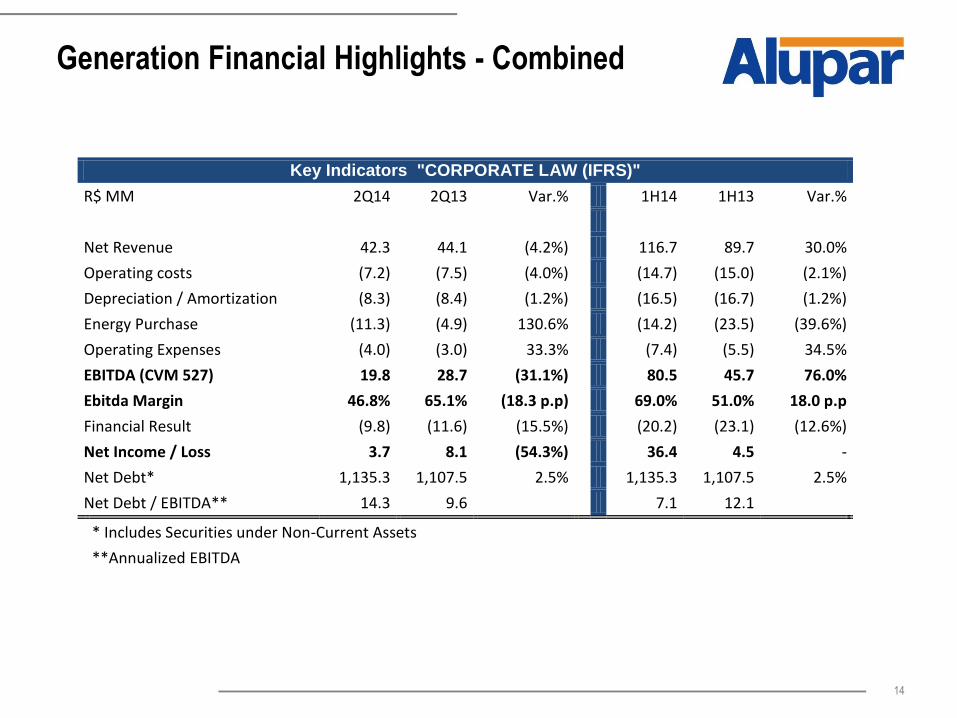
Generation Financial Highlights - Combined
Key Indicators "CORPORATE LAW (IFRS)"
R$ MM 2Q14 2Q13 Var.% 1H14 1H13 Var.%
Net Revenue 42.3 44.1 (4.2%) 116.7 89.7 30.0%
Operating costs (7.2) (7.5) (4.0%) (14.7) (15.0) (2.1%)
Depreciation / Amortization (8.3) (8.4) (1.2%) (16.5) (16.7) (1.2%)
Energy Purchase (11.3) (4.9) 130.6% (14.2) (23.5) (39.6%)
Operating Expenses (4.0) (3.0) 33.3% (7.4) (5.5) 34.5%
EBITDA (CVM 527) 19.8 28.7 (31.1%) 80.5 45.7 76.0%
Ebitda Margin 46.8% 65.1% (18.3 p.p) 69.0% 51.0% 18.0 p.p
Financial Result (9.8) (11.6) (15.5%) (20.2) (23.1) (12.6%)
Net Income / Loss 3.7 8.1 (54.3%) 36.4 4.5 -
Net Debt* 1,135.3 1,107.5 2.5% 1,135.3 1,107.5 2.5%
Net Debt / EBITDA** 14.3 9.6 7.1 12.1
* Includes Securities under Non-Current Assets
**Annualized EBITDA
15
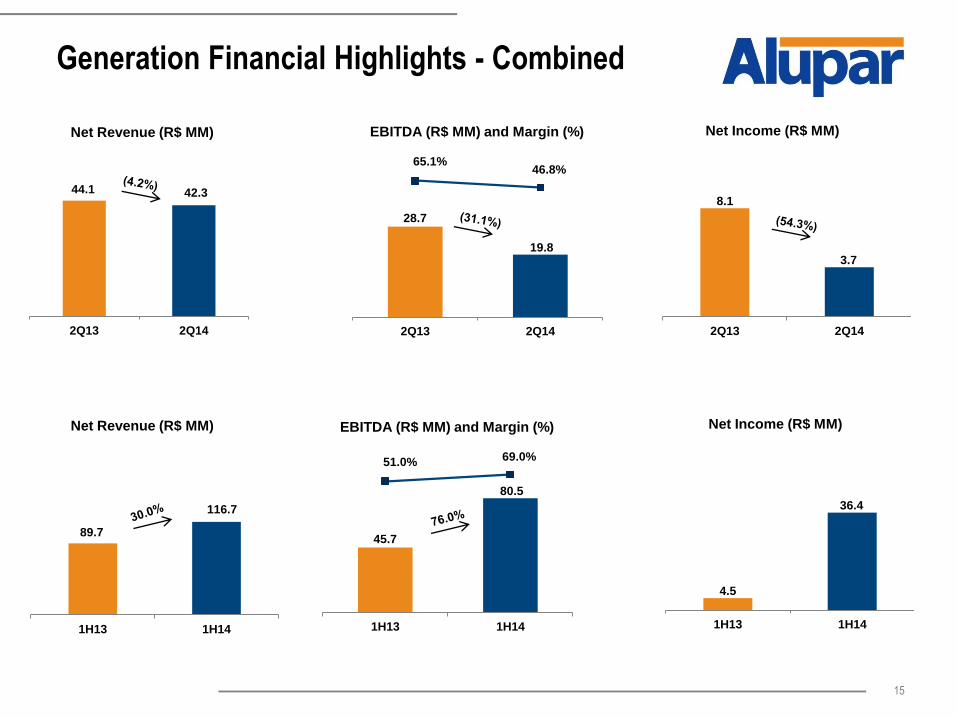
Generation Financial Highlights - Combined
44.1 42.3
2Q13 2Q14
Net Revenue (R$ MM)
89.7
116.7
1H13 1H14
Net Revenue (R$ MM)
28.7
19.8
65.1%46.8%
2Q13 2Q14
EBITDA (R$ MM) and Margin (%)
8.1
3.7
2Q13 2Q14
Net Income (R$ MM)
45.7
80.5
51.0% 69.0%
1H13 1H14
EBITDA (R$ MM) and Margin (%)
4.5
36.4
1H13 1H14
Net Income (R$ MM)
16
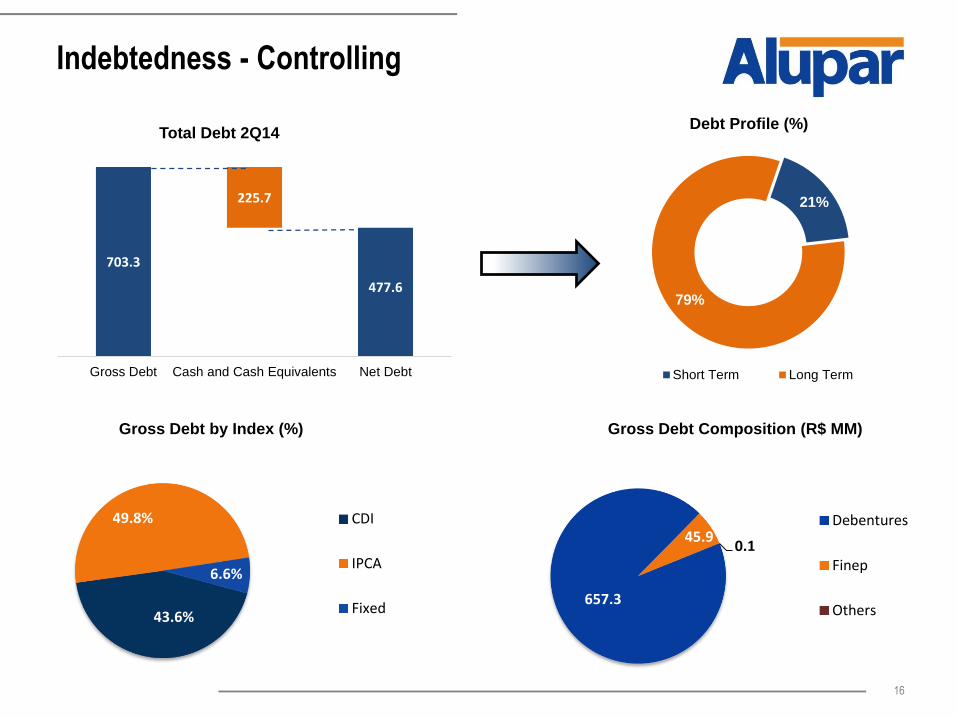
Indebtedness - Controlling
21%
79%
Debt Profile (%)
Short Term Long Term
703.3
477.6
225.7
Gross Debt Cash and Cash Equivalents Net Debt
Total Debt 2Q14
Gross Debt by Index (%) Gross Debt Composition (R$ MM)
43.6%
49.8%
6.6%
CDI
IPCA
Fixed657.3
45.90.1
Debentures
Finep
Others
17
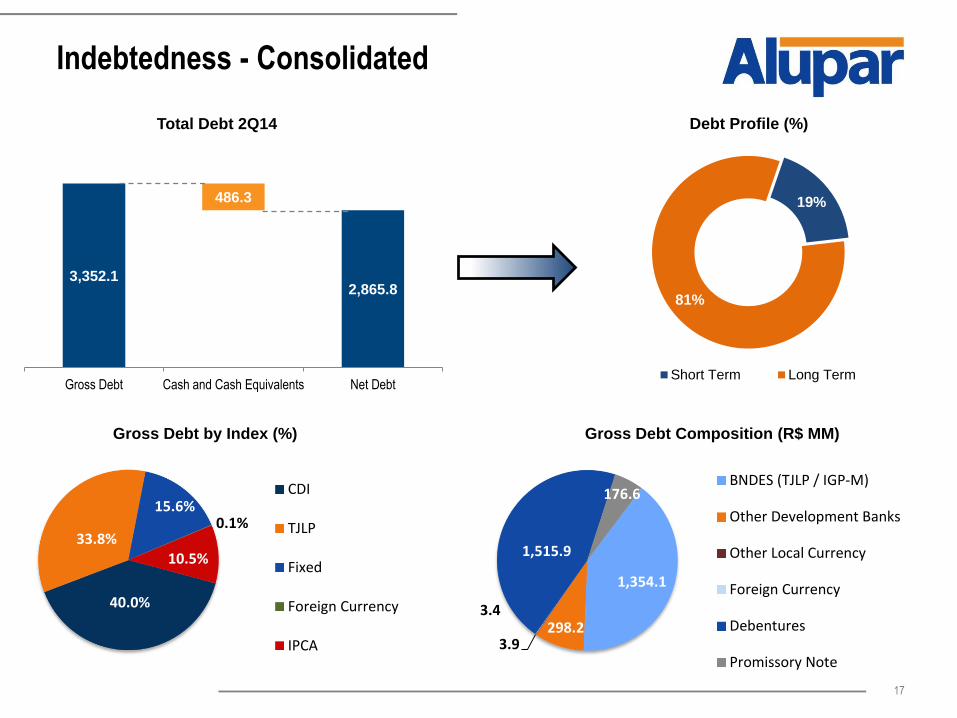
Indebtedness - Consolidated
19%
81%
Debt Profile (%)
Short Term Long Term
3,352.1
486.3
2,865.8
Gross Debt Cash and Cash Equivalents Net Debt
Total Debt 2Q14
Gross Debt by Index (%) Gross Debt Composition (R$ MM)
40.0%
33.8%
15.6%0.1%
10.5%
CDI
TJLP
Fixed
Foreign Currency
IPCA
1,354.1
298.23.9
3.4
1,515.9
176.6BNDES (TJLP / IGP-M)
Other Development Banks
Other Local Currency
Foreign Currency
Debentures
Promissory Note
18
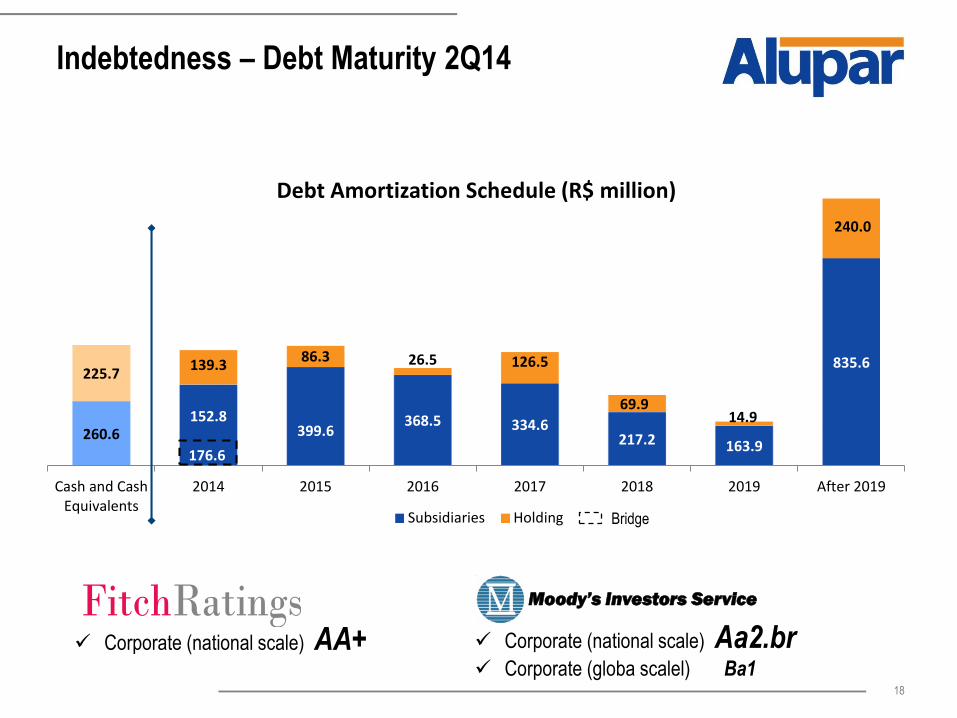
Indebtedness – Debt Maturity 2Q14
Moody’s Investors Service
Corporate (national scale) AA+ Corporate (national scale) Aa2.br Corporate (globa scalel) Ba1
260.6152.8
399.6368.5 334.6
217.2 163.9
835.6225.7
139.386.3 26.5 126.5
69.914.9
240.0
Cash and CashEquivalents
2014 2015 2016 2017 2018 2019 After 2019
Debt Amortization Schedule (R$ million)
Subsidiaries Holding
176.6
Bridge
IR Contacts
José Luiz de Godoy Pereira
IRO
Luiz Coimbra
IR Specialist
Kássia Orsi Amendola
IR Analyst
Tel.: +55 (11) 2184-9600