2q15 earnings presentation
TRANSCRIPT

1
Earnings Release | Conference Call – 2Q15
August 11th, 2015

2
Agenda
Ricardo Ribeiro
Vice President
Fernando Ramos
CFO and IR Officer
Operational Highlights
Financial Highlights
Highlights
Development’s contracted sales reached a PSV of R$ 112 million,a significant growth when compared to 1Q15;
In 1H15, 46% of launches and 41% of contracted saleswere in the low-income segment;
2015 year-to-date, more than R$ 100 million of cashflow to the shareholders, being R$ 67 million throughdividends and R$ 35 million through a share buybackprogram (total yield of approximately 20%, consideringthe currently share price);
Strong capital structure, with net debt to equity of 16.6%, one of the lowest of the industry;
By the end of 2Q15, the deferred sales revenue totaled R$ 2.9 billion, most of which, R$ 2.4 billion, refers to MCMV Level 1 projects.
3
Launches
174
2Q15
231
1H14
231
1Q15
20
2Q14
-24%
+793%-16%
1H15
194
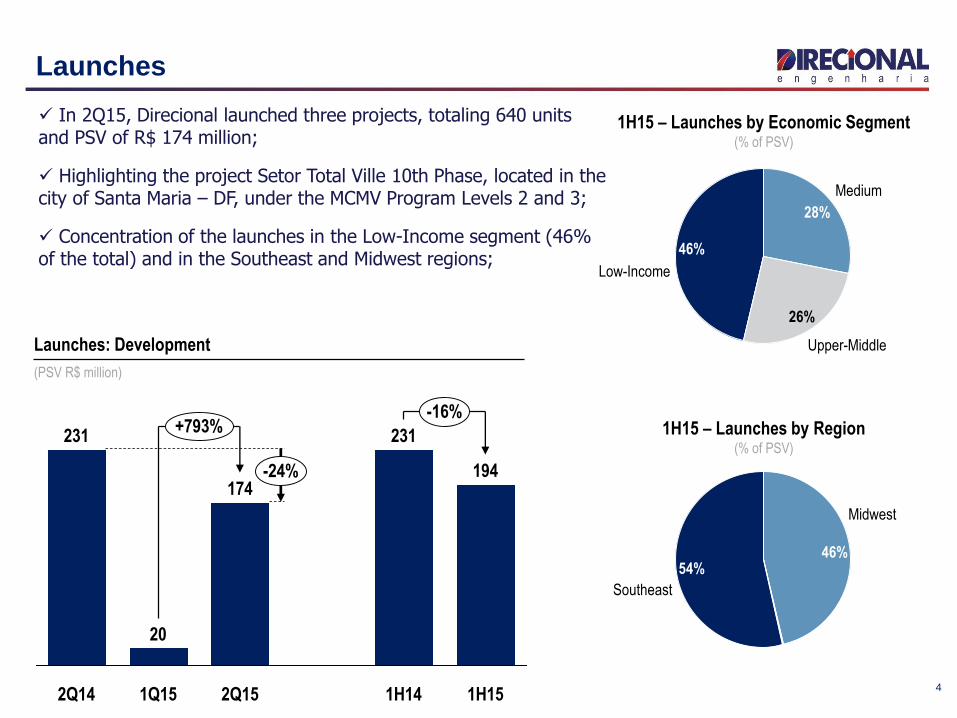
Launches: Development
(PSV R$ million)
In 2Q15, Direcional launched three projects, totaling 640 units and PSV of R$ 174 million;
Highlighting the project Setor Total Ville 10th Phase, located in the city of Santa Maria – DF, under the MCMV Program Levels 2 and 3;
Concentration of the launches in the Low-Income segment (46% of the total) and in the Southeast and Midwest regions;
1H15 – Launches by Region(% of PSV)
Southeast
54%
Midwest
46%
1H15 – Launches by Economic Segment(% of PSV)
Upper-Middle
26%
Medium
28%
Low-Income
46%
4
Contracted Sales
-12%
+206%
-37%
1H15
148
1H14
237
2Q15
112
1Q15
36
2Q14
126
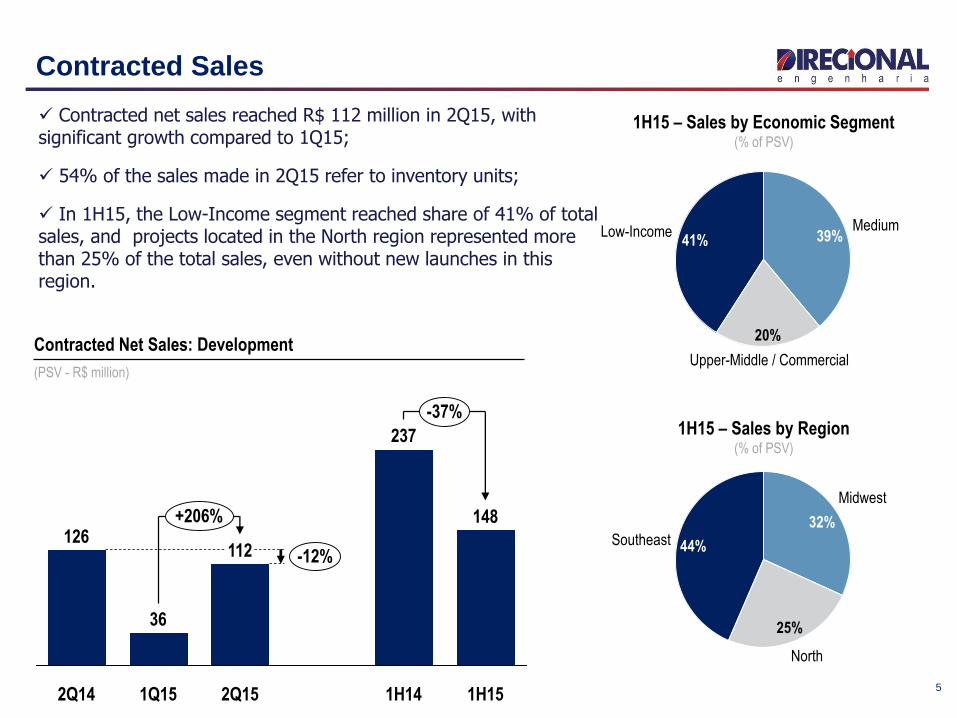
Contracted Net Sales: Development
(PSV - R$ million)
Contracted net sales reached R$ 112 million in 2Q15, with significant growth compared to 1Q15;
54% of the sales made in 2Q15 refer to inventory units;
In 1H15, the Low-Income segment reached share of 41% of total sales, and projects located in the North region represented more than 25% of the total sales, even without new launches in this region.
Southeast 44%
North
25%
Midwest
32%
1H15 – Sales by Region(% of PSV)
41% 39%
20%
Low-Income
Upper-Middle / Commercial
Medium
1H15 – Sales by Economic Segment(% of PSV)
5
Sales Cancellations
2Q15 - Sales Cancellation by Region(% Units)
2Q15 - Sales Cancellation by Period of launches(% Units)
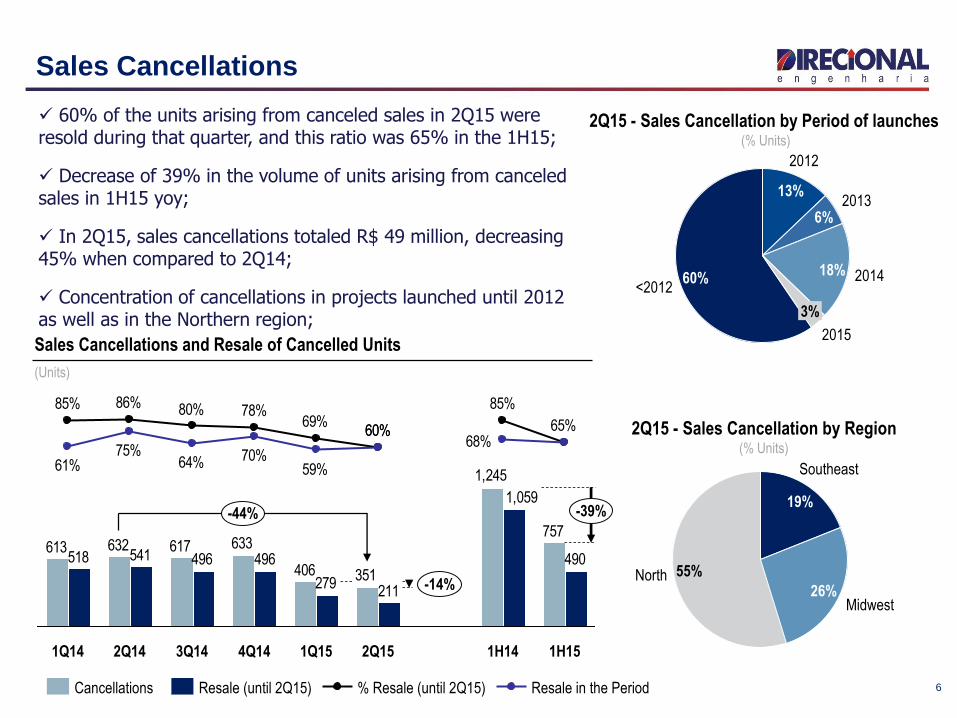
Sales Cancellations and Resale of Cancelled Units
(Units)
757
351406
633617632613
1,245
490
211279
496496541518
1,059
85%
60%69%
78%80%86%85%
65%68%
60%
59%70%64%
75%61%
-14%
-39%
1H151H142Q152Q141Q14
-44%
1Q154Q143Q14
Resale in the Period% Resale (until 2Q15)Resale (until 2Q15)Cancellations
2014
3%
2015
18%
20136%
2012
13%
<201260%
55%North
Southeast
26%
19%
Midwest
60% of the units arising from canceled sales in 2Q15 were resold during that quarter, and this ratio was 65% in the 1H15;
Decrease of 39% in the volume of units arising from canceled sales in 1H15 yoy;
In 2Q15, sales cancellations totaled R$ 49 million, decreasing 45% when compared to 2Q14;
Concentration of cancellations in projects launched until 2012 as well as in the Northern region;
6
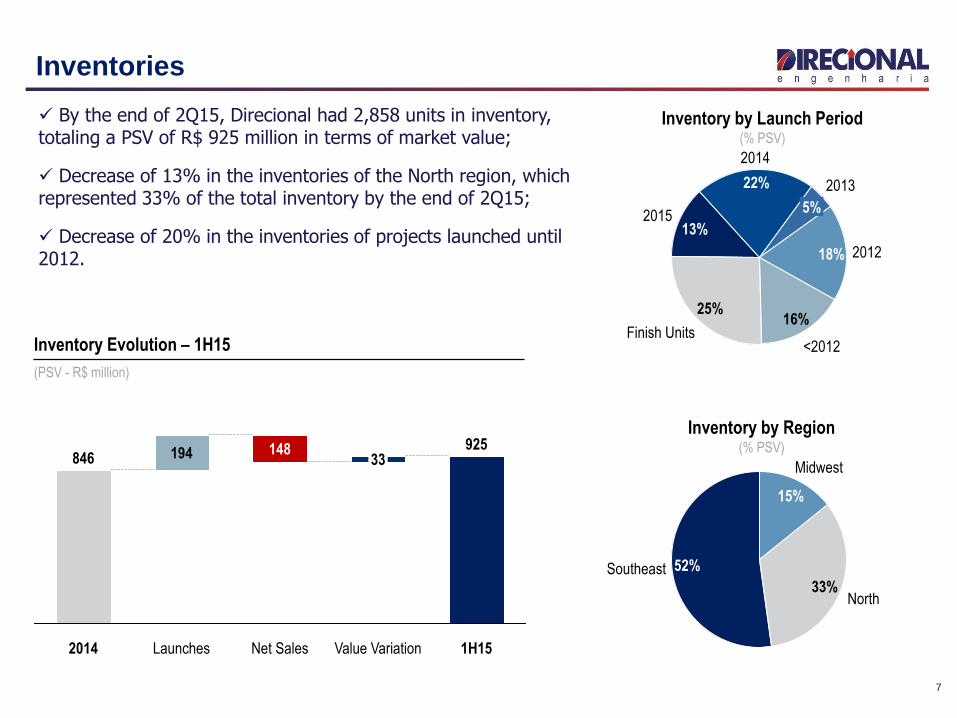
Inventories
Inventory by Region(% PSV)
Inventory Evolution – 1H15
(PSV - R$ million)
Inventory by Launch Period(% PSV)
Net Sales
148
Launches
194
2014
846
1H15
925
Value Variation
33
<2012
16%
201218%
2013
5%
2014
22%
201513%
25%
Finish Units
33%Southeast 52%
15%
North
Midwest
By the end of 2Q15, Direcional had 2,858 units in inventory, totaling a PSV of R$ 925 million in terms of market value;
Decrease of 13% in the inventories of the North region, which represented 33% of the total inventory by the end of 2Q15;
Decrease of 20% in the inventories of projects launched until 2012.
7
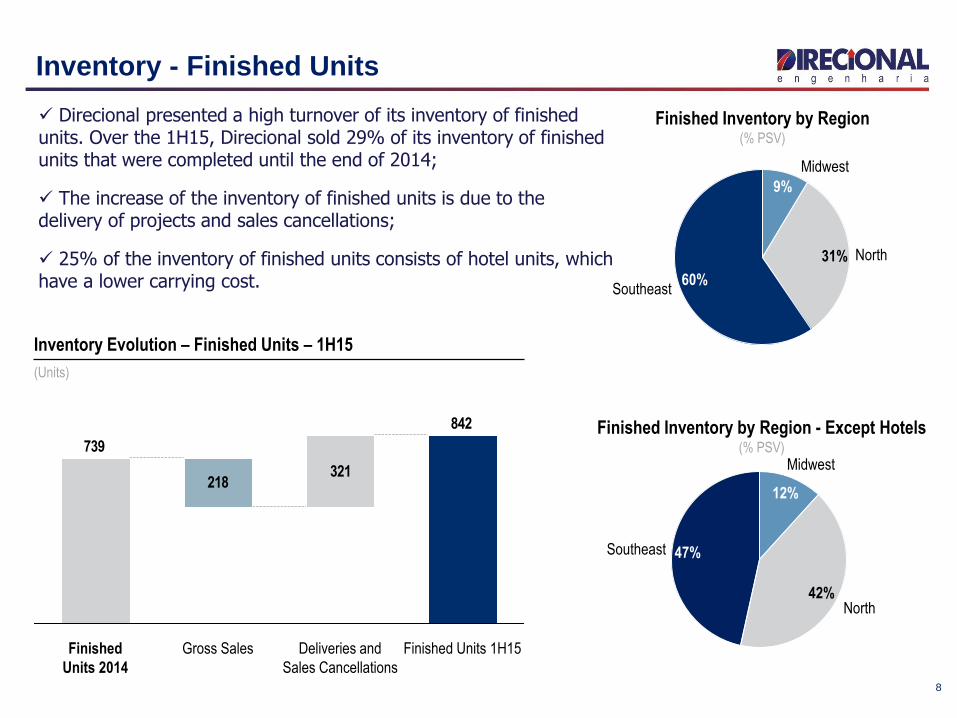
Inventory - Finished Units
Finished Inventory by Region - Except Hotels(% PSV)
Inventory Evolution – Finished Units – 1H15
(Units)
Finished Inventory by Region(% PSV)
47%
North
Midwest
Southeast
42%
12%
9%
Midwest
31%
Southeast
North
60%
Direcional presented a high turnover of its inventory of finished units. Over the 1H15, Direcional sold 29% of its inventory of finished units that were completed until the end of 2014;
The increase of the inventory of finished units is due to the delivery of projects and sales cancellations;
25% of the inventory of finished units consists of hotel units, which have a lower carrying cost.
8
321218
842
739
Finished
Units 2014
Deliveries and
Sales Cancellations
Gross Sales Finished Units 1H15
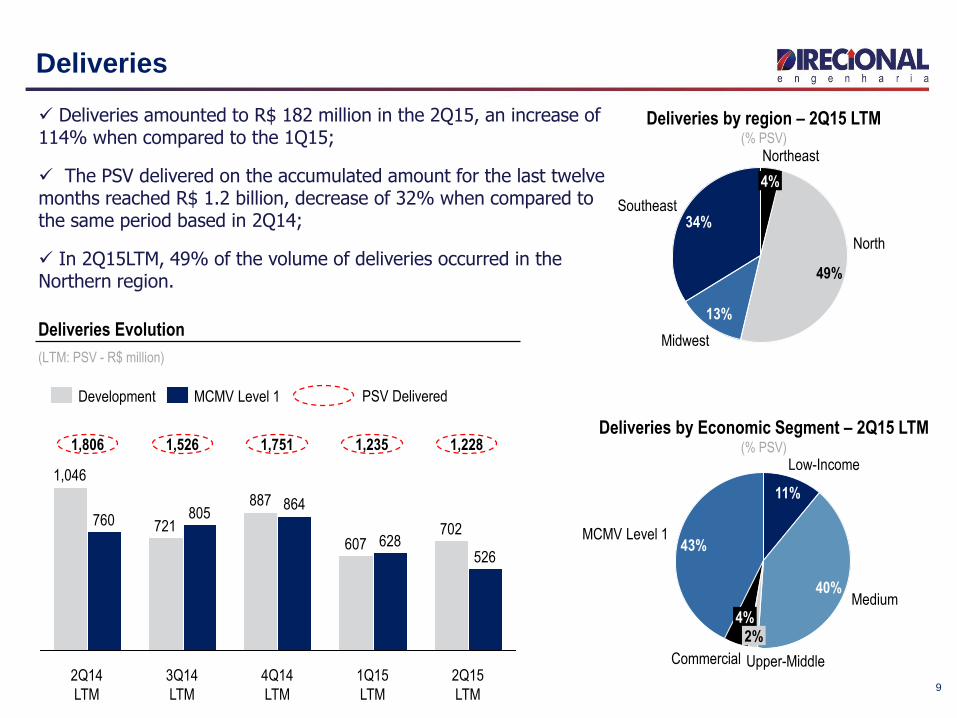
Deliveries
Deliveries Evolution
(LTM: PSV - R$ million)
Deliveries by Economic Segment – 2Q15 LTM(% PSV)
Deliveries by region – 2Q15 LTM(% PSV)
13%
Midwest
34%
49%
North
Southeast
4%
Northeast
4%
Upper-Middle
2%
Medium40%
Low-Income
11%
MCMV Level 1
Commercial
43%
Deliveries amounted to R$ 182 million in the 2Q15, an increase of 114% when compared to the 1Q15;
The PSV delivered on the accumulated amount for the last twelve months reached R$ 1.2 billion, decrease of 32% when compared to the same period based in 2Q14;
In 2Q15LTM, 49% of the volume of deliveries occurred in the Northern region.
864
607 628702
526
3Q14
LTM
4Q14
LTM
1Q15
LTM
2Q15
LTM
1,046
760 721805
887
2Q14
LTM
Development MCMV Level 1
1,806
PSV Delivered
1,526 1,751 1,235 1,228
9
Fernando Ramos
CFO and IR Officer
Financial Highlights
10
Financial Results
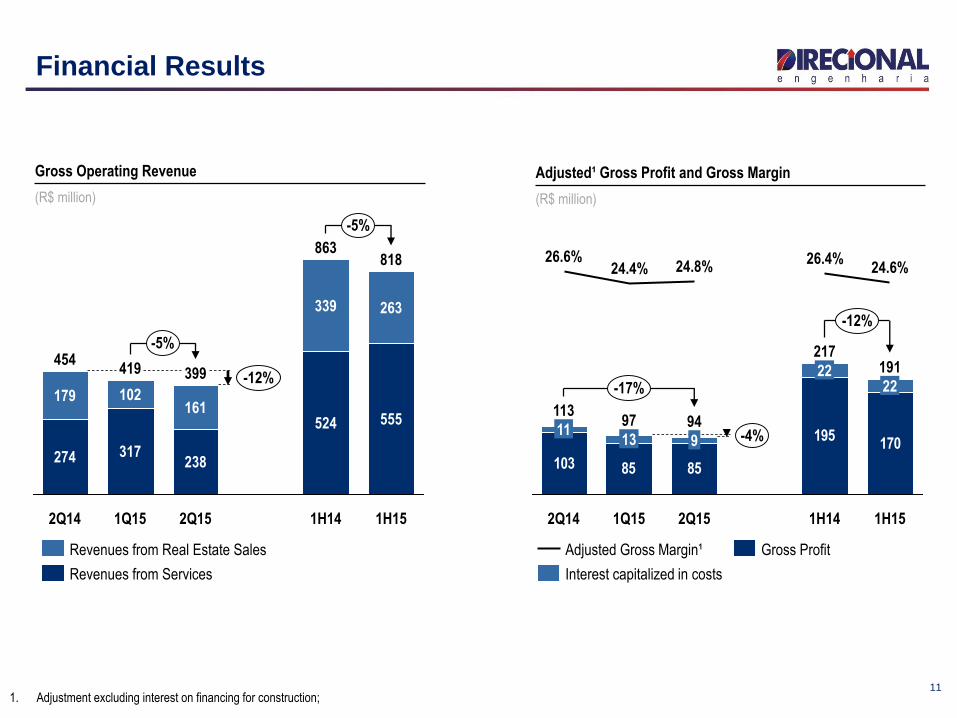
1. Adjustment excluding interest on financing for construction;
Gross Operating Revenue
(R$ million)
Adjusted¹ Gross Profit and Gross Margin
(R$ million)
317
2Q14
102
419
1Q15
818
238
555
399
2Q15
339
524
863
1H14
263
-5%
-5%
-12%
1H15
274
179
454
161
Revenues from Real Estate Sales
Revenues from Services
103 85 85
195170
113
2Q14
11
26.6%
-12%
-4%
22
217
24.6%
1H14
191
1H15
-17%
26.4%
94
9
2Q151Q15
24.8%
97
13
24.4%
22
Adjusted Gross Margin¹
Interest capitalized in costs
Gross Profit
11
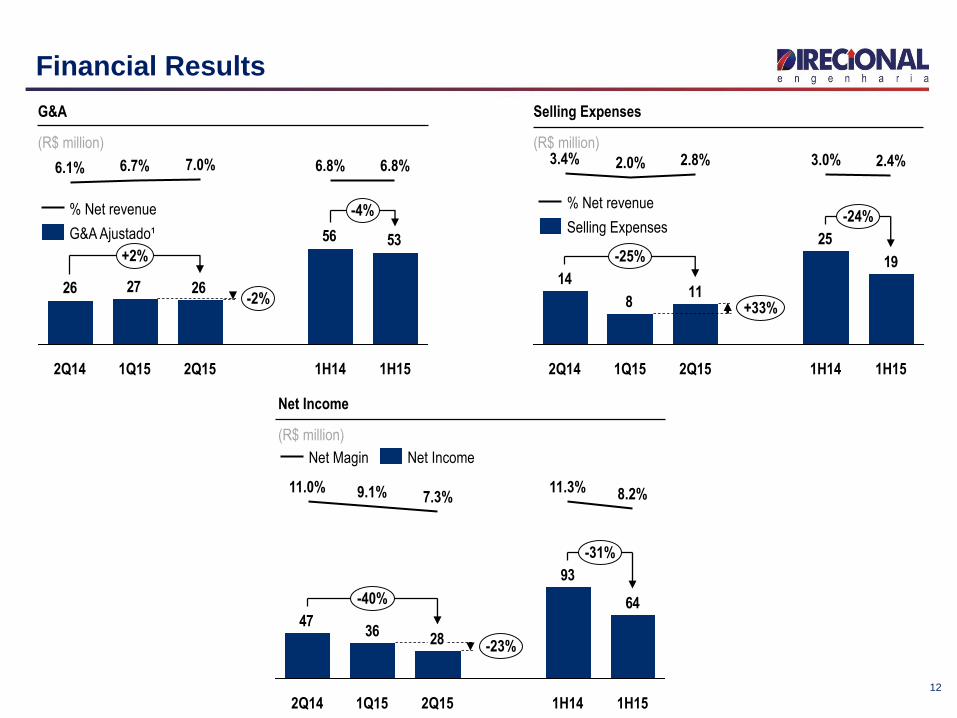
G&A
(R$ million)
Selling Expenses
(R$ million)
Net Income
(R$ million)
Financial Results
5356
262726
1Q15
6.7%
2Q14
6.1%
-4%
-2%
+2%
1H15
6.8%
1H14
6.8%
2Q15
7.0%
G&A Ajustado¹
% Net revenue
64
93
2836
47
-31%
-23%
-40%
1H15
8.2%
1H14
11.3%
2Q15
7.3%
1Q15
9.1%
2Q14
11.0%
Net IncomeNet Magin
19
25
118
14
3.0%
2Q15 1H14
2.4%
1H15
-25%
+33%
-24%
2.8%
1Q15
2.0%
2Q14
3.4%
% Net revenue
Selling Expenses
12
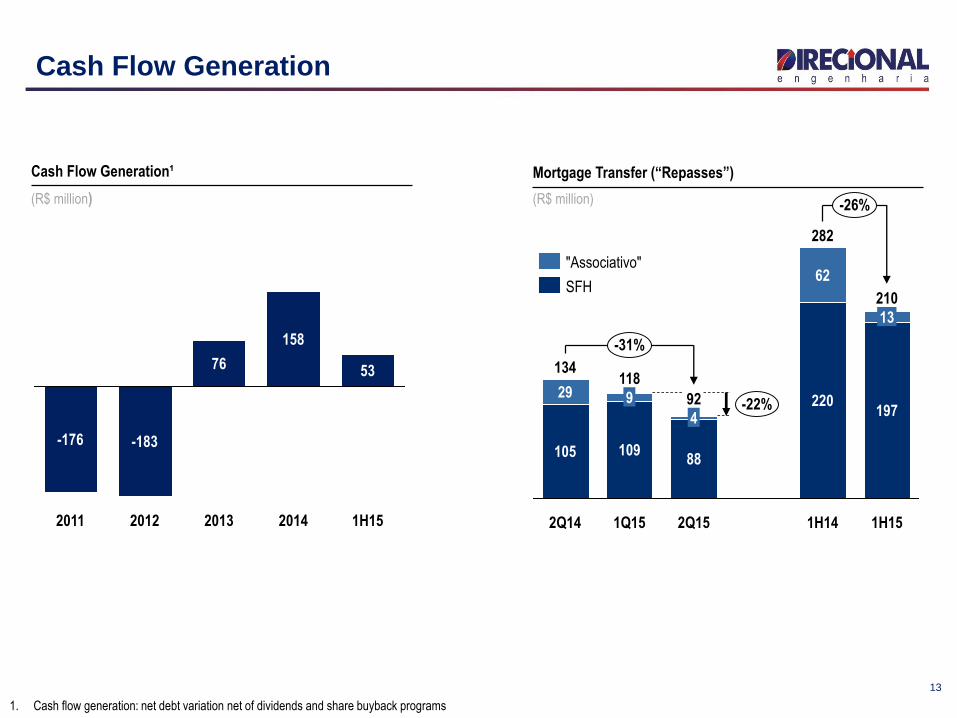
Cash Flow Generation
Cash Flow Generation¹
(R$ million)
1. Cash flow generation: net debt variation net of dividends and share buyback programs
Mortgage Transfer (“Repasses”)
(R$ million)
2011
-176
53
2014
158
2013
76
2012
-183
1H15
9
2Q14
220
1H14
13
62
2Q15
92
88
4
1Q15
118
109
29
134
105
282
-22%
1H15
-26%
-31%
210
197
"Associativo"
SFH
13
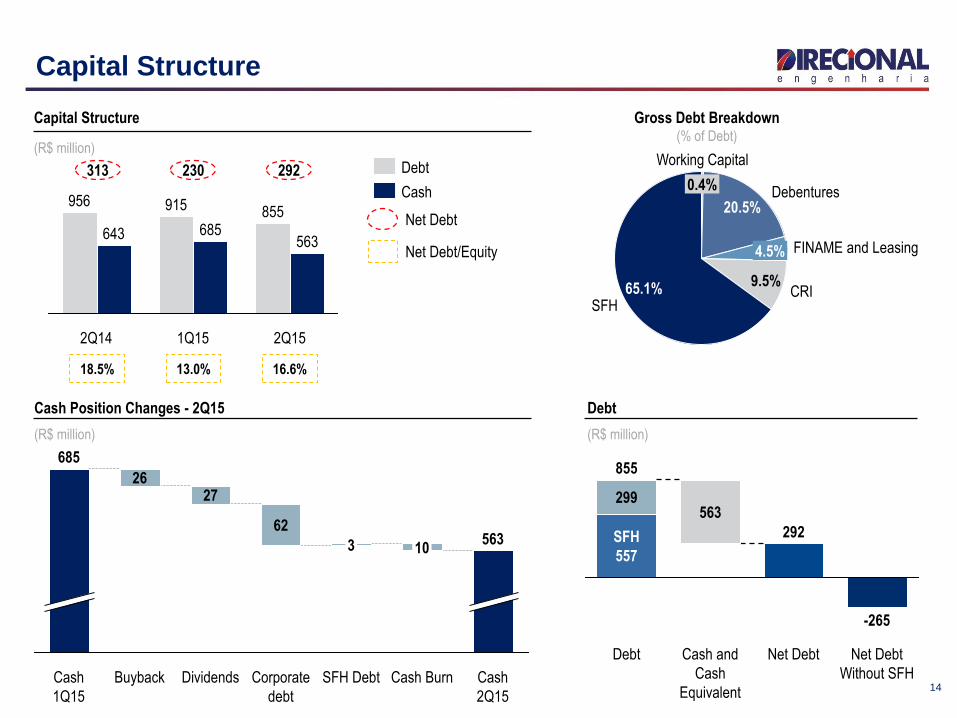
Capital Structure
Capital Structure
(R$ million)
313
18.5% 13.0% 16.6%
230 292
855
2Q15
685563
915
1Q152Q14
643
956
Debt
Cash
Gross Debt Breakdown(% of Debt)
292
-265
Debt Net Debt
Without SFH
Net DebtCash and
Cash
Equivalent
563
SFH
557
299
855
Debt
(R$ million)
9.5%CRI
SFH65.1%
0.4%
20.5%
Working Capital
Debentures
4.5% FINAME and Leasing
14
563
26
Cash
1Q15
Buyback Corporate
debt
685
Cash
2Q15
SFH Debt Cash Burn
10
27
62
Dividends
3
Cash Position Changes - 2Q15
(R$ million)
Net Debt
Net Debt/Equity
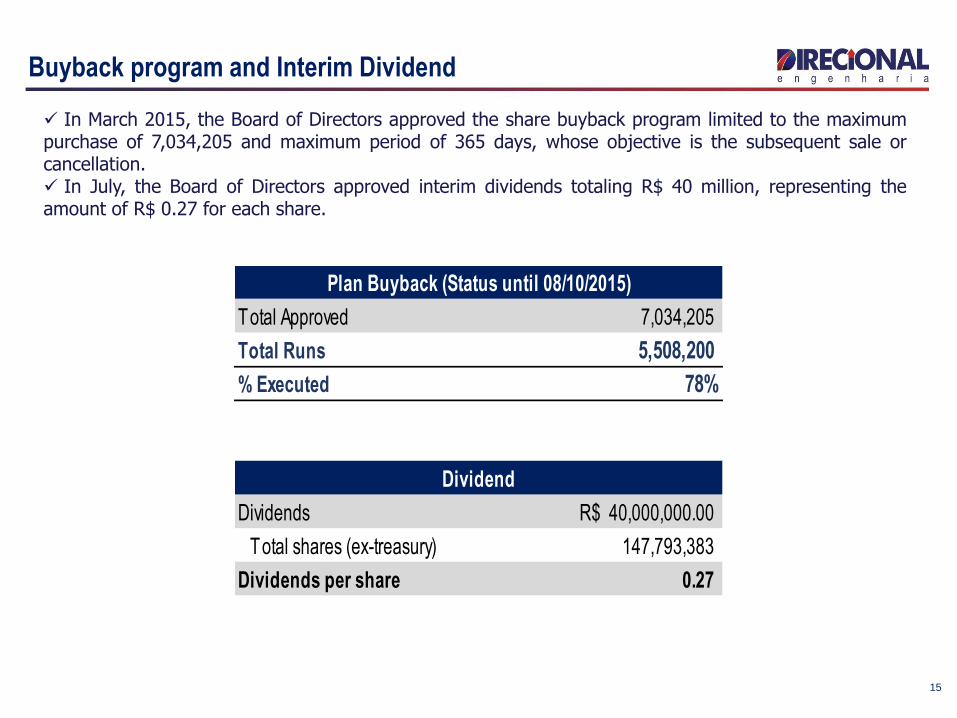
Buyback program and Interim Dividend
In March 2015, the Board of Directors approved the share buyback program limited to the maximumpurchase of 7,034,205 and maximum period of 365 days, whose objective is the subsequent sale orcancellation. In July, the Board of Directors approved interim dividends totaling R$ 40 million, representing theamount of R$ 0.27 for each share.
15
Total Approved 7,034,205
Total Runs 5,508,200
% Executed 78%
Dividends 40,000,000.00R$
Total shares (ex-treasury) 147,793,383
Dividends per share 0.27
Plan Buyback (Status until 08/10/2015)
Dividend

Disclosure and Contacts
This presentation contains certain forward-looking statements concerning the business prospects, projections of
operating and financial results and growth potential of the Company, which are based on management’s current
expectations and estimates of the future performance of the Company. Although the Company believes such
forward-looking statements are based on reasonable assumptions, it can give no assurance that its expectations
will be achieved. Expectations and estimates that are based on the future prospects of the Company are highly
dependent upon market behavior, Brazil’s political and economic situation, existing and future regulations of the
industry and international markets and, therefore, are subject to changes outside the Company’s and
management’s control. The Company undertakes no obligation to update any information contained herein or to
revise any forward-looking statement as a result of new information, future events or other information.
www.direcional.com.b/ir
(55 31) 3431-5509
(55 31) 3431-5510
(55 31) 3431-5511
Fernando José Mancio Ramos
CFO | IR Officer
IR Office
16