2q17 results call presentation - en
TRANSCRIPT
15 August 2017
Conference Call - 2Q17

2
Disclaimer
This presentation contains statements that may constitute “forward-looking statements”, based on
current opinions, expectations and projections about future events. Such statements are also
based on assumptions and analysis made by Wilson Sons and are subject to market conditions
which are beyond the Company’s control.
Important factors which may lead to significant differences between real results and these forward-
looking statements are: national and international economic conditions; technology; financial
market conditions; uncertainties regarding results in the Company’s future operations, its plans,
objectives, expectations, intentions; and other factors described in the section entitled "Risk
Factors“, available in the Company’s Prospectus, filed with the Brazilian Securities and Exchange
Commission (CVM).
The Company’s operating and financial results, as presented on the following slides, were
prepared in conformity with International Financial Reporting Standards (IFRS), except as
otherwise expressly indicated. An independent auditors’ review report is an integral part of the
Company’s condensed consolidated financial statements.
3
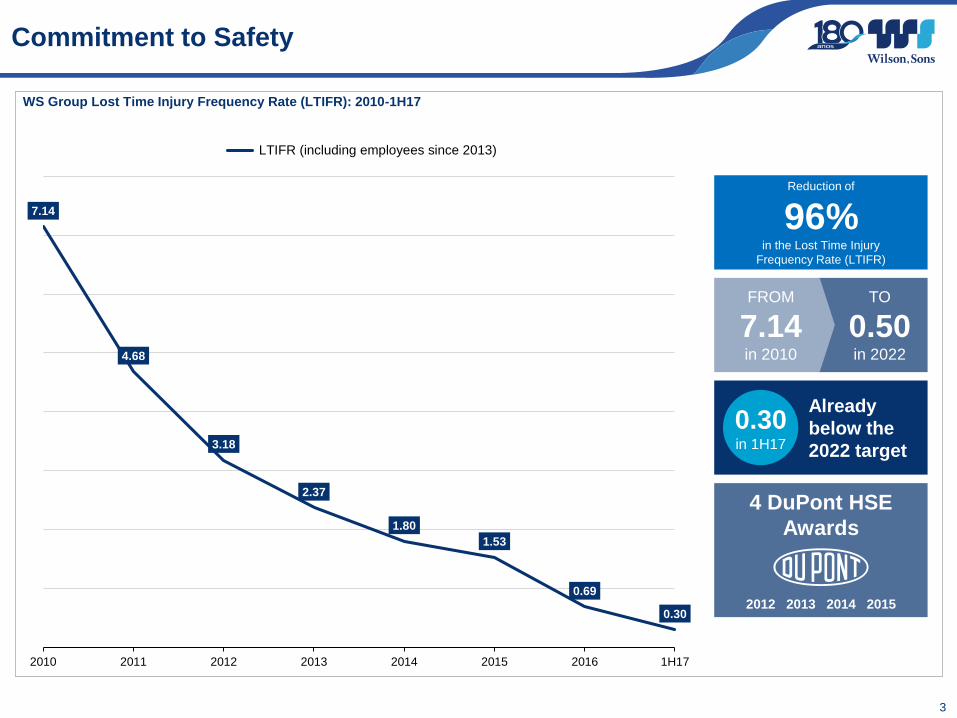
Commitment to Safety
WS Group Lost Time Injury Frequency Rate (LTIFR): 2010-1H17
7.14
4.68
3.18
2.37
1.80
1.53
0.69
0.30
2010 2011 2012 2013 2014 2015 2016 1H17
LTIFR (including employees since 2013)
Reduction of
96%in the Lost Time Injury
Frequency Rate (LTIFR)
TO
0.50in 2022
FROM
7.14in 2010
Already
below the
2022 target
0.30in 1H17
4 DuPont HSE
Awards
2012 2013 2014 2015
4
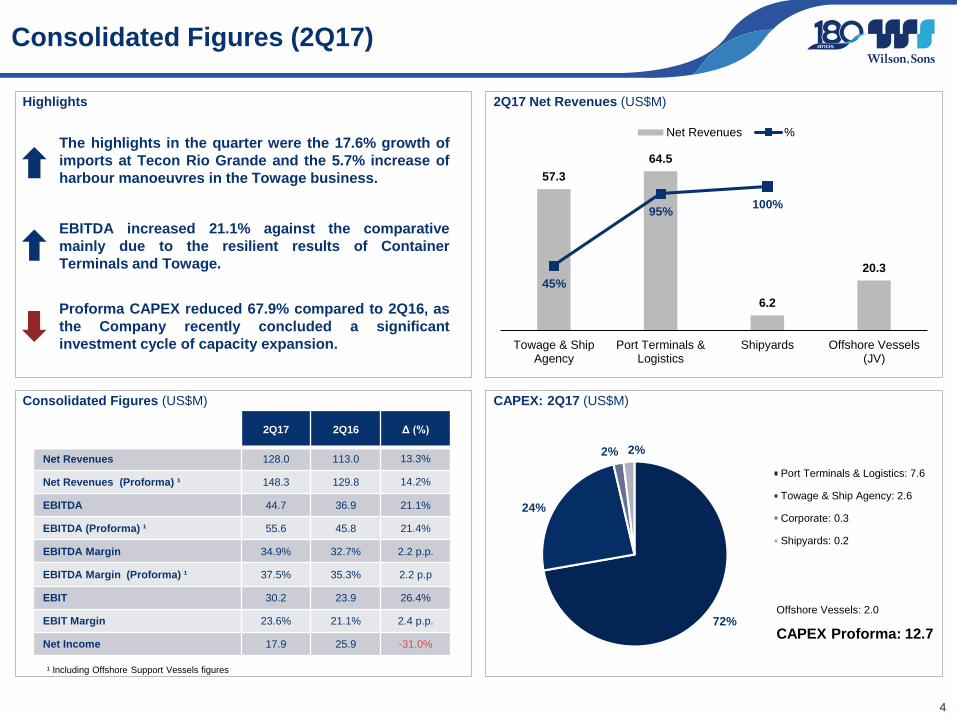
Consolidated Figures (2Q17)
Consolidated Figures (US$M) CAPEX: 2Q17 (US$M)
72%
24%
2% 2%
Port Terminals & Logistics: 7.6
Towage & Ship Agency: 2.6
Corporate: 0.3
Shipyards: 0.2
2Q17 2Q16 Δ (%)
Net Revenues 128.0 113.0 13.3%
Net Revenues (Proforma) ¹ 148.3 129.8 14.2%
EBITDA 44.7 36.9 21.1%
EBITDA (Proforma) ¹ 55.6 45.8 21.4%
EBITDA Margin 34.9% 32.7% 2.2 p.p.
EBITDA Margin (Proforma) ¹ 37.5% 35.3% 2.2 p.p
EBIT 30.2 23.9 26.4%
EBIT Margin 23.6% 21.1% 2.4 p.p.
Net Income 17.9 25.9 -31.0%CAPEX Proforma: 12.7
Highlights
The highlights in the quarter were the 17.6% growth of
imports at Tecon Rio Grande and the 5.7% increase of
harbour manoeuvres in the Towage business.
EBITDA increased 21.1% against the comparative
mainly due to the resilient results of Container
Terminals and Towage.
Proforma CAPEX reduced 67.9% compared to 2Q16, as
the Company recently concluded a significant
investment cycle of capacity expansion.
¹ Including Offshore Support Vessels figures
2Q17 Net Revenues (US$M)
57.3
64.5
6.2
20.3
45%
95%100%
Towage & ShipAgency
Port Terminals &Logistics
Shipyards Offshore Vessels(JV)
Net Revenues %
4
Offshore Vessels: 2.0
5
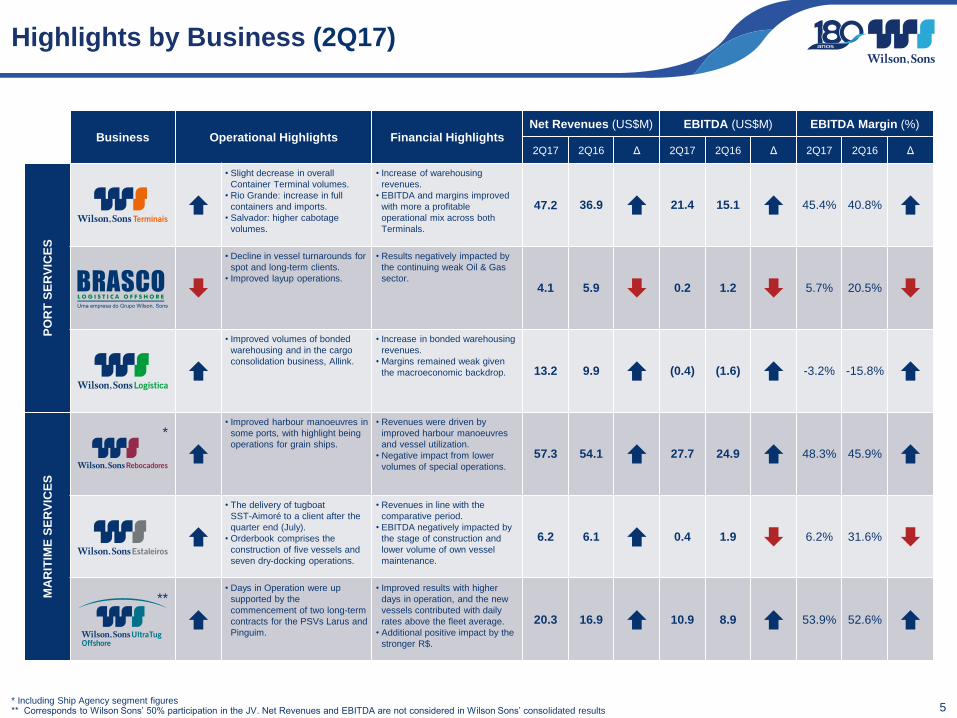
Highlights by Business (2Q17)
* Including Ship Agency segment figures** Corresponds to Wilson Sons’ 50% participation in the JV. Net Revenues and EBITDA are not considered in Wilson Sons’ consolidated results
Business Operational Highlights Financial HighlightsNet Revenues (US$M) EBITDA (US$M) EBITDA Margin (%)
2Q17 2Q16 Δ 2Q17 2Q16 Δ 2Q17 2Q16 Δ
PO
RT
SE
RV
ICE
S
• Slight decrease in overall
Container Terminal volumes.
• Rio Grande: increase in full
containers and imports.
• Salvador: higher cabotage
volumes.
• Increase of warehousing
revenues.
• EBITDA and margins improved
with more a profitable
operational mix across both
Terminals.
47.2 36.9 21.4 15.1 45.4% 40.8%
• Decline in vessel turnarounds for
spot and long-term clients.
• Improved layup operations.
• Results negatively impacted by
the continuing weak Oil & Gas
sector.4.1 5.9 0.2 1.2 5.7% 20.5%
• Improved volumes of bonded
warehousing and in the cargo
consolidation business, Allink.
• Increase in bonded warehousing
revenues.
• Margins remained weak given
the macroeconomic backdrop. 13.2 9.9 (0.4) (1.6) -3.2% -15.8%
MA
RIT
IME
SE
RV
ICE
S
*
• Improved harbour manoeuvres in
some ports, with highlight being
operations for grain ships.
• Revenues were driven by
improved harbour manoeuvres
and vessel utilization.
• Negative impact from lower
volumes of special operations.
57.3 54.1 27.7 24.9 48.3% 45.9%
• The delivery of tugboat
SST-Aimoré to a client after the
quarter end (July).
• Orderbook comprises the
construction of five vessels and
seven dry-docking operations.
• Revenues in line with the
comparative period.
• EBITDA negatively impacted by
the stage of construction and
lower volume of own vessel
maintenance.
6.2 6.1 0.4 1.9 6.2% 31.6%
**
• Days in Operation were up
supported by the
commencement of two long-term
contracts for the PSVs Larus and
Pinguim.
• Improved results with higher
days in operation, and the new
vessels contributed with daily
rates above the fleet average.
• Additional positive impact by the
stronger R$.
20.3 16.9 10.9 8.9 53.9% 52.6%
6
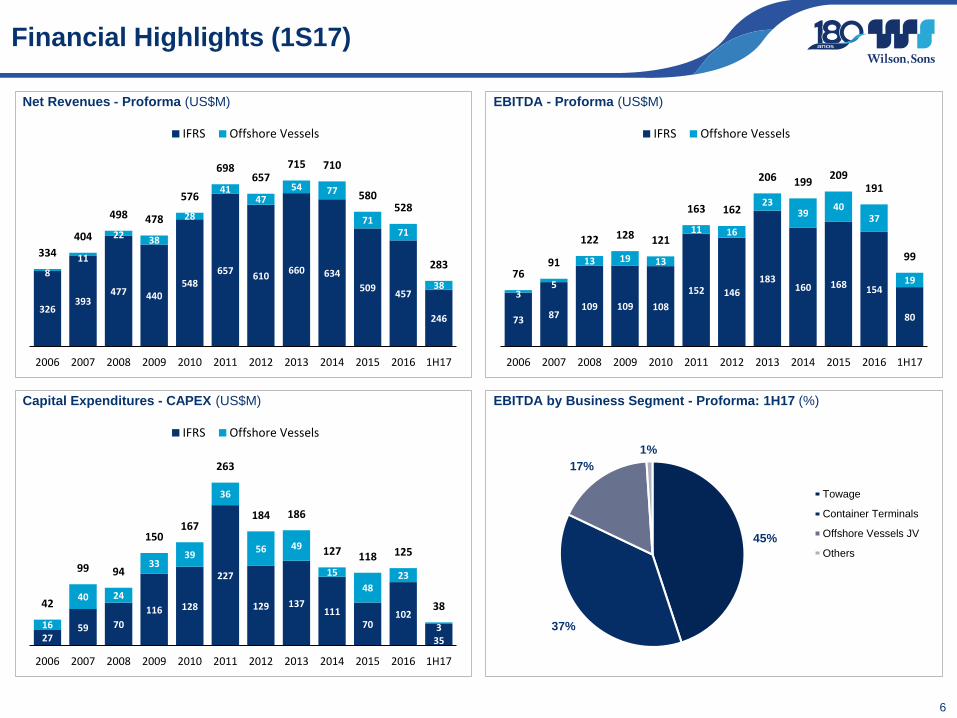
Financial Highlights (1S17)
Net Revenues - Proforma (US$M)
326393
477 440548
657610
660 634
509457
246
8
11
2238
28
4147
54 77
7171
38
334
404
498 478
576
698657
715 710
580528
283
2006 2007 2008 2009 2010 2011 2012 2013 2014 2015 2016 1H17
IFRS Offshore Vessels
Capital Expenditures - CAPEX (US$M)
2759 70
116 128
227
129 137111
70102
35
16
40 24
3339
36
56 49
15
4823
3
42
99 94
150167
263
184 186
127 118 125
38
2006 2007 2008 2009 2010 2011 2012 2013 2014 2015 2016 1H17
IFRS Offshore Vessels
EBITDA by Business Segment - Proforma: 1H17 (%)
45%
37%
17%
1%
Towage
Container Terminals
Offshore Vessels JV
Others
EBITDA - Proforma (US$M)
73 87109 109 108
152 146
183160 168 154
80
35
13 19 13
11 16
2339
4037
1976
91
122 128 121
163 162
206 199209
191
99
2006 2007 2008 2009 2010 2011 2012 2013 2014 2015 2016 1H17
IFRS Offshore Vessels
7
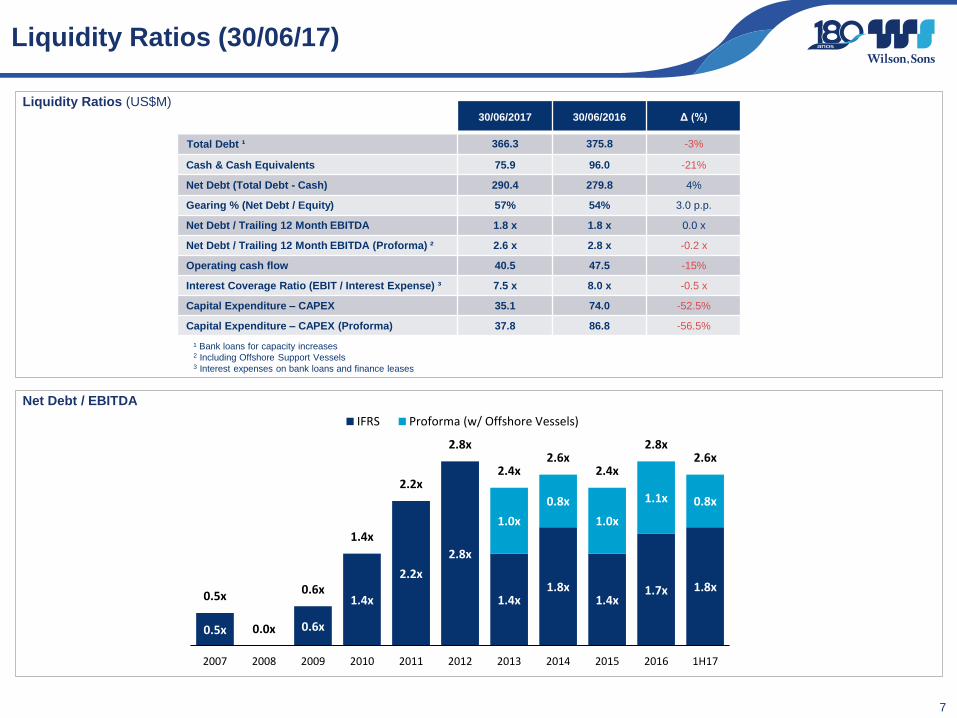
Liquidity Ratios (30/06/17)
Liquidity Ratios (US$M)
Net Debt / EBITDA
30/06/2017 30/06/2016 Δ (%)
Total Debt ¹ 366.3 375.8 -3%
Cash & Cash Equivalents 75.9 96.0 -21%
Net Debt (Total Debt - Cash) 290.4 279.8 4%
Gearing % (Net Debt / Equity) 57% 54% 3.0 p.p.
Net Debt / Trailing 12 Month EBITDA 1.8 x 1.8 x 0.0 x
Net Debt / Trailing 12 Month EBITDA (Proforma) ² 2.6 x 2.8 x -0.2 x
Operating cash flow 40.5 47.5 -15%
Interest Coverage Ratio (EBIT / Interest Expense) ³ 7.5 x 8.0 x -0.5 x
Capital Expenditure – CAPEX 35.1 74.0 -52.5%
Capital Expenditure – CAPEX (Proforma) 37.8 86.8 -56.5%
¹ Bank loans for capacity increases2 Including Offshore Support Vessels3 Interest expenses on bank loans and finance leases
0.5x 0.6x
1.4x
2.2x
2.8x
1.4x1.8x
1.4x1.7x 1.8x
1.0x
0.8x
1.0x
1.1x 0.8x
0.5x
0.0x
0.6x
1.4x
2.2x
2.8x
2.4x2.6x
2.4x
2.8x2.6x
2007 2008 2009 2010 2011 2012 2013 2014 2015 2016 1H17
IFRS Proforma (w/ Offshore Vessels)
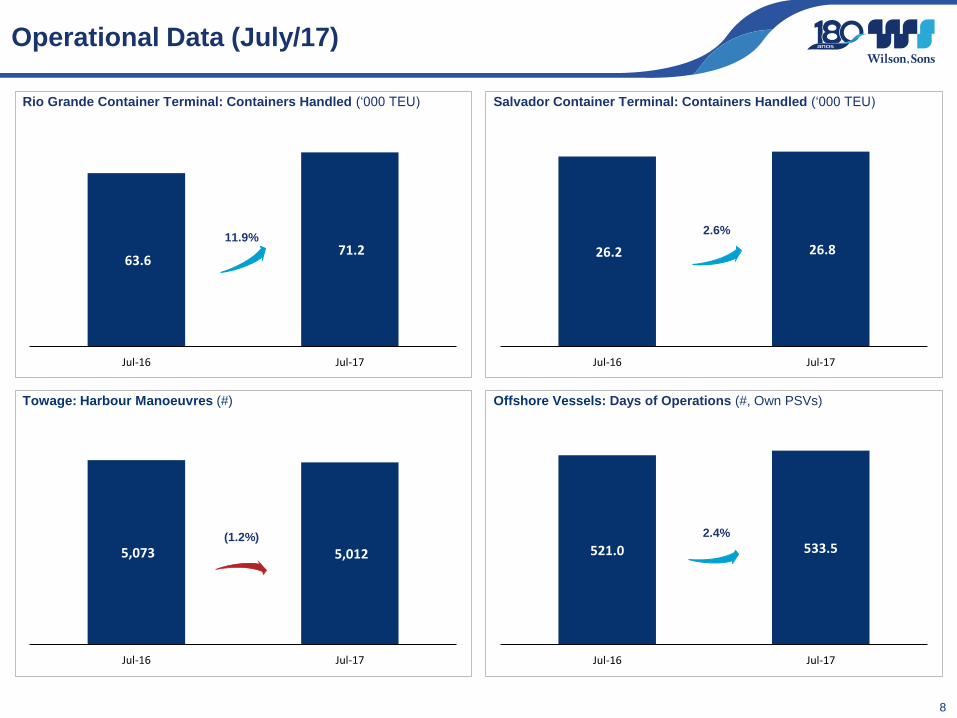
Operational Data (July/17)
8
Salvador Container Terminal: Containers Handled (‘000 TEU)
26.2 26.8
Jul-16 Jul-17
2.6%
Rio Grande Container Terminal: Containers Handled (‘000 TEU)
63.6 71.2
Jul-16 Jul-17
11.9%
Towage: Harbour Manoeuvres (#)
5,073 5,012
Jul-16 Jul-17
(1.2%)
Offshore Vessels: Days of Operations (#, Own PSVs)
521.0 533.5
Jul-16 Jul-17
2.4%
9
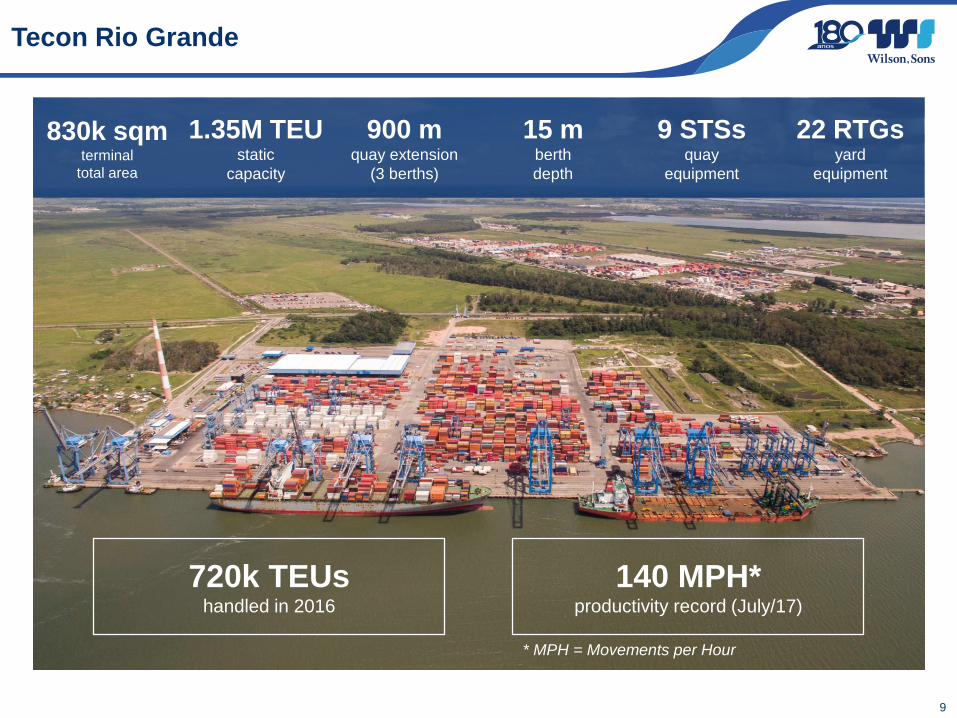
Tecon Rio Grande
830k sqmterminal
total area
1.35M TEUstatic
capacity
900 mquay extension
(3 berths)
15 mberth
depth
9 STSsquay
equipment
22 RTGsyard
equipment
720k TEUshandled in 2016
140 MPH*productivity record (July/17)
* MPH = Movements per Hour
Thank you.
www.wilsonsons.com.br/ir
Twitter.com/WilsonSonsIR/
YouTube.com/WilsonSonsIR/
Instagram.com/WilsonSons/
WSON33