3-1 ratio analysis du pont system effects of improving ratios limitations of ratio analysis...
TRANSCRIPT

3-1
Ratio Analysis Du Pont system Effects of improving ratios Limitations of ratio analysis Qualitative factors
CHAPTER 3Analysis of Financial
Statements

3-2
In this chapter, we focus on how financial managers (and investors) evaluate a firm’s current financial position. Then, in the remaining chapters, we examine the types of actions management can take to improve future performance and thus increase its stock price.

3-3
RATIO ANALYSISFinancial statements report both on a firm’s position at a
point in time and on its operations over some past period. However, the real value of financial statements lies in the
fact that they can be used to help predict future earnings and dividends.
From an investor’s standpoint, predicting the future is what financial statement analysis is all about,
While from management’s standpoint, financial statement analysis is useful both to help anticipate future conditions and, more important, as a starting point for planning actions that will improve the firm’s future performance.
3-4
LIQUIDITY RATIOSASSET MANAGEMENT RATIOSDEBT MANAGEMENT RATIOSPROFITABILITY RATIOSMARKET VALUE RATIOS
RATIO ANALYSIS

3-5
LIQUIDITY RATIOSLiquid AssetAn asset that can be converted to cash quickly without having to reduce the asset’s price very much.
Liquidity RatiosRatios that show the relationship of a firm’s cash and other current assets to its current liabilities.

3-6
ABILITY TO MEET SHORT-TERM OBLIGATIONS:
CURRENT RATIOThis ratio indicates the extent to which current liabilities are covered by those assets expected to be converted to cash in the near future.
This ratio is calculated by dividing current assets by current liabilities.
Current assets normally include cash, marketable securities, accounts receivable, and inventories. Current liabilities consist of accounts payable, short-term notes payable, current maturities of long-term debt, accrued taxes, and other accrued expenses

3-7
THE BALANCE SHEET

3-8
It should be noted that an industry average is not a magic number that all firms should strive to maintain—in fact, some very well-managed firms will be above the average while other good firms will be below it. However, if a firm’s ratios are far removed from the averages for its industry, an analyst should be concerned about why this variance occurs. Thus, a deviation from the industry average should signal the analyst (or management) to check further.

3-9
QUICK, OR ACID TEST, RATIOInventories are typically the least liquid of a
firm’s current assets, hence they are the assets on which losses are most likely to occur in the event of liquidation.
This ratio is calculated by deducting inventories from current assets and dividing the remainder by current liabilities.

3-10
ASSET MANAGEMENT RATIOS Does the total amount of each type of asset as
reported on the balance sheet seem reasonable, too high, or too low in view of current and projected sales levels?
When they acquire assets, companies must borrow or obtain capital from other sources.
If a firm has too many assets, its cost of capital will be too high, hence its profits will be depressed.
On the other hand, if assets are too low, profitable sales will be lost.
3-11
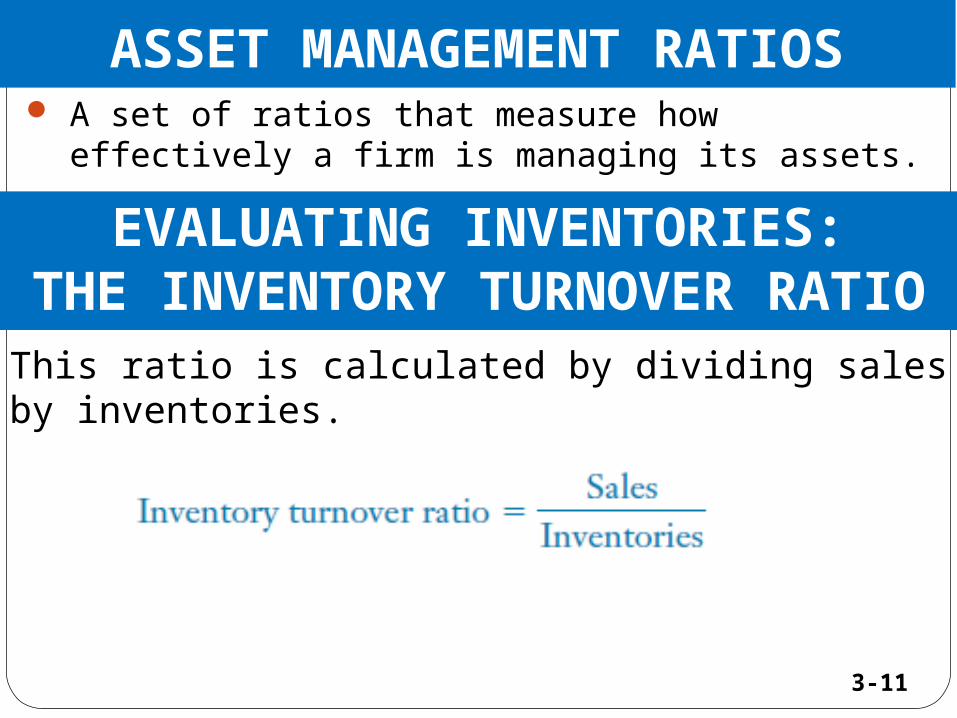
ASSET MANAGEMENT RATIOS A set of ratios that measure how effectively a firm is
managing its assets.EVALUATING INVENTORIES:THE INVENTORY TURNOVER
RATIOThis ratio is calculated by dividing sales by inventories.

3-12

3-13
Note that sales occur over the entire year, whereas the inventory figure is for one point in time. For this reason, it is better to use an average inventory measure.
If the firm’s business is highly seasonal, or if there has been a strong upward or downward sales trend during the year, it is especially useful to make some such adjustment. To maintain comparability with industry averages, however, we did not use the average inventory figure.

3-14
EVALUATING RECEIVABLES:THE DAYS SALES OUTSTANDING
This ratio indicates the average length of time the firm must wait after making a sale before it receives cash.
It is calculated by dividing accounts receivable by average sales per day;
3-15
If the Day sale outstanding is less, it indicates that the customers are not paying their bills on time and steps should be taken to expedite the collection of accounts receivable.

3-16
EVALUATING FIXED ASSETS:THE FIXED ASSETS TURNOVER
RATIOThe fixed assets turnover ratio measures how effectively
the firm uses its plant and equipment.It is the ratio of sales to net fixed assets:

3-17
A potential problem can exist when interpreting the fixed assets turnover ratio. Recall from accounting that fixed assets reflect the historical costs of the assets. Inflation has caused the value of many assets that were purchased in the past to be seriously understated. Therefore, if we were comparing an old firm that had acquired many of its fixed assets years ago at low prices with a new company that had acquired its fixed assets only recently, we would probably find that the old firm had the higher fixed assets turnover ratio. However, this would be more reflective of the difficulty accountants have in dealing with inflation than of any inefficiency on the part of the new firm.

3-18
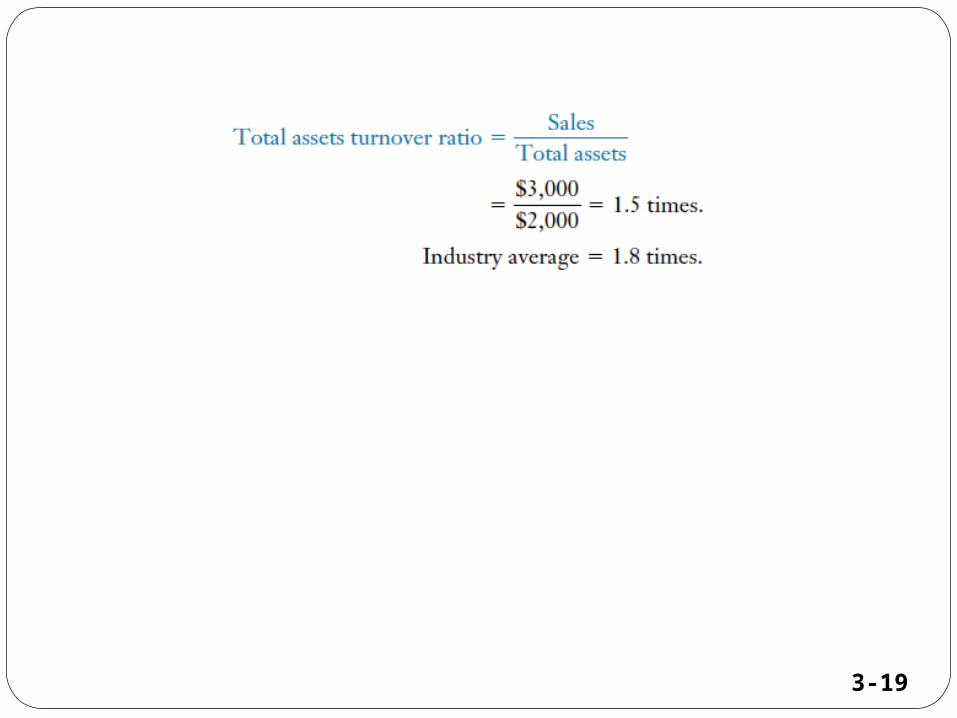
EVALUATING TOTAL ASSETS:THE TOTAL ASSETS TURNOVER RATIOThe total assets turnover ratio, measures the turnover of
all the firm’s assetsIt is calculated by dividing sales by total assets
If it is below the industry average, it indicates that the company is not generating a sufficient volume of business given its total assets investment.
In that case, sales should be increased, some assets should be disposed of, or a combination of these steps should be taken.
3-19
3-20
DEBT MANAGEMENT RATIOS
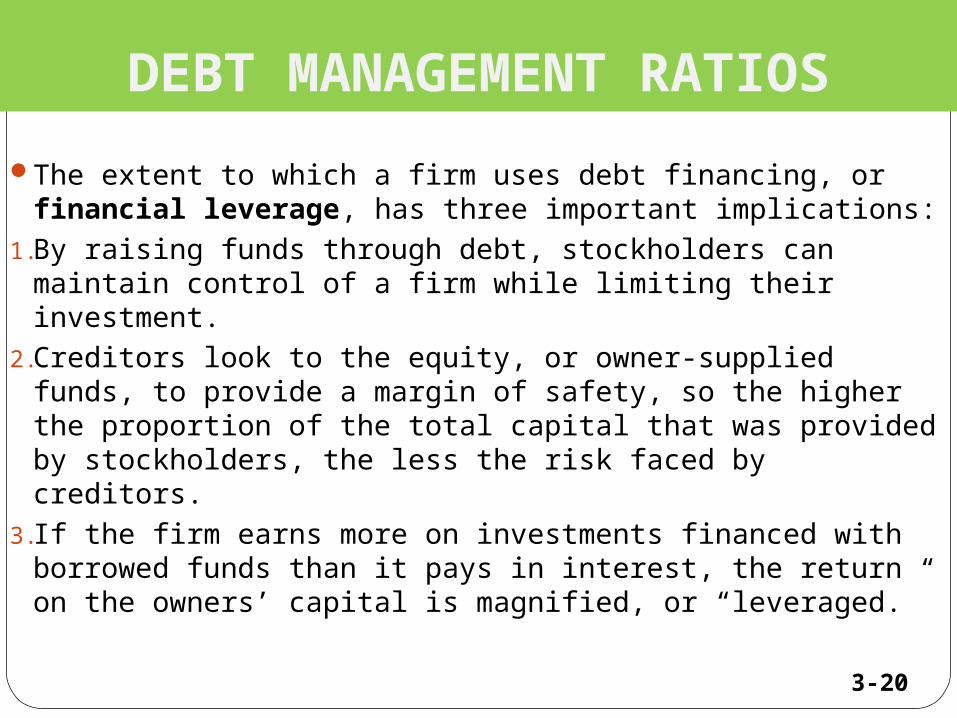
The extent to which a firm uses debt financing, or financial leverage, has three important implications:
1.By raising funds through debt, stockholders can maintain control of a firm while limiting their investment.
2.Creditors look to the equity, or owner-supplied funds, to provide a margin of safety, so the higher the proportion of the total capital that was provided by stockholders, the less the risk faced by creditors.
3. If the firm earns more on investments financed with borrowed funds than it pays in interest, the return on the owners’ capital is magnified, or “leveraged.”

3-21
To understand better how financial leverage affects risk and return, consider Table 3-1. Here we analyze two companies that are identical except for the way they are financed.
Firm U (for “unleveraged”) has no debt, whereas Firm L (for “leveraged”) is financed with half equity and half debt that costs 15 percent.
Both companies have $100 of assets and $100 of sales, and their expected operating income (also called earnings before interest and taxes, or EBIT) is $30. Thus, both firms expect to earn $30, before taxes, on their assets.

3-24
HOW THE FIRM IS FINANCED:Debt Ratio
The ratio of total debt to total assets, generally called the debt ratio, measures the percentage of funds provided by creditors:
Total debt includes both current liabilities and long-term debt.
3-25
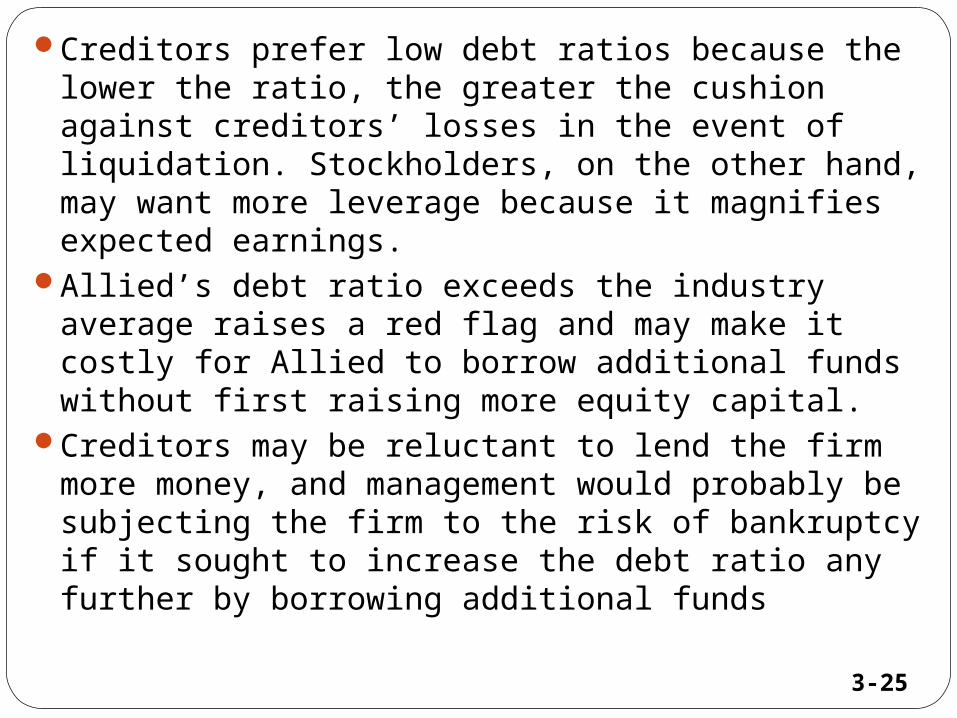
Creditors prefer low debt ratios because the lower the ratio, the greater the cushion against creditors’ losses in the event of liquidation. Stockholders, on the other hand, may want more leverage because it magnifies expected earnings.
Allied’s debt ratio exceeds the industry average raises a red flag and may make it costly for Allied to borrow additional funds without first raising more equity capital.
Creditors may be reluctant to lend the firm more money, and management would probably be subjecting the firm to the risk of bankruptcy if it sought to increase the debt ratio any further by borrowing additional funds

3-26
ABILITY TO PAY INTEREST:TIMES-INTEREST-EARNED
RATIOTimes Interest Earned (TIE) is a measure of the
firm’s ability to meet its annual interest payments.It is the ratio of earnings before interest and taxes
(EBIT) to interest charges
Allied is covering its interest charges by a relatively low margin of safety. Thus, the TIE ratio reinforces the conclusion from our analysis of the debt ratio that Allied would face difficulties if it attempted to borrow additional funds.

3-27
ABILITY TO SERVICE DEBT: EBITDA COVERAGE RATIO
The TIE ratio is useful for assessing a company’s ability to meet interest charges on its debt, but this ratio has two shortcomings:
Interest is not the only fixed financial charge — companies must also reduce debt on schedule, and many firms lease assets and thus must make lease payments. If they fail to repay debt or meet lease payments, they can be forced into bankruptcy.
EBIT does not represent all the cash flow available to service debt, especially if a firm has high depreciation and/or amortization charges.
1.To account for these deficiencies, bankers and others have developed the EBITDA coverage ratio, defined as follows:

3-28

3-29
Allied’s ratio is well below the industry average, so again, the company seems to have a relatively high level of debt.
The EBITDA coverage ratio is most useful for relatively short-term lenders such as banks, which rarely make loans (except real estate-backed loans) for longer than about five years.
Over a relatively short period, depreciation generated funds can be used to service debt. Over a longer time, those funds must be reinvested to maintain the plant and equipment or else the company cannot remain in business.
Therefore, banks and other relatively short-term lenders focus on the EBITDA coverage ratio, whereas long-term bondholders focus on the TIE ratio.
3-30
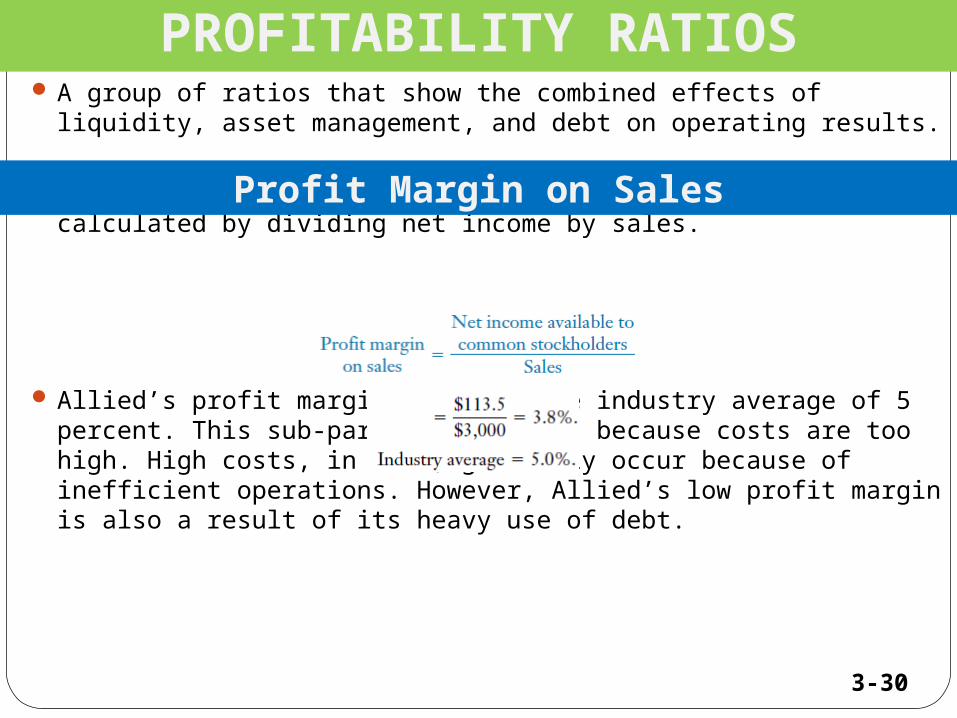
PROFITABILITY RATIOS A group of ratios that show the combined effects of liquidity, asset
management, and debt on operating results.
This ratio measures net income per dollar of sales; it is calculated by dividing net income by sales.
Allied’s profit margin is below the industry average of 5 percent. This sub-par result occurs because costs are too high. High costs, in turn, generally occur because of inefficient operations. However, Allied’s low profit margin is also a result of its heavy use of debt.
Profit Margin on Sales
3-31
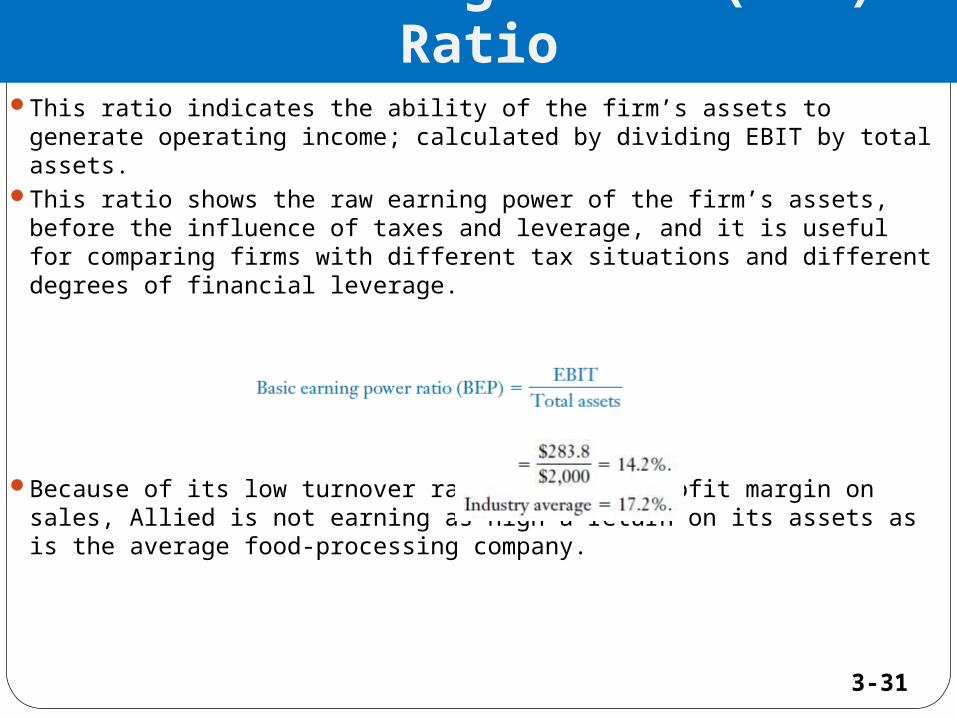
Basic Earning Power (BEP) Ratio
This ratio indicates the ability of the firm’s assets to generate operating income; calculated by dividing EBIT by total assets.
This ratio shows the raw earning power of the firm’s assets, before the influence of taxes and leverage, and it is useful for comparing firms with different tax situations and different degrees of financial leverage.
Because of its low turnover ratios and low profit margin on sales, Allied is not earning as high a return on its assets as is the average food-processing company.

3-32
RETURN ON TOTAL ASSETSThe ratio of net income to total assets measures the
return on total assets (ROA) after interest and taxes:
Allied’s 5.7 percent return is well below the 9 percent average for the industry. This low return results from
(1) the company’s low basic earning power plus (2) high interest costs resulting from its above-
average use of debt, both of which cause its net income to be relatively low.

3-33
RETURN ON COMMON EQUITYStockholders invest to get a return on their money, and this
ratio tells how well they are doing in an accounting sense. Common equity is the ratio of net income to common
equity, which measures the return on common equity (ROE):
Allied’s 12.7 percent return is below the 15 percent industry average, but not as far below as the return on total assets.

3-34
MARKET VALUE RATIOSThese ratios give management an indication of
what investors think of the company’s past performance and future prospects.
Price/Earnings (P/E) Ratio• The ratio of the price per share to earnings per
share.• This ration shows the dollar amount investors will
pay for $1 of current earnings.
3-35
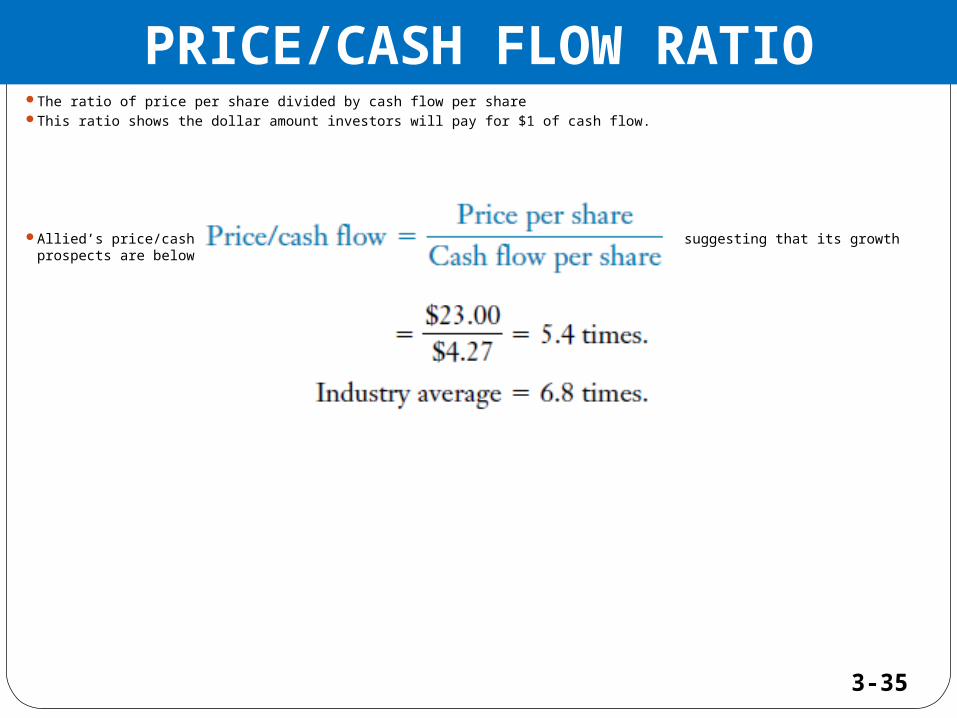
PRICE/CASH FLOW RATIOThe ratio of price per share divided by cash flow per shareThis ratio shows the dollar amount investors will pay for $1 of cash flow.
Allied’s price/cash flow ratio is also below the industry average, once again suggesting that its growth prospects are below average, its risk is above average, or both.

3-36
MARKET/BOOK RATIOThe ratio of a stock’s market price to its book value It gives an indication of how investors regard the company. Companies with relatively high rates of return on equity generally sell at higher multiples of book value than those with low returns. First, we find
Allied’s book value per share:
Investors are willing to pay less for a dollar of Allied’s book value than for one of an average food-processing company.

3-37
TREND ANALYSISAn analysis of a firm’s financial ratios over timeIt is used to estimate the likelihood of
improvement or deterioration in its financial condition.
3-38
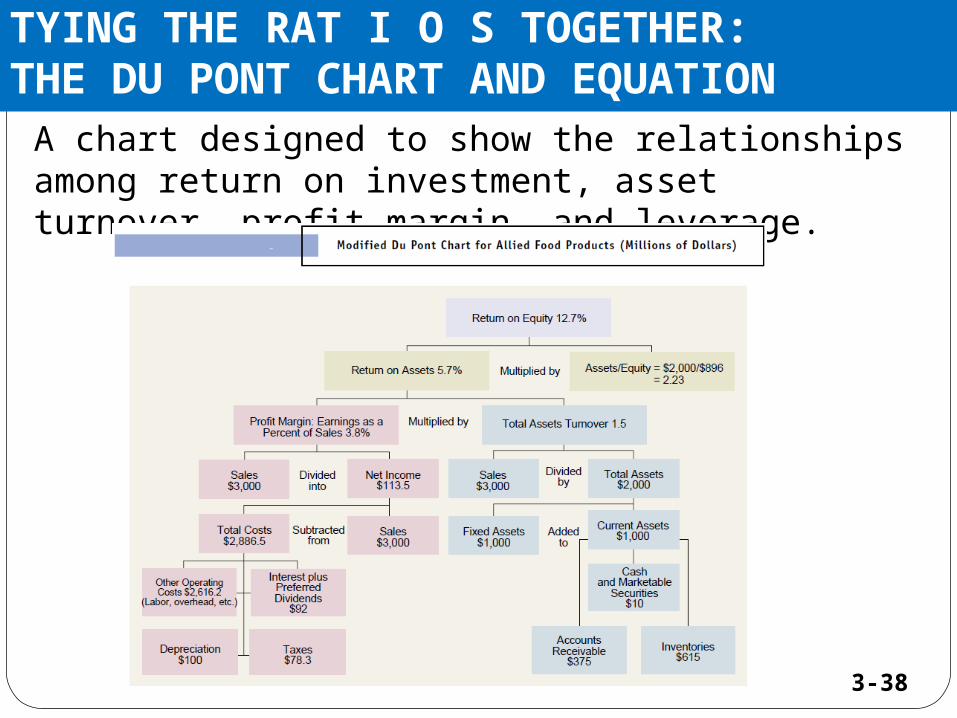
TYING THE RAT I O S TOGETHER:THE DU PONT CHART AND EQUATION
A chart designed to show the relationships among return on investment, asset turnover, profit margin, and leverage.

3-39
Du Pont EquationA formula which shows that the rate of return on
assets can be found as the product of the profit margin times the total assets turnover.
It gives the rate of return on assets (ROA).
If the company is financed only with common equity, the rate of return on assets (ROA) and the return on equity (ROE) would be the same because total assets would equal common equity

3-40
This equality holds if and only if Total assets = Common equity, that is, if the company uses no debt. Allied does use
debt, so its common equity is less than total assets. Therefore, the return to the common stockholders (ROE) must be greater than the ROA of 5.7 percent. Specifically, the rate of return on assets (ROA) can be multiplied by the equity multiplier, which is the ratio of assets to common equity:
Firms that use a large amount of debt financing (more leverage) will necessarily have a high equity multiplier—the more the debt, the less the equity, hence the higher the equity multiplier.

3-41
For example, if a firm has $1,000 of assets and is financed with $800, or 80 percent debt, then its equity will be $200, and its equity multiplier will be $1,000/$200 = 5.
Had it used only $200 of debt, then its equity would have been $800, and its equity multiplier would have been only
$1,000/$800 = 1.25Allied’s return on equity (ROE) depends on its
ROA and its use of leverage

3-42
The Du Pont equation shows how the profit margin, the total assets turnover, and the use of debt interact to determine the return on equity

3-43
Allied’s management can use the Du Pont system to analyze ways of improving performance.
Focusing on the left, or “profit margin,” side of its modified Du Pont chart, Allied’s marketing people can study the effects of raising sales prices (or lowering them to increase volume), of moving into new products or markets with higher margins, and so on.
The company’s cost accountants can study various expense items and, working with engineers, purchasing agents, and other operating personnel, seek ways to hold down costs.
On the “turnover” side, Allied’s financial analysts, working with both production and marketing people, can investigate ways to reduce the investment in various types of assets.
At the same time, the treasury staff can analyze the effects of alternative financing strategies, seeking to hold down interest expense and the risk of debt while still using leverage to increase the rate of return on equity.
3-44
COMPARATIVE RATIOS AND “BENCHMARKING”
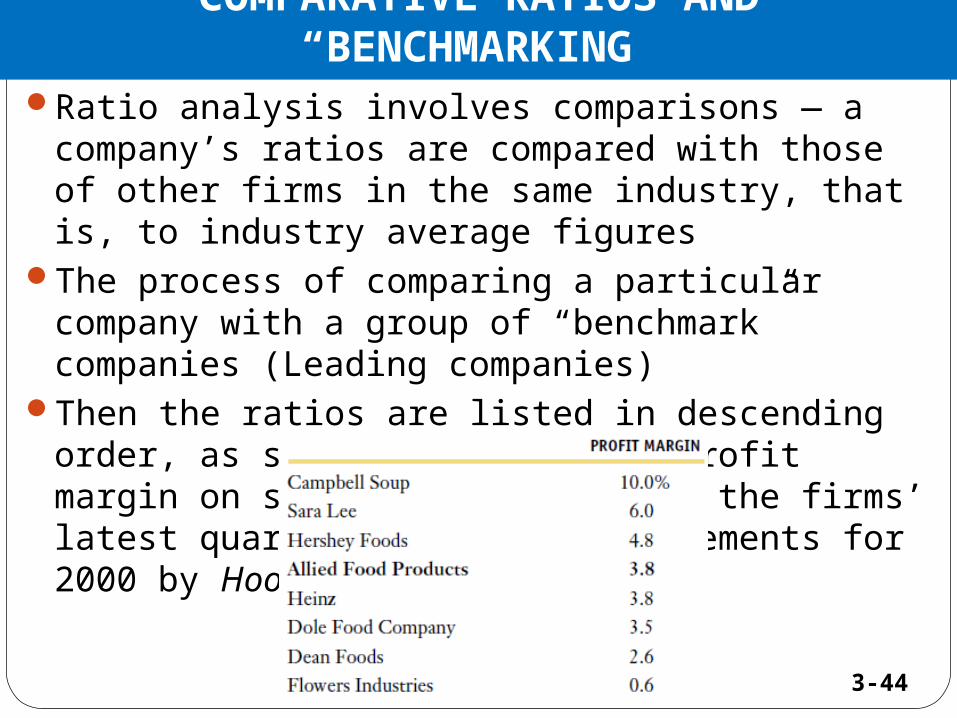
Ratio analysis involves comparisons — a company’s ratios are compared with those of other firms in the same industry, that is, to industry average figures
The process of comparing a particular company with a group of “benchmark” companies (Leading companies)
Then the ratios are listed in descending order, as shown below for the profit margin on sales (as reported on the firms’ latest quarterly financial statements for 2000 by Hoover’s Online)

3-45
The benchmarking setup makes it easy for Allied’s management to see exactly where the company stands relative to its competition.
As the data show, Allied is in the middle of its benchmark group with respect to its profit margin, so the company has room for improvement. Other ratios are analyzed similarly.

3-46

3-47
USES AND LIMITATIONS OF RATIO ANALYSIS
Ratio analysis is used by three main groups: (1) managers, who employ ratios to help analyze,
control, and thus improve their firms’ operations;(2) credit analysts, including bank loan officers and
bond rating analysts, who analyze ratios to help ascertain a company’s ability to pay its debts; and
(3) stock analysts, who are interested in a company’s efficiency, risk, and growth prospects.
Some potential problems are listed below:1. Many large firms operate different divisions in
different industries, and for such companies it is difficult to develop a meaningful set of industry averages. Therefore, ratio analysis is more useful for small, narrowly focused firms than for large, multidivisional ones.
3-48
2. Most firms want to be better than average, so merely attaining average performance is not necessarily good. As a target for high-level performance, it is best to focus on the industry leaders’ ratios. Benchmarking helps in this regard.
3. Inflation may have badly distorted firms’ balance sheets—recorded values are often substantially different from “true” values. Further, since inflation affects both depreciation charges and inventory costs, profits are also affected. Thus, a ratio analysis for one firm over time, or a comparative analysis of firms of different ages, must be interpreted with judgment.
4. Seasonal factors can also distort a ratio analysis. For example, the inventory turnover ratio for a food processor will be radically different if the balance sheet figure used for inventory is the one just before versus just after the close of the canning season. This problem can be minimized by using monthly averages for inventory (and receivables) when calculating turnover ratios.

3-49
3. Firms can employ “window dressing” techniques to make their financial statements look stronger. To illustrate, a Chicago builder borrowed on a two-year basis on December 29, 2001, held the proceeds of the loan as cash for a few days, and then paid off the loan ahead of time on January 2, 2002. This improved his current and quick ratios, and made his year-end 2001 balance sheet look good. However, the improvement was strictly window dressing; a week later the balance sheet was back at the old level.
6. Different accounting practices can distort comparisons. As noted earlier, inventory valuation and depreciation methods can affect financial statements and thus distort comparisons among firms. Also, if one firm leases a substantial amount of its productive equipment, then its assets may appear low relative to sales because leased assets often do not appear on the balance sheet. At the same time, the liability associated with the lease obligation may not be shown as a debt. Therefore, leasing can artificially improve both the turnover and the debt ratios. However, the accounting profession has taken steps to reduce this problem.

3-50
It is difficult to generalize about whether a particular ratio is “good” or “bad.” For example, a high current ratio may indicate a strong liquidity position, which is good, or excessive cash, which is bad (because excess cash in the bank is a nonearning asset). Similarly, a high fixed assets turnover ratio may denote either a firm that uses its assets efficiently or one that is undercapitalized and cannot afford to buy enough assets.
8. A firm may have some ratios that look “good” and others that look “bad,” making it difficult to tell whether the company is, on balance, strong or weak. However, statistical procedures can be used to analyze the net effects of a set of ratios. Many banks and other lending organizations use such procedures to analyze firms’ financial ratios, and then to classify them according to their probability of getting into financial trouble
3-51
PROBLEMS WITH ROEIf a firm takes steps to improve its ROE, does it mean that
shareholder wealth will also increase? Not necessarily, for despite its widespread use and the fact that ROE and shareholder wealth are often highly correlated, some problems can arise when firms use ROE as the sole measure of performance.
First, ROE does not consider risk. While shareholders clearly care about returns, they also care about risk. To illustrate this point, consider two divisions within the same firm. Division S has very stable cash flows and a predictable 15 percent ROE. Division R, on the other hand, has a 16 percent expected ROE, but its cash flows are very risky, so the expected ROE may not materialize. If managers were compensated solely on the basis of ROE, and if the expected ROEs were actually achieved, then Division R’s manager would receive a higher bonus than Division S’s manager, even though Division S may actually create more value for shareholders as a result of its lower risk.

3-52
Second, ROE does not consider the amount of invested capital. To illustrate this point, let’s consider a rather extreme example. A large company has $1 invested in Project A, which has an ROE of 50 percent, and $1 million invested in Project B, which has a 40 percent ROE. The projects are equally risky, and the two returns are both well above the cost the company had to pay for the capital invested in the projects. In this example, Project A has a higher ROE, but since it is so small, it does little to enhance shareholder wealth. Project B, on the other hand, has the lower ROE, but it adds much more to shareholder value.

3-53
Consider one last problem with ROE. Assume that you manage a division of a large firm. The firm uses ROE as the sole measure of performance, and it determines bonuses on the basis of ROE. Toward the end of the fiscal year, your division’s ROE is an impressive 45 percent. Now you have an opportunity to invest in a large, low-risk project that has an estimated ROE of 35 percent, which is well above the cost of the capital you need to make the investment. Even though this project is profitable, you might be reluctant to make the investment because it would reduce your division’s average ROE, and therefore reduce the size of your year-end bonus.
These three examples suggest that a project’s return must be combined with its risk and size to determine its effect on shareholder value.