3 3 4 ws drownrep2006overview
DESCRIPTION
Drownings and other water-related injuries in Canada 10 Years of Research Canadian Red CrossTRANSCRIPT

CanadianRed CrossCanadianRed Cross
2006
Drowningsin Canada
Drowningsand other water-related injuries in Canada
10 Years of Research
OverviewModule 1 Overview
This report is dedicated to the 5,900 people
in Canada during 1991-2000
who died from a water-related injury,
and to the 3,526 who survived a
hospitalization for near drowning.
May these deaths not have been in vain —
let the information about risk factors guide
all with responsibility for water safety to act,
and to make the right decisions
to prevent all avoidable incidents,
saving thousands of lives and billions
of dollars during the next decade.

© The Canadian Red Cross Society, 2006
Drownings and Other Water-Related Injuries in Canada, 1991-2000Module 1: Overview
For a pdf version of this module, please visit our website at www.redcross.ca
This Visual Surveillance Report was developed and written by Dr. Peter Barss, in collaborationwith Rosemary Hong and Christy-Ann Moore of the Canadian Red Cross, and with theassistance of Cait Beattie of Résolutique Globale. Sophie Lapointe, research technician, carried out the data analysis.
Data collectors included volunteers and staff of the Canadian Red Cross and the LifesavingSociety. Data collection was made possible through the assistance and co-operation ofprovincial coroners, medical examiners, their statistical staff, and the National Association of Coroners. Financing of the work was done collaboratively by sharing resources and staff.Data collection mainly involved the Canadian Red Cross, the Lifesaving Society, and provincialcoroners. Data coding, verification, and entry were supported by the Canadian Red Cross andthe Lifesaving Society, and carried out by Isabelle Masson, Peter Barss, and Sophie Lapointe.
The National Search and Rescue Secretariat and the Canadian Red Cross Society funded dataanalysis and writing, as well as editing, design, and layout of this 10-year report. Christy-AnnMoore of the Canadian Red Cross coordinated this process. Monique Edwards of the CanadianRed Cross supervised translation and revision in French. The Canadian Coast Guard andTransport Canada sponsored the project and monitored its progress. The Research Institute of the McGill University Health Centre provided administrative support for data management.The Canadian Institute for Health Information (CIHI) supplied hospitalization data for neardrownings. The Cook-Rees Memorial Fund For Water Search And Safety supported theprinting of this module.
For the initial six years, the National Drowning Report and related special interest reports were generously supported by The Injury Prevention Module of the Régie régionale de la santéet des services sociaux de Montréal-Centre, a member of the World Health Organization’sCollaborating Centre for Injury Prevention and Safety Promotion.
Design & layout: Cait Beattie & Jean Louis Martin, Résolutique GlobaleTranslation: École Charade Inc. (text), Résolutique Globale (figures)Cover photo: Jesse Henderson, Curved Space StudiosPrinting: St. Joseph Communications
Ce rapport est aussi publié en français.

2 Introduction
3 Methods
4 Drownings
10 Non-Drownings
11 Near Drownings
12 Boating
14 Aquatic Activities
19 Non-aquatic Activities
21 High Risk Environments & Groups
28 Snowmobiling
30 Road Traffic
31 Trends 1991-1995 : 1996-2000
34 Discussion & Recommendations
38 Annexes
1
T A B L E O F C O N T E N T S
A website supported by The Cook-Rees Memorial Fund For Water Search And Safety.A central location of information on how to find and choose
the best flotation device for various water-related activities, and to learn aboutrecent advances in lifejacket design for individual comfort, style and protection.
Sport and safety organizations, policy makers and the media can also consult thewebsite to share knowledge, research and drowning prevention campaigns to helpinform the public about the need to wear a lifejacket in, on and around the water.

This document presents risk factors and trends for drowning and other water-related injurydeaths in Canada between 1991-2000. During this 10-year period, 5,900 individuals died and 3,526 survived a hospital admission for near drowning, some with permanentbrain impairment. Each of these incidents was a tragedy for a family and our society, often with devastating long-term emotional and financial consequences. The cost to oursociety of water-related injuries is estimated to be about 500 million dollars per year.
In the early 1990’s, the Canadian Red Cross set out to develop a sound research basis for its water safety programs. This research included identifying risk groups and risk factorsfor different water-related activities. Over time, the research developed into surveillance or monitoring of trends in various categories of injuries. This was the first population-basednational injury surveillance system in Canada, and the first surveillance system for riskfactors of water-related injury fatalities in the world.
Injury surveillance made possible an assessment of outcomes across Canada. Althoughreductions in water-related injury deaths cannot be conclusively attributed to newprograms, it is definitely advantageous to verify positive or negative trends in detail to helpevaluate and further improve prevention programs. Unfortunately, many new preventionprograms for injuries and other health conditions are still introduced without an associatedsurveillance system to monitor outcomes such as deaths or hospitalizations.
Major trends during 1991-2000 were assessed in a 2003 summary entitled “What we have learned: 10 Years of Pertinent Facts About Drownings and Other Water-RelatedInjuries in Canada 1991-2000 (Canadian Red Cross, 2003, www.redcross.ca/cmslib/general/10drwn_english.pdf).
The present report, Module 1 in a series, is a more detailed overview of this 10-yearperiod. It will be followed by other modules reporting in detail on specific subcategories of water-related fatalities, including incidents associated with ice and cold water, poweredboating, unpowered boating, fishing, and aboriginal peoples.
Although the Red Cross published annual reports for data from 1991 to 1999, these didnot include the analysis of long-term trends as in the present report and others to follow.Since the Red Cross developed and launched new national water safety programs and anew swimming and water-safety training manual during 1994-95, it was felt to be highlypertinent to assess trends in drowning and other water-related fatalities during the 1990’s before and after introduction of the new research-based programs. As with earlierpublications, this report relies upon fully labelled self-explanatory visual presentation of data with minimal text.
2
I N T R O D U C T I O N

This research is based on modern principles of injury prevention, including carefulassessment of personal, equipment, and environmental risk factors for different time phasesof potential injury incidents, including pre-event, event, and post-event phases (Haddon’sMatrix). Personal or host factors include variables such as age, sex, use of alcohol and otherdrugs, swimming ability, and ethnicity. Equipment factors include safety equipment such asflotation devices — which help to avoid injury during the event phase of the incident(i.e. immersion), and self-closing self-latching swimming pool gates — which work in thepre-event phase to help prevent an injury incident, i.e., a toddler falling into a pool, as wellas other factors such as type of boat or vehicle. Environmental factors include body ofwater, wind, waves, light conditions, water temperature, season, and many others.
Data on survivors of hospitalization for near drowning are provided by the CanadianInstitute for Health Information. Data for unintentional water-related injury deaths arecollected each year from provincial and territorial coroners’ offices across Canada, basedon a 15-page questionnaire structured on risk factors for major categories of water-relatedactivities by purpose. The main purposes of activity include recreation, daily life andsubsistence, and occupation; major activities include boating, aquatic activities, falls intowater during non-aquatic activities, bathing, and land and air transport.
Data are collected by dedicated volunteers affiliated with the Canadian Red Cross and the Lifesaving Society. Each province has a project manager who collaborates with the statistical or epidemiological staff of their provincial coroner’s office to ensure that all unintentional water-related deaths are included. Intentional injuries such as suicide and homicide are excluded. Occasional deaths of unknown intent may be included in the database, but are identifiable by unknown activity and purpose. An effort is made to conform to World Health Organization injury classifications where feasible.
Data are verified, revised as necessary, and entered centrally by a small team of skilledprofessional public health injury researchers to ensure validity and consistency across the country. The same professionals verified the data during the entire 10-year period. P values and 95% confidence intervals for the percent decline (increase) in incidence ratesin Table 2 are calculated using Poisson regression, with SAS 8.01 PROC GENMOD.Incidence rates for 1991-1995 were calculated using 1991 census data for populationdenominators, and rates for 1996-2000 using 1996 census data.
Many investigations by coroners or medical examiners take up to a year or longer to be finalized; data collection and analysis are also time-consuming. Hence the 1991 datawere reported in 1993 and the 2000 data in 2003. Analysis of 10 years of data is morecomplex and will be completed in 2005-2006.
Further details about methodology can be obtained from earlier annual Red Cross reportsissued during the 1990’s.
3
M E T H O D S

During 1991-2000, there were 5,900 water-related injury fatalities in Canada. Drowningaccounted for nearly 95% of these deaths; other injury fatalities are summarized in Table 1(page 10). Land and air transport drownings are usually considered separately from otherincidents. The largest single activity resulting in drowning in Canada is boating, followedby aquatic activities such as swimming, falls into water during non-aquatic activities such as playing near unprotected swimming pools, and bathing in a bathtub (Figure 1).
4
D R O W N I N G S
* Includes all water-related injuries other than drownings † Falls into water during non-aquatic activities such as walking or playing near water or on ice
Source: The Canadian Red Cross Society & the Canadian Surveillance System for Water-Related Fatalities, 2005
Figure 1 WATER-REL ATED DEATHS BY T YPE OF INJURY & ACTIVIT Y, C ANADA 1991-2000 (n=5,900)
Land & air transportdrownings (n=864)
Drownings,all other (n=4,671)
Other injuries*(n=365)
79%15%6%
Aquatic activities (n=1,183)
Using bathtub (n=389)
Falls into water† (n=1,091)
Unknown (n=205)
Boating (n=1,803)39%
25%
23%8%4%
PERSONAL RISK FACTORS
AGE AND SEX During 1991-1995, toddlers (1-4-year-olds) and 15-24-year-old males had the highest drowning rates, followed by adult males 25 and older. During 1996-2000,the highest rates were among 15-24-year-old males, followed by toddlers and adult males25 and older (Figure 2).
TRENDS
There was an improvement in drownings for all age groups with the exception of 5-24-year-old females during 1991-2000. The overall rate fell from 1.8 to 1.4 deaths per 100,000 population per year, an improvement of 22%, equivalent to 100 fewer deathsper year. The most striking improvement was seen for children under 5.
ALCOHOL For Canadians 15 years and older, alcohol was associated with 40% of drownings(Figure 3); however, since the presence of alcohol was unknown for another 25%, the truefigure could be as high as 65%. Nearly 60% of the blood alcohol levels above the legaldriving limit of 80 mg % were higher than 200 mg %; 18% were above 300 mg %.

5
D R O W N I N G S
* Includes recreational, occupational & daily living drownings (E910, E830, E832); excludes land & air transport drownings† Age unknown for 39 victims (males 21, 17; females 1, 0) ‡ Sex unknown for 9 victims, imputed male
Source: The Canadian Red Cross Society & the Canadian Surveillance System for Water-Related Fatalities, 2005
Figure 2 RATE AND NUMBER OF DROWNINGS* BY AGE & SEX, C ANADA 1991-2000 (n=4,671; 3,891 MALES, 780 FEMALES)†‡
<10.0
4.0
1-4 5-14 15-24 25-34 35-44 45-54 55-64 65-74 75+
Males 1991-1995 1996-2000
1996-2000
10 143 139 411 422 375 234 153 141 71
Females 1991-1995 13 77 32 45 44 52 47 38 39 384 104 111 316 314 319 238 145 124 79
6 44 46 54 29 46 43 27 25 34
Age group in years
Dro
wni
ngs/
100,
000
popu
lati
on/y
ear
Number of drownings in age group
3.60
0.96
1.42
4.00
3.29 3.353.08
2.56
3.27
2.92
3.5
3.0
2.5
2.0
1.5
1.0
0.5
2.03
0.34 0.460.35
0.470.63 0.62
0.740.94
1.31 1.14
0.470.55
0.25 0.37 0.45 0.44
0.73
0.42
0.64
2.56
1.08
3.07
2.55
2.522.31
2.58 2.842.62
0.41
MALES 1991-1995 (n=2,120)1996-2000 (n=1,771)
FEMALES 1991-1995 (n=426)1996-2000 (n=354)
* Legal limit is 80 mg % † Includes recreational, occupational & daily living drownings (E910, E830, E832); excludes land & air transport drownings ‡ This figure excludes 201 victims; decomposition rendered blood alcohol unreliable
§ Age unknown for 39 victims, presumed adult ¶ 159 at 1-49 mg %, 92 at 50-80 mg %, and 17 unspecified
Source: The Canadian Red Cross Society & the Canadian Surveillance System for Water-Related Fatalities, 2005
Figure 3 BLOOD ALCOHOL LEVELS* FOR ALL DROWNINGS,† C ANADA 1991-2000 (VICTIMS ≥15 YEARS OF AGE; n=3,942)‡§
>300 mg % (n=185)
251-300 mg % (n=160)
201-250 mg % (n=237)
151-200 mg % (n=206)
81-100 mg % (n=43)
Unspecified 1% (n=12)
101-150 mg % (n=182)
No alcohol(n=1,297)
Below limit¶
(n=268)Unknown(n=943) Alcohol suspected
(n=208)
27%Above limit
(n=1,025)
6%7%25%
35%
18%
23%
18%
16 %
20%
4%

SWIMMING ABILITY Due to controversy about whether swimming ability is protective for young children, this risk factor was assessed only for children 5 years and older and for adults. Unfortunately, swimming ability was unspecified for more than half of victims5 years and older. Where swimming ability was known, 60% of 5-14 year old victims were weak or non-swimmers (Figure 4). For victims 15 years and older with knownswimming ability, 41% were weak or non-swimmers, while 13% were strong swimmers.
6
D R O W N I N G S
* Includes recreational, occupational & daily living drownings (E910, E830, E832); excludes land & air transport drownings † Age unknown for 39 victims, presumed adult
‡ This figure excludes 427 cases where swimming ability was considered irrelevant (5-14 years 19, ≥15 years 408)
Source: The Canadian Red Cross Society & the Canadian Surveillance System for Water-Related Fatalities, 2005
Figure 4 DROWNINGS* BY SWIMMING ABILIT Y BY AGE, C ANADA 1991-2000 (VICTIMS ≥5 YEARS OF AGE; n=4,270)†‡
Swimmer, unspecified (n=493)
Swimmer, unspecified (n=49)
Strong swimmer (n=184)
Non-swimmer (n=340)Non-swimmer
(n=49)
Weak swimmer (n=44)
Weak swimmer (n=215)
Average swimmer (n=151)
Strong swimmer 1% (n=4) Average swimmer
3% (n=8)
Unknown (n=2,151)
Unknown (n=155)
5-14 years (n=328)
≥15 years (n=3,942)
50%14%
16%
16%14%
6%
4%
5%
10%61%
ENVIRONMENTAL RISK FACTORS
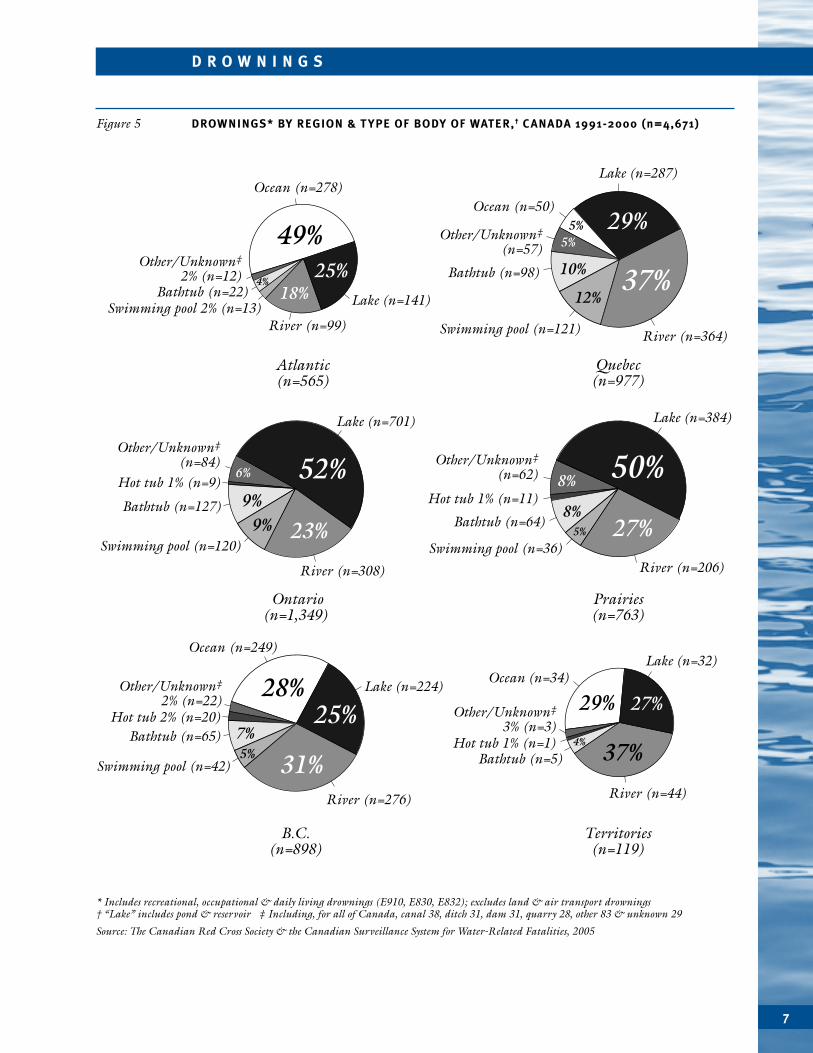
BODY OF WATER BY REGION In the flatter central parts of Canada, lakes were the most frequentbodies of water for drowning (Figure 5). In Quebec, British Columbia, and the northernterritories rivers were most frequent, followed closely by lakes, while in the Atlantic region,the ocean predominated. Bathtub and swimming pool drownings were most common inQuebec and Ontario, followed by the Prairies and British Columbia.
ACCOMPANYING PERSONS The absence of adult supervision is a factor in most child drownings.However, increased supervision should not preclude implementation of equipment and environmental changes, since drownings and other injuries generally result from the interaction of multiple risk factors.
Almost all bathtub-drowning victims and nearly 80% of victims of falls into water werealone, or accompanied only by a minor (Figure 6). Presence of another adult was muchmore frequent in boating and aquatic drownings. In cases where the activity was unknown,the victim was usually alone; some of these may have been suicides, although not provenand classified as such.
7
D R O W N I N G S
* Includes recreational, occupational & daily living drownings (E910, E830, E832); excludes land & air transport drownings† “Lake” includes pond & reservoir ‡ Including, for all of Canada, canal 38, ditch 31, dam 31, quarry 28, other 83 & unknown 29
Source: The Canadian Red Cross Society & the Canadian Surveillance System for Water-Related Fatalities, 2005
Figure 5 DROWNINGS* BY REGION & T YPE OF BODY OF WATER,† C ANADA 1991-2000 (n=4,671)
River (n=308)
Lake (n=701)
Swimming pool (n=120)
Bathtub (n=127)
Hot tub 1% (n=9)
Ontario (n=1,349)
Other/Unknown‡
(n=84) 52%
23%9%
6%
9%
River (n=206)
Lake (n=384)
Swimming pool (n=36)
Bathtub (n=64)
Hot tub 1% (n=11)
Prairies (n=763)
Other/Unknown‡
(n=62) 50%
27%5%
8%
8%
River (n=276)
Lake (n=224)
Swimming pool (n=42)
Bathtub (n=65)Hot tub 2% (n=20)
B.C. (n=898)
Other/Unknown‡
2% (n=22)
Bathtub (n=5)Hot tub 1% (n=1)
Other/Unknown‡
3% (n=3)
Ocean (n=249)
25%
31%5%7%
28%
River (n=44)
Lake (n=32)Ocean (n=34)
Territories (n=119)
27%
37%4%
29%
River (n=364)
Lake (n=287)
Swimming pool (n=121)
Bathtub (n=98)
Quebec (n=977)
Other/Unknown‡
(n=57)
Swimming pool 2% (n=13) Bathtub (n=22)
Other/Unknown‡
2% (n=12)
Ocean (n=50)29%
10%
5%5%
12%37%
River (n=99)
Lake (n=141)
Ocean (n=278)
Atlantic (n=565)
25%18%
49%4%
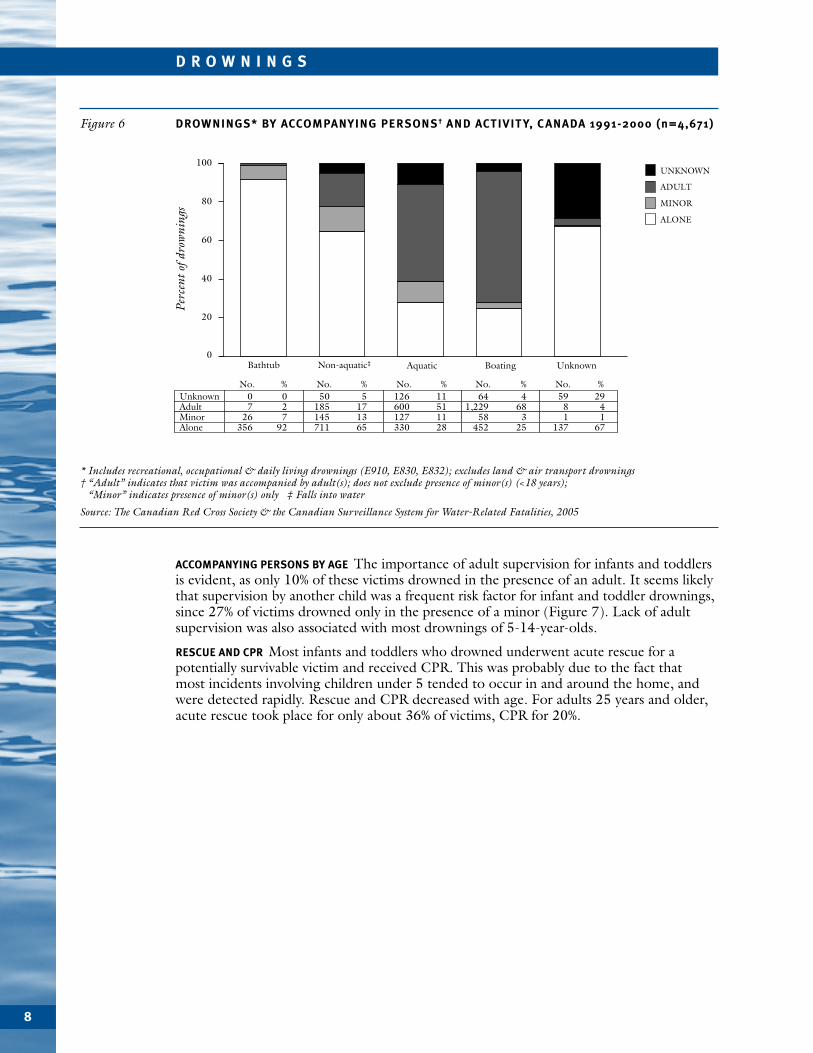
ACCOMPANYING PERSONS BY AGE The importance of adult supervision for infants and toddlersis evident, as only 10% of these victims drowned in the presence of an adult. It seems likelythat supervision by another child was a frequent risk factor for infant and toddler drownings,since 27% of victims drowned only in the presence of a minor (Figure 7). Lack of adultsupervision was also associated with most drownings of 5-14-year-olds.
RESCUE AND CPR Most infants and toddlers who drowned underwent acute rescue for apotentially survivable victim and received CPR. This was probably due to the fact that most incidents involving children under 5 tended to occur in and around the home, andwere detected rapidly. Rescue and CPR decreased with age. For adults 25 years and older,acute rescue took place for only about 36% of victims, CPR for 20%.
8
D R O W N I N G S
* Includes recreational, occupational & daily living drownings (E910, E830, E832); excludes land & air transport drownings† “Adult” indicates that victim was accompanied by adult(s); does not exclude presence of minor(s) (<18 years);
“Minor” indicates presence of minor(s) only ‡ Falls into water
Source: The Canadian Red Cross Society & the Canadian Surveillance System for Water-Related Fatalities, 2005
Figure 6 DROWNINGS* BY ACCOMPANYING PERSONS† AND ACTIVIT Y, C ANADA 1991-2000 (n=4,671)
0Bathtub Non-aquatic‡ Aquatic Boating Unknown
80
60
40
20
100
Perc
ento
fdro
wni
ngs
UnknownAdultMinorAlone
27
92
07
26356
0%No.
171365
5185145711
50%No.
511128
11600127330
126%No.
683
25
41,229
58452
64%No.
41
67
2981
137
UNKNOWN
ADULT
ALONE
MINOR
59%No.

9
D R O W N I N G S
* Includes recreational, occupational & daily living drownings (E910, E830, E832); excludes land & air transport drownings† “Adult” indicates that victim was accompanied by adult(s); does not exclude presence of minor(s) (<18 years);
“Minor” indicates presence of minor(s) only ‡ Age unknown for 39 victims, presumed adult
Source: The Canadian Red Cross Society & the Canadian Surveillance System for Water-Related Fatalities, 2005
Figure 7 DROWNINGS* BY AGE OF VICTIMS & ACCOMPANYING PERSONS,†
C ANADA 1991-2000 (n=4,671)‡
Adult (n=1,878)
Adult (n=110)
Adult (n=41)
Alone (n=1,669)
Alone (n=71)
Alone (n=246)
Unknown (n=273)Unknown
1% (n=5)
≥15 years (n=3,942)
Minor (n=122)
Minor (n=126)
Minor (n=109)
42%
48%7%
5-14 years (n=328)
6%3%
0-4 years (n=401)
61%
10%27%34%
22%
38%
Unknown (n=21)
* Includes recreational, occupational & daily living drownings (E910, E830, E832); excludes land & air transport drownings† For a potentially survivable victim; excludes extended body searches ‡ Cardiopulmonary resuscitation § Age unknown for 39 victims, presumed adult; 12 with acute rescue only, and 1 with acute rescue and CPR
Source: The Canadian Red Cross Society & the Canadian Surveillance System for Water-Related Fatalities, 2005
Figure 8 PERCENT OF DROWNINGS* WITH ACUTE RESCUE† & WITH RESUSCITATION BY CPR‡
BY AGE, C ANADA 1991-2000 (n=4,671)§
Age group in years
Perc
ento
fdro
wni
ngs
0
100
80
60
40
20
1-4<1 5-14 15-24 25-34 35-44 45-54 55-64 65-74 75+
ACUTE RESCUE
CPR86
72
85
64 69
49 47
21
38
15
37
19
38
21
36
20
34
19
36
22

Non-Drowning Immersion DeathsBoating was the activity most frequently associated with non-drowning immersion deaths,with a majority of these fatalities resulting from collisions and immersion hypothermia(Table 1). Scuba diving and diving head first into water were the most frequent aquaticactivities. Most non-drowning snowmobile immersion deaths resulted from hypothermia.Deaths from falls into water from boats or land as well as deaths involving road vehiclesand aircraft tended to result from head injury, with drowning as a secondary factor due toloss of consciousness.
10
N O N - D R O W N I N G S
No %All activities other than land & air transport 297 81Activity/incident Type of injury‡
Boating 149 50Collision
Boat with another boat Head 22, multiple 14, spine 6; abdominal 1, major lacerations 3, unknown 1 34Boat with fixed object Head 18, multiple 8, spine 3, hepatic rupture 1, blunt trauma 1, 27
aortic transection 1, unknown 2Other collision Head 4, multiple 4, spine 2, blunt trauma 1, major lacerations 1 9
Other incidentsImmersion in cold water Hypothermia 51 51Fell out of boat Head 9, multiple 1, cardiac failure 1, blunt trauma 1, spine 1,
abdominal 1, unknown 3 15Propeller injury Major lacerations 4, head 1, abdominal 1 6
Other Head 2, multiple 2, spine 2, major lacerations 3, chest 1, strangulation 1 7
Aquatic 88 30Diving Head/spine 24, electrocution 1, unknown 6 31Scuba diving Air embolism 35, nitrogen narcosis 3, head 1, multiple 1, 43
asphyxia 1, unknown 3Swimming/playing in water Hypothermia 3, head 2 5Jumping Head 2, spine 2, chest 1, abdominal 1, aortic dissection 1 7Other Major laceration 1, air embolism 1 2
Using bathtub Head 3, hypothermia 1, unknown 1 5 2Non-aquatic 55 19Walking/playing Head 15, multiple 7, spine 2, hypothermia 10 29
near water/on iceFishing/hunting Hypothermia 4, head 1, spine 1, multiple 1 7Cycling Head 1, spine 1, hypothermia 1 3Attempting rescue Head 1, multiple 1 2Gardening Head 2 2Other Head 4, multiple 3, major lacerations 1, hypothermia 1, toxic gas poisoning 1 8Unknown Hypothermia 2, head 1, multiple 1, unknown 1 4
Land & air transport 68 19
Vehicle Type of injury‡
On-road vehicle Head 11, multiple 10, chest 1, hypothermia 1, unknown 5 24Snowmobile Hypothermia 14 14All terrain vehicle Hypothermia 2, blunt trauma 3 5Other off-road vehicle Chest 2, head 1, hypothermia 1, multiple 1 5Aircraft Head 11, multiple 4, hypothermia 2, spine 1, unknown 5 20
Total 365 100
Table 1 WATER-REL ATED INJURY FATALITIES OTHER THAN DROWNINGS,* C ANADA 1991-2000 (n=365)†
* Primary cause of death was injury other than drowning, although drowning may have complicated another injury; in case of hypothermia, only hypothermia deaths reportedly uncomplicated by drowning are included here
† Values in light shaded areas refer to dark shaded totals above; values in unshaded areas refer to light shaded areas above‡ Victims may have sustained more than one type of injury
Source: The Canadian Red Cross Society & the Canadian Surveillance System for Water-Related Fatalities, 2005

11
N E A R D R O W N I N G S
There were 3,526 survivors of hospitalization for near drowning in Canada for the 10-year period from April 1991 to March 2001. (The time period differs slightly, sincehospitalizations are recorded by fiscal year, whereas deaths are recorded by calendar year.)The overall rates of near drowning are much higher among infants and toddlers thanamong older children and adults, and indeed 0-4-year-olds accounted for 31% of allsurvivors of hospitalizations for near drowning (Figure 9).
TRENDS
There was a 29% drop in near drowning rates for both male and female toddlers between1991-1996 and 1996-2001. Comparing Figures 9 and 2, it is evident that for all agescombined, there was a ratio of about 0.75 survivors of hospitalization for near drowningfor each drowning fatality. However, for infants there were about 4 survivors for eachdeath and for toddlers about 2 survivors for each death.
* Includes survivors but not in-hospital deaths, of which there were 451 (252, 199) ‡ This figure covers the 10-year period from April 1, 1991 to March 31, 2001 (data are by fiscal year)
Source: The Canadian Institute for Health Information (CIHI) & Statistics Canada, 2005
Figure 9 RATE AND NUMBER OF HOSPITALIZATIONS FOR NEAR DROWNING* BY AGE & SEX,C ANADA, 1991-2001† (n=3,526)
<10.0
8.5
1-4 5-14 15-24 25-34 35-44 45-54 55-64 65-74 75+
Males 1991-1996 1996-2001
1996-2001
49 329 236 194 170 146 87 63 54 39
Females 1991-1996 39 208 126 62 47 40 24 15 16 1941 238 193 135 108 105 88 38 51 45
35 150 125 28 37 31 37 28 27 23
Age group in years
Nea
rdr
owni
ngs/
100,
000
popu
lati
on/y
ear
Number of near drownings in age group
3.5
4.0
4.5
5.0
5.5
6.0
6.5
7.0
7.5
8.0
3.0
2.5
2.0
1.5
1.0
0.5
MALES 1991-1996 (n=1,367) 1996-2001 (n=1,042)
FEMALES 1991-1996 (n=596)1996-2001 (n=521)
4.70
4.21
3.763.93
3.89
5.86
5.49
2.40
1.87
1.351.27
1.89
1.32 1.301.31
0.63
0.29
0.90
0.37
0.84
0.36
0.250.32
0.39
0.32
0.44 0.480.93
1.15
0.61
0.24 0.30
1.05
1.06
1.25 1.60
0.470.49
1.62
8.29

Boating drownings and other fatalities are discussed only briefly in this report. Becauseboating is the activity most frequently associated with drowning, there are two specialmodular reports dedicated to it. Module 3 offers an overview of boating and a moredetailed look at powered boating; Module 4 deals with unpowered boating.
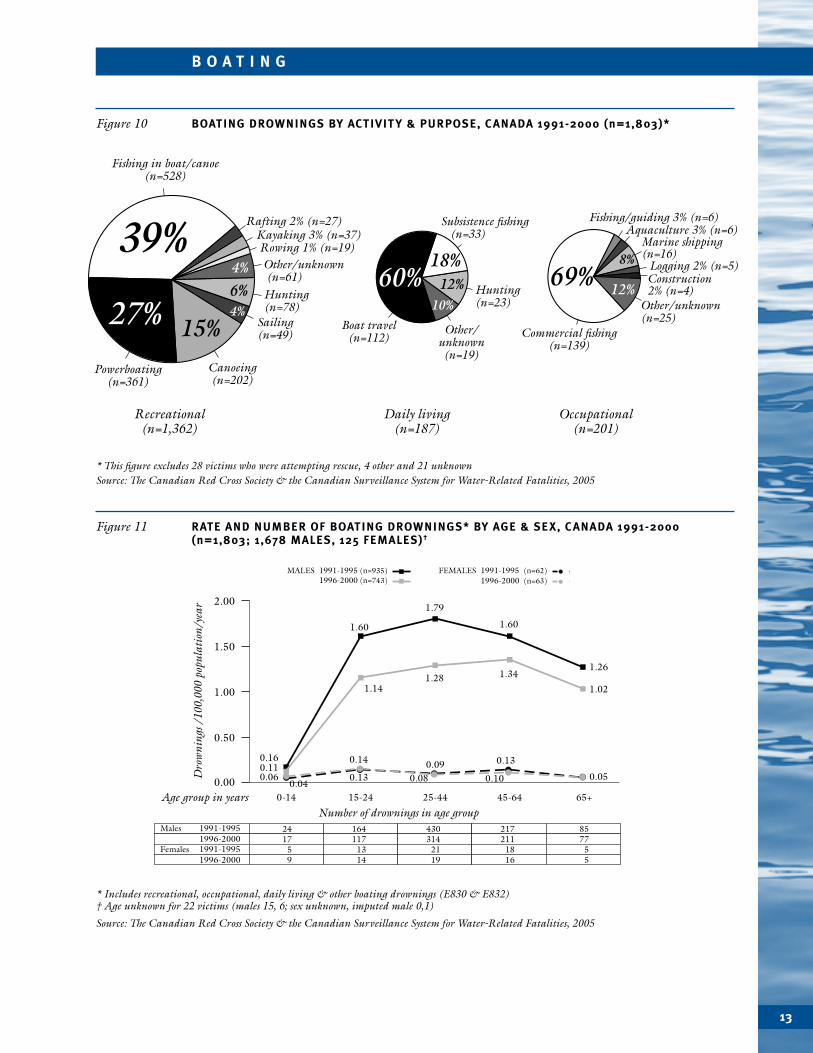
PURPOSE
Recreational boating accounted for 76% of boating incidents, occupational for 11%, daily living or subsistence activities for 10%, rescue for 2% and unknown for 1%.
ACTIVITY
Fishing, powerboating, and canoeing were the activities most often associated withrecreational boating drowning (Figure 10). The most frequent daily living activity wasboat travel, followed by subsistence fishing and hunting. Commercial fishing was the most frequent occupational activity.
PERSONAL RISK FACTORS
AGE AND SEX The vast majority of boating drowning victims were males 15 and older(Figure 10). Males accounted for 93% of all victims, and only 2% of male victims were lessthan 15 years old. For males and females combined, 97% of all victims were 15 and older.
TRENDS
There was a decrease in boating drownings in all age groups of males between 1991-1995 and 1996-2000 (Figure 11). The improvement was about 30% for males less than 45 yearsand 17% for those 45 and older.
EQUIPMENT FACTORS
The most common risk factor for recreational boating drowning during the entire 1990’swas not wearing a flotation device. During 1991-1995 only 12% of victims were reportedto be properly wearing a flotation device, and during 1996-2000, only 11%.
Non-drowning boating fatalities Non-drowning boating fatalities resulted mainly from collisions and immersion hypothermia,as seen in Table 1 (page 10). Unlike for boating drownings, there was no improvement in non-drowning boating fatalities during 1991-2000, suggesting a need for innovativeapproaches to prevention.
Head injuries were reported in 63% of collisions and 60% of falls from boats. Loss ofconsciousness from head injury will generally result in drowning if immersion occurs. This raises the question of whether helmets and restraints such as safety belts should beused for some boating activities such as high-speed travel. Coroners did not report use of this type of safety equipment. Another cause of death was massive hemorrhage frompropeller lacerations, which could be prevented by propeller guards. Again, coroners did not report on this safety equipment.
12
B O A T I N G
13
B O A T I N G
* Includes recreational, occupational, daily living & other boating drownings (E830 & E832)† Age unknown for 22 victims (males 15, 6; sex unknown, imputed male 0,1)
Source: The Canadian Red Cross Society & the Canadian Surveillance System for Water-Related Fatalities, 2005
Figure 11 RATE AND NUMBER OF BOATING DROWNINGS* BY AGE & SEX, C ANADA 1991-2000(n=1,803; 1,678 MALES, 125 FEMALES)†
0.050.08
0.14
0.100.06
Number of drownings in age group0-14 15-24 25-44 45-64 65+Age group in years
Dro
wni
ngs/
100,
000
popu
lati
on/y
ear
0.00
2.00
1.50
1.00
0.50
Males 1991-199517 5
164117
13
430314
21
217211
18
8577
59 14 19 16 5
24
1.14
0.11
1.28 1.34
1.02
0.04
0.130.090.13
0.16
1.60
1.79
1.60
1.26
1996-2000Females 1991-1995
1996-2000
MALES 1991-1995 (n=935)1996-2000 (n=743)
FEMALES 1991-1995 (n=62)1996-2000 (n=63)
* This figure excludes 28 victims who were attempting rescue, 4 other and 21 unknownSource: The Canadian Red Cross Society & the Canadian Surveillance System for Water-Related Fatalities, 2005
Figure 10 BOATING DROWNINGS BY ACTIVIT Y & PURPOSE, C ANADA 1991-2000 (n=1,803)*
Fishing in boat/canoe (n=528)
Commercial fishing (n=139)
Fishing/guiding 3% (n=6)Aquaculture 3% (n=6)
Marine shipping (n=16)
Logging 2% (n=5)Construction 2% (n=4)
Powerboating (n=361)
Canoeing (n=202)
Hunting (n=78)
Hunting (n=23)
Sailing (n=49)
Other/unknown (n=61)
Kayaking 3% (n=37)Rowing 1% (n=19)
Rafting 2% (n=27)
Other/unknown (n=25)
Occupational (n=201)
Daily living (n=187)
Recreational (n=1,362)
39%Subsistence fishing (n=33)
Boat travel (n=112)
Other/ unknown (n=19)
15%4%6%4%
27%69%
18%12% 12%
8%
10%
60%

PURPOSE
Recreational activities accounted for 92% of aquatic drownings, followed by rescue 4%,occupational 2%, daily living 1%, and other or unknown 2% (Annex 1a).
ACTIVITY
Most recreational aquatic drownings resulted from swimming, followed by playing orwading in water (Figure 12a). For certain activities, including scuba diving and diving into water, more deaths occurred from non-drowning injuries such as air embolism and head or spinal injuries than from drowning (Table 1, page 10). Hence scuba divingaccounted for 6% of all aquatic deaths and diving for 5%.
TRENDS
There was a significant improvement in swimming and playing or wading drowningsbetween 1991-1995 and 1996-2000 (Figure 12b). For swimming, most male age groupsshowed a reduction of about 25-30%, although in the highest risk group of 15-24-year-olds the decrease was only 14%. For other less frequent activities such as scuba diving,there was no improvement. For hot tubs, there was a 73% increase.
PERSONAL RISK FACTORS
AGE AND SEX Males accounted for 86% of swimming drowning victims. Most victims werebetween 5 and 44 years of age, with the highest rate in 15-24-year-olds (Figure 13).
14
A Q U A T I C A C T I V I T I E S
Figure 12a RECREATIONAL AQUATIC DROWNINGS BY ACTIVIT Y, C ANADA 1991-2000 (N=1,088)
Swimming* (n=747)
Playing/wading in water (n=168)
Diving/jumping (n=28)
Scuba diving (n=36)
Fishing from shore 1% (n=12)Fishing in water (n=24)
Other/unknown (n=34)
Hot tub (n=39)
15%3%3%2%
4%3%69%
* This category includes victims ≥5 yearsSource: The Canadian Red Cross Society & the Canadian Surveillance System for Water-Related Fatalities, 2005

15
A Q U A T I C A C T I V I T I E S
* This category includes victims ≥5 yearsSource: The Canadian Red Cross Society & the Canadian Surveillance System for Water-Related Fatalities, 2005
Figure 12b RATE OF RECREATIONAL AQUATIC DROWNINGS BY ACTIVIT Y, C ANADA 1991-2000 (n=1,088)
Swimming* (n=409) (n=338)
Playing/wading (n=107) in water (n=61)
Diving/jumping (n=10) (n=18)
Scuba diving (n=17) (n=19)
Fishing from shore (n=8) (n=4)
Activity
0.00 0.200.150.100.05 0.25 0.30
1991-1995 (n=584) 1996-2000 (n=504)
Other/unknown (n=13) (n=21)
Fishing in water (n=9) (n=15)
Hot tub (n=11)
(n=28)
0.007
0.012
0.006
0.076
0.009
0.006
0.008
0.292
0.041
0.228
0.012
0.013
0.003
0.014
0.010
0.019
Drownings/100,000 population/year
Source: The Canadian Red Cross Society & the Canadian Surveillance System for Water-Related Fatalities, 2005
Figure 13 RATE AND NUMBER OF RECREATIONAL SWIMMING DROWNINGS BY AGE & SEX, C ANADA 1991-2000 (VICTIMS ≥5 YEARS OF AGE; n=747; 643 MALES, 104 FEMALES)
0.0
1.2
5-14 15-24 25-34 35-44 45-54 55-64 65-74 75+
Males 1991-1995
Females 1991-19951996-2000
1996-2000
46 118 77 57 28 15 7 7
11 9 8 4 8 6 5 334 102 54 38 29 11 11 9
10 9 5 8 9 5 1 3
Age group in years
Dro
wni
ngs/
100,
000
popu
lati
on/y
ear
Number of drownings in age group
1.1
1.0
0.9
0.8
0.7
0.6
0.5
0.4
0.3
0.2
0.10.12 0.09 0.06 0.11 0.10 0.09 0.07
0.04
0.99
0.33
0.30 0.310.18
0.230.32
0.45
0.16
0.47
1.15
0.600.51
0.37
0.25 0.29
0.10 0.040.06
0.09 0.08 0.060.02
MALES 1991-1995 (n=355)1996-2000 (n=288)
FEMALES 1991-1995 (n=54)1996-2000 (n=50)

ALCOHOL Alcohol was associated with at least 44% of swimming drownings of victims 15and older, and in most of these incidents the blood alcohol level was very high, well abovethe legal limit for driving a car or operating a boat (Figure 14). Alcohol was much morefrequent in older swimming victims than 15-24-year-olds (Figure 15).
16
A Q U A T I C A C T I V I T I E S
* Legal limit is 80 mg % † This figure excludes 16 victims; decomposition rendered blood alcohol unreliable ‡ 22 at 1-49 mg %, 10 at 50-80 mg %, & 1 unspecified
Source: The Canadian Red Cross Society & the Canadian Surveillance System for Water-Related Fatalities, 2005
Figure 14 BLOOD ALCOHOL LEVELS* FOR RECREATIONAL SWIMMING DROWNINGS, C ANADA 1991-2000 (VICTIMS ≥15 YEARS OF AGE; n=646)†
34%
5% 5%
34%
22%
>300 mg % (n=43)
151-200 mg % (n=34)
201-250 mg % (n=54)
Above limit(n=212)
No alcohol(n=214)
Below limit‡
(n=33)
Unknown(n=138)
Alcohol suspected2% (n=33)
20%
24%
25%
16 %101-150 mg % (n=19)81-100 mg % 4% (n=9)Unspecified 1% (n=3 )
9%
251-300 mg % (n=50)
* Legal limit is 80 mg % † This figure excludes 16 victims (8 15-24 years; 8 ≥25 years); decomposition rendered blood alcohol unreliable‡ 11 at 1-49 mg %, 3 at 50-80 mg % § 11 at 1-49 mg %, 7 at 50-80 mg %, and 1 unspecified
Source: The Canadian Red Cross Society & the Canadian Surveillance System for Water-Related Fatalities, 2005
Figure 15 BLOOD ALCOHOL LEVELS* FOR RECREATIONAL SWIMMING DROWNINGS BY AGE, C ANADA 1991-2000 (VICTIMS ≥15 YEARS OF AGE; n=646)†
19%
46%
6%5%
25%Above limit
(n=43)
No alcohol(n=105)
Below limit‡
(n=14)Alcohol suspected(n=11)
Alcohol suspected(n=22)
Unknown(n=57)
42%27%
20% Above limit(n=169)
No alcohol(n=109)
Below limit§
(n=19)
Unknown(n=81)
15-24 years(n=238)
≥25 years(n=408)
6% 5%

ENVIRONMENTAL FACTORS
TRENDS BY REGION In the first half of the 1990’s, swimming drowning rates were similaracross Canada, with the exception of a higher rate in British Columbia (Figure 16). There was a 21% decrease in the swimming drowning rate in Canada between 1991-1995and 1996-2000. The largest regional decrease, 40%, occurred in British Columbia. TheAtlantic and Prairie regions experienced no significant improvement. Hence for the secondhalf of the 1990’s, rates were relatively similar across the entire country.
BODY OF WATER BY REGION Lakes, rivers, and swimming pools were the most frequent bodiesof water for swimming drownings in Canada, with the exception of the Atlantic regionwhere the ocean was more frequent than pools (Figure 17). The pattern varied by region.Flatter regions showed lakes as the leading site. Rivers were more frequent in mountainousregions with fast flowing rivers, including Quebec, British Columbia, and the northernterritories. Swimming pools were a relatively frequent site across the country.
17
A Q U A T I C A C T I V I T I E S
Source: The Canadian Red Cross Society & the Canadian Surveillance System for Water-Related Fatalities, 2005
Figure 16 RATE OF RECREATIONAL SWIMMING DROWNINGS BY REGION, C ANADA 1991-2000 (n=747)
Quebec (n=94) (n=81)
Atlantic (n=30) (n=34)
Ontario (n=149) (n=114)
Prairies (n=61) (n=58)
B. C. (n=70) (n=48)
Canada (n=409) (n=338)
Region
0.0 0.1 0.2 0.3 0.4 0.6 1.1
1991-1995 1996-2000
0.11
Territories (n=5) (n=3)
0.05
0.29
0.22
0.21
0.24
0.25
0.23
0.26
0.42
0.29
0.25
0.27
0.29
Drownings/100,000 population/year
0.601.11

18
A Q U A T I C A C T I V I T I E S
*“Lake” includes pond & reservoirSource: The Canadian Red Cross Society & the Canadian Surveillance System for Water-Related Fatalities, 2005
Figure 17 RECREATIONAL SWIMMING DROWNINGS BY REGION & T YPE OF BODY OF WATER,* C ANADA 1991-2000 (n=747)
River (n=57)
Lake (n=130)
Swimming pool (n=44)
Ontario (n=263)
River (n=43)
Lake (n=51)
Swimming pool (n=20)
Prairies (n=119)
B.C. (n=118)
Territories (n=9)
River (n=78)
Lake (n=53)
Swimming pool (n=36)
Quebec (n=174)
Swimming pool 2% (n=6)
Other/Unknown 2% (n=1)
Other/Unknown (n=31)
Other/Unknown (n=6)
Other/Unknown (n=5)
Ocean 1% (n=1)
River (n=19)
Lake (n=25)
Ocean (n=13)
Ocean <1% (n=1)
Atlantic (n=64)
49% 43%
36%22%
12%4%
30%3%
39%
30% 45%
20%
17%17%
21%
River (n=51)
Lake (n=37)
Swimming pool (n=17)
Other/Unknown 2% (n=2)
Ocean (n=11)
31%
43%14%
9%
9%
Other/Unknown (n=1)
River (n=5)
Lake (n=2)
Ocean (n=1) 11%
11%
56%
22%

The most frequent bodies of water for drownings from falls into water were rivers, lakes,and home swimming pools (Figure 18). Most of the victims of falls into home pools were 1-4 year old toddlers; pool drowning is described in the next section.
TRENDS
There were significant reductions in the number of incidents in rivers and lakes between1991-1995 and 1996-2000 (Figure 18).
19
N O N - A Q U A T I C A C T I V I T I E S
* Recreation includes adult leisure activities and children’s play; daily living includes activities such as non-recreational travel by foot †“Lake” includes pond & reservoir
Source: The Canadian Red Cross Society & the Canadian Surveillance System for Water-Related Fatalities, 2005
Figure 18 DROWNINGS FROM FALLS INTO WATER DURING NON-AQUATIC ACTIVITIES BY PURPOSE OF ACTIVIT Y* & T YPE OF BODY OF WATER,† C ANADA 1991-2000 (n=1,091)
0
River 1991-1995
Body of water
50 100 150 200 250
Number of drownings
RECREATIONAL
DAILY LIVING
OTHER/UNKNOWN
Purpose of activity
RESCUE
OCCUPATIONAL
1996-2000
Lake 1991-1995
1996-2000
Ocean 1991-1995
1996-2000
Canal 1991-1995
1996-2000
Sewage lagoon 1991-1995
1996-2000
Ditch 1991-1995
1996-2000
Home swimming pool 1991-1995
1996-2000
Other pool 1991-1995
1996-2000
Other/unknown 1991-1995
1996-2000

20
N O N - A Q U A T I C A C T I V I T I E S
* There were 4 infant (<1 year) deaths from falls into water † “Lake” includes pond & reservoir
Source: The Canadian Red Cross Society & the Canadian Surveillance System for Water-Related Fatalities, 2005
Figure 19 DROWNINGS FROM FALLS INTO WATER OTHER THAN SWIMMING POOLS DURING NON-AQUATIC RECREATIONAL ACTIVITIES BY AGE* & T YPE OF BODY OF WATER,†
C ANADA 1991-2000 (n=606)
Lake (n=27) Lake
(n=114)
River (n=46)
Other/ unknown (n=12)
Other/unknown 3% (n=10)
Ditch 2% (n=7)
Ocean (n=38)
Ocean (n=6)
Canal 3% (n=9)
River (n=162)
1-4 years (n=167)
5-14 years (n=95)
≥15 years (n=340)
44%
11%
34%28%
6%4%13%
48% 48%
Lake (n=86)
River (n=44)
Other/unknown
(n=24)
Hot tub 2% (n=4)Sewage lagoon 4% (n=6)
Sewage lagoon (n=4)
Ocean 2% (n=3)
51%
26%14%
Considering non-pool incidents by age, lakes accounted for about half of drownings fromfalls into water for toddlers, and rivers for about half of these drownings for victims 5 andolder (Figure 19). Current was probably a major contributing factor for river drownings.

There are several hazardous environments and vulnerable groups for drowning in Canada.In the built environment, the home is a key location for avoidable drownings of twovulnerable groups. The two main drowning hazards in homes are swimming pools andbathtubs. The two main vulnerable groups for home drowning are infants and toddlers 0-4 years old and persons with epilepsy 15 years and older.
Another vulnerable group for drowning is aboriginal peoples, discussed in detail inModule 6. Drownings of aboriginals — both children and adults — tend to take place in the natural environment rather than in the built environment.
Swimming Pool DrowningsMost swimming pool drownings occurred in single-unit home pools (Figure 20). Of these,50% involved 1-4 year old toddlers (Figure 21), nearly all in pools with inadequate safetygates. In only 5% (n=6/121) of these toddler pool drownings was the pool reported to beequipped with an automatic self-closing and self-latching gate. In 26% (n=32), the gate waseither self-closing or self-latching, in 19% (n=23) of unknown type, in 15% (n=18) no gatewas present, and in 35% (n=42), there was no information in the coroner or police filesabout the gate.
TRENDS
Between 1991-1995 and 1996-2000 there was a decrease in home pool drownings of 71%for female toddlers and 30% for male toddlers (Figure 21). There was no improvement for those 5 and older, for whom risk factors included limited swimming ability, alcohol,epilepsy, and other medical conditions.
21
H I G H - R I S K E N V I R O N M E N T S A N D G R O U P S
* Pool at an apartment buildingSource: The Canadian Red Cross Society & the Canadian Surveillance System for Water-Related Fatalities, 2005
Figure 20 SWIMMING POOL DROWNINGS BY T YPE OF POOL, C ANADA 1991-2000 (n=332)
Multiple-unit home pool* (n=16)
Municipal pool (n=20)Hotel/motel pool (n=11)
Non-residential private pool (n=11)
Other public pool (n=33)
In-ground pool (n=63)
Unspecified pool (n=128)
Above-ground pool (n=50)
73%
21%
3%3%
6%
5%
10%53%
26 %
Single-unit home pool (n=241)

Infant and Toddler Drownings Nearly all drownings of infants less than 1 year old occurred in adult-size home bathtubsduring momentary inattention by a parent or supervision by another child. The mostfrequent location for drownings of 1-4-year-old toddlers was home swimming pools,followed by lakes, rivers, and for 1-2-year-olds, bathtubs (Figure 22).
ETHNICITY
Aboriginal toddlers had high drowning rates, and were more likely to drown in naturalbodies of water such as lakes and rivers, due to proximity of homes to such hazards.Refer to Module 6 for more information on aboriginal drownings.
TODDLER POOL DROWNINGS
The most frequent type of home pool for toddler drownings was above-ground. These areinexpensive and often joined to the living area of the home by a patio-terrace, which makesthem dangerously accessible to toddlers. Quebec, with approximately 24% of Canada’spopulation, accounted for 47% of toddler pool drownings.
TRENDS
There was a 40% decrease in home pool toddler drownings between 1991-1995 and1996-2000, with improvements in all regions, including Quebec (Figure 23).
22
H I G H - R I S K E N V I R O N M E N T S A N D G R O U P S
* Sex unknown for 2 victims, imputed male (2,0)Source: The Canadian Red Cross Society & the Canadian Surveillance System for Water-Related Fatalities, 2005
Figure 21 RATE AND NUMBER OF SINGLE-UNIT HOME POOL DROWNINGS BY AGE & SEX, C ANADA 1991-2000 (n=241)*
<10.00
0.80
1-4 5-14 15-24 25-34 35-44 45-54 55-64 65-74 75+
Males 1991-1995 1996-2000
1996-2000
0 45 9 4 8 6 3 7 7 0
Females 1991-1995 1 30 3 1 0 0 3 1 2 20 36 7 6 3 3 4 6 8 9
0 10 4 2 1 1 5 3 1 0
Age group in years
Dro
wni
ngs/
100,
000
popu
lati
on/y
ear
Number of drownings in age group
0.00
0.100.090.07
0.040.03
0.26
0.040.06
0.030.06
1.13
0.89
0.79
0.70
0.60
0.50
0.40
0.30
1.20
1.10
1.00
0.90
0.20
0.10
MALES 1991-1995 (n=89) 1996-2000 (n=82)
FEMALES 1991-1995 (n=43)1996-2000 (n=27)
0.01 0.00
0.02
0.04
0.050.10
0.120.17
0.04
0.16
0.32
0.050.000.02 0.02
0.050.05
0.01 0.000.01 0.02

23
H I G H - R I S K E N V I R O N M E N T S A N D G R O U P S
* Toddlers are 1-4 years old Source: The Canadian Red Cross Society & the Canadian Surveillance System for Water-Related Fatalities, 2005
Figure 23 RATE AND NUMBER OF SINGLE-UNIT HOME SWIMMING POOL TODDLER* DROWNINGS BY REGION, C ANADA 1991-2000 (n=121)
Quebec (n=35) (n=22)
Atlantic (n=3) (n=1)
Ontario (n=26) (n=19)
Prairies (n=4) (n=1)
B. C. (n=7) (n=3)
Canada (n=75) (n=46)
Region
0.00 0. 25 0.50 0.75 1.00 1. 25 1.50 1.75 2.00
1991-1995 1996-2000
Territories (n=0) (n=0)
0.05
0.17
0.07
1.18
0.62
0.000.00
0.31
0.27
0.77
0.97
0.48
1.96
0.90
Drownings/100,000 toddlers/year
0.58
* Infants are <1 year old; toddlers are 1-4 years old † Excludes land & air transport drownings ‡ “Lake” includes pond & reservoir § Including pail 4, multiple-unit home pool 3, cistern 3, ditch 3, pit 3, toilet 2, water trough 2, rut 2, sump hole 2,
& 1 each of non-residential private pool, canal, septic tank, duck pond, lumber conditioning plant, & garbage canSource: The Canadian Red Cross Society & the Canadian Surveillance System for Water-Related Fatalities, 2005
Figure 22 INFANT AND TODDLER* DROWNINGS† BY T YPE OF BODY OF WATER,‡
C ANADA 1991-2000 (n=401)
Bathtub (n=58)
Lake (n=110)
River (n=56)
Hot tub 2% (n=8)Sewage lagoon 1% (n=6)
Ocean (n=11)
Other§ (n=30)
Unspecified pool (n=58)
Above-ground pool (n=38)
In-ground pool (n=26)
Type of poolType of body of water
31 %
48 %
21 %
30%27%
7%
14%
3%
14%
Single-unit home pool (n=122)
Bathtub Drownings
PERSONAL RISK FACTORS
AGE AND SEX Infants and toddlers 0-4 years old accounted for 15% of all bathtub drowningvictims, and 5-14-year-olds for only 4% (Figure 22, Annexes 1a, 3). Bathing was onewater-related activity where the rate of female drownings exceeded that of males, with58% of victims being female (Figure 24). Although in the first half of the 1990’s rates were especially high among female toddlers, these rates fell dramatically during 1996-2000.
ALCOHOL There was a large difference in blood alcohol levels between victims with andwithout epilepsy. For persons without epilepsy, alcohol was present or suspected in 30% of those 15 years and older, and above the legal limit of 80 mg % for driving a car in24% of cases. For those above the limit, 88% had levels higher than 150 mg %, with manyof them much higher. Levels were considerably lower for persons with epilepsy. Only 6%of victims 15 and older had any alcohol detectable in the blood, and of these, only half,3% of all persons 15 and older with epilepsy, had levels above the limit.
HEALTH CONDITIONS Among victims 15 years of age and older, there were several healthconditions that tended to affect the level of consciousness and predispose an individualbathing alone to drowning in a bathtub (Figure 25). Epilepsy was the most frequent,followed by other neurological conditions, mental illness, alcoholism, and cardiac illness.
For all ages, 28% of bathtub drownings occurred in people with epilepsy. By age group, for 0-4 year olds, 8% of bathtub drownings occurred in children with epilepsy, for 5-14year olds, 58%, for 15-54 year olds, 58%, and for 55 years and older, 8%. Hence, except forthe two extremes of age where other factors were predominant, epilepsy accounted for themajority, nearly 60%, of bathtub drownings.
SUPERVISION Of the 25 infants less than 1 year old without epilepsy who drowned inbathtubs, only 12% (n=3) were with an adult, while 56% (n=14) were with a minor childless than 15 years old and 32% (n=8) were alone. Of 32 toddlers 1-4 years old withoutepilepsy, only 3% (n=1) was with an adult, 31% (n=10) were with a minor child, and 66%(n=21) were alone. Of 6 children 5-14 years old without epilepsy who drowned inbathtubs, 100% were alone. There were no infants with epilepsy who drowned in bathtubs.Of the 2 cases of toddlers with epilepsy who drowned in bathtubs, both were alone, whilefor 8 children 5-14 years old with epilepsy who drowned in a bathtub, 12% (n=1) werewith an adult and 88% (n=7) alone.
IMPLICATIONS FOR PREVENTION From the above, it is clear that about 60% of bathtubdrownings among 5-54-year-olds were people with epilepsy, with alcohol rarely a factor.For this group, the major means of prevention is use of a shower rather than bathing aloneimmersed in a tub. For other victims 15-54 years old, most incidents involved high levelsof alcohol and/or other drugs, suggesting the need to increase awareness in the generalpublic of the hazards of bathing after consuming alcohol and/or other drugs. For 0-4 yearolds, constant adult supervision of toddlers and use of infant bathtubs for bathing infantswould be the major implications of the data. For bathers 55 and older, the risk ofdrowning is affected by a mix of personal risk factors including alcohol and chronic healthconditions associated with advancing age, poor diet, lack of exercise, and smoking.
TRENDS
There was a 26% improvement in the overall number of bathtub drownings between1991-95 and 1996-2000 (Annex 1c). The greatest improvement in bathtub drowningrates were seen among 0-4-year-old and 25-74-year-old females (Figure 24), with a 52%drop in the number of bathtub drownings for both of these groups. On the other hand,although the numbers are small, there were increases of 150% among 1-4-year-old malesand 129% among 15-24-year-old females.
24
H I G H - R I S K E N V I R O N M E N T S A N D G R O U P S

25
H I G H - R I S K E N V I R O N M E N T S A N D G R O U P S
* Includes conditions with possible effect on consciousness, alertness, or balance; victims may suffer from more than one conditionSource: The Canadian Red Cross Society & the Canadian Surveillance System for Water-Related Fatalities, 2005
Figure 25 HEALTH CONDITIONS* OF VICTIMS OF BATHTUB DROWNINGS, C ANADA 1991-2000(VICTIMS ≥15 YEARS OF AGE; n=316)
Number of drownings
Epilepsy
Alcoholism
Mental illness
Neurological illness
Cardiac illness
Other
0 10 20 30 40 50 60
Health condition
6051
3220
2529
4435
2928
3449
1991-1995 1996-2000
* Sex unknown for 1 victim ≥75 years old, imputed female (1,0)Source: The Canadian Red Cross Society & the Canadian Surveillance System for Water-Related Fatalities, 2005
Figure 24 RATE AND NUMBER OF BATHTUB DROWNINGS BY AGE & SEX, C ANADA 1991-2000 (n=389; 163 MALES, 226 FEMALES)*
<10.00
1-4 5-14 15-24 25-34 35-44 45-54 55-64 65-74 75+
1991-1995MALES 1996-2000
1996-2000
5 4 2 11 13 15 10 6 16 6
1991-1995FEMALES 12 13 4 7 15 18 16 11 19 203 10 3 4 10 16 12 5 5 7
5 7 5 16 3 10 8 8 9 19
Age group in years
Dea
ths/
100,
000
popu
lati
on/y
ear
Number of deaths in age group
1.40
1.20
1.00
0.80
0.60
0.40
0.20
1991-1995 (n=88)MALES 1996-2000 (n=75)
1991-1995 (n=136)FEMALES1996-2000 (n=90)
0.480.54
1.21
0.310.34
0.25
0.020.030.040.05
0.100.12
0.040.070.110.16
0.08 0.08 0.10 0.10
0.160.36
0.37
0.120.18
0.080.13
0.160.13
0.21
0.100.18
0.25
0.490.41
0.030.08
26
H I G H - R I S K E N V I R O N M E N T S A N D G R O U P S
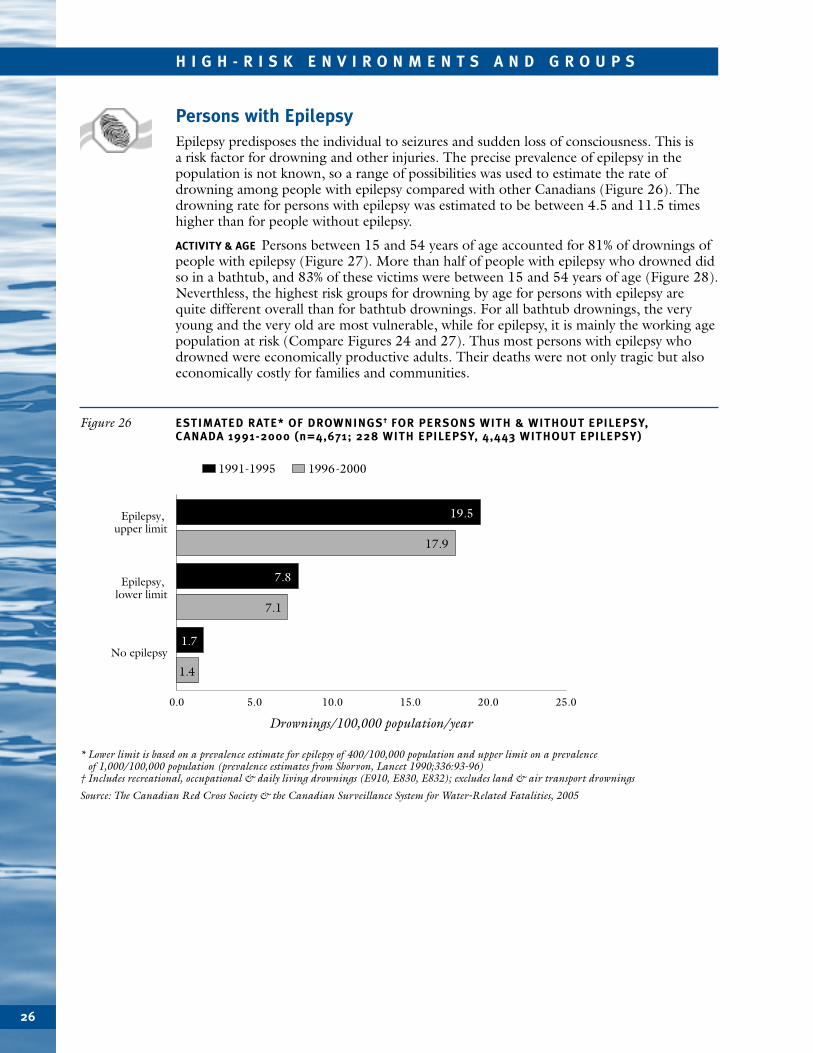
* Lower limit is based on a prevalence estimate for epilepsy of 400/100,000 population and upper limit on a prevalence of 1,000/100,000 population (prevalence estimates from Shorvon, Lancet 1990;336:93-96)
† Includes recreational, occupational & daily living drownings (E910, E830, E832); excludes land & air transport drownings
Source: The Canadian Red Cross Society & the Canadian Surveillance System for Water-Related Fatalities, 2005
Figure 26 ESTIMATED RATE* OF DROWNINGS† FOR PERSONS WITH & WITHOUT EPILEPSY, C ANADA 1991-2000 (n=4,671; 228 WITH EPILEPSY, 4,443 WITHOUT EPILEPSY)
Epilepsy, upper limit
Drownings/100,000 population/year
19.5
Epilepsy, lower limit
No epilepsy
17.9
7.8
7.1
1.7
1.4
0.0 5.0 10.0 15.0 20.0 25.0
1991-1995 1996-2000
Persons with EpilepsyEpilepsy predisposes the individual to seizures and sudden loss of consciousness. This is a risk factor for drowning and other injuries. The precise prevalence of epilepsy in thepopulation is not known, so a range of possibilities was used to estimate the rate ofdrowning among people with epilepsy compared with other Canadians (Figure 26). Thedrowning rate for persons with epilepsy was estimated to be between 4.5 and 11.5 timeshigher than for people without epilepsy.
ACTIVITY & AGE Persons between 15 and 54 years of age accounted for 81% of drownings ofpeople with epilepsy (Figure 27). More than half of people with epilepsy who drowned didso in a bathtub, and 83% of these victims were between 15 and 54 years of age (Figure 28).Neverthless, the highest risk groups for drowning by age for persons with epilepsy arequite different overall than for bathtub drownings. For all bathtub drownings, the veryyoung and the very old are most vulnerable, while for epilepsy, it is mainly the working agepopulation at risk (Compare Figures 24 and 27). Thus most persons with epilepsy whodrowned were economically productive adults. Their deaths were not only tragic but alsoeconomically costly for families and communities.

27
H I G H - R I S K E N V I R O N M E N T S A N D G R O U P S
* Includes recreational, occupational & daily living drownings (E910, E830, E832); excludes land & air transport drownings† At least 182 drownings occurred during seizures; seizure was not reported for the other 46 ‡ Includes fishing from boat§ Including hunting 3, 2 each of using hot tub, cleaning pool, gardening, 1 each of partying, sitting on float, sitting on bridge,
mowing lawn, cleaning caribou, & unknown 6
Source: The Canadian Red Cross Society & the Canadian Surveillance System for Water-Related Fatalities, 2005
Figure 28 DROWNINGS* OF PERSONS WITH EPILEPSY BY ACTIVIT Y, C ANADA 1991-2000 (n=228)†
Swimming (n=33)
Playing/walking near water (n=17)
Playing/wading in water (n=10)
Other§
(n=20)
Fishing from shore/ in water(n=9 )
Boating‡ (n=18)
Activity Age group
Using bathtub (n=121)
45-54 years (n=19)
>55 years (n=10)
35-44 years (n=29)
25-34 years (n=24)
15-24 years (n=29)
20 %
16 %
8%
24 %
5-14 years (n=8)1-4 years 2% (n=2)
24 %
53%
14%
8%
7%
9%
4%4%
7%
Source: The Canadian Red Cross Society & the Canadian Surveillance System for Water-Related Fatalities, 2005
Figure 27 RATE AND NUMBER OF DROWNINGS OF PERSONS WITH EPILEPSY BY AGE & SEX, C ANADA 1991-2000 (n=228; 141 MALES, 87 FEMALES)
<10.00
1-4 5-14 15-24 25-34 35-44 45-54 55-64 65-74 75+
1991-1995MALES 1996-2000
1996-2000
0 1 6 12 20 19 6 5 2 0
1991-1995FEMALES 0 2 2 8 11 10 11 1 1 20 0 4 14 13 17 14 3 3 2
0 0 4 14 2 8 5 2 3 1
Age group in years
Dea
ths/
100,
000
popu
lati
on/y
ear
Number of deaths in age group
0.20
0.15
0.10
0.05
1991-1995 (n=71)MALES 1996-2000 (n=70)
1991-1995 (n=48)FEMALES1996-2000 (n=39)
0.00 0.00
0.03
0.02
0.04
0.06 0.08
0.02
0.09 0.09
0.14
0.17
0.060.05
0.050.05
0.06
0.08
0.03
0.02 0.02
0.08
0.15
0.11
0.16
0.12
0.14
0.05
0.00
0.02
0.05
0.07

28
S N O W M O B I L I N G
Snowmobile immersion deaths are discussed only briefly here; they are described in greaterdetail in Module 2. There were 232 snowmobile drownings reported in Canada during1991-2000; hypothermia would have been a factor in many of these deaths. There wereanother 14 snowmobile immersion deaths; these victims died of hypothermia withoutdrowning. (We do not report on other causes of death, such as crashes.) Most incidentsoccurred in the dark, at high speed. The snowmobiler may have encountered an open holein the ice — or in Newfoundland, the open sea — but was unable to stop quickly enough.
PERSONAL RISK FACTORS
AGE AND SEX Males 15-74 years old were the main risk group for snowmobile drowning(Figure 29). Many victims were aboriginals, who often use snowmobiles for daily travel and subsistence activities.
ALCOHOL Alcohol was associated with at least 60% of snowmobile drownings, and probablymore (Figure 30). In many of these cases, the level of blood alcohol was very high, wellabove the legal limit for driving a car of 80 mg %.
ENVIRONMENTAL RISK FACTORS
REGION The highest rates of snowmobile drowning were seen in the northern territoriesand the Atlantic provinces, followed by Ontario, Quebec and the Prairies (Figure 31). Less than 1% of snowmobile drownings occurred in British Columbia.
TRENDS
Although Quebec showed a small increase in the number of snowmobile drowningsbetween 1991-1995 and 1996-2000, most other regions showed a significant decrease. If we include hypothermia deaths, which increased over the same period, the overallreduction in snowmobile immersion deaths in Canada was 24%.
* Included recreational 168 (93, 75), daily living 53 (37, 16), occupational 7 (4, 3), attempting rescue 2 (1, 1), & unknown 2 (2, 0)† There were 14 additional snowmobile immersion deaths from hypothermia without drowning (3, 11) ‡ Age unknown for 1 male victim (1, 0)
Source: The Canadian Red Cross Society & the Canadian Surveillance System for Water-Related Fatalities, 2005
Figure 29 RATE AND NUMBER OF SNOWMOBILE DROWNINGS BY AGE & SEX, C ANADA 1991-2000 (n=232)*†‡
<10.00
0.40
1-4 5-14 15-24 25-34 35-44 45-54 55-64 65-74 75+
Males 1991-1995 1996-2000
1996-2000
0 1 3 25 44 23 13 10 7 0
Females 1991-1995 0 0 0 5 3 0 0 0 2 00 0 4 18 28 20 8 6 5 1
0 1 0 1 1 1 1 0 0 0
Age group in years
Dro
wni
ngs/
100,
000
popu
lati
on/y
ear
Number of drownings in age group
0.00
0.03
0.00
0.35
0.30
0.25
0.20
0.15
0.10
0.05
MALES 1991-1995 (n=127) 1996-2000 (n=90)
FEMALES 1991-1995 (n=10)1996-2000 (n=5)
0.040.04
0.100.10
0.000.00
0.030.04
0.24
0.34
0.23
0.21
0.17
0.17 0.17 0.16
0.08
0.16
0.05
0.020.010.01 0.00
0.010.00
0.01 0.00 0.00

29
S N O W M O B I L I N G
* Legal limit is 80 mg % † This figure excludes 8 victims; decomposition rendered blood alcohol unreliable ‡ 14 at 1-49 mg %, 12 at 50-80 mg %, & 1 unspecified
Source: The Canadian Red Cross Society & the Canadian Surveillance System for Water-Related Fatalities, 2005
Figure 30 BLOOD ALCOHOL LEVELS* FOR SNOWMOBILE DROWNINGS, C ANADA 1991-2000 (VICTIMS ≥15 YEARS OF AGE; n=223)†
>300 mg % (n=4)
251-300 mg % (n=9)
201-250 mg % (n=17)
151-200 mg % (n=27)
81-100 mg % (n=5)
101-150 mg % (n=19)
Below limit¶
(n=27)
Unknown(n=41)
Alcohol suspected(n=19)
9% 13%
19%33%
23%
21%
11%
6%
5%
No alcohol (n=47)
22% 38%Above limit (n=81)
Source: The Canadian Red Cross Society & the Canadian Surveillance System for Water-Related Fatalities, 2005
Figure 31 RATE AND NUMBER OF SNOWMOBILE DROWNINGS BY REGION, C ANADA 1991-2000 (n=232)
Quebec (n=19) (n=22)
Atlantic (n=26) (n=15)
Ontario (n=58) (n=41)
Prairies (n=22) (n=11)
B. C. (n=1) (n=1)
Canada (n=137) (n=95)
Region
0.0 0.05 0.10 0.15 0.250.20 1.0 2.45
1991-1995 1996-2000
0.11
Territories (n=11) (n=5)
0.13
0.06
0.07
0.04
0.01
0.06
0.09
0.01
0.10
0.22
0.05
0.11
Drownings/100,000 population/year
1.002.45

30
R O A D T R A F F I C
Drowning in on-road vehicles such as cars and trucks occurred mainly when vehicles went off the road into water. In Quebec and British Columbia, which have more rivers, a proportion of such incidents occurred when a vehicle went off a bridge. Inadequate or absent barriers to contain a skidding vehicle was a factor in some incidents.
TRENDS
British Columbia, with a reduction of 48%, was the only region that experienced asignificant improvement in road traffic drownings between 1991-1995 and 1996-2000.In contrast, the northern territories saw an increase (Figure 32).
Source: The Canadian Red Cross Society & the Canadian Surveillance System for Water-Related Fatalities, 2005
Figure 32 RATE AND NUMBER OF ROAD TRAFFIC DROWNINGS BY REGION, C ANADA 1991-2000 (n=510)
Quebec (n=60) (n=53)
Atlantic (n=31) (n=35)
Ontario (n=52) (n=49)
Prairies (n=25) (n=29)
B. C. (n=99) (n=61)
Canada (n=272) (n=238)
Region
0.0 0.10 0.20 0.30 0.40 0.50 0.60 1.10 2.20
1991-1995 1996-2000
0.11
Territories (n=5) (n=11)
0.29
0.15
0.09
0.12
0.31
0.16
0.11
0.59
0.19
0.26
0.17
0.10
Drownings/100,000 population/year
1.112.21

31
T R E N D S 1 9 9 1 - 1 9 9 5 : 1 9 9 6 - 2 0 0 0
As well as analyzing activities and risk factors associated with drowning and otherwater-related injuries in Canada during 1991-2000, we also looked at trends between1991-1995 and 1996-2000.
Overall, the rate of water-related fatalities in Canada decreased by 19% between the two 5-year periods (refer to Table 2, page 33, for an overview of numbers, rates and trends for the categories listed below).
DROWNINGS
There was a 20% decrease in the rate of land and aircraft drowning; for all other drowningsthere was a decrease of 21%. If we compare only the first and the last years of the decade,the reduction was even more dramatic at 40% (Figure 33).
Source: The Canadian Red Cross Society & the Canadian Surveillance System for Water-Related Fatalities, 2005
Figure 33 RATE AND NUMBER OF DROWNINGS AND OTHER WATER-REL ATED FATALITIES, C ANADA 1991-2000 (n=5,900)
0.01991
(n=649)
2.0
1.5
1.0
0.5
1992 (n=610)
1993 (n=661)
1994 (n=628)
1995 (n=635)
1996 (n=623)
1997 (n=567)
1998 (n=552)
1999 (n=503)
2000 (n=472)
2.52.320.090.24
1.99
1.73 1.74
0.43
0.14
1.71
0.34
0.11
1.71
0.28
0.17
1.63
0.31
0.17
1.48
0.27
0.14
1.40
0.31
0.12
1.33
0.220.10
1.20
0.20
0.13
2.152.30
2.16 2.162.10
1.89 1.811.65
1.54
Fata
litie
ss/10
0,00
0po
pula
tion
/yea
r
Number of drownings/yearWater-related injuries other than drowningsLand & air transport drowningsDrownings, all other
68557
24
96491
23
122499
40
100497
31
83502
50
91483
49
81445
41
94423
35
66405
32
63369
40
WATER-RELATED INJURIES�OTHER THAN DROWNINGS
LAND AND AIR TRANSPORT DROWNINGS
DROWNINGS, ALL OTHER
0.08
0.34
BOATING
There was a 24% decrease in the rate of boating drowning in Canada, with a particularlysignificant decrease in daily living boating drownings.
AQUATIC ACTIVITIES
Since many people engage in swimming and wading, these categories of drowning claimthe largest number of victims; hence decreases of 22% for swimming and 46% for wadingare encouraging. The improvements were mainly evident in British Columbia and Ontario.No improvement was seen in the Atlantic or Prairie regions.
Although the number of deaths is much smaller, there was a 138% increase in the rate of drowning in hot tubs during the period, and increases or no improvement in the rates of drowning during diving/jumping, fishing by wading, and scuba diving.

32
T R E N D S 1 9 9 1 - 1 9 9 5 : 1 9 9 6 - 2 0 0 0
NON-AQUATIC ACTIVITIES
There was a 27% decrease in the rate of drowning during non-aquatic activities, generallycaused by falls into water. The most frequent body of water for these incidents continues to be rivers, where current is a frequent risk factor, followed by lakes and home swimmingpools. Infants under one year old are at minimal risk for such incidents. For toddlers1-4 years old, incidents tended to occur in home pools, followed by lakes and rivers.Rivers accounted for nearly 50% of incidents among adults and children 5 years and older.
SWIMMING POOLS
Home pools are the most frequent location for swimming pool drownings. The mainvictims in home pools are 1-4-year-old toddlers. Nearly all of these incidents resulted from falls into pools. There was a 40% decrease in the rate of swimming pool drowning of toddlers in Canada; this improvement appears to have resulted from research-basedtraining and publicity. There were large differences between provinces and regions.
BATHTUBS
There was a 26% decrease in the rate of bathtub drowning. Among infants less than oneyear old, the decrease was 50%.
INFANTS & TODDLERS
There was a 54% decrease in the rate of infant and 25% of toddler drownings in Canada.Since infants drowned most frequently in bathtubs and toddlers in home pools, theimprovement reflects a decrease in drowning in these sites.
PERSONS WITH EPILEPSY
There was no significant change in the rate of drowning of persons with epilepsy.
SNOWMOBILING
Although there was a 34% decrease in the rate of snowmobile drowning in Canada, therewas a 246% increase in the rate of snowmobile hypothermia deaths. The overall decrease inthe snowmobile immersion death rate was 28%.
NON-DROWNINGS
No improvement was seen for non-drowning fatalities — in fact there was an increase of 11%. Non-drowning incidents included boating collisions (24%), boating hypothermia(17%), scuba incidents, mainly air embolism (14%), diving into water (10%), andsnowmobile immersion hypothermia (4%).
NEAR DROWNINGS
The overall trend in rates of hospitalization for near drowning where the victimsurvived was a decrease of 25%. Infants and toddlers accounted for 31% of survivors ofhospitalization. There was a 29% drop in the rate of hospitalization for near drowningamong toddlers and 8% among infants.

33
T R E N D S 1 9 9 1 - 1 9 9 5 : 1 9 9 6 - 2 0 0 0
RATE REDUCTION†
1991- 1995 1996-2000 (INCREASE) 95% CI ‡
WATER-RELATED INJURIES # RATE # RATE (%) (%) p-value§
DROWNINGS (excluding land & air transport) 2,546 1.82 2,125 1.43 21 17-26 < 0.0001
Recreational 1,732 1.24 1,456 0.98 21 15-26 < 0.0001
Daily living 470 0.34 334 0.23 33 22-41 < 0.0001
Occupational 139 0.10 115 0.08 22 (2)-38 0.0770
Infants 23 1.13 10 0.53 54 1-88 0.0456
Toddlers 220 2.84 168 2.12 25 9-39 0.0043
Boating 997 0.71 806 0.54 24 17-31 < 0.0001
Recreational 728 0.52 634 0.43 18 8-26 0.0005
Daily living 125 0.09 62 0.04 53 40-67 < 0.0001
Occupational 114 0.08 87 0.06 28 1-43 0.0433
Aquatic activities 614 0.44 569 0.38 12 3-33 0.0118
Recreational 584 0.42 504 0.34 18 9-28 0.0005
Swimming 409 0.29 338 0.23 22 8-31 0.0016
Playing/wading in water 107 0.08 61 0.04 46 32-63 < 0.0001
Bathtub 224 0.16 165 0.11 30 16-44 0.0003
Non-aquatic activities 617 0.44 474 0.32 27 18-35 < 0.0001
LAND & AIR TRANSPORT DROWNINGS 469 0.33 395 0.27 20 6-28 0.0033
Snowmobile 137 0.10 95 0.06 34 22-54 < 0.0001
TOTAL DROWNINGS 3,015 2.15 2,520 1.70 21 17-25 < 0.0001
OTHER WATER-RELATED FATALITIES 168 0.12 197 0.13 (11) (33)-12 0.4450
Snowmobile (hypothermia) 3 0.00 11 0.01 (246) (1,141)-3 0.0570
TOTAL FATALITIES 3,183 2.27 2,717 1.83 19 15-23 < 0.0001
NEAR DROWNINGS¶ (all ages) 1,963 1.40 1,563 1.05 25 20-30 < 0.0001
Infants 88 4.33 76 3.99 8 (25)-32 0.6015
Toddlers 537 6.92 388 4.90 29 19-38 < 0.0001
Table 2 TRENDS IN WATER-REL ATED INJURY RATES*: DROWNINGS, NON-DROWNING FATALITIES AND NEAR DROWNINGS, C ANADA 1991-2000 (n=9,426)
* Victims per 100,000 population per year † Rate reductions were calculated from unrounded rates ‡ Confidence interval; we can be 95% certain that the decrease (increase) is within this interval § Probability that this decrease (increase) occurred by chance alone (e.g. for a p-value of <0.0001, probability is less than 1 in 10,000) ¶ Includes survivors of hospitalization for near drowningSource: The Canadian Red Cross Society & the Canadian Surveillance System for Water-Related Fatalities, 2005

COMMON ACTIVITIES AND RISK FACTORS
The research shows that the activities most often leading to drowning during 1991-2000were boating, swimming or wading, walking or playing near water, snowmobile and cartravel, and bathing in a bathtub.
Being male was the most frequent risk factor for all activities except bathing in a bathtub.Failure to wear a flotation device was a major risk factor for boating. Alcohol consumptionand river current were frequent risk factors for swimming and wading, falls into water,boating, and snowmobiling. Darkness and high speed were also important risk factors forsnowmobiling. The absence of an automatic self-closing and self-latching gate was a riskfactor for nearly all home pool drownings involving small children. Bathing in an adult-sized bathtub was a common risk factor for infants as well as for adults with epilepsy.
Please refer to Methods, page 3, for information on methodology used in analyzing results.
TRENDS
The trends in rates for most categories of drowning, especially among children, werequite encouraging during the 1990’s (Table 2). The improvement in child drowningoccurred shortly after the introduction of new research-based Red Cross water safetytraining and swimming programs and manual in the mid-1990’s. This new materialreached most communities across Canada. The Canadian Coast Guard also began usingRed Cross research and surveillance reports as a guide to educational programs forboating, along with other government and private organizations.
For the first time in Canada, and indeed in the world, detailed information about the incidence and risk factors for water-related injury deaths was available for the entirecountry. While the results are promising, to achieve a target closer to vision zero forwater-related deaths, other measures such as legislation and enforcement will be required,and these are discussed below. Ongoing annual surveillance continues, and will be essential to help assess the success of new programmes and other interventions.
HOW TO PREVENT WATER-RELATED INJURIES
PERCEPTION OF RISK
A key issue in prevention is the individual’s and family’s perception of risk for differentactivities. The actual risk of water-related injury and death per exposure to watertends to be much higher than the public perception. Thus while the risk of death or severe injury from a motor vehicle crash is quite low per trip, nearly all drivers andpassengers in Canada now wear seatbelts and avoid alcohol. On the other hand, people often load their boats with alcohol and forget to bring or wear their flotation devices,drink before swimming and diving, swim or wade in strong current, install homeswimming pools without an automatic safety gate, dive into home pools, and so forth. The lesson for those who train and educate the public is that a first priority must be to discuss risk perception. Only then can misperceptions be corrected so that each individual has a realistic appreciation of the risk of injury for different activities. At that point, the discussion can move on to strategies for reducing risk to a sensible and reasonable level in order to avoid injury.
BOAT SMART!
It is worth noting that only 12% of boaters who drowned during 1991-1995 were wearinga flotation device, and only 11% during 1996-2000. This is a major opportunity forprevention by good legislation and enforcement, and of course individual safety practices.Wearing rates for flotation devices in boats lag far behind those for seatbelts in cars. It is best to focus on adult male or family wearing, rather than child wearing, since 97% of boating drowning victims are males 15 and older, with high rates in all age groups.
34
D I S C U S S I O N & R E C O M M E N D A T I O N S

Taking time in advance to choose and purchase an appropriate flotation device for the activity that is planned helps to ensure that the device is cool and comfortable and will be worn. For a comprehensive examination of boating, see Modules 3 and 4.
MAKE YOUR ENVIRONMENT CHILD-SAFE AND SUPERVISE CHILDREN
Since it is difficult to constantly monitor small children in the home, home pools should be protected on all sides by a fence at least one metre high. The fence should includevertical bars with no horizontal bars or chain mesh that children can use to climb. The key element is a gate fitted with tension-adjustable self-closing hinges and a latch that is at the top of the gate. The home should never open into a pool area; otherwise,children can wander out of the house into the pool and drown.
Families who choose to spend holidays at cottages adjacent to water should be prepared to provide constant adult supervision for their 1-4-year-old toddlers if access to the water is unrestricted. A safer and more practical alternative is to rent a cottage at a suitabledistance from the water such that trips to the water are a planned family event withconstant supervision. Otherwise there is always a risk of toddlers wandering off andfalling into water when parents are busy with various household activities such as cooking.
BATHE SAFELY
Little infant tubs offer support for children less than a year old. When bathing infants ortoddlers, an adult should remain with the child at all times — children should never berelied upon to supervise other children in the bath. The adult should never leave to answerthe phone or for other momentary distractions: this is when drownings happen.
Since 53% of persons with epilepsy drowned in bathtubs, persons with epilepsy and thephysicians who care for them need to understand the high risk of bathing alone, and the importance of taking showers in preference to baths.
The general public needs to be better educated about the hazards of bathing afterconsuming alcohol or drugs.
SWIM AND DIVE SAFELY
Many swimmers drown in river current. Young swimmers in particular need to be trainedabout the hazards of current and how to escape from current using the power of the riveror ocean rather than fighting it. Appropriate use of angle while swimming gently upstreamagainst current can sweep the swimmer to the side of the river, similar to use of a ferryangle in a canoe or kayak.
Alcohol was involved in about half of swimming drownings. Surprisingly, high bloodalcohol levels were more than twice as frequent among swimmers 25 and older as amongthose 15-24 years old. Hence older adult males should be especially targeted for trainingin the hazards of alcohol and swimming. The best safety practice is to avoid alcohol whenswimming or diving, since even small amounts can increase the risk of injury.
Diving headfirst into water should be avoided unless the individual is properly trained and certain that the water is sufficiently deep. For swimming pools, the depth of waterneeded to dive safely is a function of the height and weight of the diver, the length of thedeep end of the pool, and the length of the diving board and its distance above the water.Many, and perhaps most, in-ground home pools, even those fitted with diving boards, are unsafe for diving, particularly for adult males. The deep end is often too short and the diver can strike his head on the slope of the pool leading up toward the shallow end.Injury to the cervical spine, which is a relatively fragile structure, can be fatal or causepermanent paralysis of all four limbs. All swimmers should be aware of this danger. The best safety practice is to avoid diving in home pools; all water safety training shouldemphasize safe feet-first entry into the water.
35
D I S C U S S I O N & R E C O M M E N D A T I O N S
Swimming training should always include not only how to swim but also how to staysafe in the water, and how to self-rescue and survive if trouble occurs. Family safety andenjoyment will be enhanced if everyone knows how to swim and stay safe in, on andaround the water before children are ready to start school. Swimming and water safetytraining should be based on sound research.
DON’T UNDERESTIMATE CURRENT
Current was a factor in most river drownings as well as in some ocean drownings.A swimmer or wader who underestimates the power of current can be swept away in aninstant. A canoeist who broadsides a boulder in current can be trapped between the canoeand the rock in a matter of seconds. (The French term for what can ensue, “cravat” ornecktie, is a vivid portrayal of how tons of water can collapse and wrap a canoe around ariver rock.) A canoeist or kayaker who is unaware of the danger of a “strainer” or fallentree across the stream can be suddenly caught in the branches and swept underwater bythe current. Other hazards relating to current that are seldom understood without specifictraining include the risk to swimmers and boaters from circulating hydraulic currents at the base of even a small dam, and the hazard of foot entrapment when trying to wadeacross a fast flowing river. Swimmers and boaters should be trained to avoid approachinganywhere close to even small dams, including areas above and below.
Research-based water safety education and swimming instruction on how to deal withcurrent for all children in Canada at school entry, with a later reinforcement for youth and young adults, represent another important opportunity for prevention. In our country,covered with innumerable rivers and streams, every Canadian should be able to safelymanoeuvre in current, when the need arises.
STAY SAFE ON ICE
Snowmobilers and others who walk or play on ice should exercise extreme caution onrivers and avoid outflows of lakes and reservoirs, since ice with current under it poses thegreatest risk. Travel over ice at night or in other conditions of reduced visibility is bestavoided since holes or weak areas are difficult to see and rescue is much more difficult.Many snowmobiles travel at speeds that are far too high for safe travel on ice, and alertnessis often impaired by alcohol or fatigue. The tendency to increase rather than decrease speedon an open body of ice must be counteracted by effective training. Clothing that provideshypothermia protection and flotation is a must, along with attached and accessible ice picksto crawl out onto the ice in the event of an immersion.
SPECIAL OPPORTUNITIES FOR LARGE GAINS IN PREVENTION
Immediate attention to five risk factors could eliminate many drownings and otherwater-related injury deaths in Canada, saving the lives of hundreds of active Canadiansevery year.
1 – Safety Equipment for Event Phase of Boating Incidents
Legislation and enforcement to ensure wearing of an appropriate flotation device by allboaters, especially adult males, could eliminate up to 90% of all boating drownings and up to 35% of all drownings in Canada, saving up to 160 lives per year. Such legislation wouldneed to be reinforced by appropriate training and education of decision makers, boaters,coast guard, and police. For the law to be a success, boaters would need to be wellinformed about the choice of a quality comfortable PFD appropriate for their chosenactivity. They would also need to be trained to have a more precise perception about therisk of boating as compared with land activities, and the absolute need for water safety.
36
D I S C U S S I O N & R E C O M M E N D A T I O N S

2. Safety Equipment for Pre-Event Phase of Swimming Pool Incidents
It should not be legal for pool vendors to sell a dangerous product without including theappropriate safety equipment. Legislation could be introduced to ensure that every poolsold in Canada be equipped with an automatic self-closing and self-latching gate, and that existing pool owners be required to install such a gate. Insurance companies could beencouraged to conduct pool safety inspections when insuring homes with pools. Suchmeasures could eliminate nearly all pool drownings of toddlers, prevent about 10% of alldrownings in Canada, and could save about 50 lives of 1-4-year-old children per year.Developing and legislating pool safety standards could also prevent many diving injuries.
3. Alcohol, a Personal Risk Factor for Pre-Event, Event, and Post-Event Phases of All Water-Related Injury Incidents
Legislation and enforcement together with training and education to limit alcoholconsumption in, on, or around the water could prevent about 30% of all drownings in Canada and save about 150 lives per year. Such measures would also avert up to 25 deaths per year from other water-related injuries such as boating collisions.
4. Safety Equipment for Event Phase of Snowmobile Incidents
Snowmobilers who travel over water should be encouraged to wear a flotation-hypothermiasuit with attached ice-picks. Manufacturers should be lobbied to fit snowmobiles with a luminous flotation device with attached ice picks that would automatically pop out intowater and be visible in the dark to help a snowmobiler escape from the hole in the iceeven if the machine sinks. If these measures worked, we could expect to save about 20 snowmobilers lives per year, about 4% of all drownings.
5. River Current, an Environmental Risk Factor for Pre-Event, Event, and Post-event Phases of Aquatic, Non-aquatic, and Boating Incidents
Effective evidence-based training in how to manage all hazards of current duringswimming, wading, boating, and unexpected falls into water could pay large dividends in averting about 30% of drownings per year, saving 130 lives. Training needs to includepractice in how to safely manoeuvre in current and how to use the power of current for self-rescue. Education should include the theory of current and the types of scenariosto be expected.
Thus it is within the capacity of our elected leaders and our population to eliminate about85% of drownings and other water-related injury deaths and save over 400 million dollarsper year by implementing appropriate regulations, enforcement and education to targetfive key risk factors. These risk factors must be addressed by governments, and by theorganizations with the power to inform, to lobby, and to negotiate in order to persuadedecision-makers to act.
37
D I S C U S S I O N & R E C O M M E N D A T I O N S
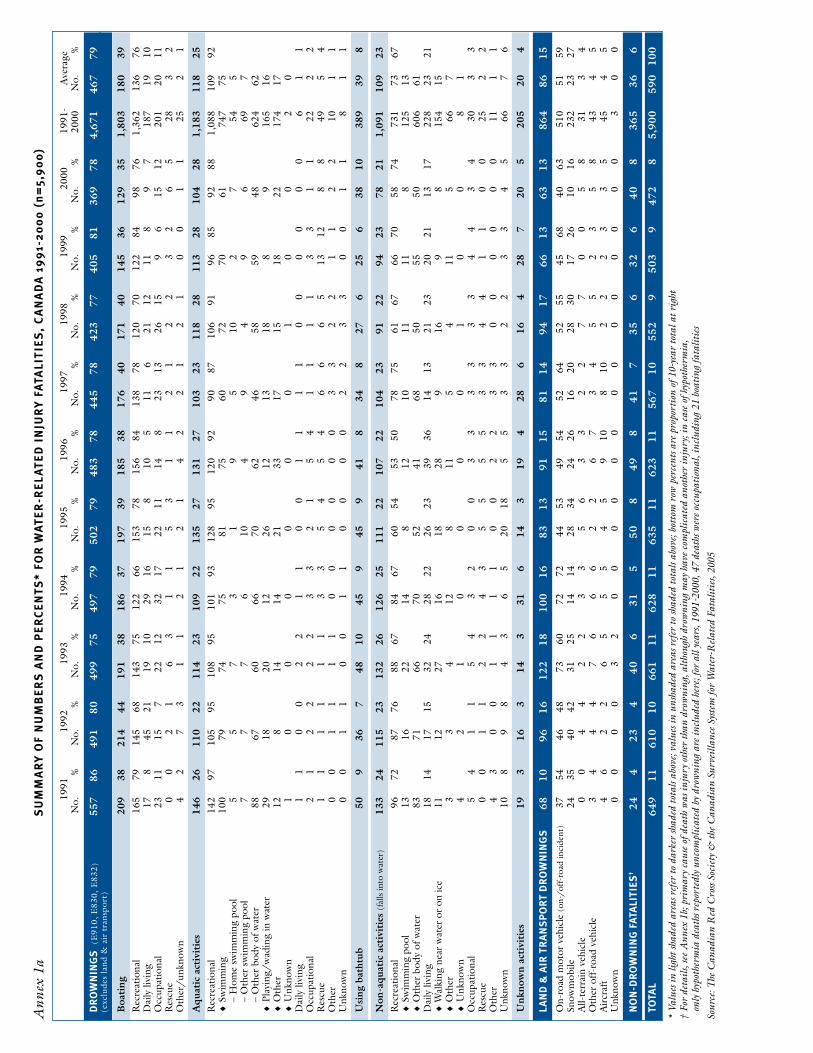
1991
1992
1993
1994
1995
1996
1997
1998
1999
2000
-199
1-A
vera
geN
o.%
No.
%N
o.%
No.
%N
o.%
No.
%N
o.%
No.
%N
o.%
No.
%20
00N
o.%
DR
OW
NIN
GS
(E91
0, E
830,
E83
2)55
786
491
8049
975
497
7950
279
483
7844
578
423
7740
581
369
784,
671
467
79(e
xclu
des
land
& a
ir t
rans
port
)
Boa
ting
209
3821
444
191
3818
637
197
3918
538
176
4017
140
145
3612
935
1,80
318
039
R
ecre
atio
nal
165
7914
568
143
7512
266
153
7815
684
138
7812
070
122
8498
761,
362
136
76
Dai
ly li
ving
178
4521
1910
2916
158
105
116
2112
118
97
187
1910
O
ccup
atio
nal
2311
157
2212
3217
2211
148
2313
2615
96
1512
201
2011
R
escu
e0
02
16
31
15
31
12
12
23
26
528
32
Oth
er/
unkn
own
42
73
11
21
21
42
21
21
00
11
252
1
Aqu
atic
act
ivit
ies
146
2611
022
114
2310
922
135
2713
127
103
2311
828
113
2810
428
1,18
311
825
R
ecre
atio
nal
142
9710
595
108
9510
193
128
9512
092
9087
106
9196
8592
881,
088
109
92
♦Sw
imm
ing
100
7974
7581
7560
7270
6174
775
– H
ome
swim
min
g po
ol5
57
31
95
102
754
5–
Oth
er s
wim
min
g po
ol7
77
610
49
49
669
7–
Oth
er b
ody
of w
ater
8867
6066
7062
4658
5948
624
62♦
Play
ing/
wad
ing
in w
ater
2918
2012
2612
1318
89
165
16♦
Oth
er12
814
1421
3317
1518
2217
417
♦U
nkno
wn
10
00
00
01
00
20
Dai
ly li
ving
11
00
22
11
00
11
11
00
00
00
61
1 O
ccup
atio
nal
21
22
22
33
21
54
11
11
33
11
222
2 R
escu
e1
11
11
13
35
45
46
66
513
128
849
54
Oth
er0
01
11
10
00
00
03
32
21
12
210
11
Unk
now
n0
01
10
01
10
00
02
23
30
01
18
11
Usi
ng b
atht
ub50
936
748
1045
945
941
834
827
625
638
1038
939
8
Non
-aqu
atic
act
ivit
ies
(fal
ls in
to w
ater
)13
324
115
2313
226
126
2511
122
107
2210
423
9122
9423
7821
1,09
110
923
R
ecre
atio
nal
9672
8776
8867
8467
6054
5350
7875
6167
6670
5874
731
7367
♦
Swim
min
g po
ol13
1622
148
1210
1111
812
513
♦O
ther
bod
y of
wat
er83
7166
7052
4168
5055
5060
661
Dai
ly li
ving
1814
1715
3224
2822
2623
3936
1413
2123
2021
1317
228
2321
♦
Wal
king
nea
r w
ater
or
on ic
e11
1227
1618
289
169
815
415
♦O
ther
33
412
811
54
115
667
♦U
nkno
wn
42
10
00
01
00
81
Occ
upat
iona
l5
41
15
43
20
03
33
33
34
43
430
33
Res
cue
00
11
22
43
55
55
33
44
11
00
252
2 O
ther
43
00
11
11
00
22
33
00
00
00
111
1 U
nkno
wn
108
98
43
65
2018
55
33
22
33
45
667
6
Unk
now
n ac
tivi
ties
193
163
143
316
143
194
286
164
287
205
205
204
LAN
D &
AIR
TR
AN
SP
OR
TD
RO
WN
ING
S68
1096
1612
218
100
1683
1391
1581
1494
1766
1363
1386
486
15
On-
road
mot
or v
ehic
le (o
n-/
off-
road
inci
dent
)37
5446
4873
6072
7244
5349
5452
6452
5545
6840
6351
051
59
Snow
mob
ile24
3540
4231
2514
1428
3424
2616
2028
3017
2610
1623
223
27
All-
terr
ain
vehi
cle
00
44
22
33
56
33
22
77
00
58
313
4 O
ther
off
-roa
d ve
hicl
e3
44
47
66
62
26
73
45
52
35
843
45
Air
craf
t4
62
26
55
54
59
108
102
22
33
545
45
Unk
now
n0
00
03
20
00
00
00
00
00
00
03
00
NO
N-D
RO
WN
ING
FAT
ALI
TIES
†24
423
440
631
550
849
841
735
632
640
836
536
6
TOTA
L64
911
610
1066
111
628
1163
511
623
1156
710
552
950
39
472
85,
900
590
100
Ann
ex 1
aS
UM
MA
RY
OF
NU
MB
ER
S A
ND
PE
RC
EN
TS
* FO
R W
AT
ER
-RE
LA
TE
D I
NJU
RY
FA
TALI
TIE
S,
CA
NA
DA
19
91-
20
00
(n
=5,
90
0)
*Va
lues
in li
ght s
hade
d ar
eas r
efer
to d
arke
r sh
aded
tota
ls ab
ove;
val
ues i
n un
shad
ed a
reas
ref
er to
shad
ed to
tals
abov
e; b
otto
m r
ow p
erce
nts a
re p
ropo
rtio
n of
10-
year
tota
l at r
ight
†Fo
r de
tails
, see
Ann
ex 1
b; p
rim
ary
caus
e of
dea
th w
as in
jury
oth
er th
an d
row
ning
, alt
houg
h dr
owni
ng m
ay h
ave
com
plic
ated
ano
ther
inju
ry; i
n ca
se o
f hyp
othe
rmia
, on
ly h
ypot
herm
ia d
eath
s rep
orte
dly
unco
mpl
icat
ed b
y dr
owni
ng a
re in
clud
ed h
ere;
for
all y
ears
, 199
1-20
00, 4
7 de
aths
wer
e oc
cupa
tion
al, i
nclu
ding
21
boat
ing
fata
litie
s
Sour
ce: T
he C
anad
ian
Red
Cro
ss So
ciet
y &
the
Can
adia
n Su
rvei
llanc
e Sy
stem
for
Wat
er-R
elat
ed F
atal
itie
s, 20
05

1991
1992
1993
1994
1995
1996
1997
1998
1999
2000
-199
1-A
vera
geN
o.%
No.
%N
o.%
No.
%N
o.%
No.
%N
o.%
No.
%N
o.%
No.
%20
00N
o.%
NO
N-D
RO
WN
ING
FAT
ALI
TIES
†
Boa
ting
11
46
11
48
18
45
13
42
15
30
20
41
16
39
15
43
12
38
18
45
149
15
41
Aqu
atic
act
ivit
ies
7 29
10
43
9
22
8 26
11
22
11
22
9
22
8 23
8
25
8 20
89
9 24
Scub
a di
ving
, air
em
bolis
m1
3 3
4 5
7 2
2 5
335
4
Scub
a di
ving
, oth
er0
1 2
2 0
1 1
0 0
18
1
Div
ing
into
wat
er, h
ead/
spin
al in
jury
5 1
1 2
5 2
3 2
2 0
23
2
Div
ing
into
wat
er, o
ther
/un
sp. i
njur
y0
3 0
0 1
1 1
0 1
18
1
Jum
ping
into
wat
er0
1 0
0 0
0 2
2 0
27
1
Oth
er1
13
0 0
0 0
2 0
18
1
Non
-aqu
atic
act
ivit
ies
(fal
ls in
to w
ater
)4
17
1 4
4 10
7
23
10
20
8 16
4
10
8 23
3
9 3
852
5
15
Lan
d &
air
tra
nspo
rt2
8 1
4 5
12
3 10
14
28
7
14
12
29
4 11
9
28
1128
68
7 19
On-
road
veh
icle
, on-
/of
f-ro
ad in
cide
nt0
1 1
3 4
4 4
2 1
424
2
Snow
mob
ile2
0 0
0 1
2 1
1 5
214
1
All-
terr
ain
vehi
cle
0 0
0 0
0 0
0 1
1 3
5 1
Oth
er o
ff-r
oad
vehi
cle
0 0
2 0
0 1
0 0
0 2
5 0
Air
craf
t0
0 2
0 9
0 7
0 2
020
2
Oth
er/
unkn
own
acti
viti
es0
0 0
0 4
10
0 0
0 0
3 6
0 0
0 0
0 0
00
7 1
2
TOTA
L24
7
23
6 40
11
31
8 50
14
49
13
41
11
35
10
32
9
4011
365
36
100
SU
MM
AR
Y O
F N
UM
BE
R A
ND
PE
RC
EN
TS
* FO
R N
ON
-DR
OW
NIN
G I
NJU
RY
FA
TALI
TIE
S B
Y A
CT
IVIT
Y, C
AN
AD
A 1
99
1-2
00
0 (
n=
36
5)
*Va
lues
in u
nsha
ded
area
s ref
er to
shad
ed to
tals
abov
e; b
otto
m r
ow p
erce
nts a
re p
ropo
rtio
n of
10-
year
tota
l at r
ight
† Pr
imar
y ca
use
of d
eath
was
inju
ry o
ther
than
dro
wni
ng, a
ltho
ugh
drow
ning
may
hav
e co
mpl
icat
ed a
noth
er in
jury
; in
case
of h
ypot
herm
ia,
only
hyp
othe
rmia
dea
ths r
epor
tedl
y un
com
plic
ated
by
drow
ning
are
incl
uded
her
e; fo
r al
l yea
rs, 1
991-
2000
, 47
deat
hs w
ere
occu
pati
onal
, inc
ludi
ng 2
1 bo
atin
g fa
talit
ies
Sour
ce: T
he C
anad
ian
Red
Cro
ss So
ciet
y &
the
Can
adia
n Su
rvei
llanc
e Sy
stem
for
Wat
er-R
elat
ed F
atal
itie
s, 20
05
Ann
ex 1
b
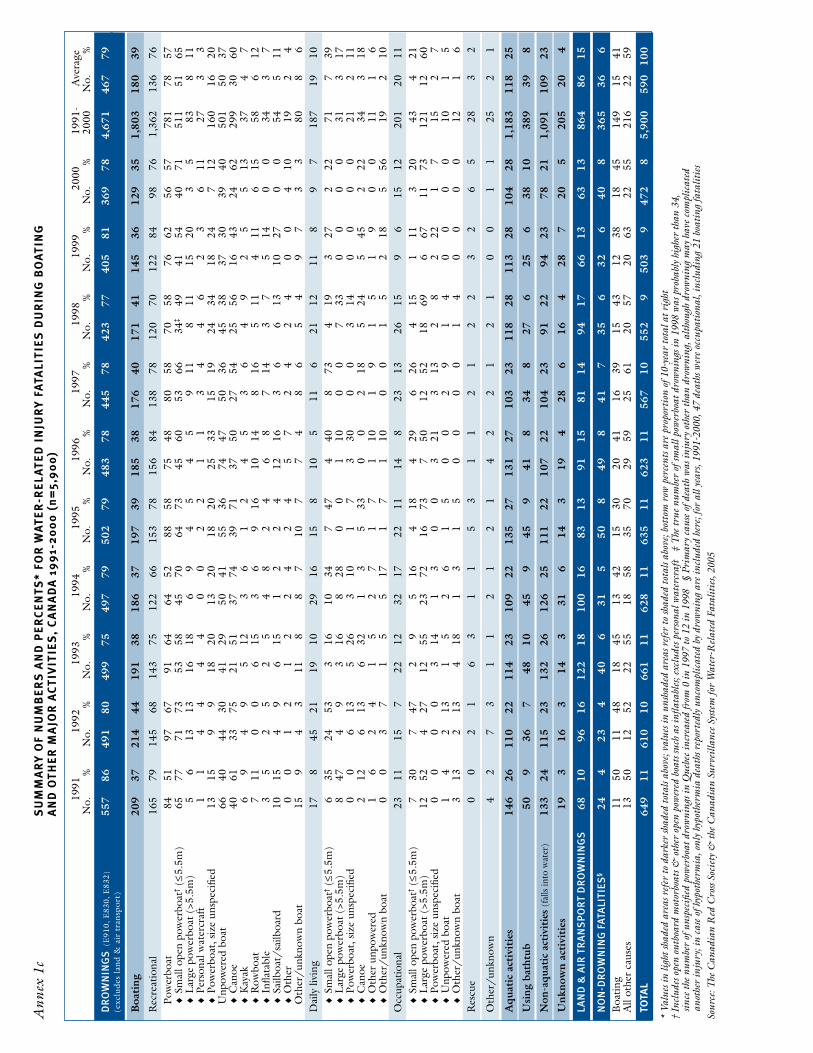
1991
1992
1993
1994
1995
1996
1997
1998
1999
2000
-199
1-A
vera
geN
o.%
No.
%N
o.%
No.
%N
o.%
No.
%N
o.%
No.
%N
o.%
No.
%20
00N
o.%
DR
OW
NIN
GS
(E
910,
E83
0, E
832)
557
8649
180
499
7549
779
502
7948
378
445
7842
377
405
8136
978
4,67
146
779
(exc
lude
s la
nd &
air
tra
nspo
rt)
Boa
ting
209
3721
444
191
3818
637
197
3918
538
176
4017
141
145
3612
935
1,80
318
039
Rec
reat
iona
l16
579
145
6814
375
122
6615
378
156
8413
878
120
7012
284
9876
1,36
213
676
Pow
erbo
at84
5197
6791
6464
5288
5875
4880
5870
5876
6256
5778
178
57♦
Smal
l ope
n po
wer
boat
†(≤
5.5m
)65
7771
7353
5845
7064
7345
6053
6634
‡49
4154
4071
511
5165
♦L
arge
pow
erbo
at (
>5.5
m)
56
1313
1618
69
45
45
911
811
1520
35
838
11♦
Pers
onal
wat
ercr
aft
11
44
44
00
22
11
34
46
23
611
273
3♦
Pow
erbo
at, s
ize
unsp
ecifi
ed13
159
918
2013
2018
2025
3315
1924
3418
247
1216
016
20U
npow
ered
boa
t66
4044
3041
2950
4155
3674
4750
3645
3837
3039
4050
150
37♦
Can
oe40
6133
7521
5137
7439
7137
5027
5425
5616
4324
6229
930
60♦
Kay
ak6
94
95
123
61
24
53
64
92
55
1337
47
♦R
owbo
at7
110
06
153
69
1610
148
165
114
116
1558
612
♦In
flata
ble
35
25
25
48
24
68
714
37
514
00
343
7♦
Sailb
oat/
sailb
oard
1015
49
615
12
24
1216
36
613
1027
00
545
11♦
Oth
er0
01
21
22
42
45
72
42
40
04
1019
24
Oth
er/
unkn
own
boat
159
43
118
87
107
74
86
54
97
33
808
6D
aily
livi
ng17
845
2119
1029
1615
810
511
621
1211
89
718
719
10♦
Smal
l ope
n po
wer
boat
†(≤
5.5m
)6
3524
533
1610
347
474
408
734
193
272
2271
739
♦L
arge
pow
erbo
at (
>5.5
m)
847
49
316
828
00
110
00
733
00
00
313
17♦
Pow
erbo
at, s
ize
unsp
ecifi
ed0
06
135
263
101
73
300
03
140
00
021
211
♦C
anoe
212
613
632
13
533
00
218
524
545
222
343
18♦
Oth
er u
npow
ered
16
24
15
27
17
110
19
15
19
00
111
6♦
Oth
er/
unkn
own
boat
00
37
15
517
17
110
00
15
218
556
192
10O
ccup
atio
nal
2311
157
2212
3217
2211
148
2313
2615
96
1512
201
2011
♦
Smal
l ope
n po
wer
boat
†(≤
5.5m
)7
307
472
95
164
184
296
264
151
113
2043
421
♦L
arge
pow
erbo
at (
>5.5
m)
1252
427
1255
2372
1673
750
1252
1869
667
1173
121
1260
♦Po
wer
boat
, siz
e un
spec
ified
00
00
314
13
00
321
313
28
222
17
152
7♦
Unp
ower
ed b
oat
14
213
15
26
15
00
29
14
00
00
101
5♦
Oth
er/
unkn
own
boat
313
213
418
13
15
00
00
14
00
00
121
6R
escu
e0
02
16
31
15
31
12
12
23
26
528
32
Oth
er/
unkn
own
42
73
11
21
21
42
21
21
00
11
252
1
Aqu
atic
act
ivit
ies
146
2611
022
114
2310
922
135
2713
127
103
2311
828
113
2810
428
1,18
311
825
Usi
ng b
atht
ub50
936
748
1045
945
941
834
827
625
638
1038
939
8
Non
-aqu
atic
act
ivit
ies
(fal
ls in
to w
ater
)13
324
115
2313
226
126
2511
122
107
2210
423
9122
9423
7821
1,09
110
923
Unk
now
n ac
tivi
ties
193
163
143
316
143
194
286
164
287
205
205
204
LAN
D &
AIR
TR
AN
SP
OR
TD
RO
WN
ING
S68
1096
1612
218
100
1683
1391
1581
1494
1766
1363
1386
486
15
NO
N-D
RO
WN
ING
FAT
ALI
TIES
§24
423
440
631
550
849
841
735
632
640
836
536
6B
oatin
g11
5011
4818
4513
4215
3020
4116
3915
4312
3818
4514
915
41A
ll ot
her
caus
es13
5012
5222
5518
5835
7029
5925
6120
5720
6322
5521
622
59
TOTA
L64
911
610
1066
111
628
1163
511
623
1156
710
552
950
39
472
85,
900
590
100
Ann
ex 1
cS
UM
MA
RY
OF
NU
MB
ER
S A
ND
PE
RC
EN
TS
* FO
R W
AT
ER
-RE
LA
TE
D I
NJU
RY
FA
TALI
TIE
S D
UR
ING
BO
AT
ING
A
ND
OT
HE
R M
AJO
R A
CT
IVIT
IES
, C
AN
AD
A 1
99
1-2
00
0 (
n=
5,9
00
)
*Va
lues
in li
ght s
hade
d ar
eas r
efer
to d
arke
r sh
aded
tota
ls ab
ove;
val
ues i
n un
shad
ed a
reas
ref
er to
shad
ed to
tals
abov
e; b
otto
m r
ow p
erce
nts a
re p
ropo
rtio
n of
10-
year
tota
l at r
ight
†In
clud
es o
pen
outb
oard
mot
orbo
ats &
oth
er o
pen
pow
ered
boa
ts su
ch a
s infl
atab
les;
excl
udes
per
sona
l wat
ercr
aft
‡ T
he tr
ue n
umbe
r of
smal
l pow
erbo
at d
row
ning
s in
1998
was
pro
babl
y hi
gher
than
34,
sin
ce th
e nu
mbe
r of
uns
peci
fied
pow
erbo
at d
row
ning
s in
Que
bec
incr
ease
d fr
om 0
in 1
997
to 1
2 in
199
8 §
Pri
mar
y ca
use
of d
eath
was
inju
ry o
ther
than
dro
wni
ng, a
ltho
ugh
drow
ning
may
hav
e co
mpl
icat
ed
anot
her
inju
ry; i
n ca
se o
f hyp
othe
rmia
, onl
y hy
poth
erm
ia d
eath
s rep
orte
dly
unco
mpl
icat
ed b
y dr
owni
ng a
re in
clud
ed h
ere;
for
all y
ears
, 199
1-20
00, 4
7 de
aths
wer
e oc
cupa
tion
al, i
nclu
ding
21
boat
ing
fata
litie
sSo
urce
: The
Can
adia
n R
ed C
ross
Soci
ety
& th
e C
anad
ian
Surv
eilla
nce
Syst
em fo
r W
ater
-Rel
ated
Fat
alit
ies,
2005

NFL
DN
SP
EI
NB
QC
ON
TM
AN
SASK
ALT
AB
CN
UN
AV
UT
NW
TY
UK
ON
CA
NA
DA
No.
%N
o.
%N
o.%
No.
%N
o.%
No.
%N
o.%
No.
%N
o.%
No.
%N
o.%
No.
%N
o.%
No.
%
DR
OW
NIN
GS
(E91
0, E
830,
E83
2)17
869
211
8131
8414
581
977
811,
349
8226
185
194
8030
885
898
732
2589
7528
704,
671
79(e
xclu
des
land
& a
ir t
rans
port
)
Boa
ting
114
6411
555
2065
5739
308
3250
237
9135
7840
8126
357
410
061
6919
681,
803
39R
ecre
atio
nal
6154
6758
1155
3867
260
8443
386
6268
5571
7491
267
750
020
3314
741,
362
76D
aily
livi
ng6
56
50
02
427
942
819
2113
173
429
80
036
594
2118
710
Occ
upat
iona
l43
3836
317
3514
2513
413
39
106
83
454
150
02
31
520
111
Res
cue
00
00
15
12
31
102
11
23
11
62
00
35
00
282
Oth
er/
unkn
own
44
65
15
24
52
41
00
23
00
10
00
00
00
251
Aqu
atic
act
ivit
ies
2112
4421
310
4531
281
2936
427
7228
4121
8728
209
241
5012
133
111,
183
25R
ecre
atio
nal
1990
3682
310
039
8725
791
340
9364
8941
100
8497
192
920
010
833
100
1,08
892
♦Sw
imm
ing
1327
222
175
263
4125
5311
80
62
747
– H
ome
swim
min
g po
ol0
30
121
180
06
50
00
54–
Oth
er s
wim
min
g po
ol1
00
115
264
64
120
00
69–
Oth
er b
ody
of w
ater
1224
220
139
219
3719
4310
10
62
624
♦Pl
ayin
g/w
adin
g in
wat
er2
31
946
4414
1113
180
40
165
♦O
ther
/U
nkno
wn
46
08
3633
95
1856
00
117
6D
aily
livi
ng
00
00
00
24
10
10
23
00
00
00
00
00
00
61
Occ
upat
iona
l1
51
20
03
79
33
10
00
00
04
21
100
00
00
222
Res
cue
15
614
00
00
104
154
46
00
33
84
00
217
00
494
Oth
er/
unkn
own
00
12
00
12
41
51
23
00
00
52
00
00
00
182
Usi
ng b
atht
ub3
210
52
68
610
110
129
1012
516
837
1266
80
05
60
038
98
Non
-aqu
atic
act
ivit
ies
(fal
ls in
to w
ater
)34
1936
173
1031
2124
225
314
2375
2946
2480
2621
524
00
1011
518
1,09
123
Rec
reat
iona
l23
6829
811
3324
7718
175
209
6755
7334
7447
5911
855
00
770
360
731
67♦
Swim
min
g po
ol0
20
552
455
02
140
00
125
♦O
ther
bod
y of
wat
er23
271
1912
916
450
3445
104
07
360
6D
aily
livi
ng6
185
140
04
1342
1772
238
118
1719
2461
280
02
201
2022
821
♦W
alki
ng n
ear
wat
er o
r on
ice
54
04
2848
64
1339
02
115
5♦
Oth
er/
unkn
own
11
00
1424
24
622
00
073
Occ
upat
iona
l 0
01
31
332
66
25
23
40
05
66
30
01
100
030
3R
escu
e1
30
00
00
05
25
22
31
22
39
40
00
00
025
2O
ther
0
00
00
00
00
04
10
01
22
34
20
00
00
011
1U
nkno
wn
412
13
133
13
83
196
79
24
56
178
00
00
120
666
Unk
now
n ac
tivi
ties
63
63
310
43
455
403
114
137
237
516
150
11
14
205
4
LAN
D &
AIR
TR
AN
SP
OR
TD
RO
WN
ING
S59
2336
145
1422
1218
215
232
1435
1138
1635
1018
616
225
2219
1025
864
15O
n-ro
ad m
otor
veh
icle
, on-
/of
f-ro
ad in
cide
nt15
2532
893
6016
7311
362
101
4415
4318
4721
6016
086
00
836
880
510
59Sn
owm
obile
, on-
/of
f-ro
ad in
cide
nt36
612
61
202
941
2399
4319
5413
341
32
12
100
1464
00
232
27A
ll-te
rrai
n ve
hicl
e5
81
30
01
58
47
31
31
34
113
20
00
00
031
4O
ther
off
-roa
d ve
hicl
e1
21
30
01
57
411
50
06
169
267
40
00
00
043
5A
ircr
aft
12
00
120
00
137
146
00
00
00
148
00
00
220
455
Unk
now
n1
70
00
02
130
00
00
00
00
00
00
00
00
03
0
NO
N-D
RO
WN
ING
FAT
ALI
TIES
†20
813
51
311
654
472
411
412
520
614
012
450
54
25
365
6B
oatin
g8
403
230
04
3627
5139
541
95
427
3550
364
100
00
150
149
41Sc
uba
divi
ng; a
ir e
mbo
lism
00
538
00
00
24
710
00
00
00
2014
00
120
00
3510
Scub
a di
ving
; oth
er in
jury
15
00
00
00
48
00
00
00
00
32
00
00
00
82
Div
ing
into
wat
er; h
ead/
spin
al in
juri
es1
50
00
02
182
46
82
181
80
08
60
00
01
5023
6D
ivin
g in
to w
ater
; oth
er/
unsp
ecifi
ed0
00
00
00
04
81
10
00
00
03
20
00
00
08
2Ju
mpi
ng in
to w
ater
00
00
00
00
00
00
00
00
00
75
00
00
00
72
Oth
er a
quat
ic a
ctiv
ity0
01
80
00
00
00
00
01
83
153
20
00
00
08
2Fa
lls in
to w
ater
420
215
00
218
611
811
19
433
630
1712
00
240
00
5214
Snow
mob
ile, h
ypot
herm
ia‡
420
00
110
01
92
41
13
270
00
01
10
01
200
014
4O
n-ro
ad v
ehic
le, o
n-/
off-
road
inci
dent
00
215
00
218
12
23
00
00
15
1611
00
00
00
247
Off
-roa
d ve
hicl
e0
00
00
00
01
41
10
00
02
100
00
00
00
04
1A
TV
00
00
00
00
12
23
19
18
00
00
00
120
00
41
Air
cras
h2
100
00
00
03
62
33
270
00
010
70
00
00
020
5O
ther
00
00
00
00
14
34
00
00
15
21
00
00
00
72
TOTA
L25
74
260
437
117
83
1,21
321
1,65
328
307
524
44
363
61,
224
218
011
62
401
5,90
010
0
Ann
ex 2
SU
MM
AR
Y O
F N
UM
BER
S A
ND
PER
CEN
TS*
FOR
WAT
ER-R
ELAT
ED I
NJU
RY
FAT
ALI
TIES
BY
PR
OV
INC
E A
ND
TER
RIT
OR
Y, C
AN
AD
A 1
99
1-20
00
(n=
5,9
00
)
*Va
lues
in li
ght s
hade
d ar
eas r
efer
to d
arke
r sh
aded
tota
ls ab
ove;
val
ues i
n un
shad
ed a
reas
ref
er to
shad
ed to
tals
abov
e; b
otto
m r
ow p
erce
nt a
re p
ropo
rtio
n of
nat
iona
l tot
al a
t rig
ht
†Pr
imar
y ca
use
of d
eath
was
inju
ry o
ther
than
dro
wni
ng,
alth
ough
dro
wni
ng m
ay h
ave
com
plic
ated
ano
ther
inju
ry; i
n ca
se o
f hyp
othe
rmia
, onl
y hy
poth
erm
ia d
eath
s rep
orte
dly
unco
mpl
icat
ed b
y dr
owni
ng a
re in
clud
ed h
ere
‡Sn
owm
obile
cra
shes
are
not
incl
uded
her
eSo
urce
: The
Can
adia
n R
ed C
ross
Soci
ety
& th
e C
anad
ian
Surv
eilla
nce
Syst
em fo
r W
ater
-Rel
ated
Fat
alit
ies,
2005

BOTH SEXESTotal 0-14 15-24 25-44 45-64 65+ Unknown
TYPE OF ACTIVITY No. % No. % No. % No. % No. % No. % No. %
Recreational 3,186 58 627 81 642 63 1,042 54 578 51 286 44 11 28
Boating 1,362 43 40 6 252 39 566 54 356 62 140 49 8 73Aquatic 1,088 34 203 32 309 48 354 34 152 26 69 24 1 9
♦ Swimming 747 101 238 251 111 46 0♦ Playing/wading 165 88 30 32 9 6 0♦ Other 176 14 41 71 32 17 1
Falls into water 731 23 382 61 81 13 120 12 69 12 77 27 2 18Unknown 5 0 2 0 0 0 2 0 1 0 0 0 0 0
Non recreational‡ 1,485 27 102 13 184 18 559 29 347 31 265 41 28 70
Boating 441 30 15 15 56 30 218 39 106 31 32 12 14 50Aquatic 95 6 8 8 23 13 46 8 14 4 3 1 1 4Using bathtub 389 26 73 72 38 21 100 18 76 22 102 38 0 0Falls into water 360 24 4 4 41 22 111 20 105 30 97 37 2 7Unknown 200 13 2 2 26 14 84 15 46 13 31 12 11 39
Land & air transport 864 16 45 6 188 19 327 17 208 18 95 15 1 3
TOTAL 5,535 100 774 14 1,014 18 1,928 35 1,133 20 646 12 40 1
MALETotal 0-14 15-24 25-44 45-64 65+ Unknown
TYPE OF ACTIVITY No. % No. % No. % No. % No. % No. % No. %
Recreational 2,763 60 464 86 585 66 955 56 501 54 247 51 11 28
Boating§ 1,265 46 31 7 230 39 534 56 329 66 133 54 8 73Aquatic 929 34 155 33 285 49 319 33 117 23 52 21 1 9
♦ Swimming 643 80 220 226 83 34 0♦ Playing/wading 129 63 25 30 6 5 0♦ Other 157 12 40 63 28 13 1
Fall into water 565 20 277 60 70 12 100 10 54 11 62 25 2 18Unknown 4 0 1 0 0 0 2 0 1 0 0 0 0 0
Non recreational‡ 1,128 25 47 9 142 16 475 28 269 29 168 34 27 69
Boating 413 37 10 21 51 36 210 44 99 37 29 17 14 52Aquatic 79 7 6 13 16 11 42 9 12 4 2 1 1 4Using bathtub 164 15 27 57 15 11 54 11 33 12 35 21 0 0Falls into water 307 27 3 6 38 27 99 21 86 32 79 47 2 7Unknown 165 15 1 2 22 15 70 15 39 14 23 14 10 37
Land & air transport 691 15 29 5 155 18 270 16 163 17 73 15 1 3
TOTAL 4,582 100 540 12 882 19 1,700 37 933 20 488 11 39 1
FEMALETotal 0-14 15-24 25-44 45-64 65+ Unknown
TYPE OF ACTIVITY No. % No. % No. % No. % No. % No. % No. %
Recreational 423 44 163 70 57 43 87 38 77 39 39 25 0 0
Boating 97 23 9 6 22 39 32 37 27 35 7 18 0 0Aquatic 159 38 48 29 24 42 35 40 35 45 17 44 0 0
♦ Swimming 104 21 18 25 28 12 0♦ Playing/wading 36 25 5 2 3 1 0♦ Other 19 2 1 8 4 4 0
Falls into water 166 39 105 64 11 19 20 23 15 19 15 38 0 0Unknown 1 0 1 1 0 0 0 0 0 0 0 0 0 0
Non recreational‡ 357 37 55 24 42 32 84 37 78 39 97 61 1 100
Boating 28 8 5 9 5 12 8 10 7 9 3 3 0 0Aquatic 16 4 2 4 7 17 4 5 2 3 1 1 0 0Using bathtub 225 63 46 84 23 55 46 55 43 55 67 69 0 0Falls into water 53 15 1 2 3 7 12 14 19 24 18 19 0 0Unknown 35 10 1 2 4 10 14 17 7 9 8 8 1 100
Land & air transport 173 18 16 7 33 25 57 25 45 23 22 14 0 0
TOTAL 953 100 234 25 132 14 228 24 200 21 158 17 1 0
Annex 3 PROPORTION* OF ALL DROWNINGS† BY T YPE AND PURPOSE OF ACTIVIT Y, BY AGE AND SEX, C ANADA 1991-2000 (n=5,535)
* Values in unshaded areas refer to shaded totals above; bottom row percents are proportion of 10-year total at left† Codes are E910, E830, E832 (WHO 1977) ‡ Non recreational drownings include occupational, daily living, rescue, other & unknown incidents§ Includes 9 victims of unknown sex, imputed maleSource: The Canadian Red Cross Society & the Canadian Surveillance System for Water-Related Fatalities, 2005

McGill UniversityHealth Centre
For more information, please contact:
Canadian Red Cross170 Metcalfe Street, Suite 300
Ottawa, Ontario, Canada K2P 2P2(613) 740-1900 Fax: (613) 740-1911
www.redcross.ca
Ces modules sont aussi publiés en français.
Canadian Red Cross
FOR OTHER MODULES IN THIS SERIES, PLEASE VISIT OUR WEBSITE ATwww.redcross.ca/drownings or www.croixrouge.ca/noyades