3 4 2 design 82 pr manual dewatering municipal wastewater ... · pdf file3.8 gravity/low...
TRANSCRIPT
3 4 2
82 PR
United StatesEnvironmental ProtectionAgency
Technology Transfer
DesignManual
Municipal EnvironmentalResearch LaboratoryCincinnati OH 45268
Dewatering MunicipalWastewater Sludges
EPA-625/1-82-014 SWib
'<'•
PROCESS DESIGN MANUAL
FOR
DEWATERING MUNICIPAL WASTEWATER SLUDGES
U.S. ENVIRONMENTAL PROTECTION AGENCY
Office of Research and DevelopmentMunicipal Environmental Research Laboratory
October 1982
jf LII^ARY, INTE::MATr->'AL R^FE^EMCE;i CEIiTHE PZP.CZW.*VJi<\i-t' WATER SUPPLYj AMD SAirTATiJv y,:C) f' P.O. Box 133190. 2^09 AD The Hague jij! Tel. (070) S149ii ext 141/142 |
ji RN: 'S'l/G
U.S. ENVIRONMENTAL PROTECTION AGENCYCenter For Environmental Research Information
Cincinnati, Ohio 45268
NOTICE
The mention of manufac tu re r s ' names, t r ade names or commercial products inthis publication is for informational or illustrative purposes and does notconstitute endorsement or recommendation for use by the U. S. EnvironmentalProtection Agency.
1 1
ABSTRACT
This manual presents a critical review of municipal wastewater sludgedewatering process technology. Particular emphasis is given to the developmentof a procedure for the selection and design of a dewatering process.
Included in the manual are discussions of sludge characteristics, dewateringprocesses, their performance capabilities and operational variables, chemicalconditioning, cost and energy considerations, and case-study information.
Dewatering processes discussed are basket centrifuge, low G and high G solidbowl centrifuges, belt filter press, vacuum filter, fixed volume and variablevolume recessed plate filter presses, drying bed, sludge lagoon, andgravity/low pressure devices.
111
ACKNOWLEGEMENTS
There were four groups of participants involved in the preparation of thismanual: (1) the contractor, (2) the authors, (3) the technical directors, and(4) the technical reviewers. The contractor for this project was SCS Engineersof Long Beach, California. The manual was written by personnel fromCulp/Wesner/Culp of Santa Ana, California. Technical direction was provided byU. S. Environmental Protection Agency (EPA) personnel from the Office ofResearch and Development in Cincinnati, Ohio. The technical reviewers wereexperts in wastewater treatment plant sludge dewatering and included univer-sity professors, wastewater equipment manufacturers, consultants, and govern-ment officials. Each reviewer provided an invaluable constructive critique ofthe manual. The membership of each group is listed below.
MANUAL PREPARATIONCulp/Wesner/Culp, Santa Ana, CA
Authors: Robert C. GumermanBruce E. Burris
In-house Review: Gordon L. Culp
Production Staff: Linda McKinney, Joanne Vogelsang, Al Herron (illustrations)
TECHNICAL DIRECTION
Project Officer: Roland V. Villiers, MERL, EPA, Cincinnati, OH
Technical Directors: Joseph B. Farrell, MERL, EPA, Cincinnati, OHJames E. Smith, Jr., CERI , EPA, Cincinnati, OH
TECHNICAL REVIEW1. Richard T. Moll, Sharpies-Stokes, Pennwalt Corporation, Warminster, PA2. Walter E. Garrison, Los Angeles County Sanitation Districts, Whittier, CA3. Thomas J. LeBrun, Los Angeles County Sanitation Districts, Carson, CA4. Albert B. Pincince, Camp, Dresser and McKee, Boston, MA5. John T. Novak, Virginia Polytechnic and State University, Blacksburg, VA6. Tom Komline, Komline-Sanderson, Peapack, NJ7. Paul R. Erickson, Rexnord Corporation, Milwaukee, WI8. Kenneth A. Pietila, Rexnord Corporation, Milwaukee, WI9. Stephen H. Silverman, KHD Humboldt Wedag, Atlanta, GA
10. E. D. Simmons, Passavant Corporation, Birmingham, AL11. Denis Lussier, CERI, EPA, Cincinnati, OH12. James F. Wheeler, OWPO, EPA, Washington, D.C.13. Charles F. von Dreusche, Jr., Nichols Engineering & Research Corporation,
Belle Mead, NJ14. David DiGregorio, Envirotech, Salt Lake City, UT15. Bala Krishnan, OEET, EPA, Washington, D.C.16. Robert Bastian, OWPO, EPA, Washington, D.C.17. Alan F. Cassel, Water Pollution Control Division, Arlington, VA18. Glenn Reierstad, Bird Machine Company, South Walpole, MA
iv
CONTENTS
Chapter Page
ABSTRACT iiiACKNOWLEDGEMENTS ivCONTENTS vLIST OF FIGURES viiiLIST OF TABLES xii
INTRODUCTION
1.1 Purpose and Scope 11.2 Objectives of Dewatering 21.3 Location of the Dewatering Process 21.4 Guide to Intended Use 21.5 References 4
SLUDGE CHARACTERISTICS AFFECTING DEWATERING
2.1 Introduction 52.2 Characteristics Affecting Dewatering 52.3 References 8
DEWATERING PROCESS DESCRIPTIONS
3.1 Introduction 93.2 Centrifugation 103.3 Belt Press Filtration 223.4 Vacuum Filtration 273.5 Pressure Filtration 303.6 Drying Bed 363.7 Sludge Lagoon 423.8 Gravity/Low Pressure Dewatering 433.9 References 47
CAPABILITIES OF DEWATERING PROCESSES
4.1 Introduction 494.2 Performance Capabilities of Mechanical
Dewatering Processes 504.3 Process Operational Variables Which Affect
Dewatering Results 564.4 Effect of Dewatering on Sludge Volume 604.5 References 64
CONTENTS ( c o n t i n u e d )
Chapter Page
5 CHEMICALS USED IN DEWATERING
5.1 Introduction 675.2 Ferric Chloride 695.3 Lime 705.4 Polymers 715.5 Waste Pickle Liquor (Ferrous Chloride) 715.6 References 72
6 STRATEGY FOR DEWATERING PROCESS SELECTION
6 . 1 Introduction 736.2 Stage 1 - Ini t ia l Screening of Dewatering
Processes 766.3 Stage 2 - Ini t ia l Cost Evaluation 926.4 Stage 3 - Laboratory Testing 966.5 Stage 4 - Field Testing 1026.6 Stage 5 - Final Evaluation Based on Detailed
Design Parameters 1056.7 References 107
7 COMPARATIVE COST ANALYSES OF SLUDGE TREATMENT ANDDISPOSAL SYSTEMS
7.1 Introduction 1107.2 Cost Comparison for One Ton Per Day Sludge
Handling Systems 1117.3 Cost Comparison for Five Ton Per Day Sludge
Handling Systems 1117.4 Cost Comparison for Fifty Ton Per Day Sludge
Handling Systems 1147.5 References 121
8 ENERGY CONSIDERATIONS IN DEWATERING PROCESS SELECTION
8.1 Introduction 1228.2 Direct Energy Requirements for Dewatering 1228.3 Indirect Energy Requirements for Dewatering 1258.4 Total Energy Requirements for Dewatering 1278.5 References 128
V I
CONTENTS ( c o n t i n u e d )
Chapter Page
SUMMARY OF RECENT SIDE-BY-SIDE COMPARISONS OFDEWATERING PROCESSES AT TEN TREATMENT PLANTS
9.1 Introduction 1309.2 County Sanitation Districts of Los Angeles
County (California) 1309.3 County Sanitation Districts of Orange County
(California) 1349.4 Irvine Ranch Water District (California) 1369.5 Metropolitan Denver Sewage Disposal District
No. 1 (Colorado) 1379.6 Metropolitan Sanitary District of Greater
Chicago (Illinois) 1409.7 Middlesex County Sewerage Authority
(New Jersey) 1429.8 Milwaukee Metropolitan Sewerage District
(Wisconsin) 1439.9 Nassau County (New York) 1449.10 San Jose-Santa Clara Water Pollution
Control Plant (California) 1459.11 Blue Plains Wastewater Treatment Plant
(District of Columbia) 1489 .12 References 151
APPENDIX AAPPENDIX B
APPENDIX C
BIBLIOGRAPHY
MANUFACTURERS OF DEWATERING EQUIPMENTEXAMPLE CALCULATIONS SHOWING SLUDGE VOLUMES
PRODUCED BY DIFFERENT DEWATERING TECHNIQUESCOST OF DEWATERING EQUIPMENT
154
157160
199
v n
FIGURES
Number Page
3-1 Basket Centrifuge in Sludge Feed and Sludge
Plowing Cycles 11
3-2 Continuous Countercurrent Solid Bowl Centrifuge 14
3-3 Continuous Concurrent Solid Bowl Centrifuge 15
3-4 Nomograph and Equation Used to Calculate G-Force
for Solid Bowl Centrifuge 21
3-5 The Three Basic Stages of a Belt Filter Press 23
3-6 Operating Zones of a Rotary Vacuum Filter 27
3-7 Cross Sectional View of a Coil Spring, Belt-Type
Rotary Vacuum Filter 283-8 Cross Sectional View of a Cloth, Belt-Type
Rotary Vacuum Filter 303-9 Cross Section of a Fixed Volume Recessed Plate
Filter Press Assembly 33
3-10 Operational Cycle for a Lasta Diaphragm Filter Press 34
3-11 Operational Cycle for an Envirex-NGK Diaphragm
Filter Press 35
3-12 Cross Section of a Dual Cell Gravity Unit 45
3-13 Cross Section of a Smith & Loveless Concentrator 46
4-1 Dewatered Sludge Cake Percent Solids for Mixturesof Digested Primary (P) and Digested WasteActivated Sludge (WAS) 51
4-2 Dewatered Sludge Cake Percent Solids for Raw Primaryand Raw WAS 53
4-3 Dewatered Sludge Cake Percent Solids for Mixtures ofRaw Primary and Secondary Sludges 54
4-4 Dewatered Sludge Cake Percent Solids for Mixtures ofDigested Primary and Secondary Sludge and HeatTreated Primary and Secondary Sludge 55
vm
FIGURES (continued)
Number Page
4-5 Effect of Percent Sludge Solids on Sludge Volume 61
4-6 Effect of Inorganic Conditioning Chemical Dosageon Dewatered Sludge Volume 63
6-1 General Schematic for Solids Handling Showing MostCommonly Used Methods of Treatment and Disposal 74
6-2 Five Stages of Analysis in Selection of aDewatering Process 75
6-3 Process Flow Diagram and Design Criteria for a SolidsHandling System Using Anaerobic Digestion, BeltFilter Press Dewatering, Truck Haul and Composting 93
6-4 Filter Leaf Test Apparatus 97
6-5 Time/Filtrate Volume Vs. Filtrate Volume Plot Usedin Specific Resistance Testing 98
6-6 Use of Specific Resistance to Determine Optimum
Chemical Dosage 99
6-7 Capillary Suction Time (CST) Test Set-up 100
6-8 Filterbelt Press Simulator - Effect of Pressure and
Time on Cake Solids Concentration 1016-9 Filterbelt Press Simulator - Effect of Polymer Dosage
on Cake Solids Concentration 101
6-10 Typical Plot - Variation of Cake Solids ConcentrationWith Centrifugal Acceleration 103
7-1 Sludge Treatment and Disposal Systems Evaluated For5 Ton Per Day Cost Analyses 113
7-2 Sludge Treatment and Disposal Systems Evaluated For50 Ton Per Day Cost Analyses 119
8-1 Direct and Indirect Energy Requirements for SludgeDewatering Processes 126
C-l Construction Cost for Basket Centrifuges 172
IX
FIGURES (continued)
Number Page
C-2 Basket Centrifuges - Building Energy, Process Energyand Maintenance Material Requirements 173
C-3 Basket Centrifuges - Labor and Total Annual Operation
and Maintenance Cost 174
C-4 Construction Cost for Low G. Solid Bowl Centrifuges 175
C-5 Low G Solid Bowl Centrifuges - Building Energy,
Process Energy and Maintenance Material Requirements 176
C-6 Low G Solid Bowl Centrifuges - Labor and Total Annual
Operation and Maintenance Cost 177
C-7 Construction Cost for High G Solid Bowl Centrifuges 178
C-8 High G Solid Bowl Centrifuges - Building Energy,
Process Energy and Maintenance Material Requirements 179C-9 High G Solid Bowl Centrifuges - Labor and Total
Annual Operation and Maintenance Cost 180
C-10 Construction Cost for Belt Filter Press 181
C-ll Belt Filter Press - Building Energy, Process Energy
and Maintenance Material Requirements 182C-12 Belt Filter Press - Labor and Total Annual Operation
and Maintenace Cost 183
C-13 Construction Cost for Vacuum Filters 184
C-14 Vacuum Filters - Building Energy, Process Energy
and Maintenance Material Requirements 185C-15 Vacuum Filters - Labor and Total Annual Operation
and Maintenance Cost 186
C-16 Construction Cost for Recessed Plate Filter Press 187
C-17 Recessed Plate Filter Press - Building Energy, Process
Energy and Maintenance Material Requirements 188C-18 Recessed Plate Filter Press - Labor and Total Annual
Operation and Maintenance Cost 189
FIGURES (continued)
Number Page
C-19 Construction Cost for Diaphragm Filter Press 190
C-20 Diaphragm Filter Press - Building Energy, ProcessEnergy and Maintenance Material Requirements 191
C-21 Diaphragm Filter Press - Labor and Total Annual
Operation and Maintenance Cost 192
C-22 Construction Cost for Sand Drying Beds 193
C-23 Sand Drying Beds - Diesel Fuel and Maintenance
Material Requirements 194C-24 Sand Drying Beds - Labor and Total Annual Operation
and Maintenance Cost 195
C-25 Construction Cost for Sludge Dewatering Lagoons 196
C-26 Sludge Dewatering Lagoons - Diesel Fuel and
Maintenance Material Requirements 197C-27 Sludge Dewatering Lagoons - Labor and Total Annual
Operation and Maintenance Cost 198
XI
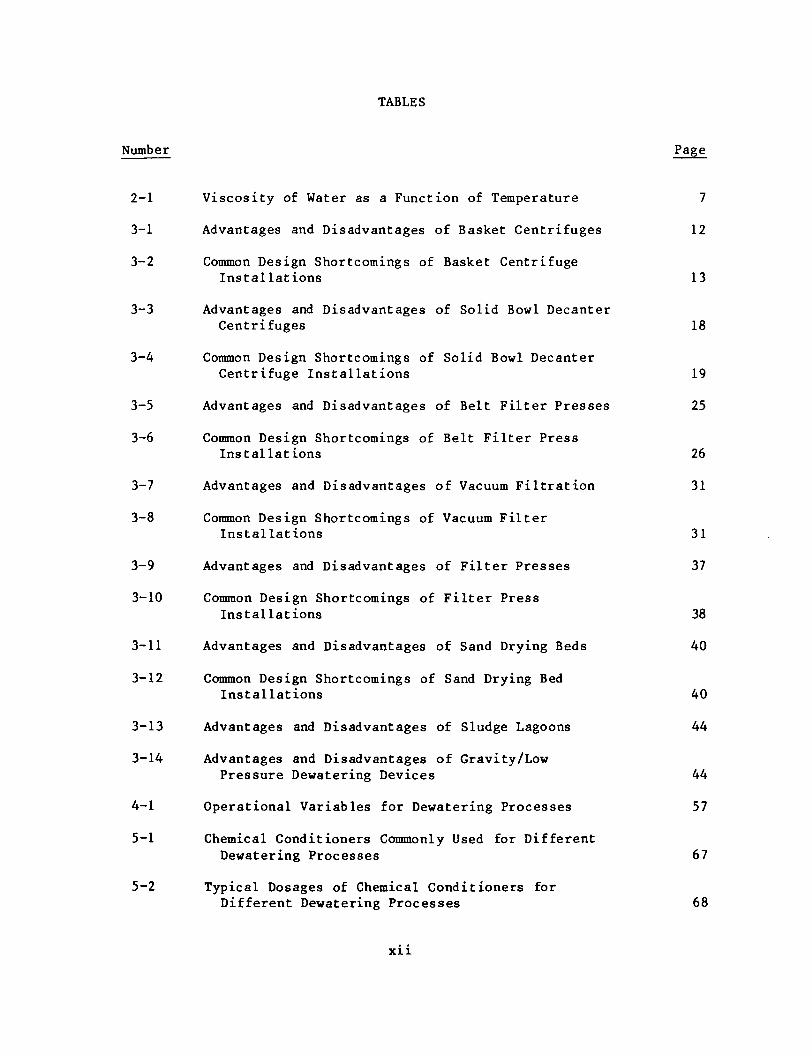
TABLES
Number Page
2-1 Viscosity of Water as a Function of Temperature 7
3-1 Advantages and Disadvantages of Basket Centrifuges 12
3-2 Common Design Shortcomings of Basket Centrifuge
Installations 13
3-3 Advantages and Disadvantages of Solid Bowl DecanterCentrifuges 18
3-4 Common Design Shortcomings of Solid Bowl Decanter
Centrifuge Installations 19
3-5 Advantages and Disadvantages of Belt Filter Presses 25
3-6 Common Design Shortcomings of Belt Filter Press
Installations 26
3-7 Advantages and Disadvantages of Vacuum Filtration 31
3-8 Common Design Shortcomings of Vacuum Filter
Installations 31
3-9 Advantages and Disadvantages of Filter Presses 37
3-10 Common Design Shortcomings of Filter Press
Installations 383-11 Advantages and Disadvantages of Sand Drying Beds 403-12 Common Design Shortcomings of Sand Drying Bed
Installations 40
3-13 Advantages and Disadvantages of Sludge Lagoons 44
3-14 Advantages and Disadvantages of Gravity/Low
Pressure Dewatering Devices 44
4-1 Operational Variables for Dewatering Processes 57
5-1 Chemical Conditioners Commonly Used for Different
Dewatering Processes 675-2 Typical Dosages of Chemical Conditioners for
Different Dewatering Processes 68
XII
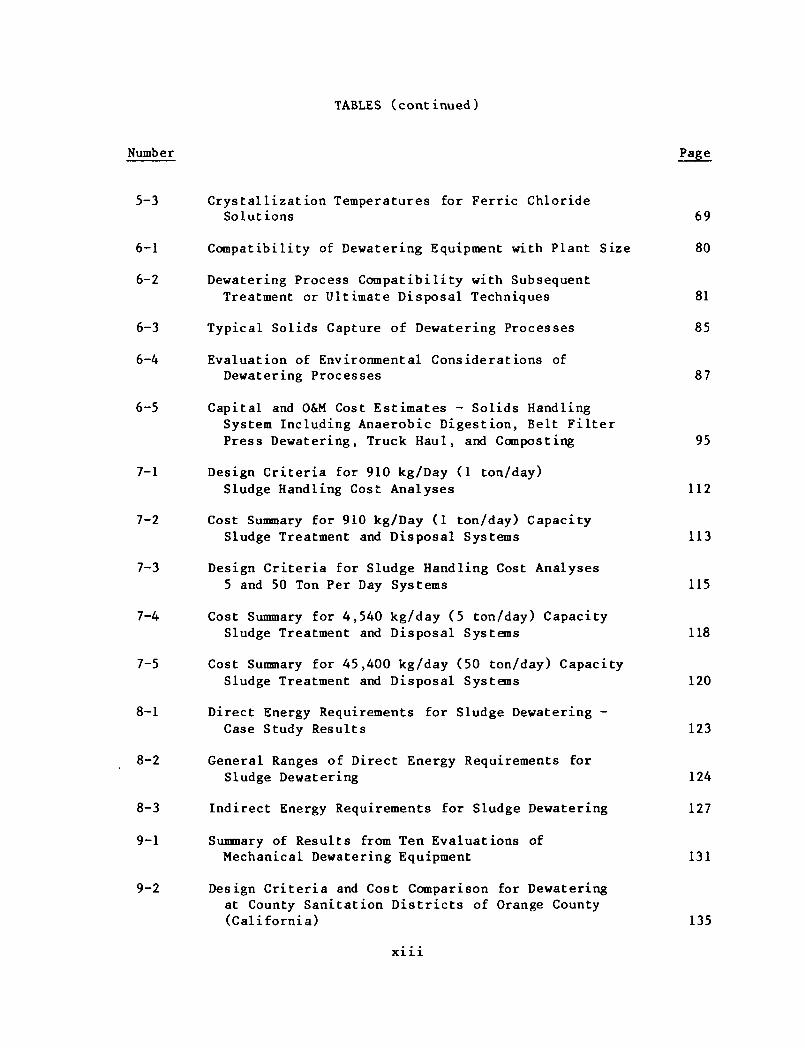
TABLES (continued)
Number Page
5-3 Crystallization Temperatures for Ferric Chloride
Solutions 69
6-1 Compatibility of Dewatering Equipment with Plant Size 80
6-2 Dewatering Process Compatibility with Subsequent
Treatment or Ultimate Disposal Techniques 81
6-3 Typical Solids Capture of Dewatering Processes 85
6-4 Evaluation of Environmental Considerations of
Dewatering Processes 876-5 Capital and O&M Cost Estimates - Solids Handling
System Including Anaerobic Digestion, Belt FilterPress Dewatering, Truck Haul, and Composting 95
7-1 Design Criteria for 910 kg/Day (1 ton/day)Sludge Handling Cost Analyses 112
7-2 Cost Summary for 910 kg/Day (1 ton/day) CapacitySludge Treatment and Disposal Systems 113
7-3 Design Criteria for Sludge Handling Cost Analyses5 and 50 Ton Per Day Systems 115
7-4 Cost Summary for 4,540 kg/day (5 ton/day) CapacitySludge Treatment and Disposal Systems 118
7-5 Cost Summary for 45,400 kg/day (50 ton/day) CapacitySludge Treatment and Disposal Systems 120
8-1 Direct Energy Requirements for Sludge Dewatering -Case Study Results 123
8-2 General Ranges of Direct Energy Requirements for
Sludge Dewatering 124
8-3 Indirect Energy Requirements for Sludge Dewatering 127
9-1 Summary of Results from Ten Evaluations of
Mechanical Dewatering Equipment 1319-2 Design Criteria and Cost Comparison for Dewatering
at County Sanitation Districts of Orange County(California) 135
xiii
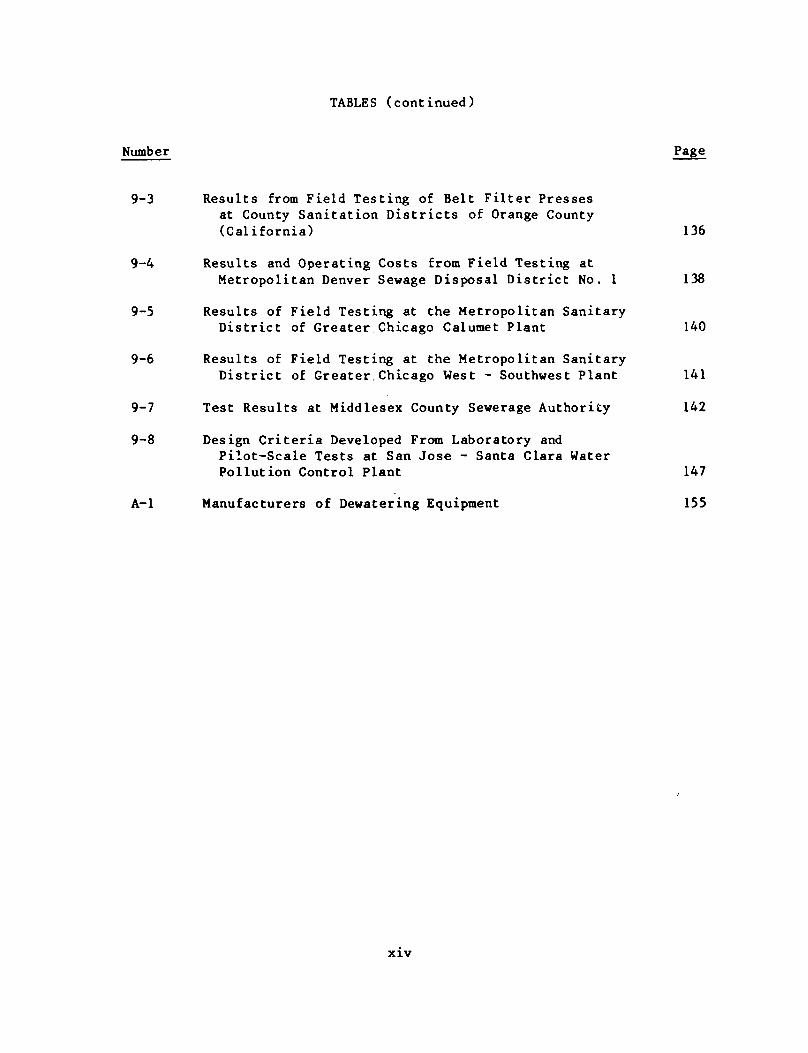
TABLES (continued)
Number Page
9-3 Results from Field Testing of Belt Filter Pressesat County Sanitation Districts of Orange County(California) 136
9-4 Results and Operating Costs from Field Testing atMetropolitan Denver Sewage Disposal District No. 1 138
9-5 Results of Field Testing at the Metropolitan SanitaryDistrict of Greater Chicago Calumet Plant 140
9-6 Results of Field Testing at the Metropolitan Sanitary
District of Greater.Chicago West - Southwest Plant 141
9-7 Test Results at Middlesex County Sewerage Authority 142
9-8 Design Criteria Developed From Laboratory and
Pilot-Scale Tests at San Jose - Santa Clara Water
Pollution Control Plant 147A-l Manufacturers of Dewatering Equipment 155
x i v
Chapter 1
INTRODUCTION
1.1 Purpose and Scope
This manual has been prepared to present u p - t o - d a t e in format ion on dewateringp r o c e s s e s a p p l i c a b l e to municipal was tewater s l u d g e , as w e l l as to present as t r a t e g y to be used in the s e l e c t i o n of these p r o c e s s e s . The manual bothcomplements and supplements those chapters i n the EPA - Proces s Des ign Manualfor Sludge Treatment and D i s p o s a l that d i s c u s s c o n d i t i o n i n g and dewatering( 1 ) . S i g n i f i c a n t advances have been made in dewatering t e c h n o l o g y s i n c ep r e p a r a t i o n of the l a t t e r manual.
Information is presented on design parameters, performance capabilities,design deficiencies, and cost and energy requirements for all dewateringprocesses. The manual specifically discusses those processes where the mostextensive progress has been made including centrifugation, belt press filtra-tion, and pressure filtration.
The manual is current as of the summer of 1982 and includes detaileddiscussions of and presentation of case history information on the newerprocess equipment, including solid bowl centrifuges with backdrive capabilityand optimized bowl design, third generation belt filter presses, and diaphragmfilter presses. Provided also are the capabilities of these and other dewater-ing processes by presenting data from full-scale field testing and operatinginstallations. Information presented is restricted to sludges produced duringprimary and secondary wastewater treatment. Chemical sludges produced duringadvanced wastewater treatment are not considered.
In general, the manual has been prepared for use by experienced engineersinvolved in the design and selection/specification of dewatering equipment.Federal, state, and local decision-making officials , however, will also finduseful information here. Little background information is presented on solidshandling processes other than dewatering, although the strategy approachpresented for the selection of a dewatering process is strongly dependent onanalysis of the entire sludge handling and disposal operation. For moreinformation on sludge handling processes, refer to the references at the endof each chapter and to the Bibliography.
The major types of dewatering processes discussed in this manual include:
CentrifugationBasket CentrifugesSolid Bowl Centrifuges - high G and low G
Belt Press FiltrationVacuum FiltrationPressure Filtration
Fixed VolumeVariable Volume
Drying BedsSludge LagoonsGravity/Low Pressure Dewatering
All of these are in common usage today, although processes such as the basketcentrifuge and the vacuum filter are rarely seen in new installations. Themanual does not discuss processes which have been installed at one or twoplants or processes which do not have a proven background of performance.
1.2 Objectives of Dewatering
The general objectives of dewatering are to remove water and thereby reducethe sludge volume, to produce a sludge which behaves as a solid and not aliquid, and to reduce the cost of subsequent treatment and disposal processes.No generally accepted lower limit exists for the percent solids content of adewatered sludge. In many cases, the lower limit is set by the requirementsfor subsequent treatment and disposal. However, the lower limit is alwayssignificantly higher than the percent solids content of a thickened sludge.This manual considers the use of low pressure first generation type beltpresses which dewater sludge to a 10-12% solids concentration, as well asdrying beds which produce a 60-702 solids content cake.
1.3 Location of the Dewatering Process
The type and order of processes used for solids treatment, dewatering,transport, and disposal vary widely from plant to plant. Generally however,the dewatering process is preceded by a stabilization process, such as anaero-bic or aerobic digestion, thickening by either gravity, centrifugation or airflotation, and chemical or heat treatment conditioning. In some cases, rawsludge, particularly raw primary sludge, may be dewatered directly, althoughthe method of ultimate disposal would have to be considered in such adecision. After the dewatering operation, further stabilization may beprovided by composting, volume and organic reduction may be accomplished byincineration, or the dewatered sludge may be ultimately disposed of bytransport to a landfill or a site for landspreading.
1.4 Guide To Intended Use
This manual is organized to allow users to locate particular information andto concentrate on specific areas of interest as easily as possible. The
following brief chapter and appendix descriptions are provided as anintroduction to the organization of the manual.
Chapter 2 - Sludge Characteristics Affecting Dewatering
Seven sludge characteristics which significantly affect dewateringcapabilities and conditioning requirements are discussed along with theinterrelationships between these characteristics.
Chapter 3 - Dewatering Process Descriptions
Descriptions are presented for dewatering processes in common usage. Includedin these descriptions are operational principles, key advantages and disadvan-tages, and common design shortcomings.
Chapter 4 - Capabilities of Dewatering Processes
Performance capabilities of dewatering processes are discussed for a varietyof different types of sludge and sludge mixtures. Graphic presentations areincluded to illustrate the capabilities of dewatering processes. The impact ofprocess operational variables on dewatering results and the influence ofdewatering on sludge volume are also discussed.
Chapter 5 - Chemicals Used in Dewatering
Major conditioning chemicals used in dewatering, their applications andtypical conditioning requirements are discussed. Important considerationswhich the designer should recognize in addition to performance and cost areincluded.
Chapter 6 - Strategy for Dewatering Process Selection
A strategy applicable to selection of a dewatering process for new or existingfacilities is described. Five stages of analysis comprise this strategy, whichis a progressive selection procedure. Processes are given increasing scrutinyas more detailed cost, operational, and design data are collected.
Chapter 7 - Comparative Cost Analyses of Sludge Treatment and Disposal Systems
Comparative cost analyses are presented for three sizes of sludge handlingsystems: 910, 4,540 and 45,400 kg/day of dry sludge solids. Design criteriaand flow diagrams are presented for each system evaluated, and a ranking ofsystems based upon total annual cost is presented.
Chapter 8 - Energy Considerations in Dewatering Process Selection
Direct energy requirements for dewatering and indirect energy requirementsassociated with production of conditioning chemicals are described and quanti-fied. Graphic and tabular comparisons are included for each dewateringprocess.
Chapter 9 - Summary of Recent Side-By-Side Comparisons of DewateringProcesses at Ten Treatment Plants
Evaluations conducted by ten large u t i l i t ies in various parts of the U.S. aredescribed. The u t i l i t i e s ' findings, conclusions, and progress made to daterelative to installation of additional dewatering equipment are presented.
Appendix A - Manufacturers of Dewatering Equipment
An up-to-date listing of manufacturers of centrifuges, belt fi l ter presses,vacuum f i l ters , f i l ter presses, and drying bed systems is presented.
Appendix B - Example Calculations Showing Sludge Volumes Produced ByDifferent Dewatering Processes
Example calculations are presented for major dewatering processes. Thecalculations are self descriptive and are the basis for several figures inChapter 4.
Appendix C - Cost of Dewatering Equipment
Construction and operation and maintenance cost curves are presented for ninedewatering processes. These construction cost estimates are for installedequipment, and include all concrete structures, housing, pipes and valves,electrical and instrumentation equipment and installation labor. Operation andmaintenance requirements are presented individually for labor, building elec-t r i ca l , process electrical, diesel fuel, and maintenance materials. A completedescription of the design assumptions used for the development of the costdata is presented.
1.5 References
"Process Design Manual For Sludge Treatment and Disposal," USEPA - Centerfor Environmental Research Information, Cincinnati, Ohio, 45268,EPA-625/1-79/011, September 1979.
Chapter 2
SLUDGE CHARACTERISTICS AFFECTING DEWATERING
2.1 Introduction
Many factors influence the dewaterability of a sludge. They include the sourceof the sludge and prior treatment or storage which can change the sludgecharacteristics prior to dewatering. A number of characteristics can be usedto define the ability of a sludge to be dewatered. Some of these characteris-tics are readily measured with equipment available at most plants, whileothers are difficult or impossible for the plant operator to measure inday-to-day operation, and can only be measured with sophisticated analyticaltechniques and equipment.
2.2 Characteristics Affecting Dewatering
2.2.1 General Considerations
In general, all characteristics relate to the difficulty of forcing sludgesolids closer together, or to the difficulty of water movement through thevoids between the sludge solids. The purpose of sludge conditioning is tocounteract adverse characteristics which decrease the rate or degree of waterremoval.
The sludge characteristics which most significantly affect dewatering andconditioning requirements are:
Particle surface charge and hydrationParticle sizeCompressibilitySludge temperatureRatio of volatile solids to fixed solidsSludge pHSepticity
These characteristics and their interrelationships are discussed in thefollowing sections.
2.2.2 Particle Surface Charge and Hydration
Sludge particles have a negative surface charge and repel each other as theyare forced together. This repulsive force increases exponentially as thesludge particles are forced closer together. Additionally, sludge particlesweakly attract water molecules to their surface either by adsorption or bycapillary action between particles. Although the water is only weakly held atthe particle surface, it does interfere with dewatering.
Conditioning chemicals are used to overcome the effects of surface charge andsurface hydration. Typically used chemicals are organic polymers, lime, andferric chloride. Generally they act by reducing or eliminating the repulsiveforce, thus permitting the particles to come together or flocculate. Water canbe more readily removed at a higher rate during the subsequent mechanicaldewatering.
2.2.3 Particle Size
Particle size is generally recognized as the most important factor influencingdewaterability. As average particle size decreases, the surface area for agiven sludge mass increases. The effects of increasing the surface areainclude:
• Greater electrical repulsion between sludge particles due to a largerarea of negatively charged surface. ,
• Greater frictional resistance to the movement of water.
• Greater attraction of water to the particle surface due to moreadsorption sites.
Particle size is influenced by both the sludge source and prior treatment.Generally, primary sludge has a larger average particle size than secondarysludge. This is because fine and colloidal solids tend to pass through theprimary clarifier. Some of these same particles are then removed in thesecondary clarifier along with the less dense, flocculated cellular materialthat is created during biological treatment. Sludge treatment prior todewatering, particularly by aerobic or anaerobic digestion, also decreases theaverage particle size. This is the principal reason that digested sludge ismore difficult to dewater than raw sludge. Other conditions which can resultin decreased particle size are mixing, storage, and sludge transport. There-fore, to maximize the dewaterability of a sludge, use of these conditionsshould be minimized.
2.2.4 Compressibility
If sludge particles were idealized incompressible solids, the solids would notdeform, and the void area between particles would remain constant duringmechanical dewatering. In such an ideal situation, resistance to filtrationwould be proportional to sludge depth, and there would be no increase inresistance to filtration as dewatering progresses. Unfortunately, sludgeparticles are compressible to a degree, which results in particle deformationand a reduction in the void area between particles. This reduction in voidvolume inhibits the movement of water through the compressed portion of thesludge cake, and reduces the rate of dewaterability.
Proper conditioning improves dewaterability primarily by producing aflocculant matrix of solids in relatively clear water prior to initiation offiltration. When this matrix is deposited on a filtering medium, the bulk cakeretains a substantial porosity. However, if an excess pressure drop occursacross the sludge floe, the conditioned sludge cake may collapse, resulting ina decrease in filtration rate. The net result of conditioning is more rapidremoval of water, principally due to the higher rate of water removal at thestart of the filtration cycle.
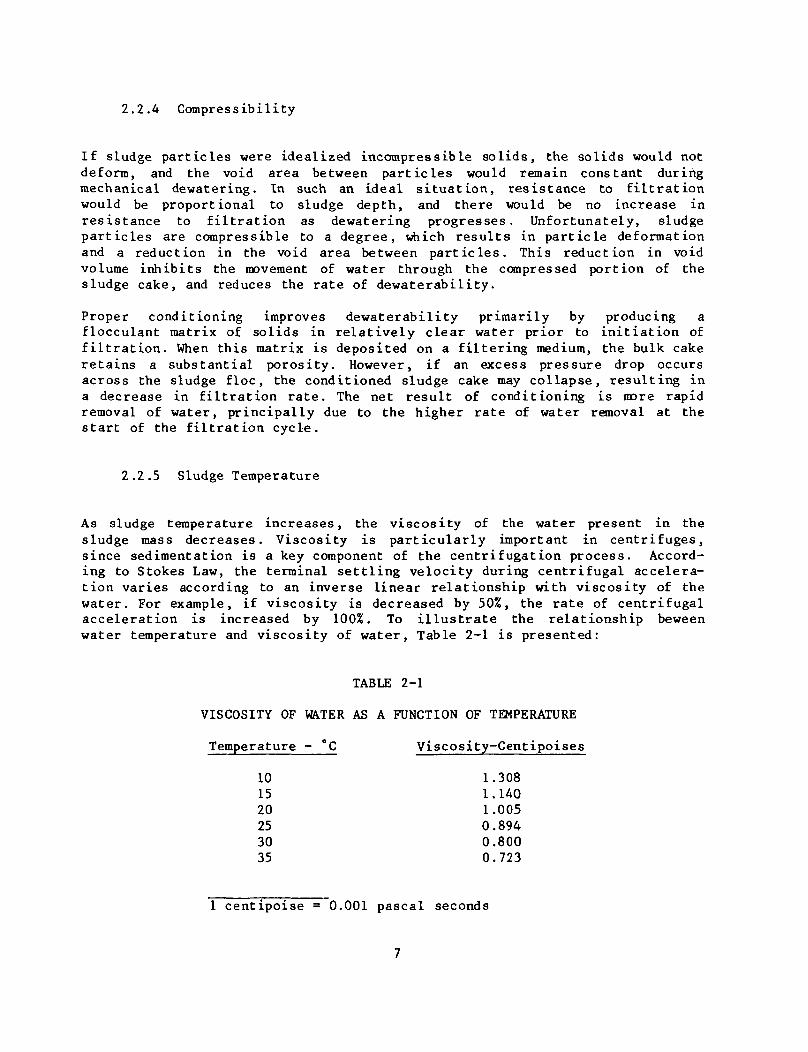
2.2.5 Sludge Temperature
As sludge temperature increases, the viscosity of the water present in thesludge mass decreases. Viscosity is particularly important in centrifuges,since sedimentation is a key component of the centrifugation process. Accord-ing to Stokes Law, the terminal settling velocity during centrifugal accelera-tion varies according to an inverse linear relationship with viscosity of thewater. For example, if viscosity is decreased by 50%, the rate of centrifugalacceleration is increased by 100%. To illustrate the relationship beweenwater temperature and viscosity of water, Table 2-1 is presented:
TABLE 2-1
VISCOSITY OF WA.TER AS A FUNCTION OF TEMPERATURE
Temperature - °C Viscosity-Centipoises
101520253035
1 centipoise =
1.3081.1401.0050.8940.8000.723
0.001 pascal seconds
A complete discussion of the influence of centrifugal acceleration oncentrifuge operation is included in Reference 1.
Dewatering processes which utilize filtration principles would not be expectedfrom theory to be affected by sludge temperature as greatly as centrifuges.Information available from manufacturers of vacuum filters, belt filterpresses, and filter presses confirms this expectation.
2.2.6 Ratio of Volatile Solids to Fixed Solids
Sludges tend to dewater better as the percentage of fixed solids increases,assuming all other factors are equivalent. One high G centrifuge manufacturerutilizes the percentage of fixed solids as a key parameter in sizing of equip-ment (2). (See Section 3.2.2.1 for a description of low G and high G centri-fuges). According to this manufacturer, the cake from centrifugal dewateringof an anaerobically digested mixture of primary and waste activated sludgeshows a 5% increase in its solids concentration when the percentage ofvolatile solids in it decreases from 70% to 50% (2).
2.2.7 Sludge pH
Sludge pH affects the surface charge on sludge particles, as well asinfluences the type of polymer to be used for conditioning. Generally, anionicpolymers are most useful when the sludge is lime conditioned and has a highpH, while cationic polymers are most suitable at pH slightly above or belowneutral.
2.2.8 Septicity
Septic sludge is more difficult to dewater and requires higher dosages ofchemical conditioners than fresh sludge, assuming other conditions are equal.This phenomenon has been experienced at many locations, and is most likely dueto a reduction in the size of sludge particles and to generation of gases thatremain entrained in the sludge.
2.3 References
1. Vesilind, P.A., "Treatment and Disposal of Wastewater Sludges," RevisedEdition, Ann Arbor Science Publishers, Ann Arbor, Michigan, 1980.
2. Personal communication, Richard T. Moll, Manager of Process Engineering,Sharpies-Stokes Division, Pennwalt Corporation, Warminster, Pennsylvania,June 1982.
CHAPTER 3
DEWATERING PROCESS DESCRIPTIONS
3.1 Introduction
A wide variety of mechanical dewatering processes are available, in additionto evaporation/percolation processes such as sand drying beds and sludgelagoons. This chapter briefly discusses for each process its operationalprinciples, key advantages and disadvantages, and design shortcomings.Detailed performance information for each process is presented in Chapter 4.Chemical conditioning requirements for the different dewatering processes arepresented in Chapter 5. The processes which are described and the order inwhich they are presented are as follows:
• CentrifugationBasket centrifugeSolid bowl centrifuge
• Belt press filtration• Vacuum filtration• Pressure filtration - fixed volume and variable volume• Drying bed
Sand drying bedPaved drying bedWedgewater drying bedVacuum-assisted drying bed
• Sludge lagoon• Gravity/low pressure dewatering
Rotating cylindrical gravity dewatering deviceLow pressure belt press
At present, belt fi l ter presses and solid bowl centrifuges are the mechanicaldevices most commonly selected for dewatering municipal wastewater sludges.Vacuum f i l te rs , although commonly installed up to the mid-1970's, are rarelyselected today. Basket centrifuges have never been a common selection formunicipal sludge dewatering. Filter presses have seldom been selected due totheir high capital and operating costs, yet for certain cases where a very drycake is required, a fi l ter press can be cost-effective. The gravity/lowpressure dewatering devices are s t i l l occasionally selected for small plantswhere a lower cake solid concentration is desired or acceptable. Drying bedsand lagoons have commonly been used at small plants which have land availableand in larger plants which have both high evaporation and available land.
A l is t of manufacturers of currently available dewatering equipment iscontained in Appendix A. Although the l i s t is intended to be up-to-date and
complete, it is possible that some manufacturers are excluded. Due to thedynamic nature of the equipment manufacturing business, it is probable thatsome companies on the l ist may in the future discontinue the manufacture ofthe equipment for which they are listed. References such as the Journal WaterPollution Control Federation, Pollution Equipment News, and Water & WastesDigest should be consulted for additional suppliers.
3.2 Centrifugation
Centrifugal dewatering of sludge is a process which uses the force developedby fast rotation of a cylindrical drum or bowl to separate the sludge solidsand liquid. In the basic process, when a sludge slurry is introduced to thecentrifuge, i t is forced against the bowl's interior walls, forming a poolof liquid. Density differences cause the sludge solids and the liquid toseparate into two distinct layers. The sludge solids "cake" and the liquid"centrate" are then separately discharged from the unit. The two types ofcentrifuges used for municipal sludge dewatering, basket and solid bowl, bothoperate on these basic principles. They are differentiated by the method ofsludge feed, magnitude of applied centrifugal force, method of solids andliquid discharge, cost, and performance. A third centrifuge type, thedisc-nozzle centrifuge, has been used for thickening waste activated sludge(WAS), but does not produce a dewatered material. It will not be discussed inthis manual.
3.2.1 Basket Centrifuge
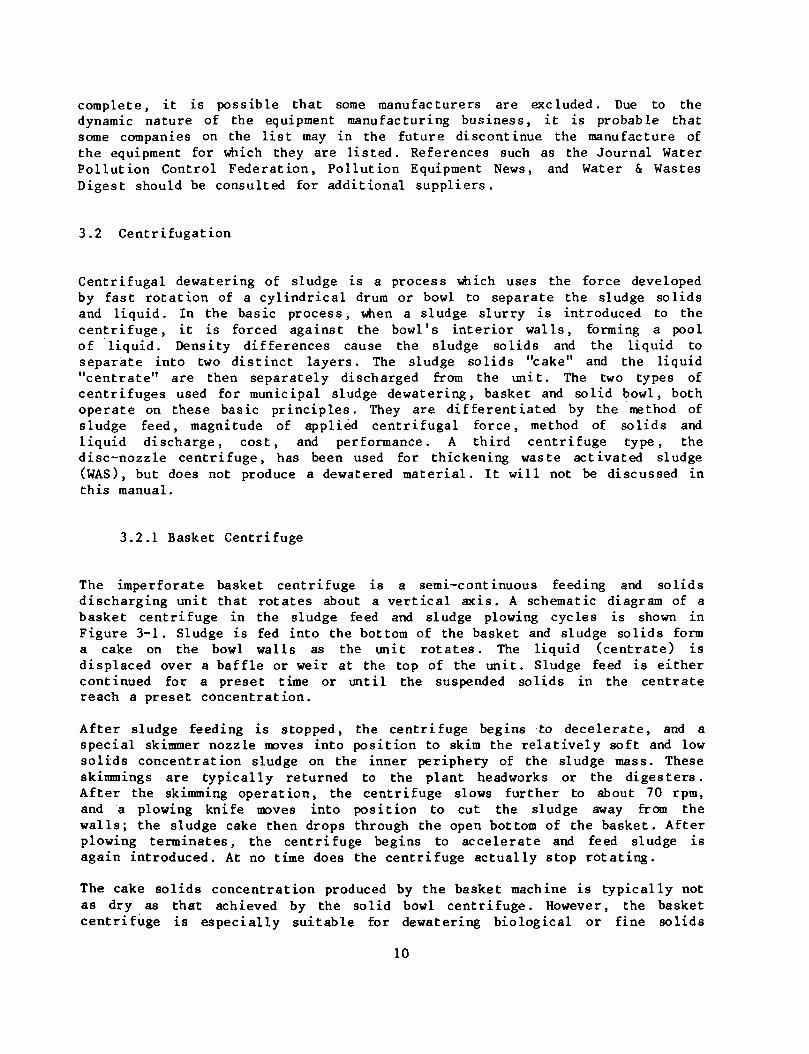
The imperforate basket centrifuge is a semi-continuous feeding and solidsdischarging unit that rotates about a vertical axis. A schematic diagram of abasket centrifuge in the sludge feed and sludge plowing cycles is shown inFigure 3-1. Sludge is fed into the bottom of the basket and sludge solids forma cake on the bowl walls as the unit rotates. The liquid (centrate) isdisplaced over a baffle or weir at the top of the unit. Sludge feed is eithercontinued for a preset time or until the suspended solids in the centratereach a preset concentration.
After sludge feeding is stopped, the centrifuge begins to decelerate, and aspecial skimmer nozzle moves into position to skim the relatively soft and lowsolids concentration sludge on the inner periphery of the sludge mass. Theseskimmings are typically returned to the plant headworks or the digesters.After the skimming operation, the centrifuge slows further to about 70 rpm,and a plowing knife moves into position to cut the sludge away from thewalls; the sludge cake then drops through the open bottom of the basket. Afterplowing terminates, the centrifuge begins to accelerate and feed sludge isagain introduced. At no time does the centrifuge actually stop rotating.
The cake solids concentration produced by the basket machine is typically notas dry as that achieved by the solid bowl centrifuge. However, the basketcentrifuge is especially suitable for dewatering biological or fine solids
10
LIQUID SLUDGE IN
CENTRATEOVERFLOW
PLOWING KNIFERETRACTED
PLOWING KNIFEEXTENDED
BASKET
SLUDGE FEED
SLUDGE PLOWING
DEWATERED SOLOS OUT
FIGURE 3-1BASKET CENTRIFUGE IN SLUDGE FEED AND
SLUDGE PLOWING CYCLES
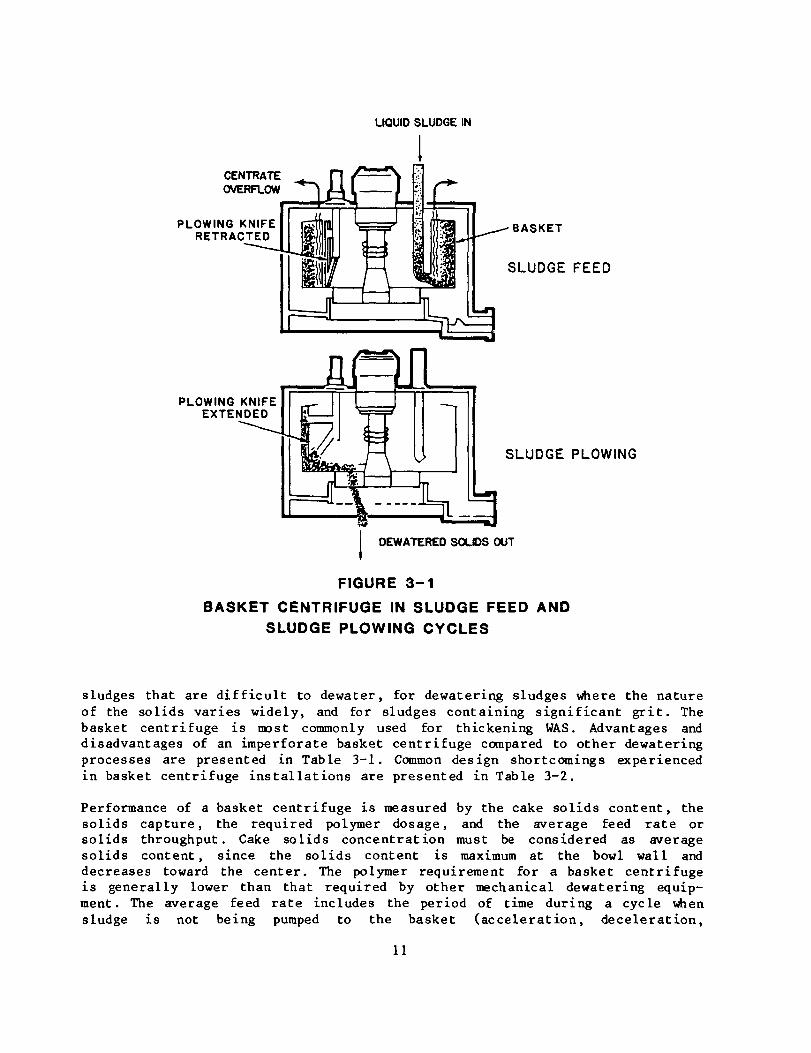
sludges that are difficult to dewater, for dewatering sludges where the natureof the solids varies widely, and for sludges containing significant gri t . Thebasket centrifuge is most commonly used for thickening WAS. Advantages anddisadvantages of an imperforate basket centrifuge compared to other dewateringprocesses are presented in Table 3-1. Common design shortcomings experiencedin basket centrifuge installations are presented in Table 3-2.
Performance of a basket centrifuge is measured by the cake solids content, thesolids capture, the required polymer dosage, and the average feed rate orsolids throughput. Cake solids concentration must be considered as averagesolids content, since the solids content is maximum at the bowl wall anddecreases toward the center. The polymer requirement for a basket centrifugeis generally lower than that required by other mechanical dewatering equip-ment. The average feed rate includes the period of time during a cycle whensludge is not being pumped to the basket (acceleration, deceleration,
11
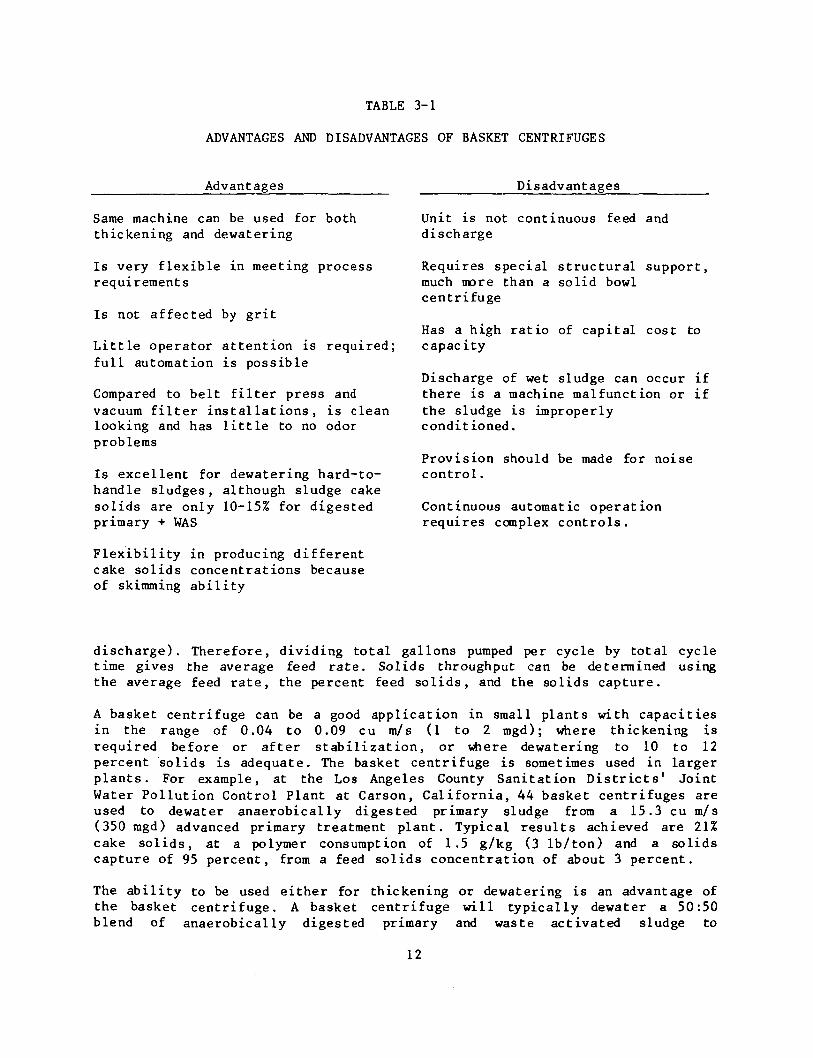
TABLE 3-1
ADVANTAGES AND DISADVANTAGES OF BASKET CENTRIFUGES
Advantages
Same machine can be used for boththickening and dewatering
Is very flexible in meeting processrequirements
Is not affected by grit
Little operator attention is required;full automation is possible
Compared to belt filter press andvacuum filter installations, is cleanlooking and has little to no odorproblems
Is excellent for dewatering hard-to-handle sludges, although sludge cakesolids are only 10-15% for digestedprimary + WAS
Flexibility in producing differentcake solids concentrations becauseof skimming ability
Disadvantages
Unit is not continuous feed anddischarge
Requires special structural support,much more than a solid bowlcentrifuge
Has a high ratio of capital cost tocapacity
Discharge of wet sludge can occur ifthere is a machine malfunction or ifthe sludge is improperlyconditioned.
Provision should be made for noisecontrol.
Continuous automatic operationrequires complex controls.
discharge). Therefore, dividing total gallons pumped per cycle by total cycletime gives the average feed rate. Solids throughput can be determined usingthe average feed rate, the percent feed solids, and the solids capture.
A basket centrifuge can be a good application in small plants with capacitiesin the range of 0.04 to 0.09 cu m/s (1 to 2 mgd); where thickening isrequired before or after stabilization, or where dewatering to 10 to 12percent solids is adequate. The basket centrifuge is sometimes used in largerplants. For example, at the Los Angeles County Sanitation Districts' JointWater Pollution Control Plant at Carson, California, 44 basket centrifuges areused to dewater anaerobically digested primary sludge from a 15.3 cu m/s(350 mgd) advanced primary treatment plant. Typical results achieved are 21%cake solids, at a polymer consumption of 1.5 g/kg (3 lb/ton) and a solidscapture of 95 percent, from a feed solids concentration of about 3 percent.
The ability to be used either for thickening or dewatering is an advantage ofthe basket centrifuge. A basket centrifuge will typically dewater a 50:50blend of anaerobically digested primary and waste activated sludge to
12
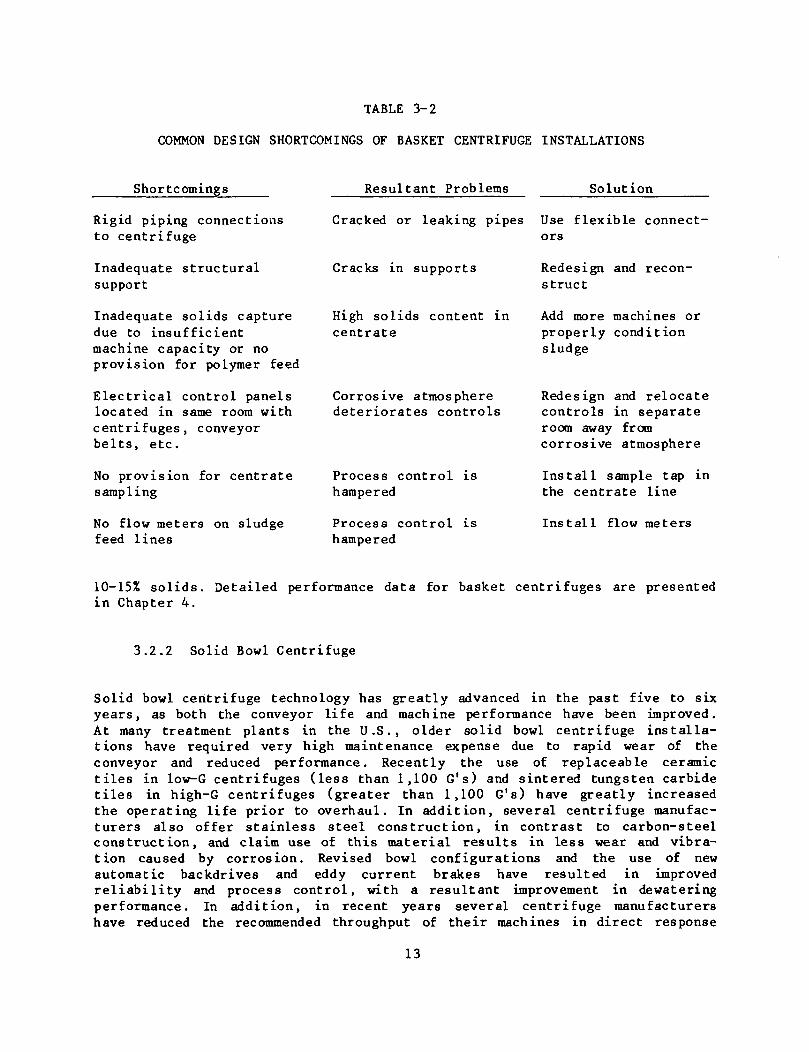
TABLE 3-2
COMMON DESIGN SHORTCOMINGS OF BASKET CENTRIFUGE INSTALLATIONS
Shortcomings Resultant Problems Solution
Rigid piping connectionsto centrifuge
Inadequate structuralsupport
Inadequate solids capturedue to insufficientmachine capacity or noprovision for polymer feed
Electrical control panelslocated in same room withcentrifuges, conveyorbelts, etc.
No provision for centratesampling
No flow meters on sludgefeed lines
Cracked or leaking pipes Use flexible connect-ors
Cracks in supports Redesign and recon-struct
High solids content in Add more machines orcentrate properly condition
sludge
Corrosive atmospheredeteriorates controls
Process control ishampered
Process control ishampered
Redesign and relocatecontrols in separateroom away fromcorrosive atmosphere
Install sample tap inthe centrate line
Install flow meters
10-15% solids. Detailed performance data for basket centrifuges are presentedin Chapter 4.
3.2.2 Solid Bowl Centrifuge
Solid bowl centrifuge technology has greatly advanced in the past five to sixyears, as both the conveyor life and machine performance have been improved.At many treatment plants in the U.S., older solid bowl centrifuge installa-tions have required very high maintenance expense due to rapid wear of theconveyor and reduced performance. Recently the use of replaceable ceramict i les in low-G centrifuges (less than 1,100 G's) and sintered tungsten carbidet i les in high-G centrifuges (greater than 1,100 G's) have greatly increasedthe operating life prior to overhaul. In addition, several centrifuge manufac-turers also offer stainless steel construction, in contrast to carbon-steelconstruction, and claim use of this material results in less wear and vibra-tion caused by corrosion. Revised bowl configurations and the use of newautomatic backdrives and eddy current brakes have resulted in improvedrel iabi l i ty and process control, with a resultant improvement in dewateringperformance. In addition, in recent years several centrifuge manufacturershave reduced the recommended throughput of their machines in direct response
13
to competition from the belt filter press. This has allowed for an increase insolids residence time in the centrifuge and subsequent improvement in cakedryness.
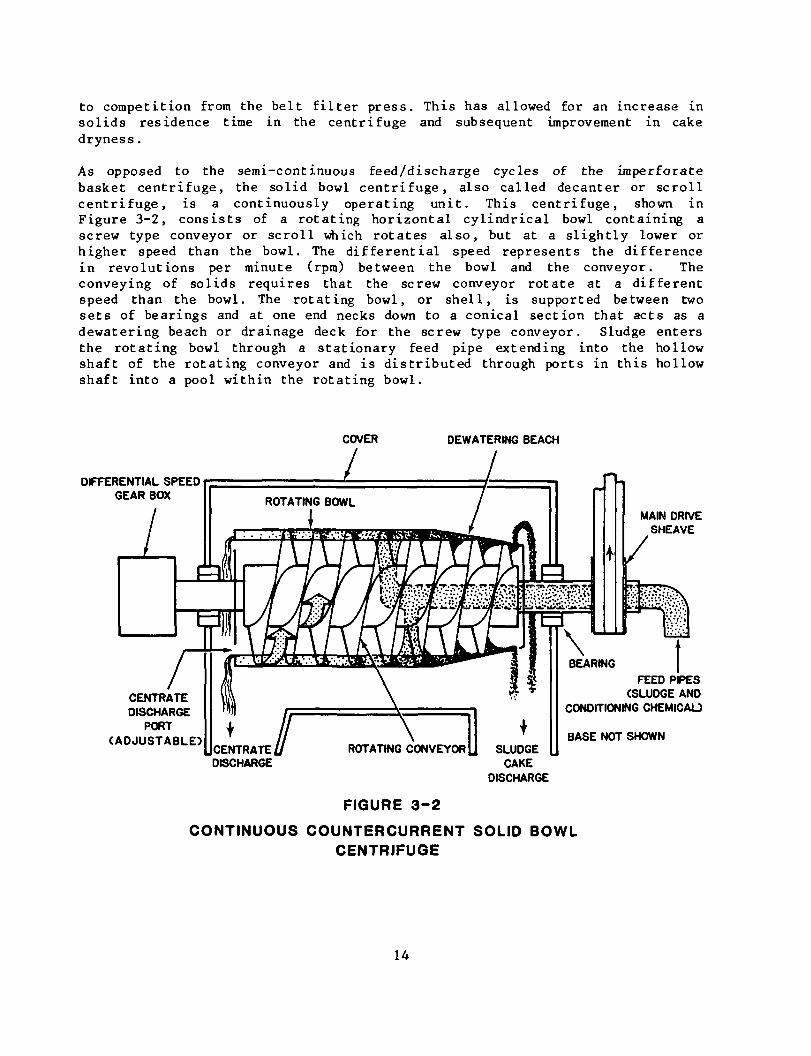
As opposed to the semi-continuous feed/discharge cycles of the iraperforatebasket centrifuge, the solid bowl centrifuge, also called decanter or scrollcentrifuge, is a continuously operating unit. This centrifuge, shown inFigure 3-2, consists of a rotating horizontal cylindrical bowl containing ascrew type conveyor or scroll which rotates also, but at a slightly lower orhigher speed than the bowl. The differential speed represents the differencein revolutions per minute (rpm) between the bowl and the conveyor. Theconveying of solids requires that the screw conveyor rotate at a differentspeed than the bowl. The rotating bowl, or shell, is supported between twosets of bearings and at one end necks down to a conical section that acts as adewatering beach or drainage deck for the screw type conveyor. Sludge entersthe rotating bowl through a stationary feed pipe extending into the hollowshaft of the rotating conveyor and is distributed through ports in this hollowshaft into a pool within the rotating bowl.
COVER DEWATERING BEACH
DIFFERENTIAL SPEEDGEAR BOX
MAIN DRIVESHEAVE
CENTRATEDISCHARGE
PORT(ADJUSTABLE)
BEARING |
FEED PIPES(SLUDGE AND
CONDITIONING CHEMICAL)
BASE NOT SHOWNCENTRATEDISCHARGE
ROTATING CONVEYORU SLUDGECAKE
DISCHARGE
FIGURE 3-2
CONTINUOUS COUNTERCURRENT SOLID BOWLCENTRIFUGE
14
The centrifuge illustrated in Figure 3-2 operates in the countercurrent mode.Influent sludge is added through the feed pipe; under the influence of centri-fugal force, sludge solids settle through the liquid to the bowl wall becausetheir density is greater than that of the liquid. The solids are then movedgradually by the rotating conveyor from left to right across the bowl, up thedewatering beach to outlet ports and from there drop downward into a sludgecake discharge hopper. As the settled sludge solids move from left to rightthrough the bowl toward the sludge cake outlet, progressively finer solids aresettled centrifugally to the rotating bowl wall. The water or centrate drainsfrom the solids on the dewatering beach and back into the pool. Centrate isactually moved from the end of the feed pipe to the left, and is dischargedfrom the bowl through ports in the left end, which is the opposite end of thecentrifuge from the dewatering beach. The location of the centrate removalports is adjustable, and their location establishes the depth of the pool inthe bowl.
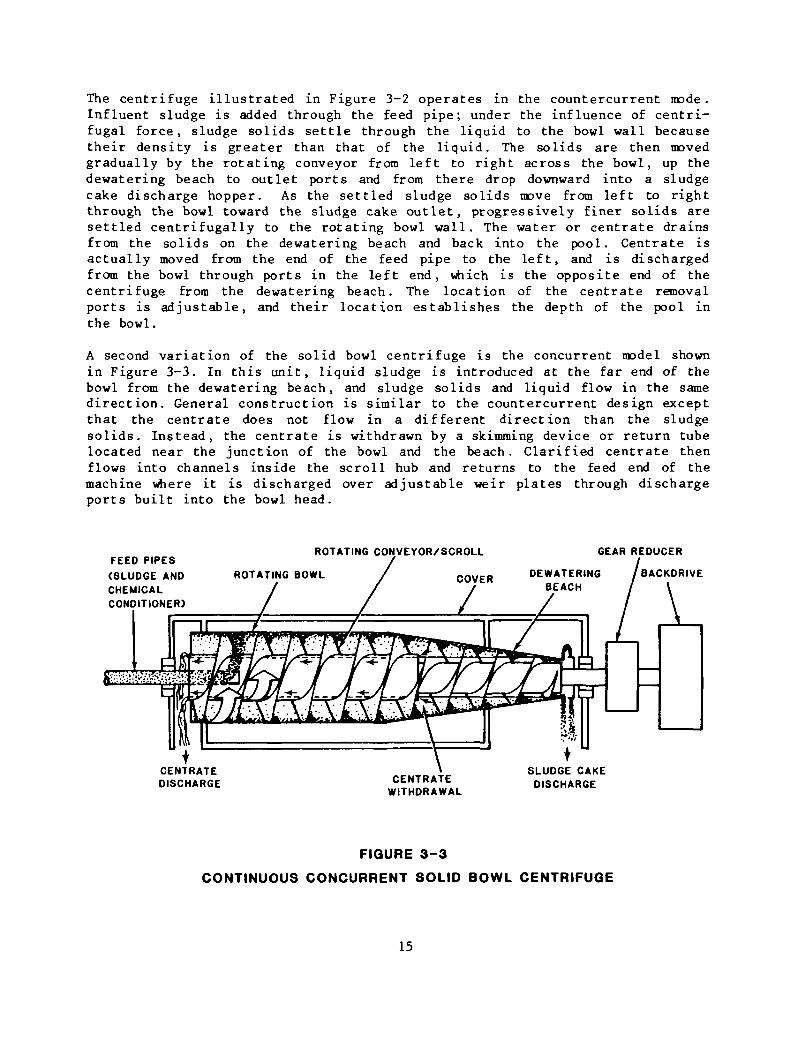
A second variation of the solid bowl centrifuge is the concurrent model shownin Figure 3-3. In this unit, liquid sludge is introduced at the far end of thebowl from the dewatering beach, and sludge solids and liquid flow in the samedirection. General construction is similar to the countercurrent design exceptthat the centrate does not flow in a different direction than the sludgesolids. Instead, the centrate is withdrawn by a skimming device or return tubelocated near the junction of the bowl and the beach. Clarified centrate thenflows into channels inside the scroll hub and returns to the feed end of themachine where it is discharged over adjustable weir plates through dischargeports built into the bowl head.
FEED PIPES(SLUDGE ANDCHEMICALCONDITIONER)
ROTATING CONVEYOR/SCROLL
ROTATING BOWL
GEAR REDUCER
DEWATERING / BACKDRIVE
CENTRATEDISCHARGE CENTRATE
WITHDRAWAL
SLUDGE CAKEDISCHARGE
FIGURE 3-3
CONTINUOUS CONCURRENT SOLID BOWL CENTRIFUGE
15
A relatively new development in solid bowl decanter centrifuges is the use ofa backdrive to control the speed differential between the scroll and the bowl.The objective of the backdrive is to control the differential to give theoptimum solids residence time in the centrifuge and thereby produce theoptimum cake solids content. A backdrive of some type is considered essentialwhen dewatering secondary sludges because of the fine particles present. Thebackdrive function can be accomplished with a hydraulic pump system, an eddycurrent brake, D.C. variable speed motor, or a Reeves type variable speedmotor. The two most common backdrive systems are the hydraulic backdrive andthe eddy current brake.
Cake solids content increases of k% or more relative to machines without abackdrive are achievable, although it must be recognized that the effectivecapacity of the machine is decreased by utilizing a backdrive to produce ahigher solids content cake. A backdrive unit will generally not reduce thequantity of polymer required, but it will increase overall stability ofcentrifuge performance when the feed solids characteristics vary.
The eddy current brake backdrive is commonly provided by one high G centrifugemanufacturer. The eddy current brake is attached to the pinion shaft of thegearbox and consists of a stationary field coil and a brake rotor on theshaft. When a D.C. voltage is applied to the stationary field coil, magneticflux lines are created in the brake rotor. The amount of flux in the rotor isa function of the speed differential between the rotor and the field coil aswell as the D.C. current applied to the field coil. This flux produces eddycurrents which create a resistance to turning, or a braking action. Thus,varying the D.C. voltage applied to the stationary field coil results in achange in the speed differential between the bowl and the scroll.
An automatically-controlled variable speed hydraulic backdrive is commonlyprovided by several low G centrifuge manufacturers to control the speeddifferential between the scroll and the bowl. The differential is controlledto maintain a constant torque on the scroll shaft, with the resulting produc-tion of a high solids content sludge cake. A hydraulic pump and a hydraulicbackdrive motor are the two principal components of the hydraulic backdriveunit. The hydraulic backdrive is a noise producing operation, whereas the eddycurrent brake is silent.
Most centrifuge installations have the centrifuge mounted a few feet above thefloor, and use a belt conveyor to move dewatered cake away. Other methods ofinstalling a solid bowl centrifuge are to put the centrifuge on the secondfloor of a two story building and drop the dewatered cake into either trucksor a storage hopper on the first level; to mount the centrifuge about a footoff the floor and to drop cake into a screw conveyor built into the floor; orto let the centrifuge cake drop into an open throated progressive cavity typepump for transfer of the cake to a truck, incinerator, or storage.
Centrifuge performance is measured by the percent solids of the sludge cake,the percent solids capture, the overall quality of the centrate, the solidsloading rate, and the polymer requirement. The performance of a particularcentrifuge unit will vary with the sludge feed rate and the characteristics ofthe feed sludge, including percent solids, sludge temperature and ash content.
16
Centrifuge performance is also affected by polymer selection and the dosageutilized as well as its point of introduction. Centrifuge performance on aparticular sludge will also vary with bowl and conveyor design, bowl speed,differential speed, and pool volume. Bowl and conveyor design are not vari-able after installation. Although pool depth is variable on solid bowl units,up to several hours of labor may be required to change the pool depth.Increasing the pool depth will normally result in a wetter sludge cake butbetter solids recovery, however, this is not necessarily true on newermachines equipped with an automatic backdrive.
Bowl speed is not normally varied on most centrifuge models once a centrifugeis installed. An increase in bowl speed normally results in a drier sludgecake and better solids recovery, although in some cases it may result inshearing of the sludge floe and a reduction in solids capture. With theaddition of polymer internally into the bowl of the centrifuge, a capabilityavailable from several manufacturers, no shearing occurs since both thepolymer and the solids are up to bowl speed when the formation of the floeoccurs. Conveyor differential speed normally can be varied, yet it may requiresome disassembly of the machine. On centrifuges equipped with an automaticbackdrive, the differential speed can be easily varied. Increasing the differ-ential between the bowl speed and the scroll speed normally results in awetter sludge cake, poorer solids recovery, and higher machine throughput. Onthe other hand, reducing the differential speed produces a dryer cake,increases solids capture, and decreases machine throughput. Operating at toolow a differential speed can cause the pile of solids formed in front of thescroll conveyor blade to increase in overall height such that it infringes onthe clarified liquid area. This may result in the skimming of some fine solidsfrom the top of the cake pile to the centrate, lowering solids capture. Toolow of a differential speed, unless adequately controlled, can also result inplugging the centrifuge, if solids are removed at a slower rate than they arefed to the machine.
Some of the advantages and disadvantages of a solid bowl decanter centrifugecompared with other dewatering processes are presented in Table 3-3, andTable 3-4 l i s t s common design shortcomings associated with solid bowlcentrifuges.
The ability to be used either for thickening or dewatering providesflexibility and is a major advantage for solid bowl centrifuges. For example,a centrifuge can be used to thicken ahead of a fi l ter press, reducing chemicalusage and increasing solids throughput. During periods of downtime of thefilter press, the solid bowl centrifuge can serve as an alternate dewateringdevice. Another advantage of the solid bowl centrifuge for larger plants isthe availability of equipment with the largest sludge throughput capabilityfor single units of any type of dewatering equipment. The larger centrifugesare capable of handling 19 to 44 1/s (300 to 700 gpra) per unit depending onthe sludge's characteristics. The centrifuge also has the ability to handlehigher than design loadings, such as a temporary increase in hydraulic loadingor solids concentration, and the percent solids recovery can usually be main-tained with the addition of more polymer; while the cake solids concentrationwill drop slightly, the centrifuge will stay on line.
17
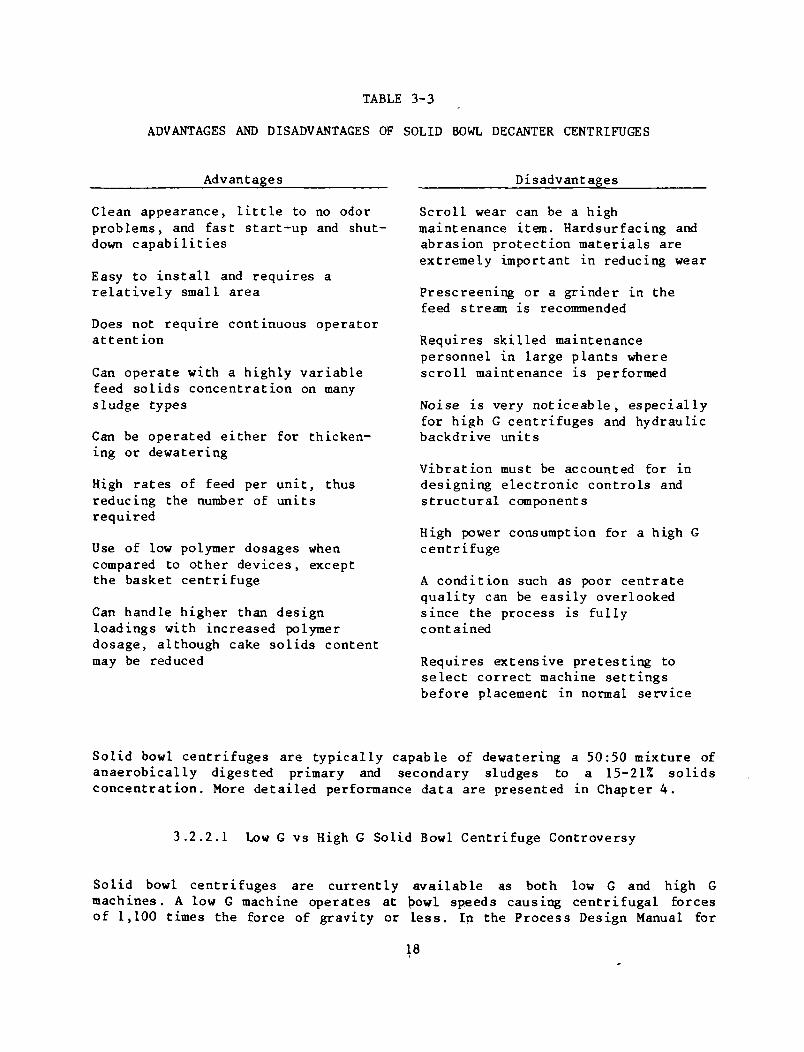
TABLE 3-3
ADVANTAGES AND DISADVANTAGES OF SOLID BOWL DECANTER CENTRIFUGES
Advan tages
Clean appearance, l i t t l e to no odorproblems, and fast start-up and shut-down capabilities
Easy to install and requires arelatively small area
Does not require continuous operatorattention
Can operate with a highly variablefeed solids concentration on manysludge types
Can be operated either for thicken-ing or dewatering
High rates of feed per unit, thusreducing the number of unitsrequired
Use of low polymer dosages whencompared to other devices, exceptthe basket centrifuge
Can handle higher than designloadings with increased polymerdosage, although cake solids contentmay be reduced
Disadvantages
Scroll wear can be a highmaintenance item. Hardsurfacing andabrasion protection materials areextremely important in reducing wear
Prescreening or a grinder in thefeed stream is recommended
Requires skilled maintenancepersonnel in large plants wherescroll maintenance is performed
Noise is very noticeable, especiallyfor high G centrifuges and hydraulicbackdrive units
Vibration must be accounted for indesigning electronic controls andstructural components
High power consumption for a high Gcentrifuge
A condition such as poor centratequality can be easily overlookedsince the process is fullycontained
Requires extensive pretesting toselect correct machine settingsbefore placement in normal service
Solid bowl centrifuges are typically capable of dewatering a 50:50 mixture ofanaerobically digested primary and secondary sludges to a 15-21% solidsconcentration. More detailed performance data are presented in Chapter 4.
3.2.2.1 Low G vs High G Solid Bowl Centrifuge Controversy
Solid bowl centrifuges are currently available as both low G and high Gmachines. A low G machine operates at bowl speeds causing centrifugal forcesof 1,100 times the force of gravity or less. In the Process Design Manual for
18
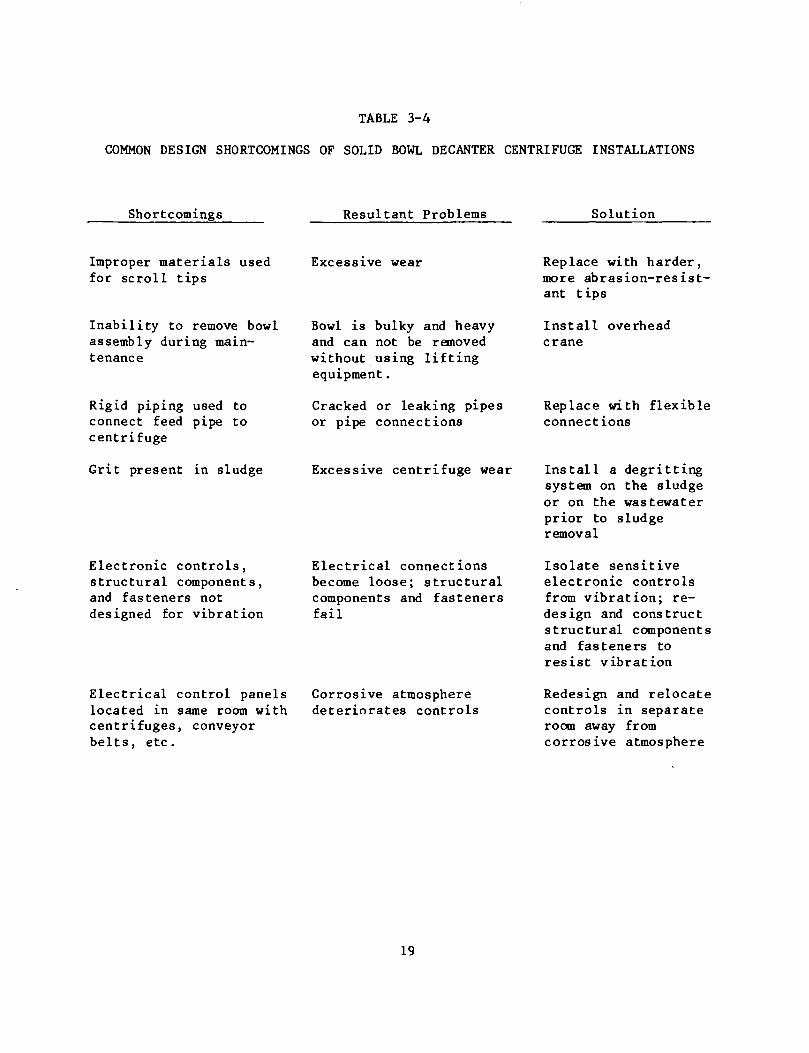
TABLE 3-4
COMMON DESIGN SHORTCOMINGS OF SOLID BOWL DECANTER CENTRIFUGE INSTALLATIONS
Shortcomings Resultant Problems Solution
Improper materials usedfor scroll tips
Inability to remove bowlassembly during main-tenance
Rigid piping used toconnect feed pipe tocentrifuge
Excessive wear
Bowl is bulky and heavyand can not be removedwithout using liftingequipment.
Cracked or leaking pipesor pipe connections
Grit present in sludge Excessive centrifuge wear
Electronic controls,structural components,and fasteners notdesigned for vibration
Electrical control panelslocated in same room withcentrifuges, conveyorbelts, etc.
Electrical connectionsbecome loose; structuralcomponents and fastenersfail
Corrosive atmospheredeteriorates controls
Replace with harder,more abrasion-resist-ant tips
Install overheadcrane
Replace with flexibleconnections
Install a degrittingsystem on the sludgeor on the wastewaterprior to sludgeremoval
Isolate sensitiveelectronic controlsfrom vibration; re-design and constructstructural componentsand fasteners toresist vibration
Redesign and relocatecontrols in separateroom away fromcorrosive atmosphere
19
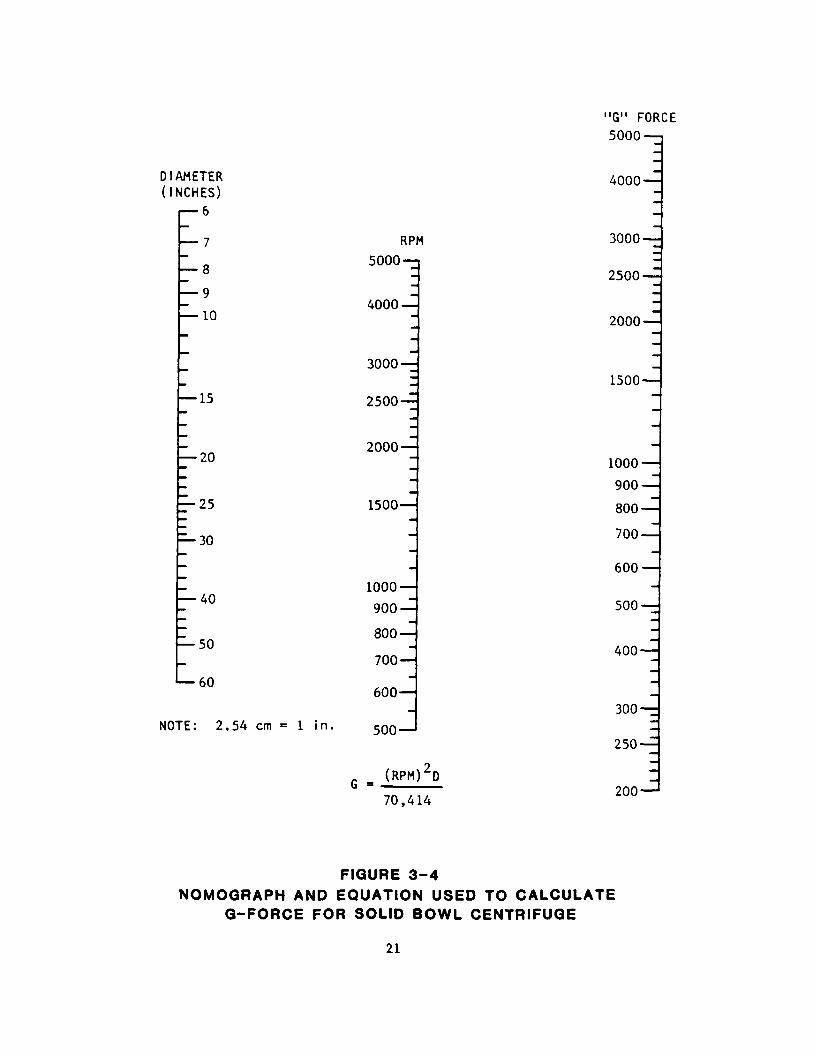
Sludge Treatment and Disposal (1), the low G and high G centrifuges aredescribed as "low speed" and "high speed" centrifuges. "Low speed" centri-fuges are defined as those operating at a bowl speed of 1,400 rpm or less (1).Note that the gravity force level (G) increases with the bowl diameter, asshown in the nomograph and equation on Figure 3-4. It can be seen that a 61 cm(24 in) diameter centrifuge operating at 1,400 rpm would develop 668 G's,while a 144 cm (56.5 in) diameter centrifuge also operating at 1,400 rpm woulddevelop centrifugal force of 1573 G's. For a small diameter centrifuge, eventhe low G machines would typically be operating above 1,400 rpm in order toachieve a higher G force. Therefore, G force is a better method of describingsolid bowl centrifuges than bowl speed alone, since G force takes into accountboth bowl speed and bowl diameter. However, because of the common usage, both"G" and "speed" will be used in this manual to describe solid bowl scrollcentrifuges.
There has been considerable controversy over the benefits of low G and high Gcentrifuges. Low G decanter centrifuge manufacturers claim that their machinesconsume less energy, have a lower noise level, and require less maintenancethan comparable high G machines. On the other hand, high G decanter centrifugemanufacturers claim that their machines require less polymer and achieve ahigher throughput because of the higher G forces utilized. Resolution ofwhether or not low G centrifuges have a lower total annual cost than high Gcentrifuges can only be determined after side-by-side tests are conducted witha particular sludge and the design parameters are known for each machine.
There have been few cases where simultaneous side-by-side testing with exactlythe same sludge between low G and high G solid bowl centrifuges has beenconducted. One recent side-by-side dewatering test between Sharpies' high Gcentrifuge and KHD Humboldt Wedag's low G centrifuge occurred in June 1982 atthe Littleton-Englewood, Colorado wastewater treatment plant. A reportsummarizing the comparison was expected to be completed by the end of 1982. Anadditional side-by-side dewatering test was initiated during the summer of1982 by the City of San Francisco.
The materials used in constructing a solid bowl centrifuge are also a sourceof controversy between low G and high G centrifuge manufacturers. Abrasivewear on scroll conveyor blades or flights has traditionally been the item ofgreatest maintenance, both in terms of time and expense. Several factors tendto influence the rate of abrasive wear including the abrasiveness of thesludge, the centrifugal force at the bowl wall, the differential speed, andthe abrasion resistance of the material used to form scroll blade t ips.Manufacturers of low G, concurrent flow centrifuges maintain that theirmachines are much less prone to scroll tip wear than high G countercurrentflow machines, because the low G machines operate at lower centrifugal forcesand lower differential speeds. Manufacturers of high G machines maintain thattheir problems with high abrasive wear rates can be overcome by the use of theproper abrasion resistant materials. A method of measuring wear rates andvolume loss on abrasion resistant materials is the ASTM G65-80 (Procedure A)tes t .
20
DIAMETER(INCHES)
i—6
— 7
- 8
— 10
— 15
— 20
• 2 5
-30
— 40
— 50
— 60
NOTE: 2 . 5 4 cm = 1 i n .
RPM
5000
4000—1
3000-
2500-
2000 —
1500—
1000-
900-
800-
700-
600-
500-
"G" FORCE5000—i
4000 —
3000 —
2 5 0 0 - ^
2000 —
1500 —
(RPM)2D
70,414
1000-
900-
800-
700-
600-
500-
400 —
300-
250-
200—'
FIGURE 3-4NOMOGRAPH AND EQUATION USED TO CALCULATE
Q-FORCE FOR SOLID BOWL CENTRIFUGE
21
Various types of hardfacing have been used to reduce wear on scroll tips.These include many different welder applied metallic hardfacings (such asColmonoy #6, Eutalloy, and Stell i te) as well as tungsten carbide and ceramict i l e s . Field replaceable ceramic ti les have recently been recommended byseveral low G manufacturers because of their long l i fe , relatively lowreplacement cost and ease of replacement. However, they are more fragile thanmetallic hardfacings, tending to chip easily. They also may occupy more spacein the bowl and not form as smooth a surface on the conveyor blades as dometallic hard facings. Ceramic tiles can be glued on to the flights althoughin some cases they are both glued and bolted to the flights. Tungsten carbidet i les have an extremely long life hardfacing, but one study found them to be5-10 times as expensive as ceramic ti les (3). One high-G centrifuge manufac-turer claims that sintered tungsten carbide ti les are no mare than 2 times asexpensive as ceramic ti les (4). Sintered tungsten carbide tiles are generallywelded to the flights and are usually required for only the portion of theconveyor blade near the dewatering beach (4).
One manufacturer of low G centrifuges using ceramic ti le hardsurfacingmaterial will routinely guarantee scroll conveyor life for 15,000-20,000 hoursbetween rebuilds (5). One high G centrifuge manufacturer will routinelyguarantee scroll conveyor life for 30,000 hours using highly abrasion resis-tant sintered tungsten carbide ti les (4). Experience with low G concurrentflow centrifuges at the Los Angeles County Sanitation Districts ' Carson Planthas indicated that conventional welder applied hardfacing has an operatinglife of about 5,000 hours (3).
3.3 Belt Press Filtration
Belt f i l ter presses employ single or double moving belts to continuouslydewater sludges through one or more stages of dewatering. In the past fewyears, belt fi l ter presses and solid bowl centrifuges have become the mostfrequently selected dewatering devices. At least 14 equipment suppliers canfurnish a type of belt press, as listed in Appendix A.
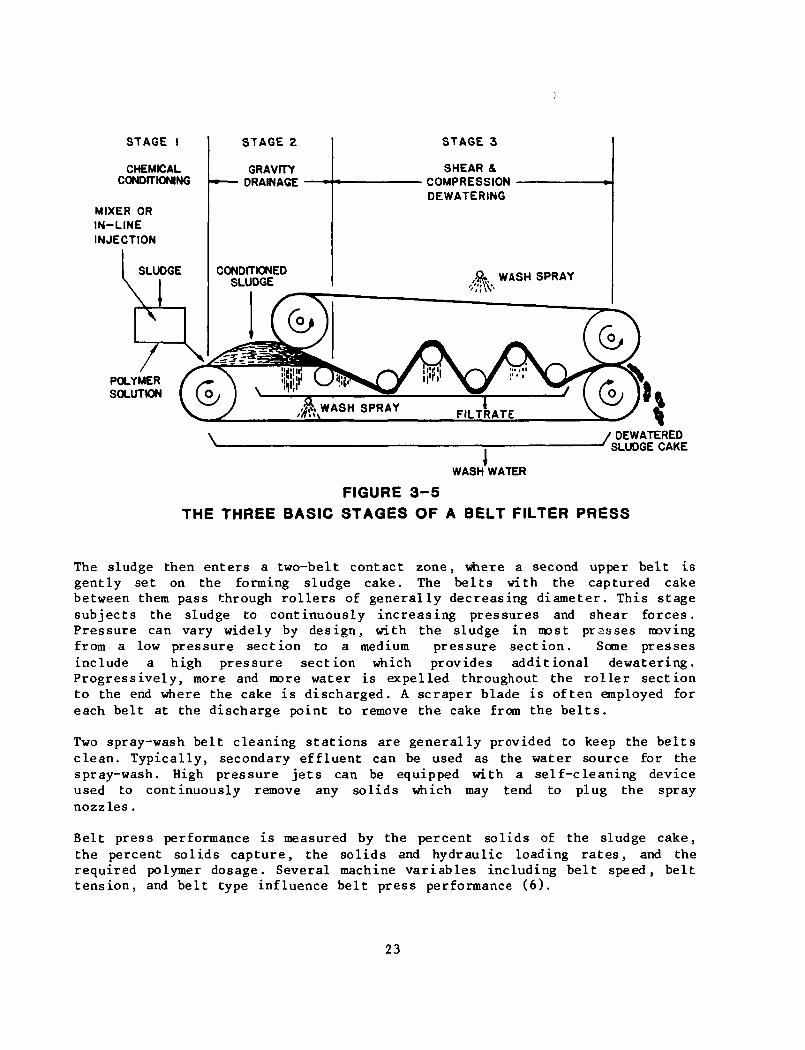
All belt press filtration processes include three basic operational stages:chemical conditioning of the feed sludge, gravity drainage to a nonfluidconsistency, shear and compression dewatering of the drained sludge.
Figure 3-5 depicts a simple belt press and shows the location of the threestages. Although present-day presses are usually more complex, they follow thesame principle indicated in Figure 3-5. The dewatering process is made effec-tive by the use of two endless belts of synthetic fiber. The belts pass arounda system of rollers at constant speed and perform the function of conveying,draining, and compressing. Many belt presses also use an initial belt forgravity drainage, in addition to the two belts in the pressure zone.
Good chemical conditioning is very important for successful and consistentperformance of the belt fil ter press. A flocculant (usually an organicpolymer) is added to the sludge prior to i ts being fed to the belt press. Freewater drains from the conditioned sludge in the gravity drainage stage of thepress.
22
STAGE I
CHEMICALCONDITIONING
MIXER ORIN-LINEINJECTION
POLYMERSOLUTION
STAGE 3
SHEAR &COMPRESSIONDEWATERING
/ DEWATERED7 SLUDGE CAKE
WASH WATER
FIGURE 3-5THE THREE BASIC STAGES OF A BELT FILTER PRESS
The sludge then enters a two-belt contact zone, where a second upper belt isgently set on the forming sludge cake. The belts with the captured cakebetween them pass through rollers of generally decreasing diameter. This stagesubjects the sludge to continuously increasing pressures and shear forces.Pressure can vary widely by design, with the sludge in most prasses movingfrom a low pressure section to a medium pressure section. Some pressesinclude a high pressure section which provides additional dewatering.Progressively, more and more water is expelled throughout the roller sectionto the end where the cake is discharged. A scraper blade is often employed foreach belt at the discharge point to remove the cake from the belts.
Two spray-wash belt cleaning stations are generally provided to keep the beltsclean. Typically, secondary effluent can be used as the water source for thespray-wash. High pressure jets can be equipped with a self-cleaning deviceused to continuously remove any solids which may tend to plug the spraynozzles.
Belt press performance is measured by the percent solids of the sludge cake,the percent solids capture, the solids and hydraulic loading rates, and therequired polymer dosage. Several machine variables including belt speed, belttension, and belt type influence belt press performance (6).
23
Belt speed is an important operational parameter vrtiich affects cake solids,polymer dosage, solids recovery, and hydraulic capacity. Low belt speedsresult in drier sludge cakes. At a given belt speed, increased polymer dosagesresult in higher cake solids. With an adequate polymer dose, solids recoveriesare improved by lowering belt speeds. Hydraulic capacity increases at higherbelt speeds; however, the solids capture drops. Depending on desired perfor-mance, the belt speed setting can be used to produce a variety of differentresults.
Belt tension has an effect on cake solids, maximum solids loading, and solidscapture. In general, a higher belt tension produces a drier cake but causes alower solids capture, at a fixed flow rate and polymer dose. A possible draw-back of using higher tension is increased belt wear. For sludges with a largequantity of WAS, the belt tension must be reduced to contain the sludgebetween the belts. The maximum tension which will not cause sludge losses fromthe sides of the belts should be used. The high pressure zones on beltpresses may cause problems with some WAS blends and may be unusable or requirethe lowest pressure setting possible.
Belt type is important in improving overall performance. Most belts are wovenof polyester filaments. Belts are available with weaves of different coarse-ness and different strengths. A belt with a coarser and stronger weave mayrequire higher polymer dosages to obtain adequate solids capture.
Failure of the chemical conditioning process to adjust to changing sludgecharacteristics can cause operational problems. If sludge is underconditioned,improper drainage occurs in the gravity drainage section, and either extrusionof inadequately drained solids from the compression section or uncontrolledoverflow of sludge from the drainage section may occur. Most manufacturers'belt presses can be equipped with sensing devices which can be set to automa-tically shut off the sludge feed flow in case of underconditioning. Bothunderconditioned and overconditioned sludges can blind the filter media. Inaddition, overconditioned sludge drains so rapidly that solids cannot distr i-bute across the belt. Vanes and distribution weirs included in the gravitydrainage section help alleviate the problem of distribution of overconditionedsludge across the belt. Inclusion of a sludge blending tank before the beltpress can also reduce this problem. Scraper units and fi l trate trays are siteswhere solids build up. A belt press installation should be designed for dailywashdown by hosing; therefore, drainage and safe walking areas around thepress are important.
The flow rate required for belt washing is usually 50 to 100 percent of theflow rate of sludge to the machine and the pressure is typically 690 kPa(100 psi) or more. The combined fi l trate and belt washwater flow is normallyabout one and one-half times the incoming sludge flow. Some belt pressesrecirculate washwater from the fi l trate collection system, but normally,secondary effluent or potable water is used. This combined flow of washwaterand fi l t rate contains between 500 and 2,000 mg/1 of suspended solids and istypically returned either to the primary or secondary treatment system.
Belt presses have numerous moving parts, that include up to 25 to 30 rollersand 50-75 bearings. Spare parts should be kept available to prevent prolonged
24
unit down-time. Belts, bearings, and rol lers can deteriorate quickly, ifmaintenance is inadequate. However, most parts are small and easily acces-s ible , so that even small fac i l i t ies should have l i t t l e difficulty inmaintaining these replacement parts.
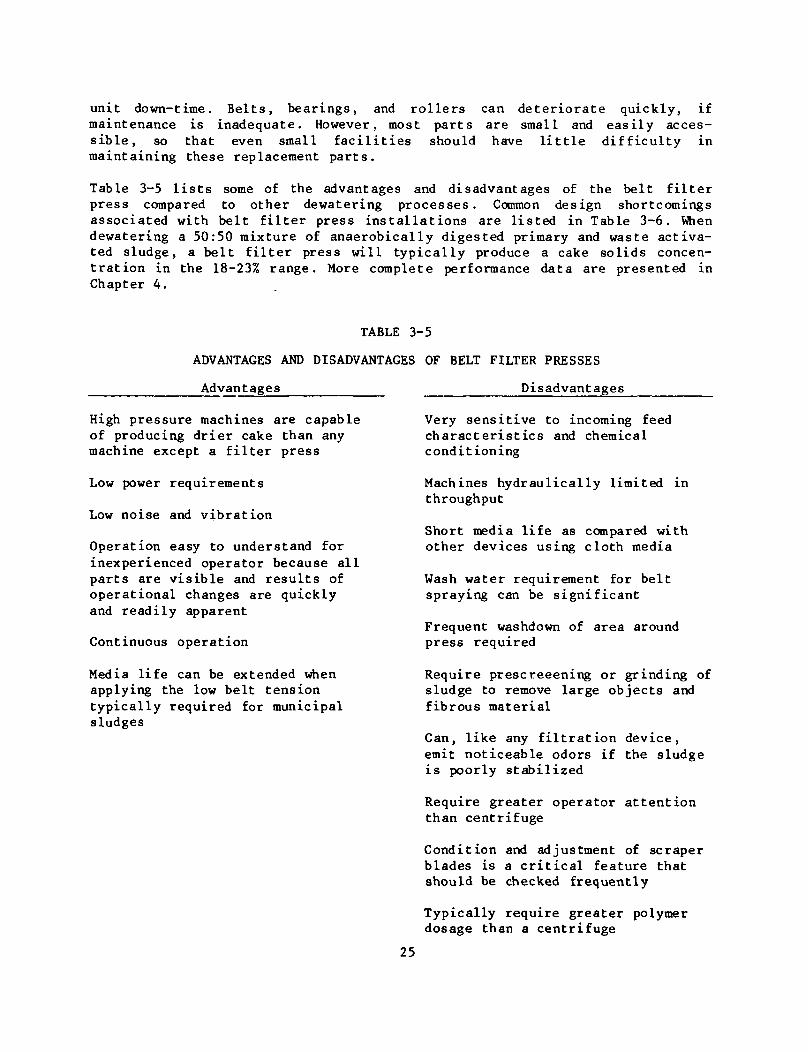
Table 3-5 l i s t s some of the advantages and disadvantages of the belt f i l t e rpress compared to other dewatering processes. Common design shortcomingsassociated with belt f i l t e r press instal lat ions are listed in Table 3-6. Whendewatering a 50:50 mixture of anaerobically digested primary and waste activa-ted sludge, a belt f i l t e r press will typically produce a cake solids concen-trat ion in the 18-23% range. More complete performance data are presented inChapter 4.
TABLE 3-5
ADVANTAGES AND DISADVANTAGES OF BELT FILTER PRESSES
Advantages Disadvantages
High pressure machines are capableof producing drier cake than anymachine except a filter press
Low power requirements
Low noise and vibration
Operation easy to understand forinexperienced operator because allparts are visible and results ofoperational changes are quicklyand readily apparent
Continuous operation
Media life can be extended whenapplying the low belt tensiontypically required for municipalsludges
Very sensitive to incoming feedcharacteristics and chemicalconditioning
Machines hydraulically limited inthroughput
Short media life as compared withother devices using cloth media
Wash water requirement for beltspraying can be significant
Frequent washdown of area aroundpress required
Require prescreeening or grinding ofsludge to remove large objects andfibrous material
Can, like any filtration device,emit noticeable odors if the sludgeis poorly stabilized
Require greater operator attentionthan centrifuge
Condition and adjustment of scraperblades is a critical feature thatshould be checked frequently
Typically require greater polymerdosage than a centrifuge
25
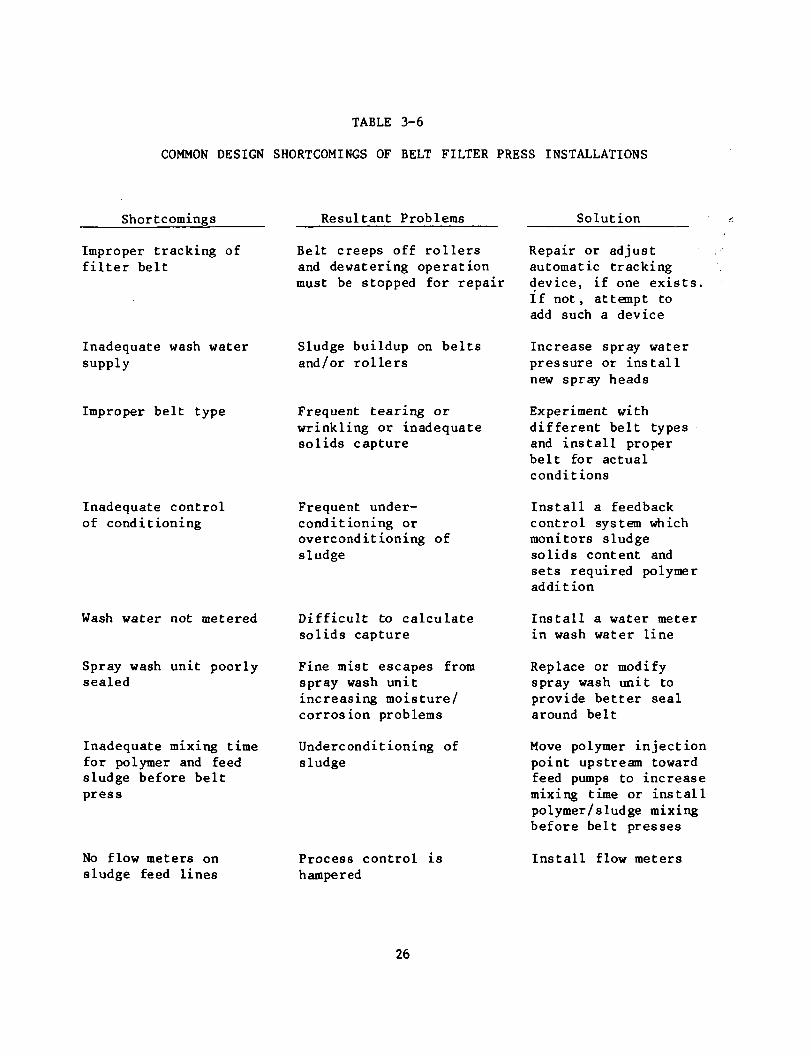
TABLE 3-6
COMMON DESIGN SHORTCOMINGS OF BELT FILTER PRESS INSTALLATIONS
Shortcomings
Improper tracking offilter belt
Inadequate wash watersupply
Improper belt type
Inadequate controlof conditioning
Wash water not metered
Spray wash unit poorlysealed
Inadequate mixing timefor polymer and feedsludge before beltpress
No flow meters onsludge feed lines
Resultant Problems
Belt creeps off rollersand dewatering operationmust be stopped for repair
Sludge buildup on beltsand/or rollers
Frequent tearing orwrinkling or inadequatesolids capture
Frequent under-conditioning oroverconditioning ofsludge
Difficult to calculatesolids capture
Fine mist escapes fromspray wash unitincreasing moisture/corrosion problems
Underconditioning ofsludge
Solution
Process control ishampered
Repair or adjustautomatic trackingdevice, if one exists.If not, attempt toadd such a device
Increase spray waterpressure or installnew spray heads
Experiment withdifferent belt typesand install properbelt for actualconditions
Install a feedbackcontrol system whichmonitors sludgesolids content andsets required polymeraddition
Install a water meterin wash water line
Replace or modifyspray wash unit toprovide better sealaround belt
Move polymer injectionpoint upstream towardfeed pumps to increasemixing time or installpolymer/sludge mixingbefore belt presses
Install flow meters
26
3.4 Vacuum Filtration
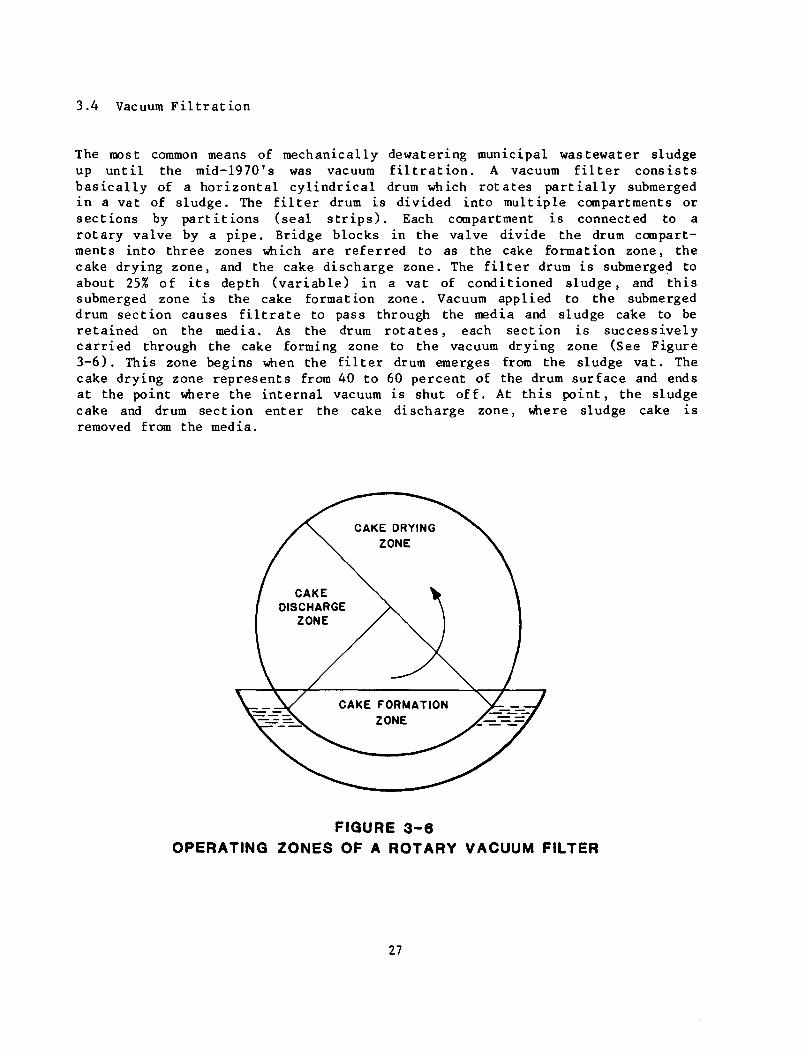
The roost common means of mechanically dewatering municipal wastewater sludgeup until the mid-1970's was vacuum fi l t rat ion. A vacuum fi l ter consistsbasically of a horizontal cylindrical drum which rotates partially submergedin a vat of sludge. The fi l ter drum is divided into multiple compartments orsections by partitions (seal s t r ips) . Each compartment is connected to arotary valve by a pipe. Bridge blocks in the valve divide the drum compart-ments into three zones which are referred to as the cake formation zone, thecake drying zone, and the cake discharge zone. The fi l ter drum is submerged toabout 25% of its depth (variable) in a vat of conditioned sludge, and thissubmerged zone is the cake formation zone. Vacuum applied to the submergeddrum section causes f i l t ra te to pass through the media and sludge cake to beretained on the media. As the drum rotates, each section is successivelycarried through the cake forming zone to the vacuum drying zone (See Figure3-6). This zone begins when the fi l ter drum emerges from the sludge vat. Thecake drying zone represents from 40 to 60 percent of the drum surface and endsat the point where the internal vacuum is shut off. At this point, the sludgecake and drum section enter the cake discharge zone, where sludge cake isremoved from the media.
CAKEDISCHARGE
ZONE
CAKE FORMATIONZONE
FIGURE 3-6OPERATING ZONES OF A ROTARY VACUUM FILTER
27
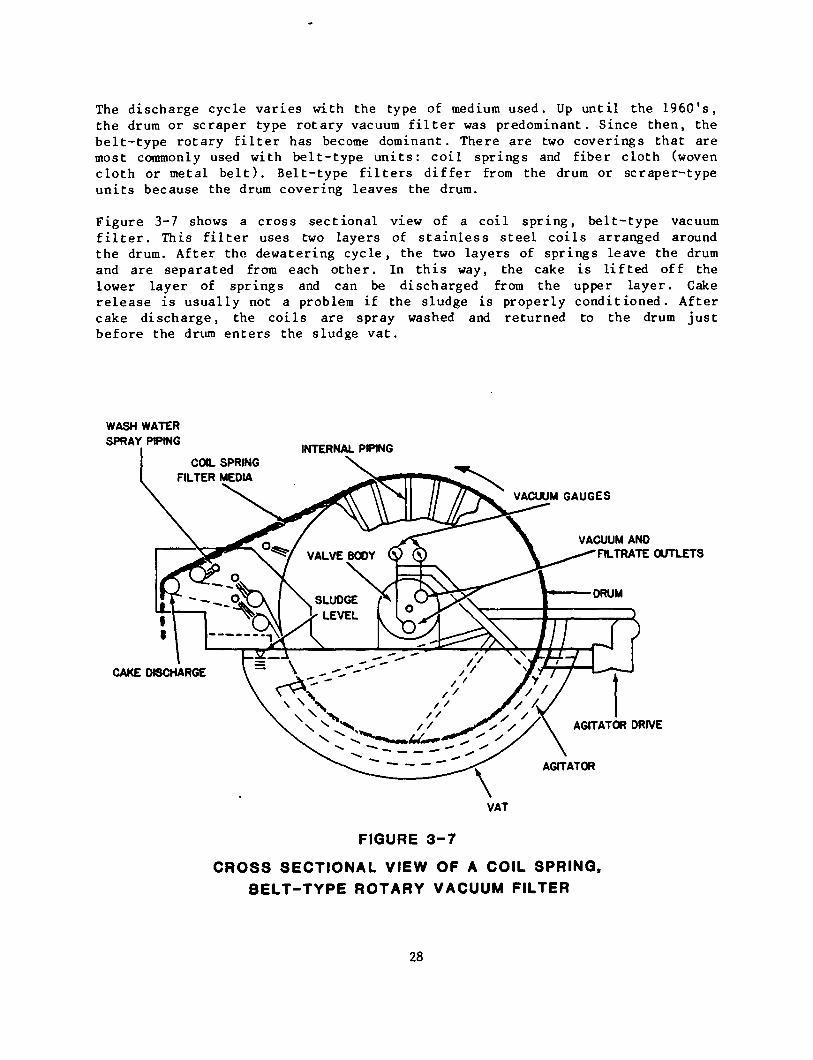
The discharge cycle varies with the type of medium used. Up until the 1960's,the drum or scraper type rotary vacuum f i l ter was predominant. Since then, thebelt-type rotary fi l ter has become dominant. There are two coverings that aremost commonly used with belt-type units: coil springs and fiber cloth (wovencloth or metal bel t) . Belt-type fi l ters differ from the drum or scraper-typeunits because the drum covering leaves the drum.
Figure 3-7 shows a cross sectional view of a coil spring, belt-type vacuumfi l t e r . This f i l ter uses two layers of stainless steel coils arranged aroundthe drum. After the. dewatering cycle, the two layers of springs leave the drumand are separated from each other. In this way, the cake is lifted off thelower layer of springs and can be discharged from the upper layer. Cakerelease is usually not a problem if the sludge is properly conditioned. Aftercake discharge, the coils are spray washed and returned to the drum justbefore the drum enters the sludge vat.
WASH WATERSPRAY PIPING
INTERNAL PIPINGCOO. SPRING
FILTER MEDIA
VACUUM GAUGES
VACUUM ANDFILTRATE OUTLETS
CAKE DISCHARGE
AGITATOR DRIVE
AGITATOR
VAT
FIGURE 3-7
CROSS SECTIONAL VIEW OF A COIL SPRING,BELT-TYPE ROTARY VACUUM FILTER
28
The coil springs, which have 7 to 14 percent open area, act to support theinitial solids deposit which in turn serves as the filtration media. Becauseof the open area of the springs, it is important that the feed solids concen-tration be high or that it contain sufficient fibrous material to control theloss of fine solids. Sludges with particles that are both extremely fine andresistant to flocculation dewater poorly on coil f i l ters , and solids captureis low. Cloth media is required when filtering unthickened sludge that ispredominantly secondary solids.
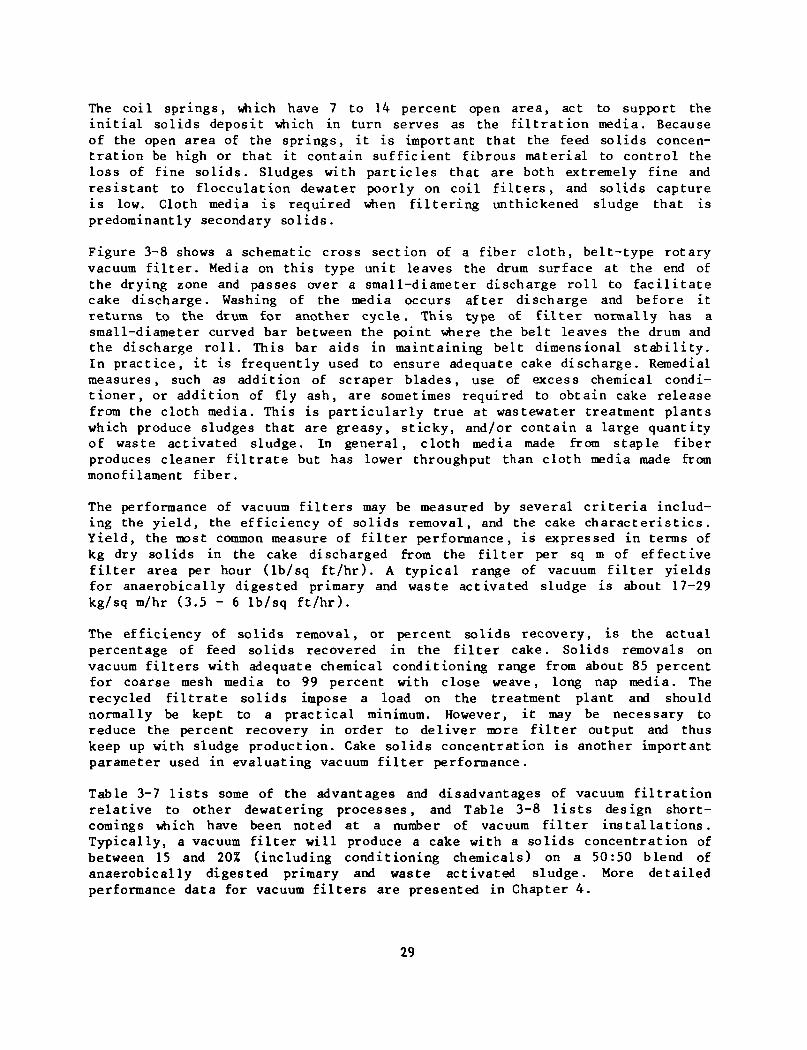
Figure 3-8 shows a schematic cross section of a fiber cloth, belt-type rotaryvacuum fi l ter . Media on this type unit leaves the drum surface at the end ofthe drying zone and passes over a small-diameter discharge roll to facilitatecake discharge. Washing of the media occurs after discharge and before itreturns to the drum for another cycle. This type of fi l ter normally has asmall-diameter curved bar between the point where the belt leaves the drum andthe discharge roll. This bar aids in maintaining belt dimensional stability.In practice, it is frequently used to ensure adequate cake discharge. Remedialmeasures, such as addition of scraper blades, use of excess chemical condi-tioner, or addition of fly ash, are sometimes required to obtain cake releasefrom the cloth media. This is particularly true at wastewater treatment plantswhich produce sludges that are greasy, sticky, and/or contain a large quantityof waste activated sludge. In general, cloth media made from staple fiberproduces cleaner fi l trate but has lower throughput than cloth media made frommonofilament fiber.
The performance of vacuum filters may be measured by several criteria includ-ing the yield, the efficiency of solids removal, and the cake characteristics.Yield, the most common measure of fil ter performance, is expressed in terms ofkg dry solids in the cake discharged from the filter per sq m of effectivefilter area per hour (lb/sq ft/hr). A typical range of vacuum filter yieldsfor anaerobically digested primary and waste activated sludge is about 17-29kg/sq m/hr (3.5 - 6 lb/sq ft/hr).
The efficiency of solids removal, or percent solids recovery, is the actualpercentage of feed solids recovered in the filter cake. Solids removals onvacuum filters with adequate chemical conditioning range from about 85 percentfor coarse mesh media to 99 percent with close weave, long nap media. Therecycled filtrate solids impose a load on the treatment plant and shouldnormally be kept to a practical minimum. However, it may be necessary toreduce the percent recovery in order to deliver more filter output and thuskeep up with sludge production. Cake solids concentration is another importantparameter used in evaluating vacuum filter performance.
Table 3-7 l i s t s some of the advantages and disadvantages of vacuum filtrationrelative to other dewatering processes, and Table 3-8 l i s t s design short-comings which have been noted at a number of vacuum filter installations.Typically, a vacuum filter will produce a cake with a solids concentration ofbetween 15 and 20% (including conditioning chemicals) on a 50:50 blend ofanaerobically digested primary and waste activated sludge. More detailedperformance data for vacuum filters are presented in Chapter 4.
29
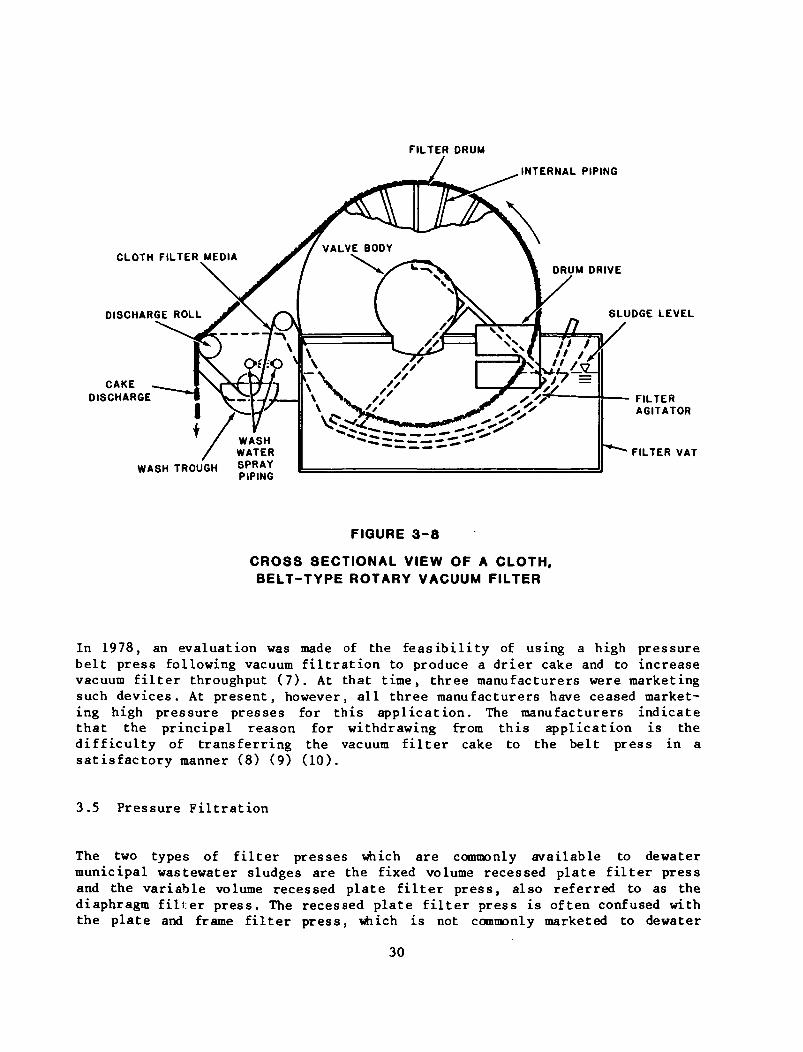
FILTER DRUM
INTERNAL PIPING
DRUM DRIVECLOTH FILTER MEDIA
DISCHARGE ROLL
CAKEDISCHARGE
WASHWATER
WASH TROUGH SPRAY
SLUDGE LEVEL
y
FILTERAGITATOR
FILTER VAT
FIGURE 3-8
CROSS SECTIONAL VIEW OF A CLOTH,BELT-TYPE ROTARY VACUUM FILTER
In 1978, an evaluation was made of the feasibility of using a high pressurebelt press following vacuum filtration to produce a drier cake and to increasevacuum filter throughput (7). At that time, three manufacturers were marketingsuch devices. At present, however, all three manufacturers have ceased market-ing high pressure presses for this application. The manufacturers indicatethat the principal reason for withdrawing from this application is thedifficulty of transferring the vacuum filter cake to the belt press in asatisfactory manner (8) (9) (10).
3.5 Pressure Filtration
The two types of filter presses which are commonly available to dewatermunicipal wastewater sludges are the fixed volume recessed plate filter pressand the variable volume recessed plate filter press, also referred to as thediaphragm filter press. The recessed plate filter press is often confused withthe plate and frame filter press, which is not commonly marketed to dewater
30
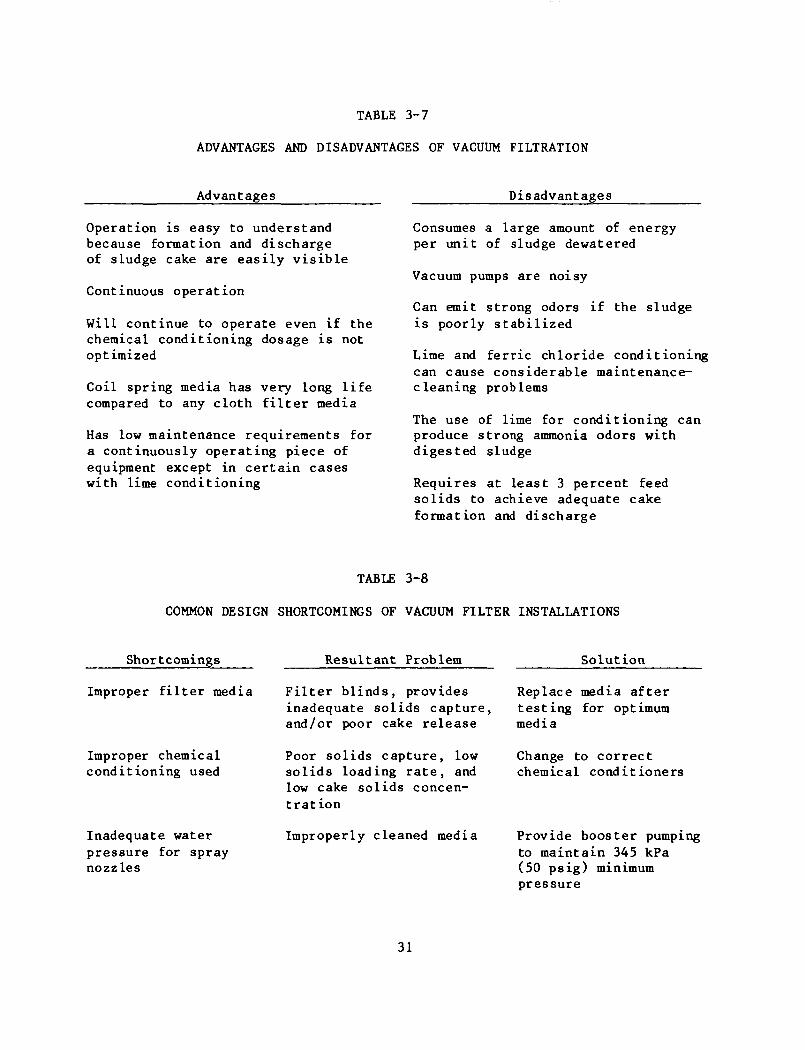
TABLE 3-7
ADVANTAGES AND DISADVANTAGES OF VACUUM FILTRATION
Advantages
Operation is easy to understandbecause formation and dischargeof sludge cake are easily visible
Continuous operation
Will continue to operate even if thechemical conditioning dosage is notoptimized
Coil spring media has very long lifecompared to any cloth filter media
Has low maintenance requirements fora continuously operating piece ofequipment except in certain caseswith lime conditioning
Disadvantages
Consumes a large amount of energyper unit of sludge dewatered
Vacuum pumps are noisy
Can emit strong odors if the sludgeis poorly stabilized
Lime and ferric chloride conditioningcan cause considerable maintenance-cleaning problems
The use of lime for conditioning canproduce strong ammonia odors withdigested sludge
Requires at least 3 percent feedsolids to achieve adequate cakeformation and discharge
TABLE 3-8
COMMON DESIGN SHORTCOMINGS OF VACUUM FILTER INSTALLATIONS
Shortcomings
Improper filter media
Improper chemicalconditioning used
Inadequate waterpressure for spraynozzles
Resultant Problem
Filter blinds, providesinadequate solids capture,and/or poor cake release
Poor solids capture, lowsolids loading rate, andlow cake solids concen-tration
Improperly cleaned media
Solution
Replace media aftertesting for optimummedia
Change to correctchemical conditioners
Provide booster pumpingto maintain 345 kPa(50 psig) minimumpressure
31
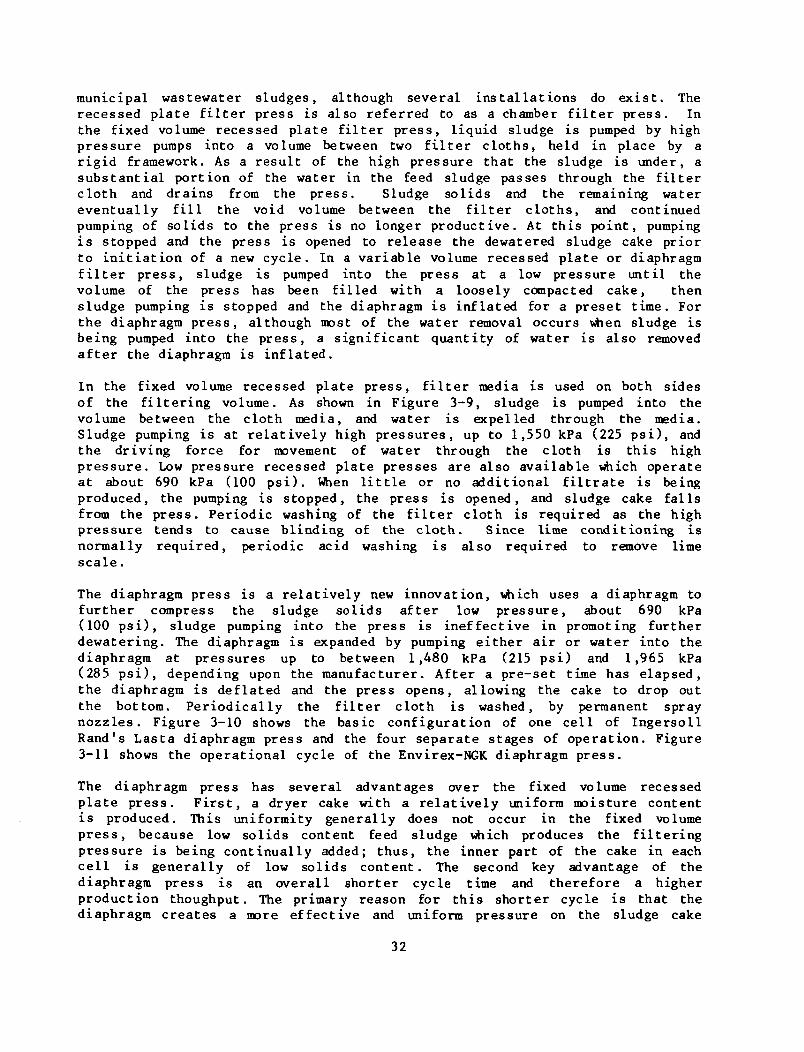
municipal wastewater sludges, although several installations do exist. Therecessed plate fi l ter press is also referred to as a chamber fil ter press. Inthe fixed volume recessed plate filter press, liquid sludge is pumped by highpressure pumps into a volume between two fi l ter cloths, held in place by arigid framework. As a result of the high pressure that the sludge is under, asubstantial portion of the water in the feed sludge passes through the filtercloth and drains from the press. Sludge solids and the remaining watereventually f i l l the void volume between the filter cloths, and continuedpumping of solids to the press is no longer productive. At this point, pumpingis stopped and the press is opened to release the dewatered sludge cake priorto initiation of a new cycle. In a variable volume recessed plate or diaphragmfi l ter press, sludge is pumped into the press at a low pressure until thevolume of the press has been filled with a loosely compacted cake, thensludge pumping is stopped and the diaphragm is inflated for a preset time. Forthe diaphragm press, although most of the water removal occurs when sludge isbeing pumped into the press, a significant quantity of water is also removedafter the diaphragm is inflated.
In the fixed volume recessed plate press, f i l ter media is used on both sidesof the filtering volume. As shown in Figure 3-9, sludge is pumped into thevolume between the cloth media, and water is expelled through the media.Sludge pumping is at relatively high pressures, up to 1,550 kPa (225 psi), andthe driving force for movement of water through the cloth is this highpressure. Low pressure recessed plate presses are also available which operateat about 690 kPa (100 psi) . When l i t t l e or no additional f i l trate is beingproduced, the pumping is stopped, the press is opened, and sludge cake fallsfrom the press. Periodic washing of the fi l ter cloth is required as the highpressure tends to cause blinding of the cloth. Since lime conditioning isnormally required, periodic acid washing is also required to remove limescale.
The diaphragm press is a relatively new innovation, which uses a diaphragm tofurther compress the sludge solids after low pressure, about 690 kPa(100 psi) , sludge pumping into the press is ineffective in promoting furtherdewatering. The diaphragm is expanded by pumping either air or water into thediaphragm at pressures up to between 1,480 kPa (215 psi) and 1,965 kPa(285 psi), depending upon the manufacturer. After a pre-set time has elapsed,the diaphragm is deflated and the press opens, allowing the cake to drop outthe bottom. Periodically the filter cloth is washed, by permanent spraynozzles. Figure 3-10 shows the basic configuration of one cell of IngersollRand's Lasta diaphragm press and the four separate stages of operation. Figure3-11 shows the operational cycle of the Envirex-NGK diaphragm press.
The diaphragm press has several advantages over the fixed volume recessedplate press. First, a dryer cake with a relatively uniform moisture contentis produced. This uniformity generally does not occur in the fixed volumepress, because low solids content feed sludge which produces the filteringpressure is being continually added; thus, the inner part of the cake in eachcell is generally of low solids content. The second key advantage of thediaphragm press is an overall shorter cycle time and therefore a higherproduction thoughput. The primary reason for this shorter cycle is that thediaphragm creates a more effective and uniform pressure on the sludge cake
32
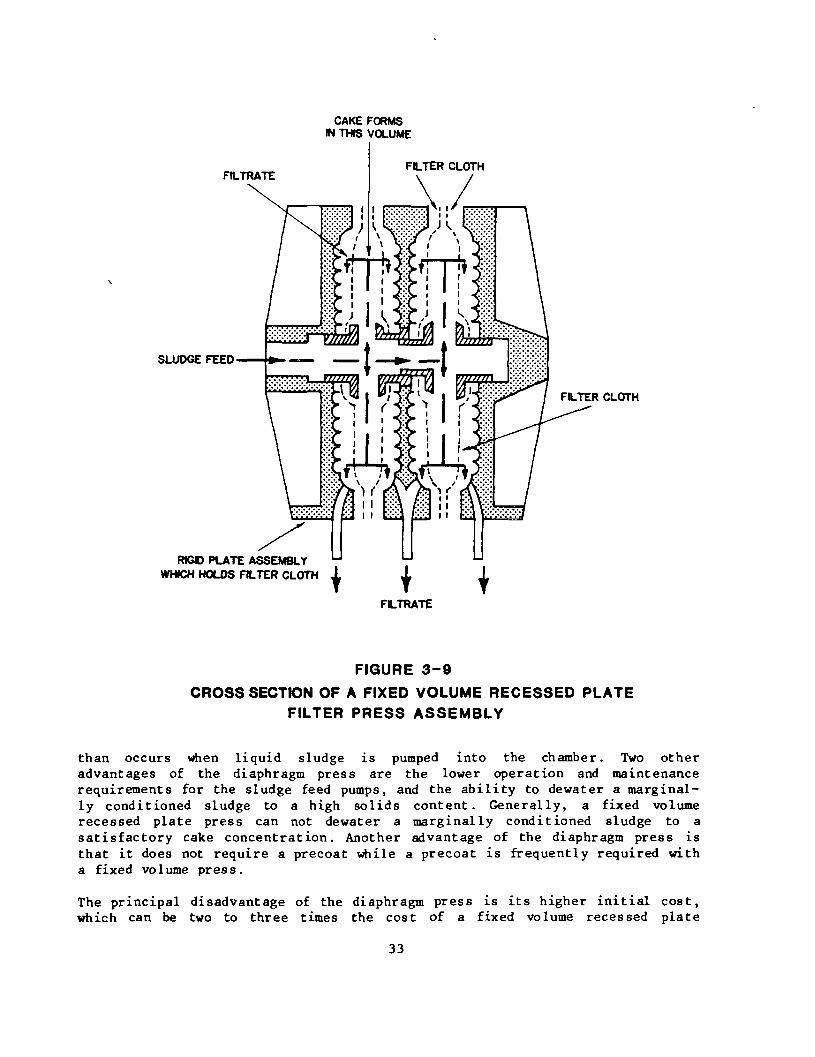
FILTRATE
SLUDGE FEED
CAKE FORMSIN THIS VOLUME
FILTER CLOTH
RIG© PLATE ASSEMBLYWHICH HOLDS FILTER CLOTH
T YFLTRATE
FILTER CLOTH
FIGURE 3-9CROSS SECTION OF A FIXED VOLUME RECESSED PLATE
FILTER PRESS ASSEMBLY
than occurs when liquid sludge is pumped into the chamber. Two otheradvantages of the diaphragm press are the lower operation and maintenancerequirements for the sludge feed pumps, and the ability to dewater a marginal-ly conditioned sludge to a high solids content. Generally, a fixed volumerecessed plate press can not dewater a marginally conditioned sludge to asatisfactory cake concentration. Another advantage of the diaphragm press isthat it does not require a precoat while a precoat is frequently required witha fixed volume press.
The principal disadvantage of the diaphragm press is i ts higher initial cost,which can be two to three times the cost of a fixed volume recessed plate
33
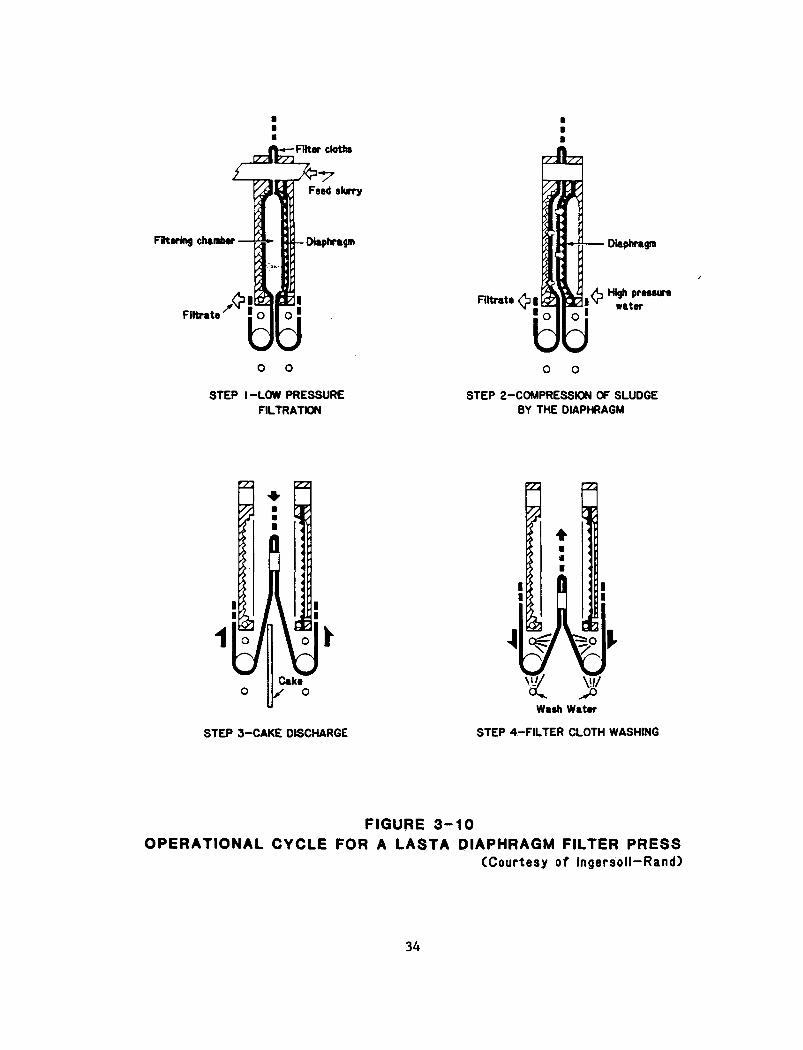
Filter clothe
Fitering chamber
Filtrate
O O
STEP I -LOW PRESSUREFILTRATION
Diaphragm
pressure
o o
STEP 2-C0MPRESSI0N OF SLUDGEBY THE DIAPHRAGM
STEP 3-CAKE DISCHARGE STEP 4-FILTER CLOTH WASHING
FIGURE 3-10OPERATIONAL CYCLE FOR A LASTA DIAPHRAGM FILTER PRESS
(Courtesy of fngersoll-Rand)
34
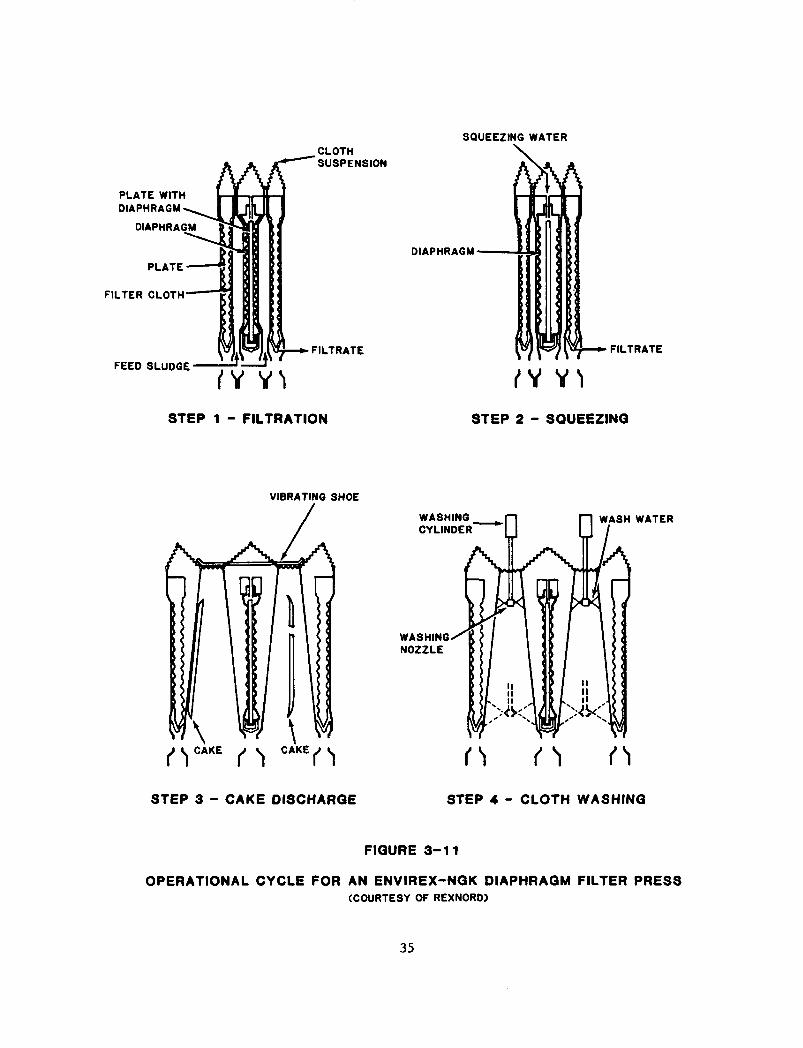
SQUEEZING WATER
AA/CCLOTHSUSPENSION
PLATE WITHDIAPHRAGM
DIAPHRAGM
PLATE
FILTER CLOTH
FEED SLUDGEFILTRATE
DIAPHRAGM
FILTRATE
Y'lSTEP 1 - FILTRATION STEP 2 - SQUEEZING
VIBRATING SHOE
WASHINGCYLINDER" •0
WASHING/NOZZLE
WASH WATER
STEP 3 - CAKE DISCHARGE STEP 4 - CLOTH WASHING
FIGURE 3-11
OPERATIONAL CYCLE FOR AN ENVIREX-NGK DIAPHRAGM FILTER PRESS(COURTESY OF REXNORD)
35
press with the same daily throughput. Another disadvantage is that althoughthe diaphragm press has a lower cycle time, the capacity of the largestdiaphragm filter press is generally less than that of the largest fixed volumerecessed plate filter press.
Filter press performance is measured by the solids content in the feed sludge,required chemical conditioning dosages, cake solids content, total cycle time,solids capture, and the yield, in kg/sq m/hr (lb/sq ft/hr). These performanceparameters are all interrelated; for example, as the feed solids contentincreases, the required chemical dosages and total cycle time usuallydecrease, while the filter yield, or throughput, usually increases. As thechemical conditioning dosage is increased up to the optimum level, the cakesolids content, solids capture, and yield all increase, tfiile the cycle timedecreases. It should be noted that increasing chemical conditioning beyond theoptimum level can increase the overall volume and reduce the heat value of thefi l ter cake because of the addition of large quantities of inorganicchemicals.
Control of filter presses may be manual, semi-automatic, or fully automatic.Labor requirements for operation will vary dramatically depending on thedegree of instrumentation utilized for control. In spite of automation, opera-tor attention is often needed during the dump cycle to insure complete separa-tion of the solids from the media of the filter press. Process yields cantypically be increased 10 to 30 percent by carefully controlling the optimumcycle times with a micro-controller. This is important since the capital costsfor filter presses are very high.
Table 3-9 presents the principal advantages and disadvantages of filterpresses compared to other dewatering processes. Common design shortcomingsassociated with filter press installations are listed in Table 3-10, alongwith solutions for these shortcomings. The fixed volume recessed plate filterpress will typically dewater a 50:50 blend of digested primary and wasteactivated sludge to between 35-42% solids, while a diaphragm press willproduce a 38-47% solids cake on the same sludge. These cake solids concentra-tions include large amounts of inorganic conditioning chemicals. Chapter 4 ofthis manual presents more complete performance data for each type of press.
3.6 Drying Bed
Although the expression "drying bed" originally referred to a sand drying bed,three other types of beds are also available: paved drying beds, wedgewaterfilter beds, and vacuum assisted drying beds. Drying beds generally work bestin areas with little rainfall; however, they are extensively used in smallplants even in localities where rainfall averages up to 102 cm (40 in) peryear. It is important that sludge be well stabilized before being applied todrying beds. If poorly stabilized or raw sludge is applied to sand beds,dewatering will occur very slowly and substantial problems will result. Twomajor problems are odor production and the occurrence of flies resulting fromfurther biological stabilization on the bed.
36
TABLE 3-9
ADVANTAGES AND DISADVANTAGES OF FILTER PRESSES
Advantages
High solids content cake
Can dewater hard-to-dewater sludges,although very high chemicalconditioning dosages or thermalconditioning may be required
Very high solids capture
Only mechanical device capable ofproducing a cake dry enough to meetlandfill requirements in somelocations
Disadvantages
Large quantities of inorganicconditioning chemicals are commonlyused for filter presses
Polymer alone is generally not usedfor conditioning due to problemswith cake release and blinding offilter media. Experimental work onpolymer conditioning is continuing.
High capital cost especially fordiaphragm filter presses
Labor cost may be high if sludge ispoorly conditioned and if press isnot automatic
Replacement of the media is bothexpensive and time consuming
Noise levels caused by feed pumpscan be very high
Requires grinder or prescreeningequipment on the feed
Acid washing requirements to removecalcified deposits caused by limeconditioning can be frequent andtime consuming
Batch discharge after each cyclerequires detailed consideration toways of receiving and storing cake,or of converting it to a continuousstream for delivery to anincinerator
37
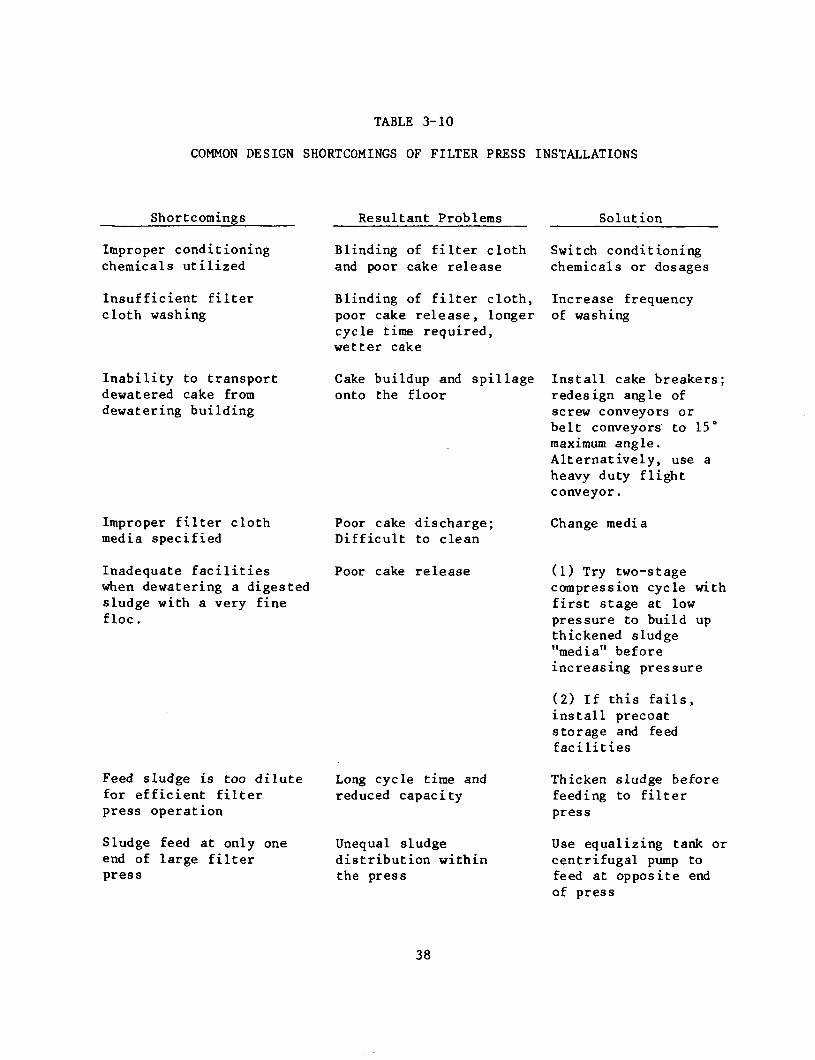
TABLE 3-10
COMMON DESIGN SHORTCOMINGS OF FILTER PRESS INSTALLATIONS
Shortcomings
Improper conditioningchemicals utilized
Insufficient filtercloth washing
Inability to transportdewatered cake fromdewatering building
Improper filter clothmedia specified
Inadequate facilitieswhen dewatering a digestedsludge with a very finefloe.
Feed sludge is too dilutefor efficient filterpress operation
Sludge feed at only oneend of large filterpress
Resultant Problems
Blinding of filter clothand poor cake release
Blinding of filter cloth,poor cake release, longercycle time required,wetter cake
Cake buildup and spillageonto the floor
Solution
Poor cake discharge;Difficult to clean
Poor cake release
Long cycle time andreduced capacity
Unequal sludgedistribution withinthe press
Switch conditioningchemicals or dosages
Increase frequencyof washing
Install cake breakers;redesign angle ofscrew conveyors orbelt conveyors to 15°maximum angle.Alternatively, use aheavy duty flightconveyor.
Change media
(1) Try two-stagecompression cycle withfirst stage at lowpressure to build upthickened sludge"media" beforeincreasing pressure
(2) If this fails,install precoatstorage and feedfacilities
Thicken sludge beforefeeding to filterpress
Use equalizing tank orcentrifugal pump tofeed at opposite endof press
38

3.6.1 Sand Drying Beds
The operative dewatering principles involved in sand drying bed installationsare evaporation and percolation. Percolation may be either to the groundwater,or to underdrain ti les located underneath the sand drying bed, and itgenerally occurs quickly after sludge application. Evaporation is then respon-sible for any further water removal. In some locations, environmentalconstraints due to leaching of nitrogen compounds and other constituents haveresulted in the requirement to seal the bottom of the drying bed with animpermeable liner. In this case, an underdrain system would be mandatory forproper dewatering. To enhance the capabilities of sand drying beds in climateswith high precipitation rates, the use of covered drying beds has occasionallybeen practiced. A key to the proper operation of covered beds is to providegood ventilation.
Sludge conditioning is possible prior to application of sludge to the dryingbeds. Such conditioning is generally not economically justified unless it is ashort term remedy until additional bed area can be constructed, or if adverseweather has decreased the effectiveness of the beds. Long term operation withpolymer conditioning may also be practical if there is insufficient area fordrying bed expansion. Use of lime and ferric chloride for conditioning couldin certain cases result in chemical blinding of the sand layer.
In cases where underdrains are used, the gravel layer is typically 30 to 46 cm(12 to 18 in) deep, the sand is 15 to 30 cm (6 to 12 in) deep, and the drain-age pipes are located 3 to 6 m (10 to 20) apart. Sludge is applied in a layerbetween 20 to 30 cm (8 to 12 in) across the entire bed and allowed to drainand dry until the sludge is caked and cracked. At this point the dried sludgeis removed either manually or mechanically. Caking and cracking will generallyoccur when the solids content reaches 35 to 40%, and this is the content atwhich most sludge is removed. Sludge may, however, be removed at higher orlower solids contents, depending upon the operator's ability to remove i t fromthe bed, and upon the disposal method for the dried sludge. Drying timevaries in a nonlinear manner with the depth of the applied sludge. Forexample, a 20 cm (8 in) layer of sludge may dry in one-half the time requiredfor a 30 cm (12 in) layer of sludge. The optimum sludge application depth mustbe determined on a sludge by sludge basis, and will be a function of the totalbed area, the number of beds, the digester capacity, the climate, and thedesired cake solids content for removal of dried sludge from the beds.
Advantages and disadvantages of sand drying beds are listed in Table 3-11, andcommon design shortcomings are listed in Table 3-12.
Sludge removal from drying beds may be either manually or with a front-endloader. Depending upon bed thickness, use of mechanical equipment can causeproblems because of i ts weight. Additionally, a portion of sand is lost as thesludge is removed, and periodic sand replenishment is necessary.
39
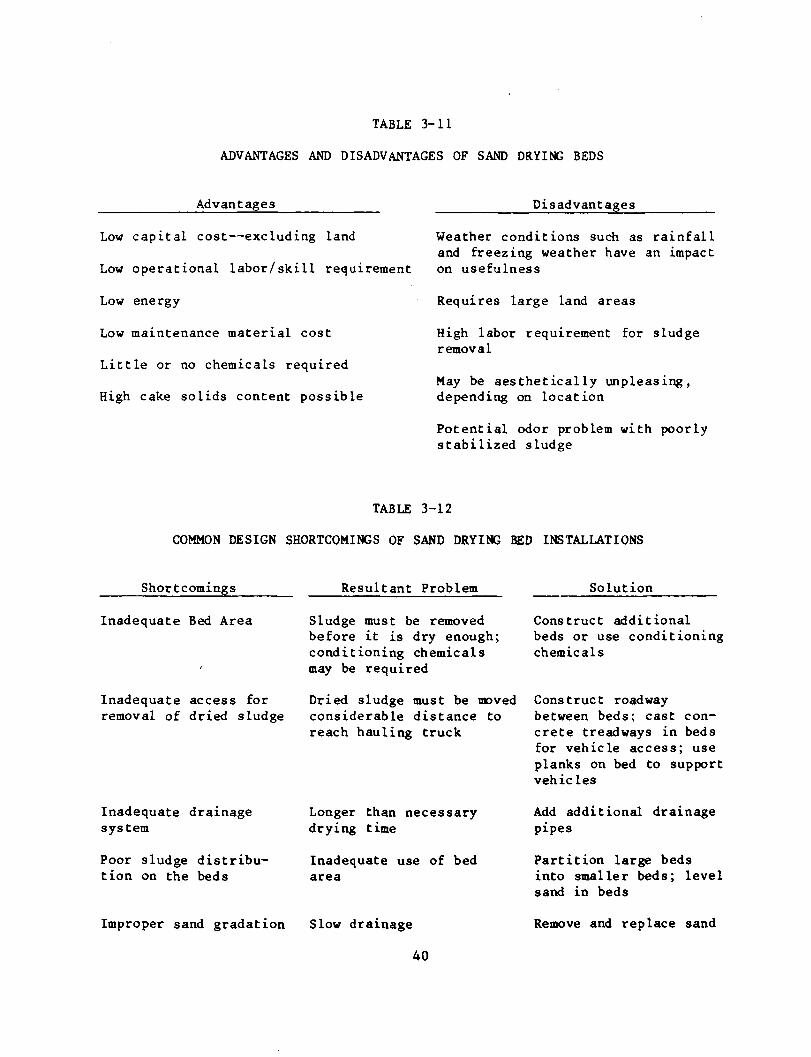
TABLE 3-11
ADVANTAGES AND DISADVANTAGES OF SAND DRYING BEDS
Advantages
Low capital cost—excluding land
Low operational labor/skill requirement
Low energy
Low maintenance material cost
Little or no chemicals required
High cake solids content possible
Disadvantages
Weather conditions such as rainfalland freezing weather have an impacton usefulness
Requires large land areas
High labor requirement for sludgeremoval
May be aesthetically unpleasing,depending on location
Potential odor problem with poorlystabilized sludge
TABLE 3-12
COMMON DESIGN SHORTCOMINGS OF SAND DRYING BED INSTALLATIONS
Shortcomings
Inadequate Bed Area
Inadequate access forremoval of dried sludge
Inadequate drainagesystem
Poor sludge distribu-tion on the beds
Resultant Problem
Sludge must be removedbefore it is dry enough;conditioning chemicalsmay be required
Solution
Construct additionalbeds or use conditioningchemicals
Dried sludge must be moved Construct roadwayconsiderable distance toreach hauling truck
Longer than necessarydrying time
Inadequate use of bedarea
Improper sand gradation Slow drainage
between beds; cast con-crete treadways in bedsfor vehicle access; useplanks on bed to supportvehicles
Add additional drainagepipes
Partition large bedsinto smaller beds; levelsand in beds
Remove and replace sand
40
3.6.2 Paved Drying Bed
To alleviate the problem of mechanical sludge removal equipment damaging theunderdrain pipes, paved drying beds were developed. In this concept, the bedsare paved with asphalt or concrete, and have approximately a 1 .5 to 27, slopetoward the center. A perforated drainage pipe is located in the center beneatha sand drainage strip, at an elevation below the paved bed. The key advantageof this type of bed is the ability to use mechanical equipment for sludgeremoval without causing damage to underdrain pipes or loss of sand. The maindisadvantages are high capital cost and a larger land area requirement thanfor sand beds.
3.6.3 Wedgewater Drying Beds
This type drying bed uses a wedgewater panel media placed in an open concretebasin. The concrete basin may be either a new structure, or an existing sanddrying bed retrofitted by removing the sand and pouring a concrete bottom. TheWedgewater panel media acts as a false bottom, and the volume beneath is usedfor collection and removal of water \A\ich percolates through the media. Twotypes of Wedgewater panel media are available. One is constructed of stainlesssteel and the other is constructed of polyurethane. The stainless steel mediarequires supports to be placed on the concrete floor of the basin, while thenewer polyurethane media has integrally molded supports and is self-supporting. The polyurethane media is manufactured in one square foot pieces,each two inches high, which lock together using an integrally molded lockingarrangement. Both types of media can support a small front-end loader, vAienproperly installed.
Prior to introducing sludge, the valve controlling removal of drainage wateris closed, and the beds are filled with water to slightly above the mediasurface. The sludge is then introduced, and the initial drainage rate from thesludge is controlled by controlling the rate of water removed from the volumebeneath the media. Controlled drainage for a period of 15 minutes to 2 hoursis recommended by the manufacturer to maintain sludge porosity and reducecompression of the sludge matrix. After the controlled drainage phase, thesludge is allowed to further dewater by natural drainage for up to 24 hours.It can then be removed.
According to the manufacturer, aerobically digested sludges can be dewateredon a wedgewater drying bed to 8 to 12% solids within 2A hours and anaerobi-cally digested sludges can be dewatered to 16 to 20% in 24 hours. The manufac-turer indicates that the Wedgewater drying bed is most practical for thesmaller treatment plant which has an average daily flow of 0.13 cu m/s (3 mgd)or less (11). As of July 1982, approximately 35 installations were operating,with 8 new projects under construction.
41
3.6.4 Vacuum-Assisted Drying Bed
Vacuum assisted drying beds use a porous media f i l ter plate set above anaggregate filled support plenum, vrtiich drains to a sump. A relatively smallvacuum pump is connected to draw vacuum from the sump. When polymer condition-ed sludge is added to the bed surface, dewatering begins by gravity drainage.When the maximum sludge level in the bed is reached, 30 to 46 cm (12 to 18in), flow of conditioned sludge is stopped, and the vacuum pump operationbegins at 2.5 to 25 cm (1 to 10 in) of mercury. At the point when the cakecracks, the vacuum pump is shut off, and the sludge can be mechanicallyremoved using a front-end loader.
The porous media f i l te r plate is a specially fabricated material consisting ofa thin carborundum plate overlying a layer of sized aggregate which is heldtogether with epoxy. The media f i l ter plates are supplied in sheets, which arecaulked together after they are placed on the aggregate filled plenum. Caulk-ing is also used around the periphery of the bed in order to provide a vacuumseal. A typical size for one bed is 6 by 12 meters (20 by 40 f t ) , with a 1 hp(0.7 kW) vacuum pump required for this size.
The manufacturer claims that a polymer conditioned anaerobically digestedsludge can be dewatered to 12-16% solids in less than 24 hours. Polymer costin this application would be about $8-12 per ton of dry solids. Typical designloadings are about 10 kg/sq m (2 lb/sq ft) per application, or about 30-571/sq m (8-15 gal/sq ft) per application. There are six installations at muni-cipal wastewater treatment plants in the U.S. which have been installed since1979, and at least three more installations are currently under construction.Fi l t ra te is low in suspended solids, generally less than 10 mg/1 (12).
3.7 Sludge Lagoon
Sludge lagoons are not a commonly utilized dewatering process, and littledefinitive design criteria are available. Two types of sludge lagoons may beutilized: storage lagoons and drying lagoons. The objective of storage lagoonsis to store sludge in relatively deep earthen or concrete basins for a multi-year period, until a method of disposal is available. On the other hand,drying lagoons are relatively shallow and are designed for in-place drying ofthe sludge. In either type of lagoon, it is usually necessary to periodicallydecant supernatant from the top of the lagoon and return it to the wastewatertreatment facility.
Sludge storage lagoons are between 1.5 and 4.6 m (5 and 15 ft) deep. Theduration of storage may be anywhere from 1 to 5 years, with the storage timeestablished by the ultimate form of disposal and variable local factors. Atsome plants, storage lagoons have been used either because there was no methodavailable for disposal, or because the disposal methods could not accept allof the sludge.
42
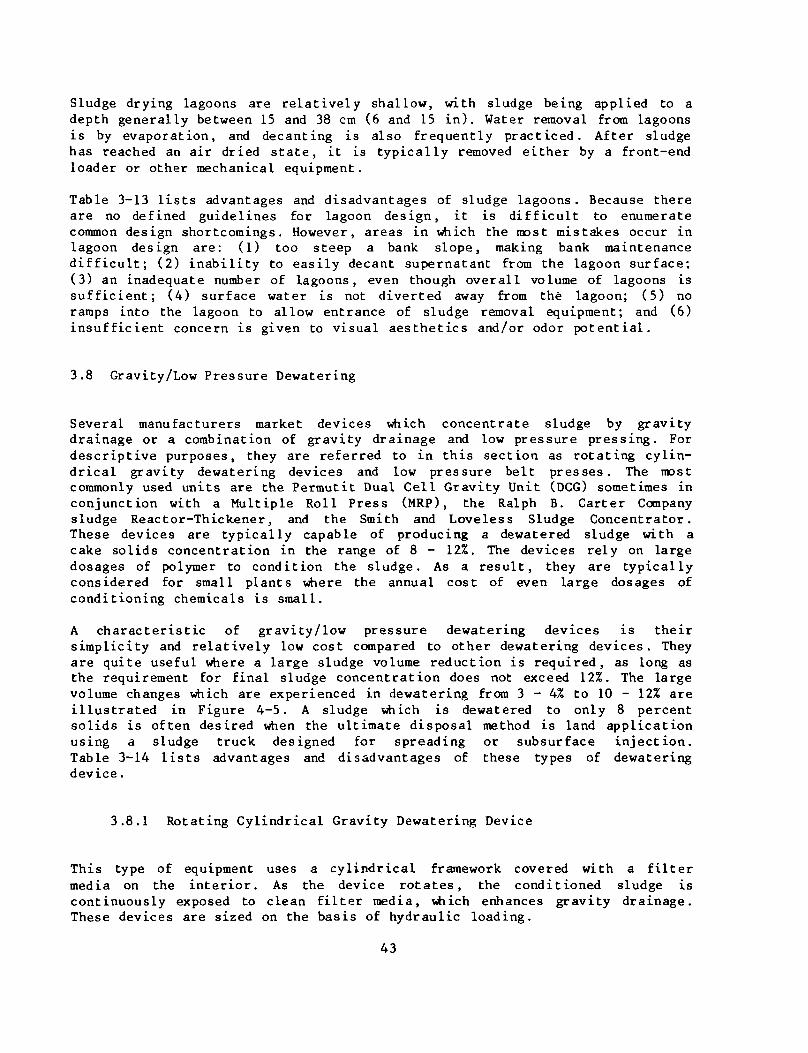
Sludge drying lagoons are relatively shallow, with sludge being applied to adepth generally between 15 and 38 cm (6 and 15 in). Water removal from lagoonsis by evaporation, and decanting is also frequently practiced. After sludgehas reached an air dried state, it is typically removed either by a front-endloader or other mechanical equipment.
Table 3-13 l i s t s advantages and disadvantages of sludge lagoons. Because thereare no defined guidelines for lagoon design, it is difficult to enumeratecommon design shortcomings. However, areas in which the most mistakes occur inlagoon design are: (1) too steep a bank slope, making bank maintenancedifficult; (2) inability to easily decant supernatant from the lagoon surface;(3) an inadequate number of lagoons, even though overall volume of lagoons issufficient; (4) surface water is not diverted away from the lagoon; (5) noramps into the lagoon to allow entrance of sludge removal equipment; and (6)insufficient concern is given to visual aesthetics and/or odor potential.
3.8 Gravity/Low Pressure Dewatering
Several manufacturers market devices which concentrate sludge by gravitydrainage or a combination of gravity drainage and low pressure pressing. Fordescriptive purposes, they are referred to in this section as rotating cylin-drical gravity dewatering devices and low pressure belt presses. The mostcommonly used units are the Permutit Dual Cell Gravity Unit (DCG) sometimes inconjunction with a Multiple Roll Press (MRP), the Ralph B. Carter Companysludge Reactor-Thickener, and the Smith and Loveless Sludge Concentrator.These devices are typically capable of producing a dewatered sludge with acake solids concentration in the range of 8 - 12%. The devices rely on largedosages of polymer to condition the sludge. As a result, they are typicallyconsidered for small plants where the annual cost of even large dosages ofconditioning chemicals is small.
A characteristic of gravity/low pressure dewatering devices is theirsimplicity and relatively low cost compared to other dewatering devices. Theyare quite useful where a large sludge volume reduction is required, as long asthe requirement for final sludge concentration does not exceed 12%. The largevolume changes which are experienced in dewatering from 3 - 4% to 10 - 12% areillustrated in Figure 4-5. A sludge which is dewatered to only 8 percentsolids is often desired when the ultimate disposal method is land applicationusing a sludge truck designed for spreading or subsurface injection.Table 3-14 l i s t s advantages and disadvantages of these types of dewateringdevice.
3.8.1 Rotating Cylindrical Gravity Dewatering Device
This type of equipment uses a cylindrical framework covered with a fi l termedia on the interior. As the device rotates, the conditioned sludge iscontinuously exposed to clean fil ter media, which enhances gravity drainage.These devices are sized on the basis of hydraulic loading.
43
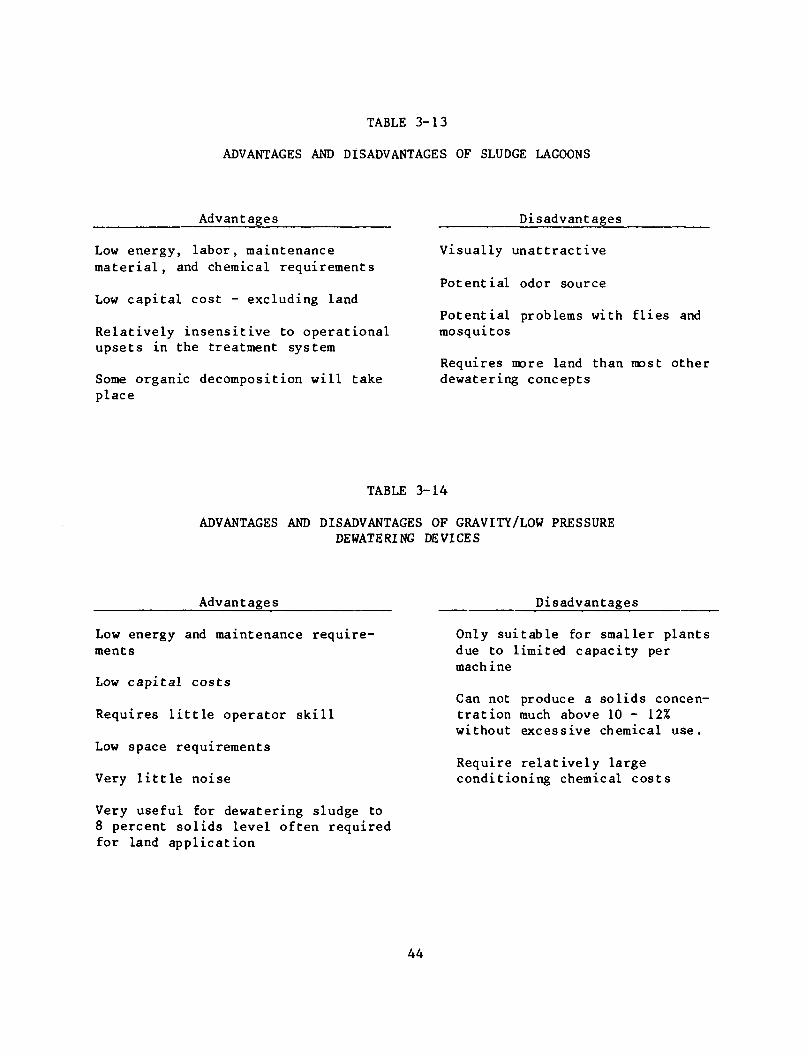
TABLE 3-13
ADVANTAGES AND DISADVANTAGES OF SLUDGE LAGOONS
Advantages
Low energy, labor, maintenancematerial, and chemical requirements
Low capital cost - excluding land
Relatively insensitive to operationalupsets in the treatment system
Some organic decomposition will takeplace
Disadvantages
Visually unattractive
Potential odor source
Potential problems with flies andtnosquitos
Requires more land than most otherdewatering concepts
TABLE 3-14
ADVANTAGES AND DISADVANTAGES OF GRAVITY/LOW PRESSUREDEWATERING DEVICES
Advantages
Low energy and maintenance require-ments
Low capital costs
Requires little operator skill
Low space requirements
Very little noise
Very useful for dewatering sludge to8 percent solids level often requiredfor land application
Disadvantages
Only suitable for smaller plantsdue to limited capacity permachine
Can not produce a solids concen-tration much above 10 - 12%without excessive chemical use.
Require relatively largeconditioning chemical costs
44
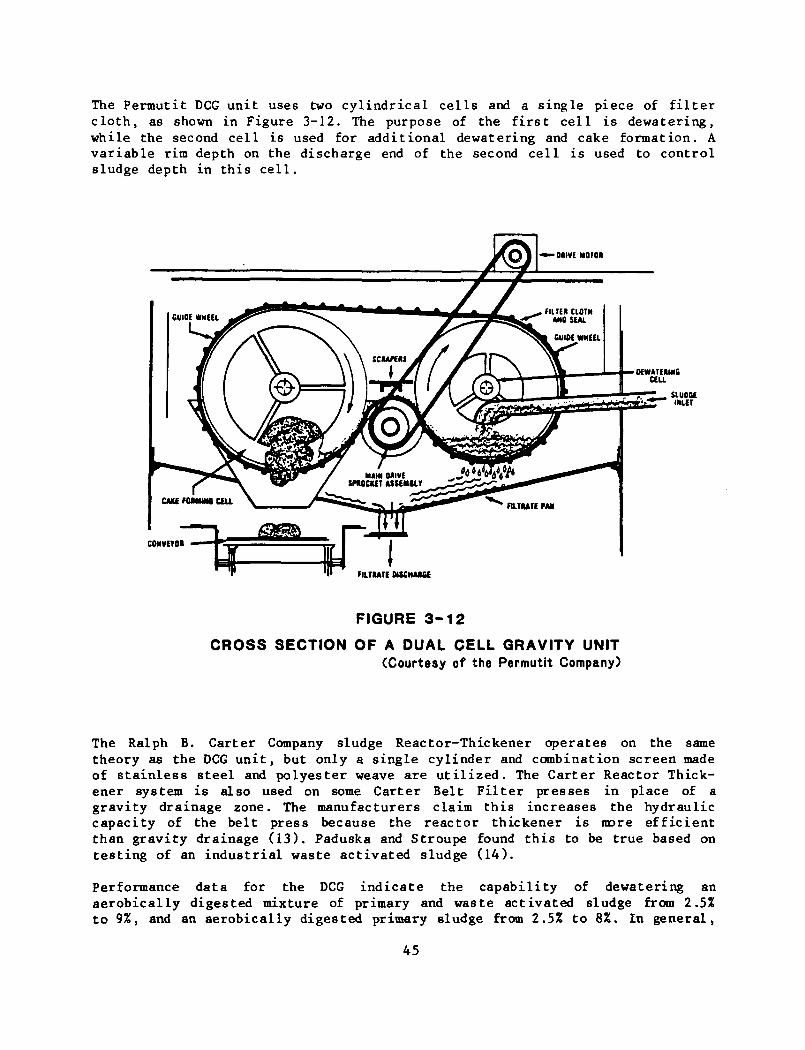
The Pennutit DCG unit uses two cylindrical cells and a single piece of filtercloth, as shown in Figure 3-12. The purpose of the first cell is dewatering,while the second cell is used for additional dewatering and cake formation. Avariable rim depth on the discharge end of the second cell is used to controlsludge depth in this cell.
' SLUOGEMIET
CMVEVOI
FILTRATE KSCHMfiE
FIGURE 3 - 1 2
CROSS SECTION OF A DUAL CELL GRAVITY UNIT(Courtesy of the Permutit Company)
The Ralph B. Carter Company sludge Reactor-Thickener operates on the sametheory as the DCG un i t , but only a single cylinder and combination screen madeof s ta in less s teel and polyester weave are u t i l i z ed . The Carter Reactor Thick-ener system is also used on some Carter Belt F i l t e r presses in place of agravity drainage zone. The manufacturers claim this increases the hydrauliccapacity of the belt press because the reactor thickener is more efficientthan gravity drainage (13). Paduska and Stroupe found th i s to be true based ontest ing of an indust r ia l waste activated sludge (14).
Performance data for the DCG indicate the capabili ty of dewatering anaerobically digested mixture of primary and waste activated sludge from 2.5%to 9%, and an aerobically digested primary sludge from 2.5% to 8%. In general,
45
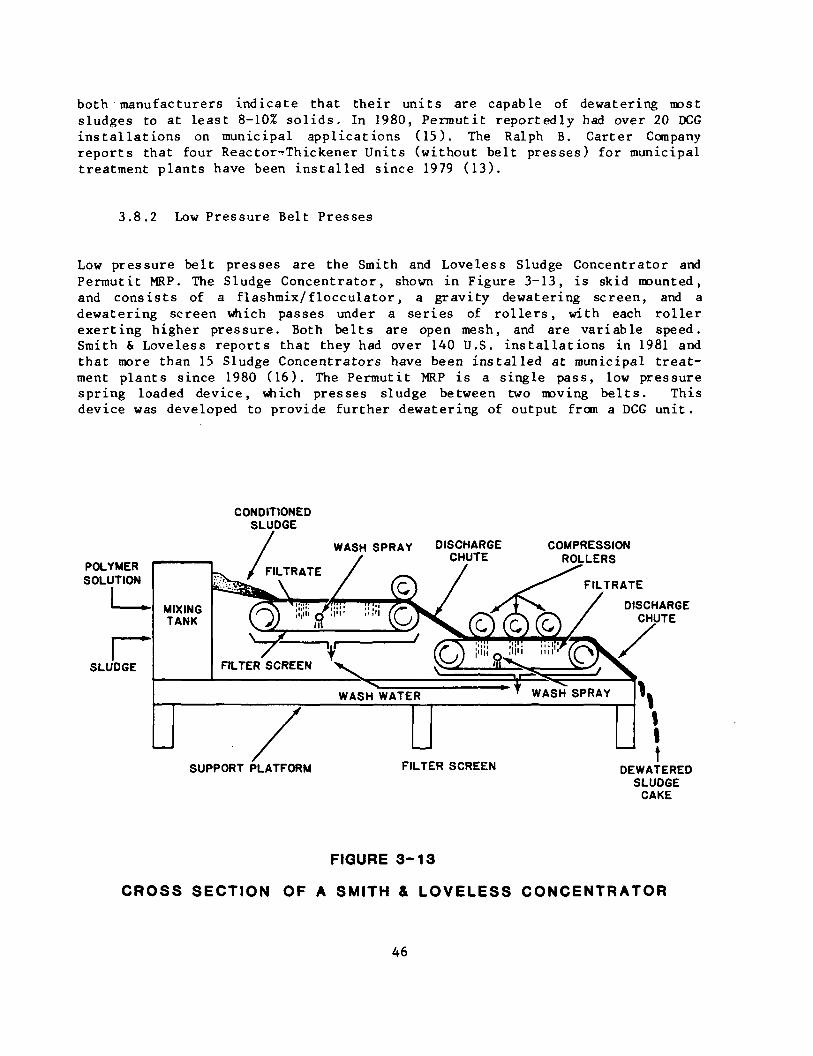
both manufacturers indicate that their units are capable of dewatering mostsludges to at least 8-10% solids. In 1980, Permutit reportedly had over 20 DCGinstallat ions on municipal applications (15). The Ralph B. Carter Companyreports that four Reactor-Thickener Units (without belt presses) for municipaltreatment plants have been installed since 1979 (13).
3.8.2 Low Pressure Belt Presses
Low pressure belt presses are the Smith and Loveless Sludge Concentrator andPerroutit MRP. The Sludge Concentrator, shown in Figure 3-13, is skid mounted,and consists of a flashmix/flocculator, a gravity dewatering screen, and adewatering screen which passes under a series of rol lers , with each rollerexerting higher pressure. Both belts are open mesh, and are variable speed.Smith & Loveless reports that they had over 140 U.S. installations in 1981 andthat more than 15 Sludge Concentrators have been installed at municipal treat-ment plants since 1980 (16). The Permutit MRP is a single pass, low pressurespring loaded device, which presses sludge between two moving bel ts . Thisdevice was developed to provide further dewatering of output from a DCG unit.
POLYMERSOLUTION
SLUDGE
MIXINGTANK
CONDITIONEDSLUDGE
WASH SPRAY DISCHARGE COMPRESSIONCHUTE ROLLERS
FILTRATE
DISCHARGECHUTE
FILTER SCREEN
WASH WATER
SUPPORT PLATFORM FILTER SCREEN DEWATEREDSLUDGE
CAKE
FIGURE 3-13
CROSS SECTION OF A SMITH & LOVELESS CONCENTRATOR
46
These devices are significantly less costly then the more complex, higherpressure belt presses, which produce a higher solids content cake. Typicalsludge cakes produced by these low pressure presses are in the range of 8 to12% with polymer dosages of 5 to 7.5 g/kg (10 to 15 lb/ton) depending on thesludge type. When the MRP is used after the DCG unit, sludge concentrations upto 15% have been claimed by the manufacturer.
3.9 References
1. "Process Design Manual For Sludge Treatment and Disposal," USEPA - Centerfor Environmental Research Information, Cincinnati, Ohio, 45268,EPA-625/1-79/011, September 1979.
2. "Innovative and Alternative Technology Assessment Manual," USEPA - Officeof Water Program Operations, Washington, D.C., 20460, MCD-53,EPA-430/9-78-009, February 1980.
3. Bachtel, David R., "Operation and Maintenance of a Low Speed ScrollCentrifuge," County Sanitation District No. 2 of Los Angeles County,California, March 1982.
4. Personal communication with Richard T. Moll, Manager of ProcessEngineering, Sharpies-Stokes Division, Pennwalt Corporation, Warminster,Pennsylvania, June 9, 1982.
5. Personal communication with Stephen H. Silverman, Sales Manager,Centrifuge Division, KHD Humboldt Wedag, Atlanta, Georgia, June 1982.
6. Trubiano, R., Bachtel, D., LeBrunT., and Horvath, R. , "ParallelEvaluation of Low Speed Scroll Centrifuges and Belt Filter Presses forDewatering Municipal Sewage Sludge," Draft EPA Report, Contract68-03-2745, 1981. (Authors are with County Sanitation Districts of LosAngeles County, Whittier, California.)
7. Harrison, J.R., "Review of Developments in Dewatering WastewaterSludges," Sludge Treatment and Disposal, Volume 1 - Sludge Treatment,USEPA - Center for Environmental Research Information, Cincinnati, Ohio,45268, EPA-625/4-78-012, October 1978.
8. Personal communication, Don Cline, Fulco Sales, Garden Grove, California,Sales Representative for Envirotech, August 1981.
9. Personal communication, Don Herman, Herman-Phinney-Kodmur, Los Angeles,California, Sales Representative for Parkson Corporation, June 1981.
10. Personal communication, Eric Hammarstron, Komline Sanderson EngineeringCorporation, Peapack, New Jersey, June 1981.
11. Personal communication, Vince Spalding, Hendrick Fluid Systems,Carbondale, Pennsylvania, July 1982.
47
12. Personal communication, Rob Ramsay, U. S. Environmental Products, SantaAna, California, April 1982.
13. Personal communication, LeRoy A. Swenson, Ralph B. Carter Company,May 25, 1982.
14. Poduska, R.A. and Stroupe, R.C., "Belt-Filter Press Dewatering Studies,Implementation, and Operation at the Tennessee Eastman Company IndustrialActivated Sludge Wastewater Treatment System," presented at the 35thAnnual Purdue Industrial Waste Conference, May 1980.
15. Personal communication, Bob Nagle, Permutit Company, Inc., Paramus, NewJersey, June 1982.
16. Personal communication, Don Aholt, Smith & Loveless, Inc., Lenexa,Kansas, May 27, 1982.
48
CHAPTER 4
CAPABILITIES OF DEWATERING PROCESSES
4.1 Introduction
To define the capabilities of dewatering processes, a comprehensive andcritical review was made of all available experience from full-scaleoperations. Engineering judgment was used in interpreting the data reviewed,and it is possible that others would reach different conclusions from the sameinformation. Sources of information included the published literature,communication with manufacturers, literature from manufacturers, wastewatertreatment plant contacts, communication with consultants, discussions withgovernment officials, and the authors' own files. It is realized that theremay exist information that differs from that presented here and which was notreadily available to the writers of this manual.
Data were obtained from side-by-side comparisons of different dewateringprocesses as well as side-by-side comparisons of the same type of equipmentsupplied by different manufacturers. Similarly, data were obtained forequipment permanently installed at plant si tes. Much of the informationgathered included the newer advances in dewatering technology: the solid bowlcentrifuge with backdrive capability, third generation belt filter press, andthe diaphragm filter press.
The principal factors which influence the capabilities of dewateringprocesses, and which were considered in the writers' review, are:
• Source of Sludge - Domestic wastewater- Domestic wastewater with a varying percentage of
industrial wastewaters
• Type of Sludge - Primary- Biological (WAS, TF, RBC, etc)- Combinations of primary and biological
• Sludge Solids Concentration
• Prior Handling of Sludge - Thickening- Stabilization- Storage- Transport
• Process Design - Conditioning provisions- Operational flexibility
49
4.2 Performance Capabilities of Mechanical Dewatering Processes
Based upon an evaluation of the performance information collected, a series offour figures was developed to illustrate the typical performance of mechanicaldewatering processes with different types of sludges. Each figure presents arange for the sludge cake solids concentration expected from each dewateringprocess. The cake solids concentration varies for several reasons. First andmost importantly, the cake solids concentration produced by any dewateringprocess can be influenced by the sludge feed rate and by changing the parame-ters that influence the process operation. Principal process operationalvariables will be described in Section 4.3 of this Chapter. Naturally, bothoverall economics and the degree of solids capture need to be considered indetermining the optimum operation of the dewatering process. Secondly, choiceand quantity of conditioning chemicals added can dramatically change the finalsludge cake solids concentration; again, economics are a key factor to beconsidered in selecting the optimum chemical dosage. Third, no sludge consis-tently exhibits the same dewatering characteristics, and sludges from differ-ent plants exhibit wide variations in their ability to be dewatered. A numberof factors are responsible for such variations, including the influence ofindustrial discharges on sludge composition, particularly its organic content,and the variability of preceding processes in the sludge treatment system suchas thickening, storage or holding, transport, and stabilization operations.
Figures 4-1 to 4-4 are presented to illustrate the capabilities of mechanicaldewatering processes on different types of sludge, and each of these figuresis described in subsequent paragraphs. In utilizing the information in thesefigures, the reader is cautioned that the cake solids concentrations given donot correct for any inorganic conditioning chemicals, do not take into accountthe cost of chemical conditioning, and do not take into account the percentrecovery obtained. The data are, however, based on reasonable levels ofchemical conditioning and solids recoveries for the processes considered.
Figure 4-1 provides typical ranges for dewatered sludge cake solidsconcentrations produced by mechanical dewatering processes on digested primaryand waste activated sludge (WAS) combinations. It is apparent from this figurethat as the percentage of WAS increases, the achievable cake solids concen-tration decreases, and similarly, that 100% primary sludge is much easier todewater than 100% WAS. Figure 4-1 also illustrates the differences in thecapabilities of various mechanical dewatering processes. The diaphragm filterpress will typically produce the driest, most highly dewatered sludge cake ofany mechanical dewatering process, while the fixed volume recessed plate orconventional filter press (both high and low-pressure) will produce the nexthighest solids content cake. Belt filter presses, solid bowl centrifuges, andvacuum filters can all produce similarly dewatered cakes, although beltpresses are generally capable of producing the driest cake of these threeprocesses. Basket centrifuges generally produce a cake somewhat lower insolids concentration than the other dewatering processes. It should be notedthat the cake solids contents for the diaphragm filter press, the conventionalfilter press, and the vacuum filter will usually include large amounts ofinorganic conditioning chemicals. These additives reduce the actual sludgesolids content.
50
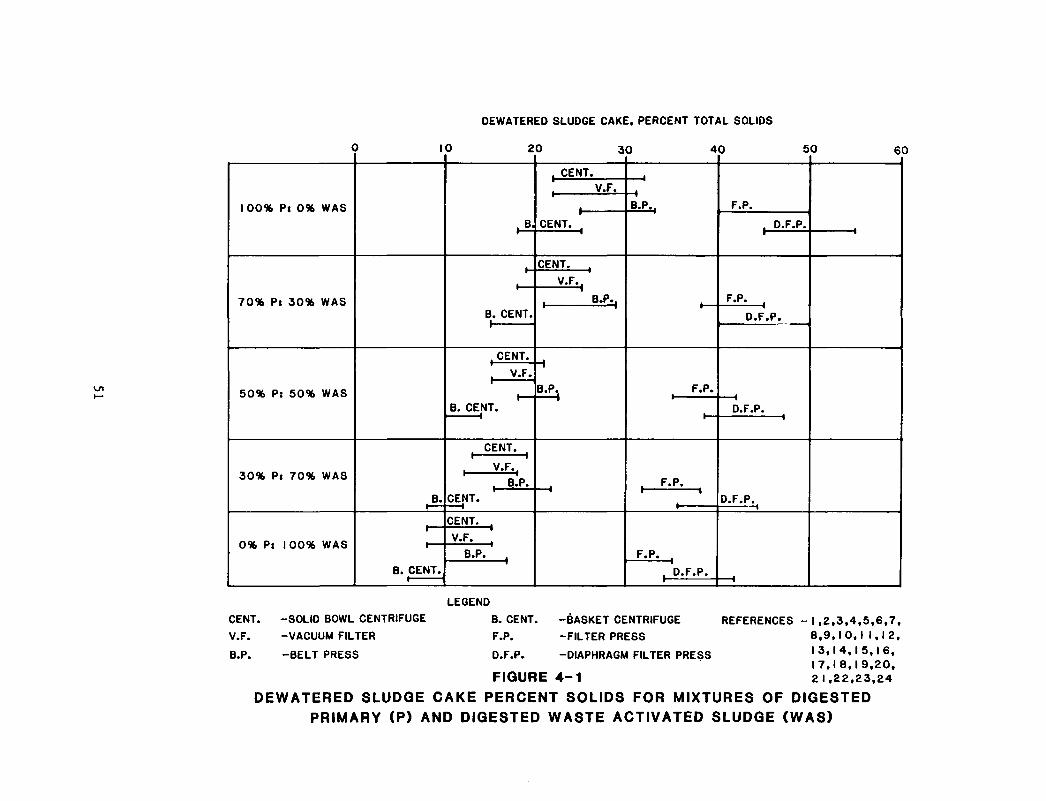
10
DEWATERED SLUDGE CAKE. PERCENT TOTAL SOLIDS
20 30 40 50 60
100% Pt 0% WAS
CENT.V.F.
-IB.P.. F.P.
B. CENT. D.F.P.
7 0 % P» 3 0 % WAS
CENT.
V.F..
B.P., F.P.B. CENT. D.F.P.
50% Pt 50% WAS
CENT.
V.F.
B.P, F.P.
B. CENT. D.F.P.
30% P« 70% WAS
(_CENT1_)
V.F.(
• B-P.
CENT. D.F.P.
0% P: 100% WAS
CENT.
V.F.
B.P. F.P.
B. CENT. D.F.P.
LEGEND
CENT. -SOLID BOWL CENTRIFUGE B. CENT. -BASKET CENTRIFUGE
V.F. -VACUUM FILTER F.P. -FILTER PRESS
B.P. -BELT PRESS D.F.P. -DIAPHRAGM FILTER PRESS
FIGURE 4 - 1
REFERENCES -1,2,3,4,5,6,7,
8,9,10,11,12.
13,14,15,16,
17.18,19,20,
21,22,23,24
DEWATERED SLUDGE CAKE PERCENT SOLIDS FOR MIXTURES OF DIGESTEDPRIMARY (P) AND DIGESTED WASTE ACTIVATED SLUDGE (WAS)
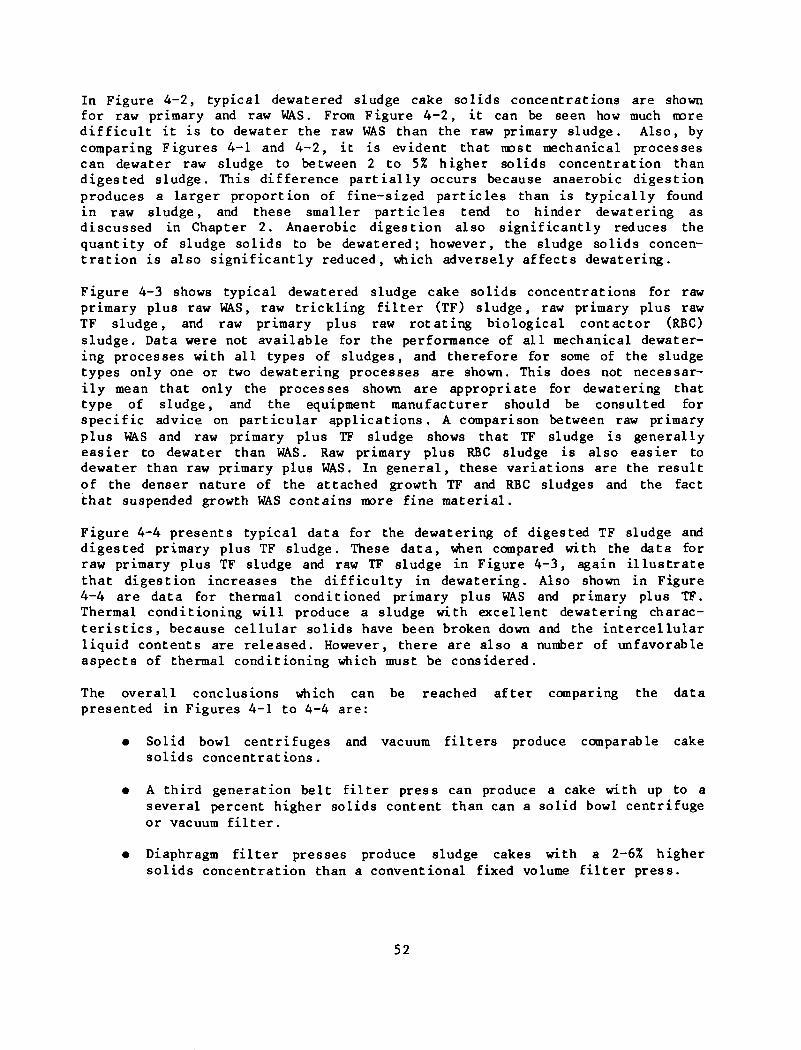
In Figure 4-2, typical dewatered sludge cake solids concentrations are shownfor raw primary and raw WAS. From Figure 4-2, it can be seen how much moredifficult it is to dewater the raw WAS than the raw primary sludge. Also, bycomparing Figures 4-1 and 4-2, it is evident that most mechanical processescan dewater raw sludge to between 2 to 5% higher solids concentration thandigested sludge. This difference partially occurs because anaerobic digestionproduces a larger proportion of fine-sized particles than is typically foundin raw sludge, and these smaller particles tend to hinder dewatering asdiscussed in Chapter 2. Anaerobic digestion also significantly reduces thequantity of sludge solids to be dewatered; however, the sludge solids concen-tration is also significantly reduced, which adversely affects dewatering.
Figure 4-3 shows typical dewatered sludge cake solids concentrations for rawprimary plus raw WAS, raw trickling filter (TF) sludge, raw primary plus rawTF sludge, and raw primary plus raw rotating biological contactor (RBC)sludge. Data were not available for the performance of all mechanical dewater-ing processes with all types of sludges, and therefore for some of the sludgetypes only one or two dewatering processes are shown. This does not necessar-ily mean that only the processes shown are appropriate for dewatering thattype of sludge, and the equipment manufacturer should be consulted forspecific advice on particular applications. A comparison between raw primaryplus WAS and raw primary plus TF sludge shows that TF sludge is generallyeasier to dewater than WAS. Raw primary plus RBC sludge is also easier todewater than raw primary plus WAS. In general, these variations are the resultof the denser nature of the attached growth TF and RBC sludges and the factthat suspended growth WAS contains more fine material.
Figure 4-4 presents typical data for the dewatering of digested TF sludge anddigested primary plus TF sludge. These data, when compared with the data forraw primary plus TF sludge and raw TF sludge in Figure 4-3, again illustratethat digestion increases the difficulty in dewatering. Also shown in Figure4-4 are data for thermal conditioned primary plus WAS and primary plus TF.Thermal conditioning will produce a sludge with excellent dewatering charac-teristics, because cellular solids have been broken down and the intercellularliquid contents are released. However, there are also a number of unfavorableaspects of thermal conditioning which must be considered.
The overall conclusions which can be reached after comparing the datapresented in Figures 4-1 to 4-4 are:
• Solid bowl centrifuges and vacuum filters produce comparable cakesolids concentrations.
• A third generation belt filter press can produce a cake with up to aseveral percent higher solids content than can a solid bowl centrifugeor vacuum filter.
• Diaphragm filter presses produce sludge cakes with a 2-6% highersolids concentration than a conventional fixed volume filter press.
52
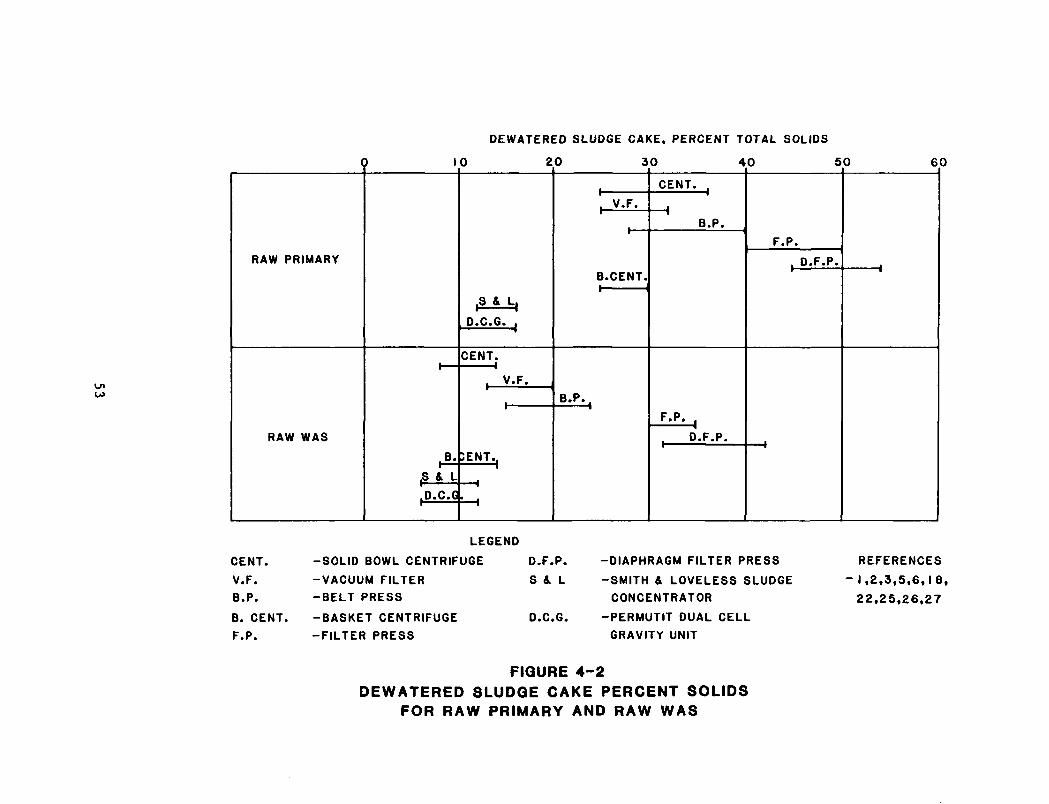
to
RAW PRIMARY
RAW WAS
DEWATERED SLUDGE CAKE. PERCENT TOTAL SOLIDS
0 20 30 40 50
& L
D.C.C
.S & L
D.C.G. ,
CENT.1
V.F.
SENT.
V.F.
B.CENT.
B.P.,
CENT.^
B.P.
F.P.•ID.F.P.
F.P.
D.F.P.
LEGEND
CENT. -SOLID BOWL CENTRIFUGE D.F.P.
V.F. -VACUUM FILTER S & LB.P. -BELT PRESS
B. CENT. -BASKET CENTRIFUGE D.C.G.
F.P. -FILTER PRESS
-DIAPHRAGM FILTER PRESS
-SMITH & LOVELESS SLUDGE
CONCENTRATOR
-PERMUTIT DUAL CELL
GRAVITY UNIT
FIGURE 4-2DEWATERED SLUDGE CAKE PERCENT SOLIDS
FOR RAW PRIMARY AND RAW WAS
60
REFERENCES
- 1 , 2 . 3 , 5 , 6 , 1 8 ,22,25,26,27
10DEWATERED SLUDGE CAKE, PERCENT TOTAL SOLIDS
20 30 40 50 6 0
RAW P & WAS(Approx. 111 ratio)
I-CENT.
V.F.,
B.P.
F.P.HD.F.P.
B.CENT.I 1
RAW TFV.F.
B. CENT.
RAW P 4 TF
CENT.
V.F.
B.P.D.F.P.
B.CENT.
RAW P & RBCB.CENT.
LEGENDCENT. -SOLID BOWL CENTRIFUGE D.C.G.V.F. -VACUUM FILTER
B.P. -BELT PRESS RBC
B. CENT. -BASKET CENTRIFUGE
F.P. -FILTER PRESS PD.F.P. -DIAPHRAGM FILTER PRESS WASS & L -SMITH 4 LOVELESS SLUDGE TF
CONCENTRATOR
-PERMUTIT DUAL CELLGRAVITY UNIT
-ROTATING BIOLOGICALCONTACTOR
-PRIMARY
-WASTE ACTIVATED SLUDGE-TRICKLING FILTER
REFERENCES
-1,2,4,7,15,18,
22,28,29,30
FIGURE 4-3DEWATERED SLUDQE CAKE PERCENT SOLIDS FOR MIXTURES OF
RAW PRIMARY AND SECONDARY SLUDGES
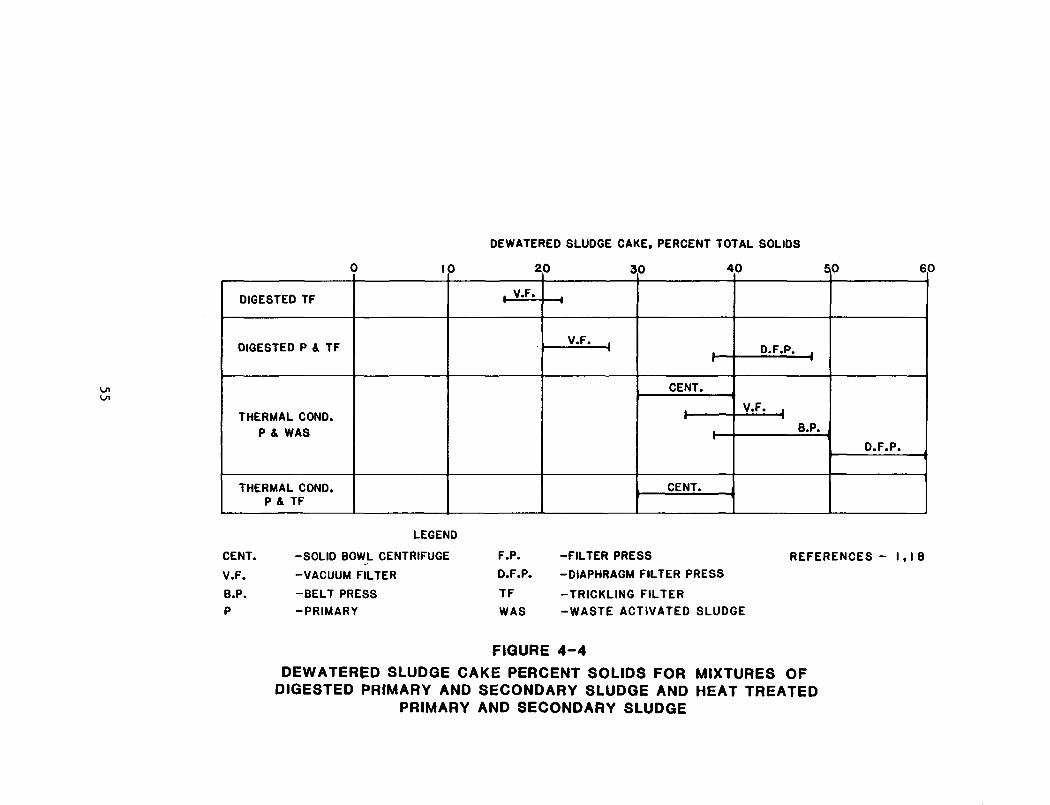
10
DEWATERED SLUDGE CAKE, PERCENT TOTAL SOLIDS
20 30 4.0 60
DIGESTED TF V.F.
DIGESTED P & TFV.F.
D.F.P.
THERMAL COND.P & WAS
CENT.
V.F.
B.P.
D.F.P.
THERMAL COND.P & TF
CENT.
CENT.
V.F.
B.P.P
LEGEND
-SOLID BOWL CENTRIFUGE
-VACUUM FILTER
-BELT PRESS-PRIMARY
F.P.
D.F.P.
TF
WAS
-FILTER PRESS
-DIAPHRAGM FILTER PRESS
-TRICKLING FILTER-WASTE ACTIVATED SLUDGE
REFERENCES - 1,16
FIGURE 4-4DEWATERED SLUDGE CAKE PERCENT SOLIDS FOR MIXTURES OF
DIGESTED PRIMARY AND SECONDARY SLUDGE AND HEAT TREATEDPRIMARY AND SECONDARY SLUDGE
• Digested primary sludge can be dewatered to a significantly highersolids content than digested WAS. The extent varies among thedifferent dewatering processes.
• Raw sludge can typically be dewatered to a solids concentration thatis 2 to 4% higher than that for the same sludge which has beendigested.
• TF and RBC sludges, either raw or digested, dewater to a higher solidscontent than WAS.
• All processes exhibit a range of probable sludge cake solidsconcentrations, due to varying loading or feed rates, amount and typeof conditioning utilized, equipment operational variables, and thevariability of the sludge composition from location to location.
4.3 Process Operational Variables Which Affect Dewatering Results
As the prior section illustrates, a substantial range in dewatered sludge cakesolids concentrations is evidenced for all mechanical dewatering processes.One reason is variable sludge composition from plant to plant, while animportant second reason is the number of variables associated with operationof the dewatering process. All dewatering processes have several operationalvariables which influence process performance. The four key factors normallyused to evaluate process performance are: cake solids concentration; percentsolids capture; process throughput; and conditioning chemical requirements. Itis not possible to vary process operation to simultaneously optimize all fourprocess performance indicators. For example, a change in process operation toincrease cake solids concentration without changing conditioning chemicaldosage, would likely result in decreases in process throughput and solidscapture. The process operator must determine which of the four processperformance indicators are most important and change the operational variablesto achieve the desired results.
For the dewatering processes included in this manual, Table 4-1 lists keyoperational variables, and these operational variables are discussed in thefollowing sections.
4.3.1 Basket Centrifuge
Increasing the bowl speed and the time at full speed will increase cake solidscontent and usually solids capture, although increasing the time at full speedwill reduce machine throughput. An increase in the depth of skimming willresult in a drier cake, but it will return more solids back to the plant forsubsequent retreatment. Polymer dosage increase will increase cake solidsconcentration and percent solids capture up to a point. An increase in sludgefeed rate will increase the throughput, but may require more polymer andproduce a lower cake solids concentration with a lower solids capture.
56
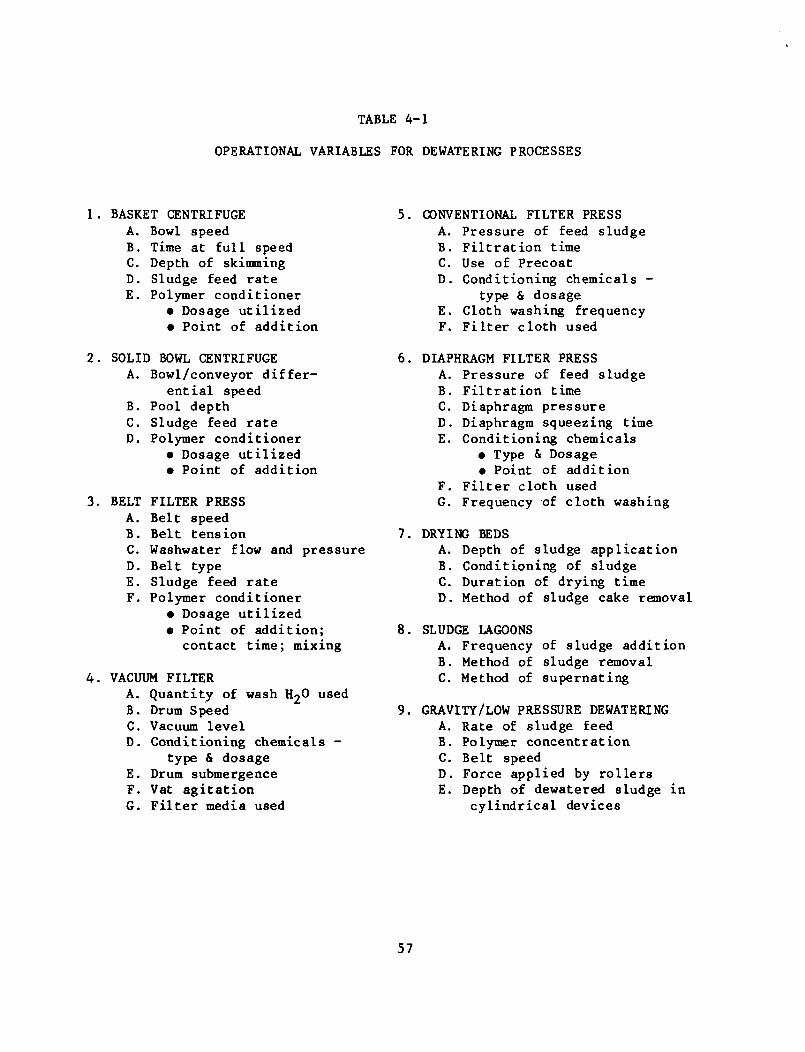
TABLE 4-1
OPERATIONAL VARIABLES FOR DEWATERING PROCESSES
1. BASKET CENTRIFUGEA. Bowl speedB. Time at full speedC. Depth of skimmingD. Sludge feed rateE. Polymer conditioner
• Dosage utilized• Point of addition
2. SOLID BOWL CENTRIFUGEA. Bowl/conveyor differ-
ential speedB. Pool depthC. Sludge feed rateD. Polymer conditioner
• Dosage utilized• Point of addition
3. BELT FILTER PRESSA. Belt speedB. Belt tensionC. Washwater flow and pressureD. Belt typeE. Sludge feed rateF. Polymer conditioner
• Dosage utilized• Point of addition;
contact time; mixing
4. VACUUM FILTERA. Quantity of wash HoO usedB. Drum SpeedC. Vacuum levelD. Conditioning chemicals -
type & dosageE. Drum submergenceF. Vat agitationG. Filter media used
5. CONVENTIONAL FILTER PRESSA. Pressure of feed sludgeB. Filtration timeC. Use of PrecoatD. Conditioning chemicals -
type & dosageE. Cloth washing frequencyF. Filter cloth used
6. DIAPHRAGM FILTER PRESSA. Pressure of feed sludgeB. Filtration timeC. Diaphragm pressureD. Diaphragm squeezing timeE. Conditioning chemicals
• Type & Dosage• Point of addition
F. Filter cloth usedG. Frequency of cloth washing
7. DRYING BEDSA. Depth of sludge applicationB. Conditioning of sludgeC. Duration of drying timeD. Method of sludge cake removal
8. SLUDGE LAGOONSA. Frequency of s ludge a d d i t i o nB. Method of s ludge removalC. Method of supernat ing
9. GRAVITY/LOW PRESSURE DEWATERINGA. Rate of s ludge feedB. Polymer c o n c e n t r a t i o nC. Be l t speedD. Force applied by rollersE. Depth of dewatered sludge in
cylindrical devices
57
4.3.2 Solid Bowl Centrifuge
Increasing the bowl speed will in theory increase the cake dryness, because ofhigher gravitational force. However, in some cases the increased shear of thesludge floe which occurs when the sludge is fed will tend to offset the advan-tage of the higher bowl speed. Shearing of the sludge floe at increased Gforces is usually not a problem in a centrifuge where the polymer is addedinternally and the floe is formed after both the polymer and feed have reachedthe speed of the centrifuge. In a solid bowl conveyor centrifuge, the scrolloperates at a slightly slower or higher speed than the bowl. As the scrollspeed approaches the bowl speed, the resultant differential speed is reducedand machine capacity decreases. As the bowl-conveyor differential speedincreases, solids are removed from the machine quicker, thereby increasingmachine capacity. Offsetting this, however, is the usual production of awetter cake, when the solids are removed faster from the machine. Use of abackdrive to maintain either a constant torque or a constant differentialspeed between the scroll and the bowl will usually result in a drier sludgecake, but at the same time will decrease machine throughput. An increase inthe pool depth will result in increased solids capture, but generally a wettersludge cake is produced. Increasing the polymer dosage will generally increaseboth cake dryness and solids capture, although an increase in solids capturecan cause the cake solids content to be reduced as more fine material iscaptured.
4.3.3 Belt Filter Press
Machine throughput can be increased by increasing belt speed, with the usualresult being production of a lower solids content cake, because both gravitydrainage time and press time are decreased. Increased belt tension willpromote a drier cake, but solids capture will normally decrease, and belt wearwill increase. An increase in washwater flow and/or pressure can increase cakesolids concentration, if the washwater was not adequately cleaning the belt.Also, the more porous the belt, the drier the cake and lower the solidscapture. An increase in sludge feed rate can increase machine throughput ifthe belt speed is high enough to move the sludge, and if the polymer dosage ishigh enough to maintain solids capture. As polymer dosage increases, both cakesolids and solids capture increase, until an upper limit is reached. Point ofpolymer addition can be important to allow sufficient contact time before theconditioned sludge is applied to the belt press.
4.3.4 Vacuum Filter
In cases where insufficient cloth washing is used, increasing the amount ofcloth wash water will increase the machine throughput and will help to some-what increase cake dryness. A high drum speed will increase machine throughputbut may decrease solids content of the cake. A high vacuum level will increasethe cake solids content at the expense of increased energy consumption. An
58
increased drum submergence will increase machine capacity but will decreasedrying time and may decrease solids content of the cake. Vat agitation isnecessary for proper cake formation, but over-agitation will result in break-ing up the sludge floe and poor solids capture. The addition of scraperblades, use of excess chemical conditioner, or addition of fly ash, are some-times required to obtain cake release from cloth media vacuum fi l ters . Thisis especially true if the sludges are greasy, sticky, and/or contain a largequantity of waste activated sludge.
4.3.5 Fixed Volume Filter Press
Use of a higher feed pressure and a longer cycle time will increase cakesolids concentration, although the latter will decrease machine throughput.Use of a precoat will improve solids capture, reduce filtration time, andpreserve the media's efficiency. A precoat would normally be required only fora digested sludge which has very fine floe, or to obtain an adequate cakerelease. For a "sticky" sludge, use of a precoat actually saves time bysignificantly reducing the cloth washing frequency. Conditioning is particu-larly important. To achieve an adequate cake release and a reasonable fil tra-tion time, lime and ferric chloride are typically required for conditioning,although thermal conditioning can also be used and there has been some limitedsuccess using polymers. A correct conditioning chemical dosage will result ina dry cake, while an incorrect dosage will decrease machine throughput due tothe use of excess chemicals, or will produce a wet sludge cake. Frequentfil ter cloth washing will increase machine throughput, cake dryness, and clothl i fe , while use of a suitable fil ter cloth will increase solids capture andprobably the machine capacity.
4.3.6 Diaphragm Filter Press
Feed sludge pressure and pumping time only have a moderate effect on theproduct cake. More significant factors are the diaphragm pressure and thediaphragm squeezing time, both of which increase cake dryness when they areincreased. Influence of other variables is similar to the fixed volume filterpress. The type of filter cloth used is generally established by wear andabrasion resistance, ease of cake release, and quality of the filtrate (solidscapture).
4.3.7 Drying Beds
Bed capacity is maximized by using shallow sludge applications andconditioning the sludge with polymer. Naturally, longer drying times willproduce a greater cake solids content; however, if the cake is dry enough tobe removed using mechanical equipment and if the bed capacity is required forthe application of wet sludge, or if there is the potential for substantialrainfall, it may be necessary to remove the dried sludge prior to the
59
achievement of optimum dryness. Sludge cake removal can be performed manuallyin very small plants, although typically i t is removed with a front-end loaderor grader.
4.3.8 Sludge Lagoons
Use of relatively infrequent sludge applications will result in bettersettling, a higher cake solids concentration and fewer solids in the recycle.If sludge is removed by a dragline and allowed to dry on the lagoon periphery,it will have a higher solids content than if a dredge is used for solidsremoval. Supernatant can be removed by fixed pipelines at several depths inthe lagoon or by lowering a submersible pump or suction line to the desireddepth in the lagoon.
4.3.9 Gravity/Low Pressure Dewatering
Both rotating cylindrical gravity dewatering devices and low pressure beltpresses will produce a higher solids content cake at lower sludge feed ratesand higher polymer dosages. These are the two most important operationalfactors. Other operational factors are the depth of sludge in the rotatingcylindrical devices, and the belt speed and roller pressure in low pressurebelt presses.
4.4 Effect of Dewatering on Sludge Volume
As cake solids content increases, dramatic reductions in sludge volume occur,as shown in Figure 4-5. However, as higher cake solids concentrations areachieved, the percentage volume reduction is not as great. For example,increasing dewatering from 10 to 15% solids reduces volume by 35%, whileincreasing dewatering from 20 to 25% solids only reduces volume by 21%. Inother words, as the final dewatered cake concentration increases from a lowlevel to a higher level, the incremental volume reduction becomes lower. Thisrelationship is an important factor.
In certain situations, the relatively inexpensive dewatering processes thatdewater from 3% solids to 8 to 12% cake solids may be economically justifiedeven though hauling and disposal costs may be higher. This is because a volumereduction of 70 to 80% can be achieved with even the gravity/low pressuredevices. Also, in situations involving further dewatering beyond 20%, volumeand weight reductions may not be justified on an overall economic basis. Whileno economic decisions can be made based solely, on Figure 4-5, the relationshippresented is often useful in the ini t ia l screening stage of evaluatingdewatering concepts, where dewatering requirements and possible ways of accom-plishing them are being evaluated. This is discussed in detail in Chapter 6.
60
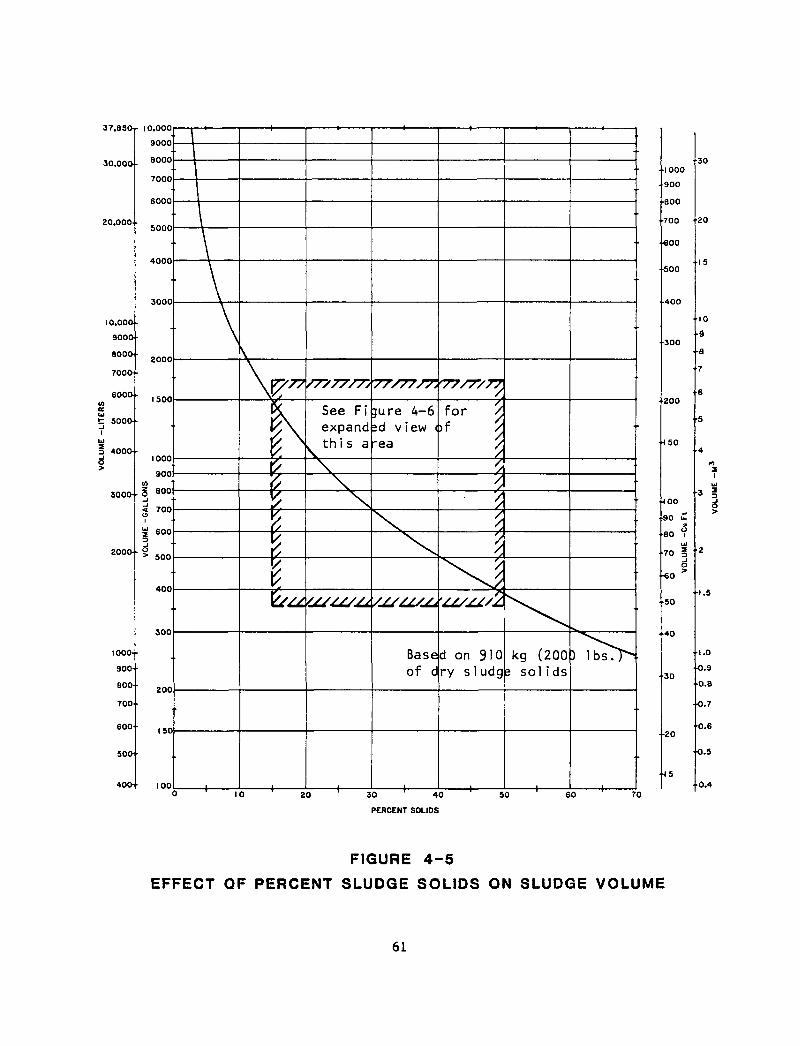
37,830,- 10,000
9000
8000
7000
30,000
20,000
10,000-
9000-
8000-•
7000-•
6000-•COecUJt 5000-
400O
3000-•
2000"
I000--
900-
BOO
700
600
50&-
400-
6000
SOOO
4000
3000
2000
1500
1000900
§ 800
3 700
£ 600
> 500
400
300
200
150
10010
77V7777/T/77/77S7777S7777
I1
See Fiexpandth is a
jure 4-6d v iewea
Basejdof
forf
dryon 910
s 1 udgkg (200
z sol ids) l bs ,
20 30 40
PERCENT SOLIDS
50 60 70
1000
900
800
700
600
500
-400
300
30
20
15
10
200
4 50
4 00
90 £
80 ?
70 3
• -a
7
6
"5
• 2
50
40
30
15
•1.5
1.0
0.9
0.8
0.7
0.6
0.5
0.4
FIGURE 4 -5
EFFECT OF PERCENT SLUDGE SOLIDS ON SLUDGE VOLUME
61
Another way of evaluating differing cake solids concentrations is to considerthe moisture content in terms of mass of water per mass of solids. Forexample, filter press cake of 40 percent solids contains 1 1/2 lb of water/lbof solids, while a vacuum filter cake of 15-20 percent solids contains 4-5.7lb of water/lb of solids. Therefore, if the sludge is to be reduced byincineration, 3 to 4 times as much water would have to be heated and vaporizedfrom the vacuum filter cake compared to the filter press cake.
The use of an inorganic chemical conditioning chemical will increase the massof sludge solids and may increase both the overall sludge mass and volume.This effect is shown in Figure 4-6 for conditioning chemical usages of 50,100, 200 and 300 g/kg (100, 200, 400, and 600 lb/ton) of dry weight solids.This Figure indicates that, if conditioning chemicals are added equivalent toapproximately 20% of the sludge weight with the sludge cake solids concentra-tion fixed, the sludge volume is increased by 20%.
It is, however, possible to reduce the volume of the sludge cake produced byusing inorganic conditioning chemicals. For example, if a vacuum filterproduced a 15 percent cake on a primary sludge when conditioning with polymer,the volume from Figure 4-6 (based on 910 kg or 2,000 lb of solids) would beabout 5.6 cu m (200 cu ft). If an inorganic conditioning chemical dosage of100 g/kg (200 lb/ton) increased the cake solids concentration to 25 percentsolids, the volume would be reduced to about 3.7 cu m (130 cu ft). This is avolume reduction of 35 percent. These important factors must be incorporatedinto the initial screening process and the initial cost evaluation, asdescribed in Chapter 6.
Example calculations showing the computation of sludge volumes produced bydifferent dewatering processes are shown in Appendix B. The cake volumecomparison in Appendix B shows that the cake volumes (smallest volume tolargest) per unit weight of solids dewatered including conditioning chemicalsare: drying bed; diaphragm filter press; fixed volume filter press; sludgelagoons; belt press; solid bowl centrifuge; vacuum filter; basket centrifuge;and gravity/ low pressure dewatering devices. Some caution, however, must beapplied to the use of cake volumes shown for drying beds and sludge lagoonssince a very wide range of sludge cake solids can be produced. Sludge lagoonsmay produce a sludge with solids concentrations ranging from 5 to 40 percent,while drying beds may produce sludge cakes ranging from 15 to more than 70percent solids. Given a sufficient drying time, a well designed and operateddrying bed can produce a drier sludge (with a lower volume) than any mechani-cal device.
From the standpoint of trucking and subsequent handling, caution must beexercised in comparing filter press cake volumes with cake volumes of othermechanical devices which do not produce as dry a cake. For the filter presscake, the "bulk" volume of the sludge is the important factor, as it accountsfor air spaces between the pieces of cake. For other types of sludge cake, the"true" volume is the important criterion, since the cake produced is generallymoist enough to readily compact. The increase in volume for the filter presscake is not possible to quantify without actual testing.
62
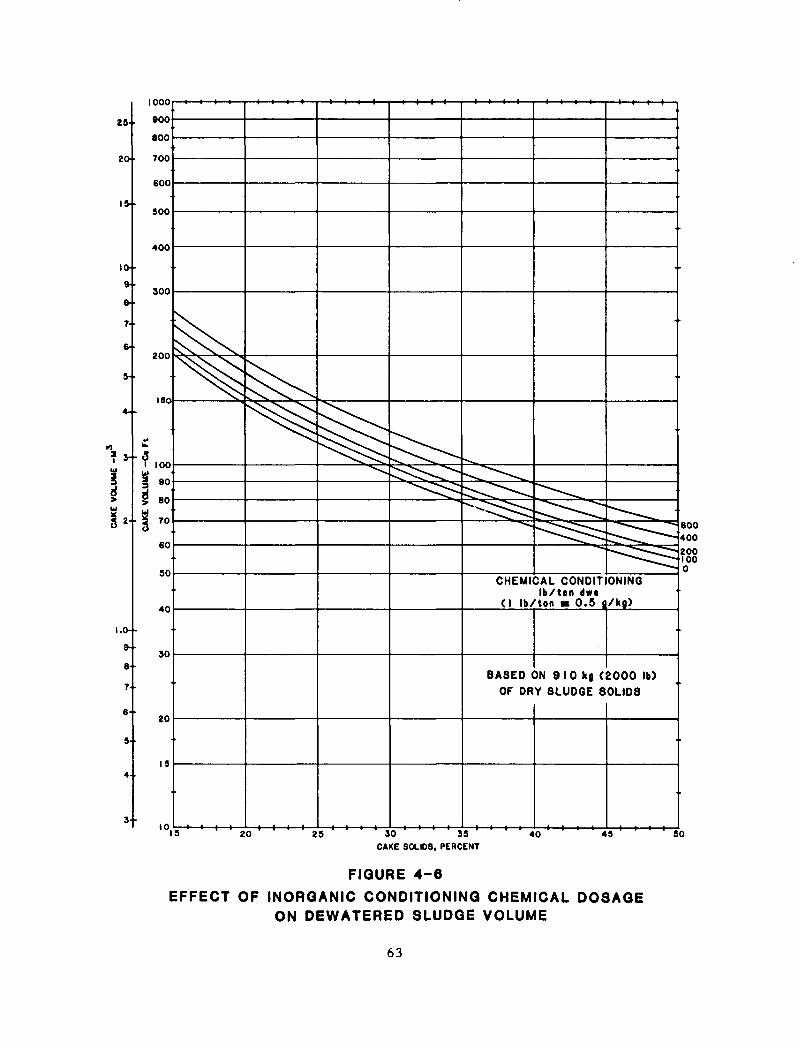
ZS- '
20
IO •
7-
6-
S «+
9-
8
7'
6
9-
3 •
1000
900
aoo
700
600
500
400
300
200
ISO
100
90
80
70
60
90
40
30
20
19
1019
6004002001000
CHEMICAL CONDITIONINGIb/ton 4w«
( I Ib/ton • 0.5 fl/kg)
BASED ON 9 10 kg (2000 Ib)OF DRY 8LUD6E S0LID8
20 29 30 33
CAKE SOLDS, PERCENT40 49 90
FIGURE 4-6EFFECT OF INORGANIC CONDITIONING CHEMICAL DOSAGE
ON DEWATERED SLUDGE VOLUME
63
4.5 References
1. "Process Design Manual For Sludge Treatment and Disposal," USEPA - Centerfor Environmental Research Information, Cincinnati, Ohio, 45268,EPA-625/1-79/011, September 1979.
2. Harrison, J. R., "Review of Developments in Dewatering WastewaterSludges," Sludge Treatment and Disposal, Volume 1 - Sludge Treatment,USEPA - Center for Environmental Research Information, Cincinnati, Ohio,45268, EPA-625/4-78-012, October 1978.
3. Trubiano, R., Bachtel, D., LeBrun, T., and Horvath, R., "ParallelEvaluation of Low Speed Scroll Centrifuges and Belt Filter Presses forDewatering Municipal Sewage Sludge," Draft EPA Report, Contract68-03-2745, 1981. (Authors are with County Sanitation Districts of LosAngeles County, Whittier, California)
4. Culp, Gordon L. and Hinrichs, Daniel J., "Municipal Wastewater SludgeManagement Alternatives," prepared for the EPA Technology TransferNational Conference on 208 Planning and Implementation, 1977. (Authorsare with Culp/Wesner/Culp, Cameron Park, California)
5. "Mechanical Dewatering Study - Los Angeles County Sanitation Districts,"LA/OMA Project, Regional Wastewater Solids Management Program, LosAngeles-Orange County Metropolitan Area, September 1980. (CountySanitation Districts of Los Angeles County, Whittier, California)
6. "Mechanical Dewatering Study - Orange County Sanitation Districts,"LA/OMA Project, Regional Wastewater Solids Management Program, LosAngeles-Orange County Metropolitan Area, September 1980. (CountySanitation Districts of Orange County, Fountain Valley, California)
7. Villiers, R. V. and Farrell, Joseph B., "A Look at Newer Methods forDewatering Sewage Sludges," Civil Engineering - ASCE, December 1977.
8. Cl^M-Hill, "Michelson Water Reclamation Plant - Engineering Report forDewatering Equipment Selection," Irvine Ranch Water District, IrvineCalifornia, June 1979.
9. Tavery, M. A., "Evaluation of Sludge Dewatering Equipment at the MetroDenver Sewage District," paper presented at the Colorado AWWA-WPCATechnical Activities Committee, May 3, 1979. (Author is with theMetropolitan Denver Sewage Disposal District No. 1, Denver, Colorado).
10. Parkson Corporation, "Summary of Test Results on Magnum Press at MetroDenver S.T.P., Denver, Colorado, October 30 - November 3, 1978."(Parkson Corporation, Fort Lauderdale, Florida)
11. Madden, J., "Tait-Andritz Sludge Dewatering Report to Metropolitan DenverSewage Disposal District No. 1," January 10, 1979. (Author is withPfister and Associates, Denver, Colorado)
64
12. Pennwalt Sharpies, "Technical Department Report for Metro-Denver SewageDisposal District No. 1," January 25, 1979. (Sharpies-Stokes Division,Pennwalt Corporation, Warminster, Pennsylvania)
13. John Carollo Engineers, "Design Memorandum No. 5 - Dewatering Methods,"County Sanitation Districts of Orange County, Fountain Valley,California, April 1979.
14. Consoer, Townsend & Associates Ltd., "Draft Project Report - SludgeProcessing Facilities Plan For the Cities of San Jose and Santa Clara,California," May 1980.
15. Ettlich, William F., Hinrichs, Daniel J., and Lineck, Thomas S.,"Operations Manual - Sludge Handling and Conditioning," USEPA - Office ofWater Program Operations, Washington, D.C., 20402, EPA-430/9-78-002,February 1978.
16. Hansen, Blair E., Garrison, Walter E., and Smith, Donald L., "Start-upProblems of Sludge Dewatering Facility," Journal WPCF, October 1980.
17. Zenz, D. R. , et al., "Evaluation of Unit Processes for Dewatering ofAnaerobically Digested Sludge at Metro Chicago's Calumet Sewage TreatmentPlant," The Metropolitan Sanitary District of Greater Chicago, October1976.
18. Ingersoll-Rand, Unpublished data on filter press and centrifuge testresults, 1977 - 1979. (Information from Wayne B. Gendron, Ingersoll-Rand,Nashua, New Hampshire)
19. Moser, J.H., et.al., "Milwaukee Water Pollution Abatement Program SolidsHandling Study," Milwaukee Metropolitan Sewerage District, May1981. (Author is with Milwaukee Metropolitan Sewerage District)
20. Sawyer, Bernard; Watkins, Robert; and Lue-Hing, Cecil, "Evaluation ofUnit Processes for Mechanical Dewatering of Anaerobically Digested Sludgeat Metro Chicago's West-Southwest Sewage Treatment Plant," Paperpresented at the 31st Annual Purdue Industrial Waste Conference, May1976. (Authors are with the Research and Development Department of TheMetropolitan Sanitary District of Greater Chicago)
21. Greenhorne & O'Mara Engineers, "Nassau County Sludge Study Composting andDewatering Demonstration Program—Final Report," July 1979. (Greenhorne &O'Mara Engineers are in Riverdale, Maryland)
22. Passavant Corporation, Unpublished data on filter press and belt filterpress test results. (Information received from E. D. Simmons, Vice-President, Technical Services, Passavant, Birmingham, Alabama, May 1982)
23. East Bay Municipal Utility District, Unpublished Data on Low Speed SolidBowl Centrifuge, (information received from Daryl G. Deruiter, AssociateEnvironmental Engineer, EBMUD, Oakland, California, June 1982)
65
24. Sharpies, Stokes Division, Pennwalt Corporation, Unpublished Data onHigh-G Solid Bowl Centrifuge Test Results. (Information received fromRichard T. Moll, Manager of Process Engineering, Sharpies-Stokes,Warminster, Pennsylvania, June 1982)
25. Schillinger, George R., "Conversion of Sludge - Conditioning Chemicals,"Deeds & Data, WPCF Highlights, April 1979.
26. Cassel, Alan F. and Johnson, Berinda P., "Evaluation of DewateringDevices For Producing High-Solids Sludge Cake," USEPA - MunicipalEnvironmental Research Laboratory, Cincinnati, Ohio 45268,EPA-600/2-79-123, August 1980.
27. Marx, C. J. and Keay, G. F. P., "Towards A Rational Sludge DisposalPolicy For Johannesburg, "Presented at the Institute of Water PollutionControl Conference, Pretoria, South Africa, June 1980. (Author Keay iswith City Engineer's Dept., Johannesburg, South Africa)
28. Ingersoll-Rand, "Lasta Filter Press Demonstration Detroit MetropolitanWastewater Treatment Plant, July 16 - August 10, 1979 and August 20 -August 30, 1979, March 1980. (information received from Wayne B. Gendron,Ingersoll-Rand, Nashua, New Hampshire)
29. Culp, G. L., "Handbook of Sludge Handling Processes - Cost andPerformance," Garland STPM Press, New York, 1979.
30. Kupper Associates and Metcalf & Eddy, Inc., "Pilot Plant DewateringTesting for the Recommended Land-Based Sludge Management Plan," MiddlesexCounty Sewerage Authority, New Jersey, January 1979.
66
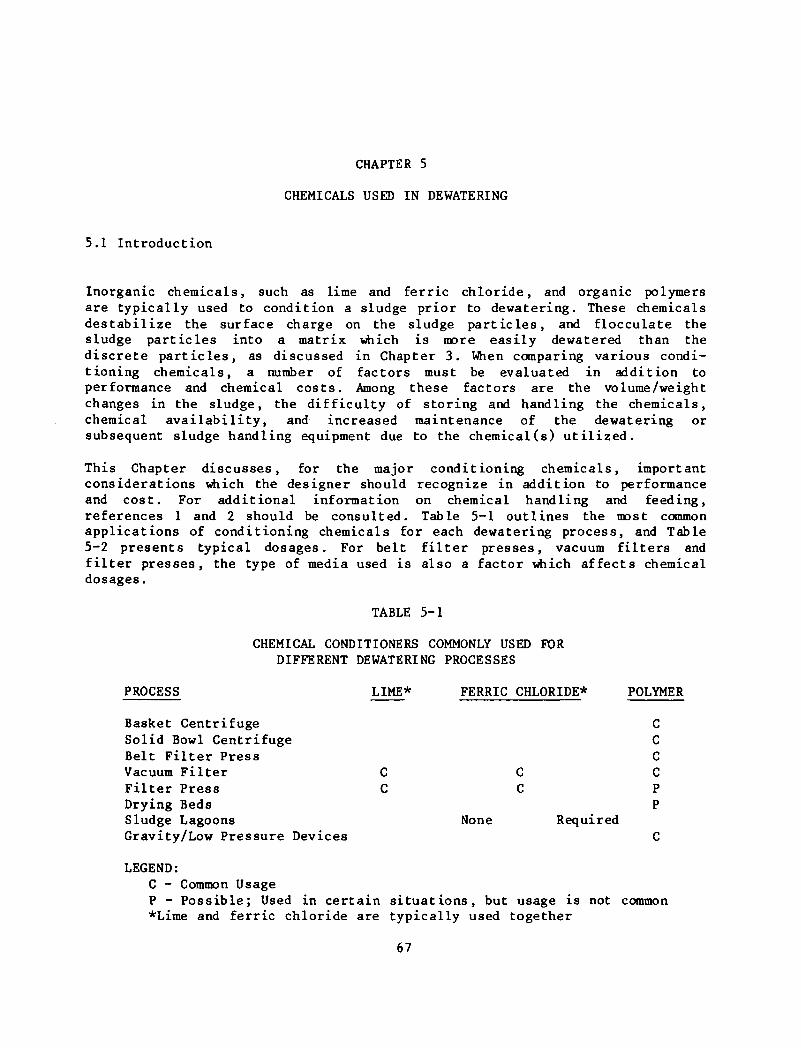
CHAPTER 5
CHEMICALS USED IN DEWATERING
5.1 Introduction
Inorganic chemicals, such as lime and ferric chloride, and organic polymersare typically used to condition a sludge prior to dewatering. These chemicalsdestabilize the surface charge on the sludge particles, and flocculate thesludge particles into a matrix which is more easily dewatered than thediscrete particles, as discussed in Chapter 3. When comparing various condi-tioning chemicals, a number of factors must be evaluated in addition toperformance and chemical costs. Among these factors are the volume/weightchanges in the sludge, the difficulty of storing and handling the chemicals,chemical availability, and increased maintenance of the dewatering orsubsequent sludge handling equipment due to the chemical(s) utilized.
This Chapter discusses, for the major conditioning chemicals, importantconsiderations which the designer should recognize in addition to performanceand cost. For additional information on chemical handling and feeding,references 1 and 2 should be consulted. Table 5-1 outlines the most commonapplications of conditioning chemicals for each dewatering process, and Table5-2 presents typical dosages. For belt filter presses, vacuum filters andfilter presses, the type of media used is also a factor which affects chemicaldosages.
TABLE 5-1
CHEMICAL CONDITIONERS COMMONLY USED FORDIFFERENT DEWATERING PROCESSES
PROCESS LIME*
Basket CentrifugeSolid Bowl CentrifugeBelt Filter PressVacuum Filter CFilter Press CDrying BedsSludge LagoonsGravity/Low Pressure Devices
FERRIC CHLORIDE*
CC
POLYMER
CCCCPP
None Required
LEGEND:C - Common UsageP - Possible; Used in certain situations, but usage is not common*Lime and ferric chloride are typically used together
67
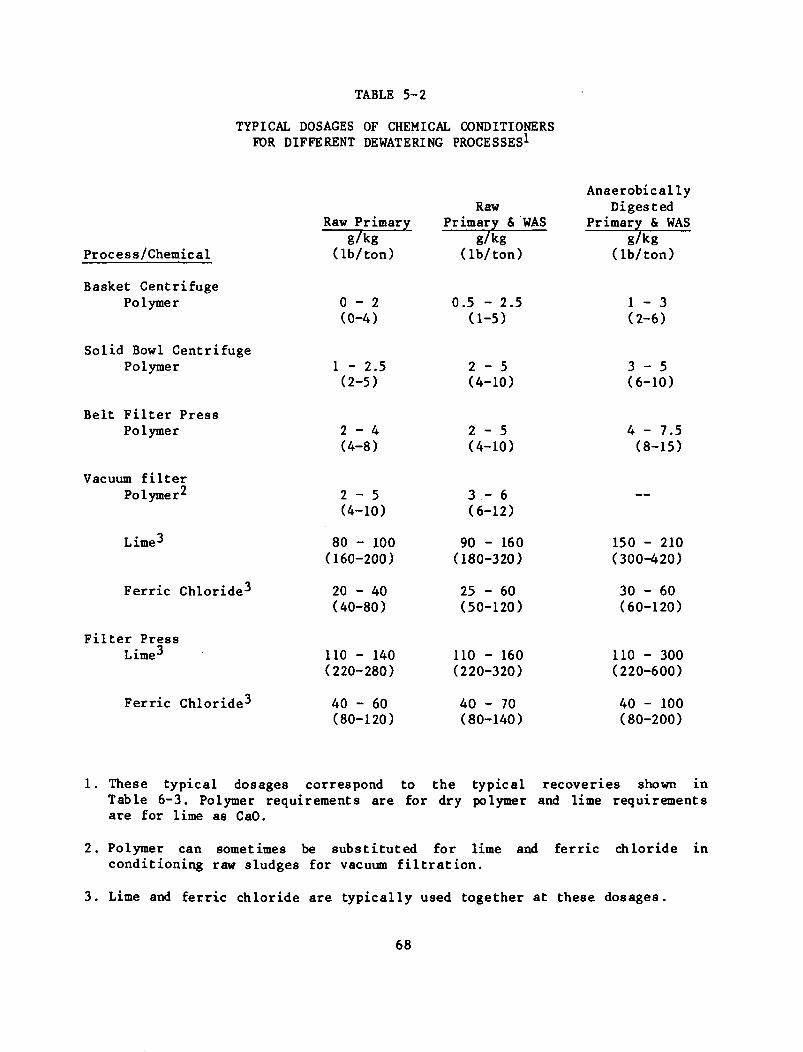
TABLE 5-2
TYPICAL DOSAGES OF CHEMICAL CONDITIONERSFOR DIFFERENT DEWATERING PROCESSES1
Process/Chemical
Basket CentrifugePolymer
Solid Bowl CentrifugePolymer
Belt Filter PressPolymer
Vacuum filterPolymer*
Lime
Ferric Chloride-*
Filter PressLime-*
Ferric Chloride3
Raw Primaryg/kg
(lb/ton)
0 - 2(0-4)
1 - 2.5(2-5)
2 - 4(4-8)
2 - 5(4-10)
80 - 100(160-200)
20 - 40(40-80)
110 - 140(220-280)
40 - 60(80-120)
RawPrimary & WAS
g/kg(lb/ton)
0.5 - 2.5(1-5)
2 - 5(4-10)
2 - 5(4-10)
3 - 6(6-12)
90 - 160(180-320)
25 - 60(50-120)
110 - 160(220-320)
40 - 70(80-140)
AnaerobicallyDigested
Primary & WASg/kg
(lb/ton)
1 - 3(2-6)
3 - 5(6-10)
4 - 7.5(8-15)
—
150 - 210(300-420)
30 - 60(60-120)
110 - 300(220-600)
40 - 100(80-200)
1. These typical dosages correspond to the typical recoveries shown inTable 6-3. Polymer requirements are for dry polymer and lime requirementsare for lime as CaO.
2. Polymer can sometimes be substituted for lime and ferric chloride inconditioning raw sludges for vacuum filtration.
3. Lime and ferric chloride are typically used together at these dosages.
68
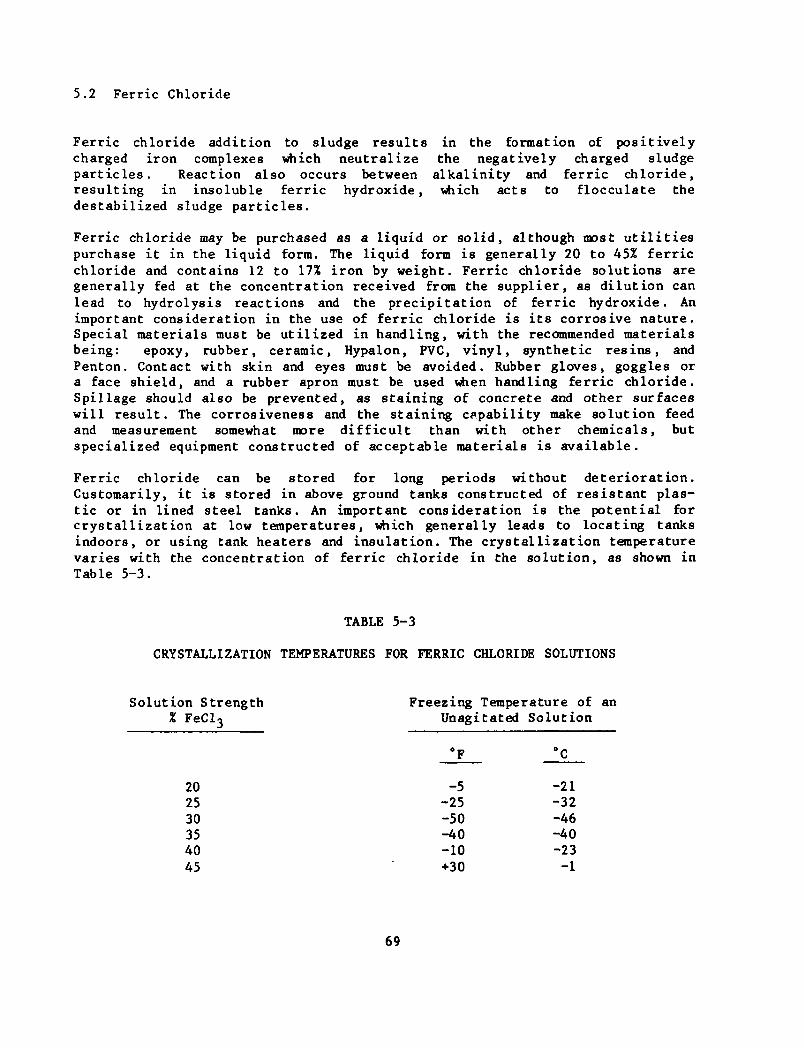
5.2 Ferric Chloride
Ferric chloride addition to sludge results in the formation of positivelycharged iron complexes which neutralize the negatively charged sludgeparticles. Reaction also occurs between alkalinity and ferric chloride,resulting in insoluble ferric hydroxide, which acts to flocculate thedestabilized sludge particles.
Ferric chloride may be purchased as a liquid or solid, although most utilitiespurchase it in the liquid form. The liquid form is generally 20 to 45% ferricchloride and contains 12 to 17% iron by weight. Ferric chloride solutions aregenerally fed at the concentration received from the supplier, as dilution canlead to hydrolysis reactions and the precipitation of ferric hydroxide. Animportant consideration in the use of ferric chloride is its corrosive nature.Special materials must be utilized in handling, with the recommended materialsbeing: epoxy, rubber, ceramic, Hypalon, PVC, vinyl, synthetic resins, andPenton. Contact with skin and eyes must be avoided. Rubber gloves, goggles ora face shield, and a rubber apron must be used when handling ferric chloride.Spillage should also be prevented, as staining of concrete and other surfaceswill result. The corrosiveness and the staining capability make solution feedand measurement somewhat more difficult than with other chemicals, butspecialized equipment constructed of acceptable materials is available.
Ferric chloride can be stored for long periods without deterioration.Customarily, it is stored in above ground tanks constructed of resistant plas-tic or in lined steel tanks. An important consideration is the potential forcrystallization at low temperatures, which generally leads to locating tanksindoors, or using tank heaters and insulation. The crystallization temperaturevaries with the concentration of ferric chloride in the solution, as shown inTable 5-3.
TABLE 5-3
CRYSTALLIZATION TEMPERATURES FOR FERRIC CHLORIDE SOLUTIONS
Solution Strength Freezing Temperature of an% FeClo Unagitated Solution
202530354045
69
°F
-5-25-50-40-10+30
°C
-21-32-46-40-23
-1
Interestingly, the lowest freezing points fall in the concentration range of30 to 35% FeC^, and higher freezing points occur at both more dilute andmore concentrated solutions.
Ferric chloride is most commonly used in conjunction with lime in vacuumfil ter and filter press installations.
5 .3 Lime
Two types of dry lime are customarily used in sludge treatment: pebble lime(CaO) , also called quicklime, and hydrated lime (CaCOH^)' Quicklime is lessexpensive to purchase and is generally used in larger facilities. It doesrequire slaking (addition of water to produce calcium hydroxide) prior to use.Hydrated lime is the more costly form of lime, but is commonly used in smallerfacilities due to its convenience.
Lime should have a minimum CaO content of 88 to 90% in order to be acceptable.Dolomitic limestone containing magnesium carbonate is often unacceptable,because it does not have this CaO content.
When lime as calcium hydroxide is added to sludge, the calcium hydroxidereacts with calcium bicarbonate to form calcium carbonate (CaCX^), which isinsoluble. The high pH conditions are conducive to release of ammonia fromdigested sludge. The use of lime as a conditioning agent for sludge canaccomplish the following:
Increase sludge porosityDecrease sludge matrix compressibilityDehydrate (to a degree) sludge solidsRaise pHHelp control odor formationProvide disinfectionFlocculate fine solids
The extent that each of these is accomplished depends on the lime dose. Limeis most frequently utilized for conditioning prior to a vacuum filter or afil ter press. Most commonly it is used in conjunction with ferric chloride.
Either form of lime can be purchased in bulk form or in bags. Typically,quicklime is purchased in bulk and hydrated lime is purchased in bags. Ifpurchased in bags, a waterproof building should be used for storage, with themaximum storage time generally restricted to less than 60 days. If bags ofquicklime are allowed to become wet, slaking will start within the bag, andthe resultant heating and swelling may cause the bags to burst. If stored inbulk, the storage hoppers should be both water tight and air tight. Lime isnot corrosive to steel or concrete, and either can be used as a storage bin.The bottom slope on the bin should be about 60° from horizontal, and binagitators may be necessary for bulk hydrated lime storage.
70
5.4 Polymers
Polymers are popular for sludge conditioning because they are generally easyto handle, store, and feed, and create l i t t l e additional volume of sludgesolids. Polymers may be purchased in the dry form, as emulsions, or asliquids, with the latter being the most expensive (when comparing activeingredients) because significant quantities of water must be transported alongwith the polymer. If purchased in the dry form, polymers must be thoroughlymixed with water according to manufacturer's recommendations prior to use.
The most common form of polymer for sludge conditioning is the cationicpolymer. These polymers react with the negatively charged sludge particles,destabilize them and agglomerate the particles by forming bridges among them.
Anionic and nonionic polymers are also useful in conditioning, but they aregenerally used in conjunction with inorganic conditioning agents. In thisrole, the polymer is responsible for agglomeration of sludge particles whichhave already been destabilized by the inorganic agent.
Polymers are most frequently utilized in belt fi l ter press, centrifuge, andoccasionally vacuum fil ter and drying bed applications. There continues to beresearch into the use of polymers in filter press applications. Key advantagesof polymers is the low dosages required, compared to inorganic chemicals, andthe insignificant amount of dry solids added by polymer conditioning.
5.5 Waste Pickle Liquor (Ferrous Chloride)
Waste pickle liquor, a by-product of steel processing operations, is availablein some parts of the country which are near such operations. To oxidize theferrous iron to ferric iron, chlorine must be added to the waste pickleliquor. The oxidized pickle liquor is then suitable as a replacement forferric chloride in conditioning applications.
Waste pickle liquor contains 20 to 25% ferrous chloride, and generally weighsbetween 1.19 and 1.25 kg/1 (9.9 and 10.4 lb/gal). As a result of i ts produc-tion, free acid is present at a concentration of about 2% by weight.
Continuous availability of waste pickle liquor is a factor which should beconsidered. Often, provisions are made for storage and feed of ferric chloridewhen waste pickle liquor is unavailable.
71
5.6 References
1. Heim, Nancy E., and Burris, Bruce E., "Chemical Aids Manual forWastewater Treatment Facilities," USEPA - Office of Water ProgramOperations, Washington, D.C., 20460, MO-25, EPA-430/9-79-018, December1979.
2. "Process Design Manual for Sludge Treatment and Disposal," USEPA - Centerfor Environmental Research Information, Cincinnati, Ohio, 45268,EPA-625/1-79/011, September 1979.
72
CHAPTER 6
STRATEGY FOR DEWATERING PROCESS SELECTION
6.1 Introduction
The most important factor which must be kept in mind when either evaluating orselecting a dewatering process is the inherent influence that both the priortreatment processes and subsequent disposal practices have. A dewateringprocess can not be evaluated independently without consideration of the otherprocesses involved in the overall solids handling system. Selection of adewatering process requires evaluation of the complete solids handling system.This can be a complex procedure because of the vast number of combinations ofunit processes which are available for thickening, stabilization, condition-ing, dewatering, and ultimate disposal. Figure 6-1 presents a generalschematic of a typical solids handling system and the unit processes which aremost commonly utilized to perform each of these functions.
The strategy involved in selection of a dewatering process at either new orexisting plants involves five stages of analysis, as shown in Figure 6-2. Thestages represent a screening procedure in which dewatering processes underconsideration are given increasing scrutiny as more detailed cost, operation-al, and design data are collected. The components of each of these stagesare:
Stage 1 - Initial Screening of Dewatering Processes
A large number of factors are reviewed to determine if any processes canbe eliminated prior to the intial cost analysis. Factors to be consideredin the initial screening include: compatibility with plant size andexisting facilities, including type and quantities of sludge produced;compatibility with the planned or existing ultimate disposal technique;compatibility with labor availability, degree of conditioning required,and land availability; environmental considerations; and field experiencewith equipment or processes at other operating installations.
Stage 2 - Initial Cost Evaluation
Based on the best estimates of design and operational criteria for thepotentially feasible dewatering processes, an initial cost evaluationshould be conducted. In many cases, 10 to 20 complete solids handlingalternatives, which may include four or five different dewateringprocesses, are evaluated in this initial stage. Generally, three to fiveof the lowest cost alternatives are selected for more detailedevaluation.
73
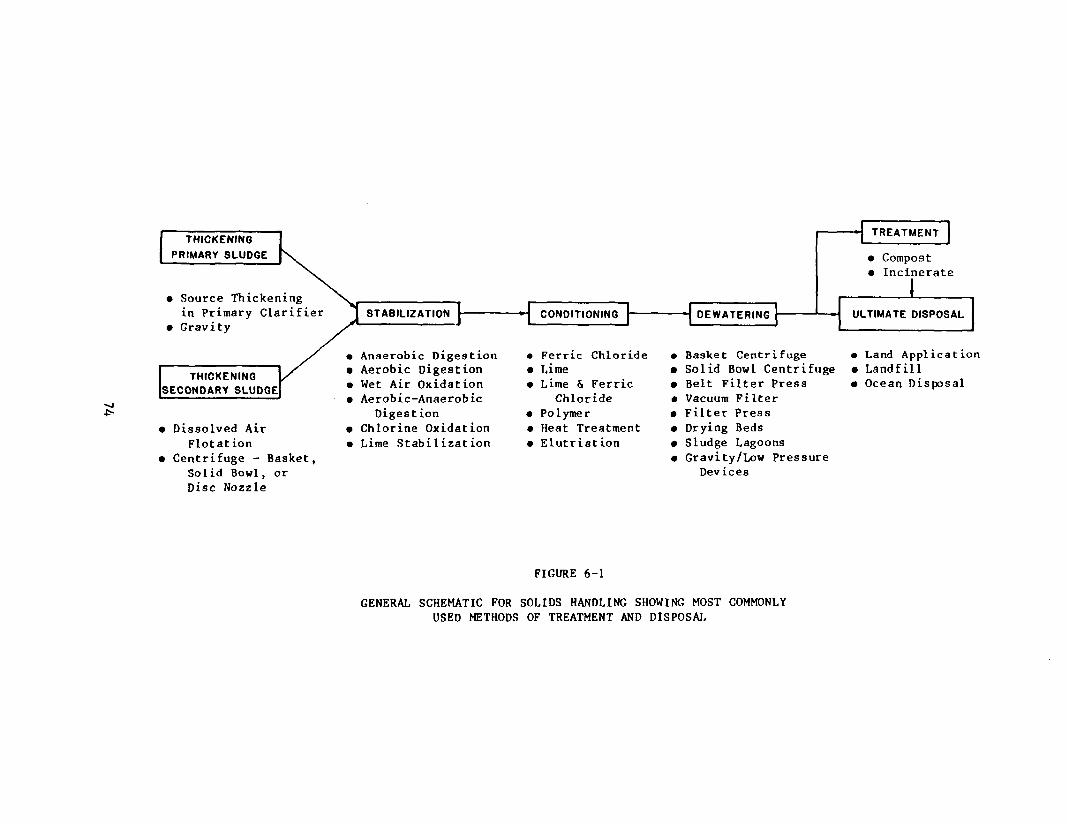
THICKENINGPRIMARY SLUDGE
• Source Thickeningin Primary Clarifier
• Gravity
THICKENINGSECONDARY SLUDGE
• Dissolved AirFlotation
• Centrifuge - Basket,Solid Bowl, orDisc Nozzle
STABILIZATION
Anaerobic DigestionAerobic DigestionWet Air OxidationAerobic-AnaerobicDigestion
Chlorine OxidationLime Stabilization
CONDITIONING
Ferric ChlorideLimeLime & Ferric
ChloridePolymerHeat TreatmentElutriation
DEWATERING
TREATMENT
• Compost• Incinerate
1ULTIMATE DISPOSAL
Basket CentrifugeSolid Bowl CentrifugeBelt Filter PressVacuum FilterFilter PressDrying BedsSludge LagoonsGravity/Low Pressure
Devices
Land ApplicationLandfillOcean Disposal
FIGURE 6-1
GENERAL SCHEMATIC FOR SOLIDS HANDLING SHOWING MOST COMMONLYUSED METHODS OF TREATMENT AND DISPOSAL
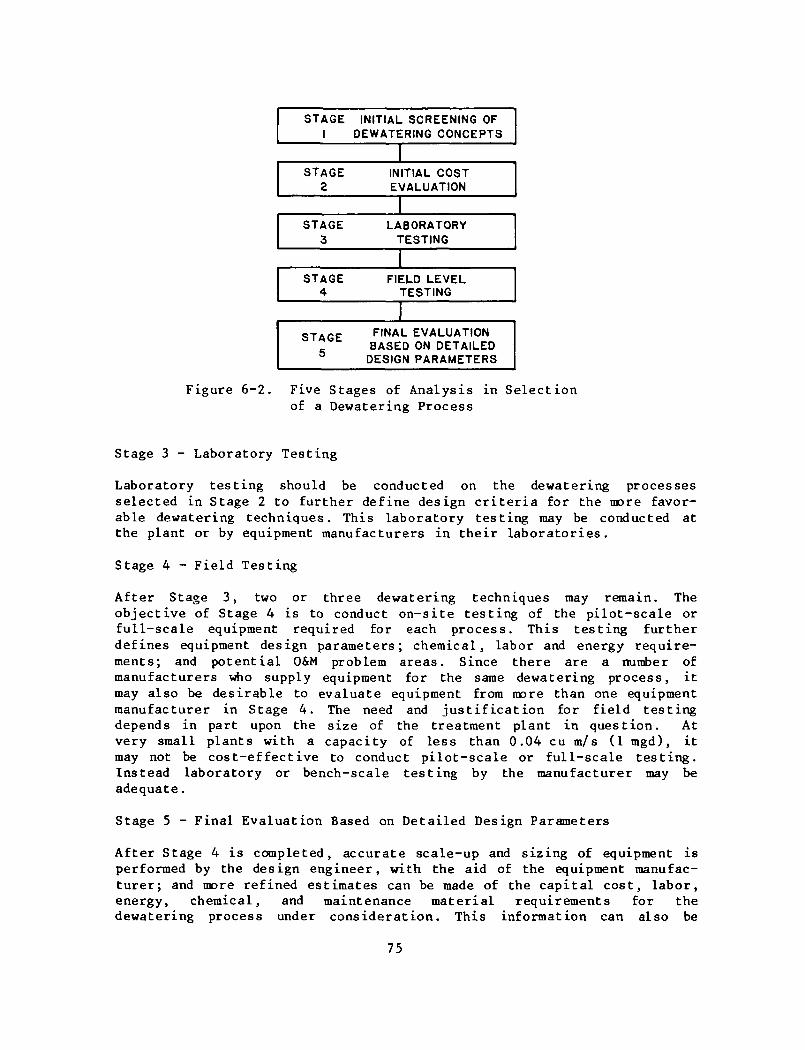
STAGE1
STAGE2
STAGE3
STAGE4
STAGE5
INITIAL SCREENING OFDEWATERING CONCEPTS
INITIAL COSTEVALUATION
LABORATORYTESTING
FIELD LEVELTESTING
FINAL EVALUATIONBASED ON DETAILED
DESIGN PARAMETERS
Figure 6-2. Five Stages of Analysis in Selectionof a Dewatering Process
Stage 3 - Laboratory Testing
Laboratory testing should be conducted on the dewatering processesselected in Stage 2 to further define design criteria for the more favor-able dewatering techniques. This laboratory testing may be conducted atthe plant or by equipment manufacturers in their laboratories.
Stage 4 - Field Testing
After Stage 3, two or three dewatering techniques may remain. Theobjective of Stage 4 is to conduct on-site testing of the pilot-scale orfull-scale equipment required for each process. This testing furtherdefines equipment design parameters; chemical, labor and energy require-ments; and potential O&M problem areas. Since there are a number ofmanufacturers who supply equipment for the same dewatering process, itmay also be desirable to evaluate equipment from more than one equipmentmanufacturer in Stage 4. The need and justification for field testingdepends in part upon the size of the treatment plant in question. Atvery small plants with a capacity of less than 0.04 cu m/s (1 mgd), itmay not be cost-effective to conduct pilot-scale or full-scale testing.Instead laboratory or bench-scale testing by the manufacturer may beadequate.
Stage 5 - Final Evaluation Based on Detailed Design Parameters
After Stage 4 is completed, accurate scale-up and sizing of equipment isperformed by the design engineer, with the aid of the equipment manufac-turer; and more refined estimates can be made of the capital cost, labor,energy, chemical, and maintenance material requirements for thedewatering process under consideration. This information can also be
75
supplemented with information from other plants using the same process.Additionally, judgements can be made by the operating utili ty based onperformance and operational problems experienced in Stage 4. Based uponmore accurate capital and operation and maintenance cost information, afinal cost evaluation can be made in conjunction with an evaluation ofother parameters. The net result of Stage 5 is the selection of a dewat-ering process to be used and in many cases the preferred manufacturer.
Throughout this five stage process, decisions based on trade-offs willcontinually be made. In many cases, the total annual cost of two or moresolids treatment systems are nearly identical, and the decision must be madeon some basis other than cost. Frequently such a decision is based uponcapital cost vs. O&M cost considerations, ease of equipment operation, energyrequirements, performance, or other factors. A significant point to keep inmind is that often the decision is not clear cut.
It is important to realize that the overall complexity of analysis will varydepending on the size of the plant and whether or not a new solids handlingsystem is being designed or an old one upgraded. If the solids handling systemis all new, there will probably be few constraints on processes to be evalua-ted, conditioning method to be used, and ultimate disposal techniques to beconsidered. In other situations, if the entire treatment facility is new, orif it is being upgraded from primary to secondary, sludge of the correctcomposition will not be available for conduct of field tests. Relative toplant size, Stage 4 is generally not conducted for most small capacity plants,those less than 0.04 cu m/s (1 mgd). For the small plant, it is usually moreeconomical to design facilities based on laboratory or bench-scale testing,often performed by the manufacturer of the equipment, than it is to conductthe field-scale testing.
The following sections discuss in detail, the five stages required in theanalysis:
6.2 Stage 1 - Initial Screening of Dewatering Processes
The purpose of the initial screening is to eliminate early in the analysisprocesses which are not acceptable for any of a variety of reasons. Factors tobe considered in the initial screening include:
Compatibility with existing facilitiesCompatibility with size of plantCompatibility with ultimate disposal technique(s)Influence of secondary treatment and prior sludge treatmentConditioning requirementsSolids capture during dewateringLabor requirementsEnvironmental considerationsLong term uti l i tyPlant locationExperience at other operating installationsBias by individuals or agencies
76
6.2.1 Compatibility With Existing Facilities
Existing facilities which must be considered in evaluating dewateringprocesses include:
• Type of dewatering equipment presently utilized, and its compatibilitywith future requirements
• Existing conditioning chemical storage and feed facilities• Existing building used for dewatering and ancillary equipment• Existing site constraints• Existing sludge transport facilities
Considerations which relate to existing facility requirements are nowdiscussed.
6.2.1.1 Existing Dewatering Equipment
Existing dewatering equipment customarily plays a major role in the selectionof additional equipment, particularly if space is available and has beenplanned for expansion of the present dewatering facilities. If existing equip-ment is providing satisfactory performance (from both a cost and operationalstandpoint) for the plant staff, and if the product cake is suitable for theultimate disposal technique which is being used, in all likelihood the samedewatering process would be desired in the expansion. This would be particu-larly true if the dewatering facilities had been designed to accomodate moreequipment of the same type. In perhaps the majority of situations, existingequipment is providing unsatisfactory performance and requires more chemicalsor energy than originally anticipated. In other cases the sludge characteris-tics have adversely changed since design, and the original equipment can notbe operated at the original design capacity. In some cases existing equipmentcan not perform as well or as efficiently as some of the newer equipmentavailable, or the cake produced by existing equipment is not suitable for thefuture ultimate disposal technique.
In a large percentage of the cases involving expansion of dewateringfacilities, the plant staff is dissatisfied with the operation of the existingequipment. Typical situations are: (1) vacuum filter installations where limecoating of the filter media, filter drum, and filtrate piping presents anexpensive and continuing maintenance problem; (2) filter press installationsthat often have chemical requirements substantially higher than originallyexpected; (3) older existing solid bowl centrifuge installations where a greatdeal of scroll maintenance is required due to abrasive wear and/or where theoperating performance is poor; and (4) drying beds or lagoons where odors, thevisual impacts, intensive labor requirements or difficulty with sludge removalmake the process an operations problem for the plant staff. These situationsand other possible situations not described here can cause headaches for theoperation and maintenance staffs and can decrease effective dewateringcapacity and increase operating costs when equipment must be taken out ofservice for repairs and/or cleaning.
77
Variation in sludge characteristics after design and installation ofequipment, and therefore variation in the ability of the sludge to be dewater-ed, presents a particularly vexing problem. Invariably, this leads to higherconditioning and energy requirements than originally projected, and in somecases the inability to produce a dewatered cake suitable for ultimatedisposal. In some instances, equipment may need to be operated at less thandesign capacity due to changed sludge characteristics. Evaluation should beconducted to determine the likelihood and severity of changes in sludge feedrate and characteristics. If significant variations are anticipated, equipmentwhich is less sensitive to such changes should be selected.
6.2.1.2 Existing Conditioning Chemical Storage and Feed Facilities
Most plant staffs have a preference for the types of chemicals which theydesire to handle, and a bias against ones which they dislike to handle.Assuming that conditioning chemicals presently utilized are acceptable to theplant staff, this would give an added preference to dewatering processes whichutilize the same chemicals. Another factor is the cost and availability ofstorage and feed facilities. It is important to assess the unused capacity ofboth storage and feed facilities. If unused capacity is available, this mustbe considered in process selection, particularly in the Stage 2 costanalysis.
6.2.1.3 Existing Building Used for Dewatering Equipment
As discussed previously, often space has been planned and constructed for thesame type of equipment as that presently used. This is an important factor toconsider.
Also to be considered is the present building's structural capacity formodern heavyweight equipment, and whether the building has sufficient heightfor the equipment being considered. Dewatering equipment like solid bowlcentrifuges, belt filter presses, and filter presses frequently dischargedewatered solids downward. This requires elevated mounting to allow forconveyor belts under the equipment and can be incompatible with low roofbuildings.
Building structural capacity also must be analyzed. Heavy equipment such as afilter press may not be compatible with a building originally designed for acentrifuge installation, even though both have bottom discharge of cakesolids. Basket centrifuges require greater structural support than solid bowlcentrifuges. In the case where there is an existing overhead crane, heavyequipment may exceed the allowable capacity, and lighter equipment shouldperhaps be considered.
An important factor which the designer must continually keep in mind, even ifa new method of dewatering is selected, is the usefulness of the existingfacilities. In many cases, the new dewatering process will only be used to
78
supplement existing facilities. In other situations, because of a change inthe ultimate disposal technique or because of generally unsatisfactory opera-tion, the new facilities will replace existing facilities. When this occurs,rather than removing existing facilities, strong consideration must be givento their use as standby or backup facilities to the new facilities. Often theycan be used on a short-term basis in this role even if they do not produce asufficiently dry cake for the disposal technique used.
Equipment previously used for dewatering is occasionally converted to sludgethickening prior to anaerobic digestion. This may be especially advantageousif anaerobic digester capacity is lacking and expansion of the digestercapacity is being considered. Examples include use of centrifuges to thickenWAS prior to digestion, or use of any dewatering device to dewater a portionof the sludge and then blend the dewatered cake with the dilute feed sludge toproduce a thickened sludge. An economic analysis should be conducted prior tosuch use, as chemical and energy requirements may be significantly greaterthan alternative techniques. Solids capture efficiency must also be consideredin such conversions.
6.2.1.4 Existing Site Constraints
Drying beds and sludge lagoons both require considerable land area. Expandeduse of these processes may not be practical if land is unavailable, or ifenvironmental constraints make continued use unacceptable. However, often theexisting beds or lagoons can be used in conjunction with a different dewater-ing process.
6.2.1.5 Existing Sludge Transport Facilities
This consideration would probably relate only to a decision of whether or notto dewater. For example, if a considerable investment had previously been madein trucks or a pipeline and pumping facilities for liquid sludge transport,the decision may be made not to dewater. Another possibility could be todewater at a site remote from the treatment facility if liquid transportfacilities are available. Although these decisions are generally made on thebasis of cost, their recognition during the initial screening may savesubstantial time in the decision making process.
6.2.2 Compatibility With Size of Plant
Use of uncomplicated sludge handling systems increases the chances forsuccessful operation in any size plant. Complex equipment is especiallyunsuited for small plants for several reasons. First, the amount of operatortime available generally decreases as plant size decreases. Second, theoverall skill of both operations and maintenance personnel is not as great atsmall plants. Third, less complex equipment is generally less expensive to
79
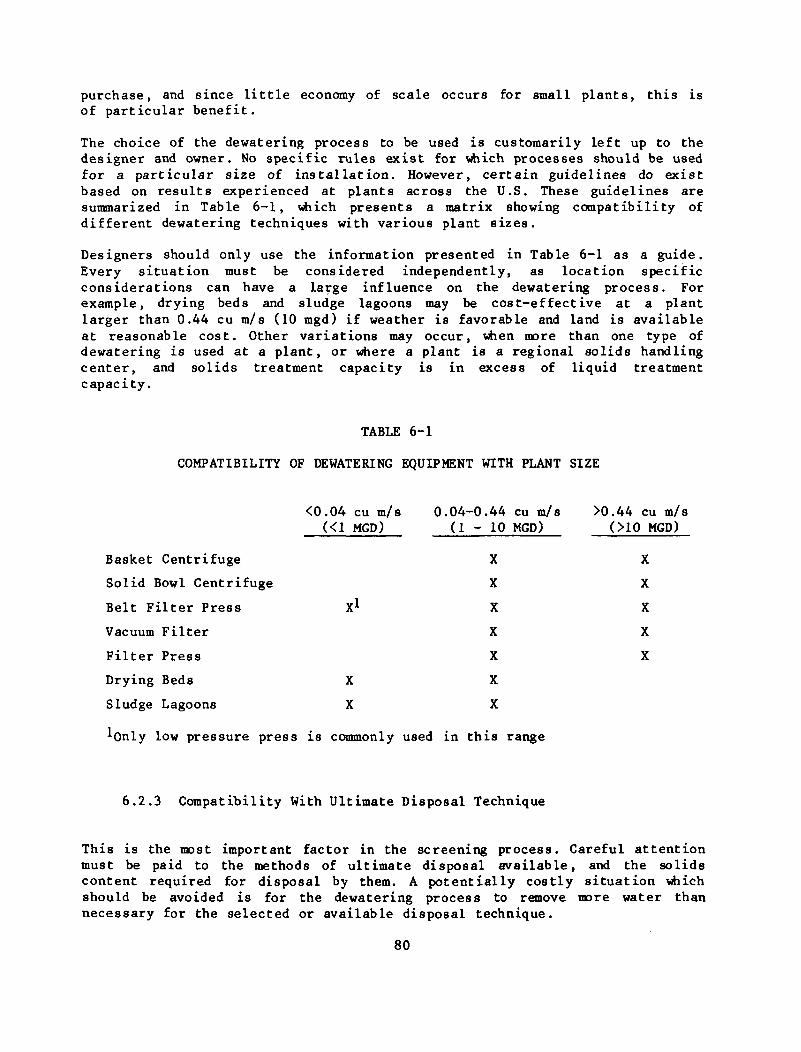
purchase, and since little economy of scale occurs for small plants, this isof particular benefit.
The choice of the dewatering process to be used is customarily left up to thedesigner and owner. No specific rules exist for which processes should be usedfor a particular size of installation. However, certain guidelines do existbased on results experienced at plants across the U.S. These guidelines aresummarized in Table 6-1, which presents a matrix showing compatibility ofdifferent dewatering techniques with various plant sizes.
Designers should only use the information presented in Table 6-1 as a guide.Every situation must be considered independently, as location specificconsiderations can have a large influence on the dewatering process. Forexample, drying beds and sludge lagoons may be cost-effective at a plantlarger than 0.44 cu m/s (10 mgd) if weather is favorable and land is availableat reasonable cost. Other variations may occur, when more than one type ofdewatering is used at a plant, or where a plant is a regional solids handlingcenter, and solids treatment capacity is in excess of liquid treatmentcapacity.
TABLE 6-1
COMPATIBILITY OF DEWATERING EQUIPMENT WITH PLANT SIZE
Basket Centrifuge
Solid Bowl Centrifuge
Belt Filter Press
Vacuum Filter
Filter Press
Drying Beds
Sludge Lagoons
<0.04 cu m/s(<1 MGD)
Xl
X
X
0.04-0(1 -
.44 cu m/s10 MGD)
X
X
X
X
X
X
X
>0.44 cu m/sOlO MGD)
X
X
X
X
X
low pressure press is commonly used in this range
6.2.3 Compatibility With Ultimate Disposal Technique
This is the most important factor in the screening process. Careful attentionmust be paid to the methods of ultimate disposal available, and the solidscontent required for disposal by them. A potentially costly situation whichshould be avoided is for the dewatering process to remove more water thannecessary for the selected or available disposal technique.
80
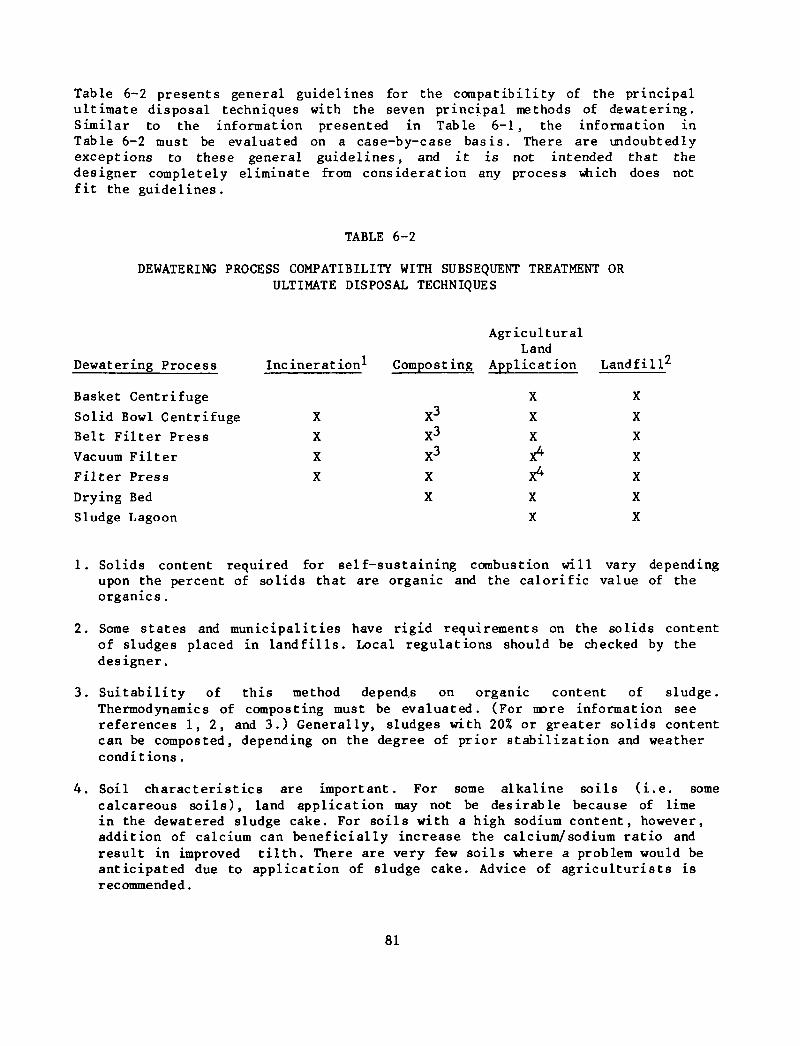
Table 6-2 presents general guidelines for the compatibility of the principalultimate disposal techniques with the seven principal methods of dewatering.Similar to the information presented in Table 6-1, the information inTable 6-2 must be evaluated on a case-by-case basis. There are undoubtedlyexceptions to these general guidelines, and i t is not intended that thedesigner completely eliminate from consideration any process which does notfi t the guidelines.
TABLE 6-2
DEWATERING PROCESS COMPATIBILITY WITH SUBSEQUENT TREATMENT ORULTIMATE DISPOSAL TECHNIQUES
AgriculturalLand
Dewatering Process
Basket Centrifuge
Solid Bowl Centrifuge
Belt Filter Press
Vacuum Filter
Filter Press
Drying Bed
Sludge Lagoon
Inc iner at ion-'-
X
X
XX
Composting
X3
X3
X3
XX
Application 1
XX
X
X4
X*
XX
.andfilT
X
X
X
XX
X
X
1. Solids content required for self-sustaining combustion will vary dependingupon the percent of solids that are organic and the calorific value of theorganics.
2. Some states and municipalities have rigid requirements on the solids contentof sludges placed in landfills. Local regulations should be checked by thedesigner.
3. Suitability of this method depend.s on organic content of sludge.Thermodynamics of composting must be evaluated. (For more information seereferences 1, 2, and 3.) Generally, sludges with 20% or greater solids contentcan be composted, depending on the degree of prior stabilization and weatherconditions.
4. Soil characteristics are important. For some alkaline soils (i.e. somecalcareous soils), land application may not be desirable because of limein the dewatered sludge cake. For soils with a high sodium content, however,addition of calcium can beneficially increase the calcium/sodium ratio andresult in improved tilth. There are very few soils where a problem would beanticipated due to application of sludge cake. Advice of agriculturists isrecommended.
81
It should be recognized, however, that just because a dewatering process iscompatible, i t may not be the most cost-effective technique. For example, useof a filter press is compatible with landfilling, but a belt fi l ter presswould in most cases represent a more cost-effective method of dewatering priorto landfilling.
Designers should remember that the objective of dewatering is only to removesufficient water to produce a sludge compatible with the selected disposaltechnique. Removal of additional water is not cost-effective and may requirethe unnecessary expenditure of energy and chemicals.
Table 6-2 indicates that only the fi l ter press, solid bowl centrifuge, beltf i l ter press, and vacuum filter are compatible with incineration. It isfrequently concluded that only a fi l ter press can produce a dewatered cakecompatible with incineration. This conclusion is based upon the criteria thatonly an autogeneous or nearly autogenous sludge should be incinerated.However, in some instances where digestion is not used or where the sludge isthermally conditioned, nearly autogenous cakes can be produced by belt fi l terpresses, solid bowl centrifuges, and vacuum f i l te rs . This is particularly trueif only raw primary sludge is being dewatered.
6.2.4 Influence of Secondary Treatment and Prior Sludge Treatment
6.2.4.1 Secondary Treatment
The influence of the type of secondary treatment on the sludge produced andi ts dewaterability was reviewed in Chapter 4. The most important conclusionreached was that both trickling fi l ter (TF) and rotating biological contactor(RBC) sludges dewater better than waste activated sludge (WAS). This is truewhether sludges are raw or digested. The difference between the TF/RBC sludgesand WAS is due to the nature of the biological growth. The TF and RBC sludgesare from attached growth biological systems which produce dense, easilysettleable sludge solids. The WAS is from a suspended growth system, in whichthe sludge is dispersed in nature, with large amounts of water containedbetween dispersed sludge particles. The nature of the W\S is also stronglydependent upon the process variation of the activated sludge process which isutilized. High rate systems using high food to microorganism ratios (F/M >0.4)produce quantities (by weight) of biomass which are greater than the conven-tional activated sludge process (F/M of 0.2 - 0.4), and this biomass isparticularly difficult to dewater due to the large quantities of intercellularwater. Problems have also been experienced at plants using the extendedaeration modification of the activated sludge process (F/M < 0.15), because ofthe pin-point, discrete nature of the biological floe.
82
6.2.4.2 Prior Sludge Treatment
Prior sludge treatment by thickening, digestion or storage will affect theease of dewaterability. Thickening, generally used before digestion to reducedigester capacity, produces beneficial results due to a higher solids contentfeed to the dewatering process. Conversely, both digestion and storage areusually detrimental to the ease of dewatering.
Vacuum filters generally have a requirement for the feed sludge total solidsconcentration to be at least 3.0 percent. If the feed sludge is more dilutethan this, it becomes difficult to form a cake on the filter that is thickenough or dry enough for adequate discharge. For this reason the role of thepreceding sludge handling processes is an especially important one.
The major benefit associated with feeding a thickened sludge to mechanicaldewatering processes is the higher solids throughput obtainable. This canreduce the number of machines required and the overall space requirements. Alldewatering devices are to some extent hydraulically limited because thehydraulic capacity is exceeded before the solids capacity. The belt filterpresses offered by several manufacturers have a larger or separate gravitydrainage zone which allows them to be loaded with either a wetter feed sludgeor a higher solids loading rate. For these machines the gravity drainage zoneactually thickens the sludge to at least 6 percent solids, and it is doubtfulthat prethickening would substantially reduce the number of machines required,unless the feed solids are below about 2 percent. For a filter press, athicker feed sludge reduces the fill time and overall cycle time because thereis less water to force through the cake and filter media, and therefore thetotal required filter area is reduced.
Another benefit of a thicker feed sludge is a reduction in the chemicalrequirements for conditioning. Although there may be an increase in solidsloading rates and some reduction in chemical requirements, there generallywill not be a major increase in cake solids achievable, especially for acentrifuge, a belt press, or a filter press. One mechanical dewatering devicewhich may show a significant increase in cake solids content due to highersludge feed concentrations is a vacuum filter.
Although it is not a common problem, it is possible to have a feed sludge fordewatering which is too thick to be easily handled. A suggested maximum feedsolids concentration of 7 to 8% is recommended for dewatering equipment.Solids contents higher than 8% will tend to make the sludge difficult totransfer to the dewatering unit.
Anaerobic digestion generally degrades the dewaterability of raw sludgebecause of fines produced by the process. This fine material is hard todewater due to its large surface area, its difficulty in being flocculatedduring conditioning, and its compressibility during dewatering. This overalldifficulty often further results in poor capture of the fines during dewater-ing, and recycle of fine material to the plant liquid handling processes. Thebest solution for the problem of fine material produced during digestion isadequate conditioning prior to dewatering. Because the mass of solids is
83
reduced by anaerobic digestion, the actual number of dewatering devices,required may be less. In addition to the problem of fine material, anaerobicdigestion also creates alkalinity during the breakdown of organic matter. Thisalkalinity reacts with ferric chloride, ferrous sulfate, and lime if they areused for conditioning, with a resultant increase in the quantity ofconditioning chemical(s) required.
Storage of sludge prior to dewatering generally is, detrimental todewaterability. Storage may be necessary, however, to equalize the rate ofsludge feed to the dewatering process.
6.2.5 Conditioning Requirements
Conditioning before dewatering can be by thermal treatment or by chemicaladdition. Chemical conditioning is much more common than thermal conditioning,but thermal treatment has the advantage of substantially improving thedewaterability of. a sludge without requiring the addition of chemicals. Atexisting thermal conditioning facil i t ies, plant operating personnel may bedissatisified due to problems with complexity, odor generation, and thehigh-strength recycle stream produced. Additionally, thermal treatmentfacil i t ies installed before 1973, when fuel and electricity prices began torapidly escalate, may not be justified on a cost-effective basis at currentfuel prices. These costs should be reevaluated when expansion plans areformulated.
As discussed relative to existing faci l i t ies , preference by plant personnelfor specific chemicals, as well as the availability of storage and feedfacil i t ies for certain chemicals, are important considerations. Other factorswhich need to be considered are availability and cost of chemicals. If theconditioning chemical(s) is readily available, on-site storage times can bereduced and a savings will result in storage facility costs. Chemical cost isalso a factor and it will vary from location to location, depending upon itssource. The impact of these costs will become evident during the costcomparison (Stage 2 of the evaluation procedure), but it is important thatthey be recognized during the init ial screening phase also.
6.2.6 Solids Capture During Dewatering
Incomplete capture of solids during dewatering, with recycle of these solidsto the plant headworks, will generally not create a problem if solids captureexceeds 90% and plant effluent suspended solids (SS) limits are 30 mg/1. Wheneffluent SS limits are 20 mg/1 or 10 mg/1, often times 95% solids capture maybe necessary to allow the plant to meet effluent discharge limitations.
Solids loss during dewatering generally occurs by two mechanisms: (1) solidspassage through the filtering media, or with centrifuges, solids lost in thecentrate, and (2) incomplete separation of solids from the media and the needto spray wash the media prior to the next application of sludge.
84
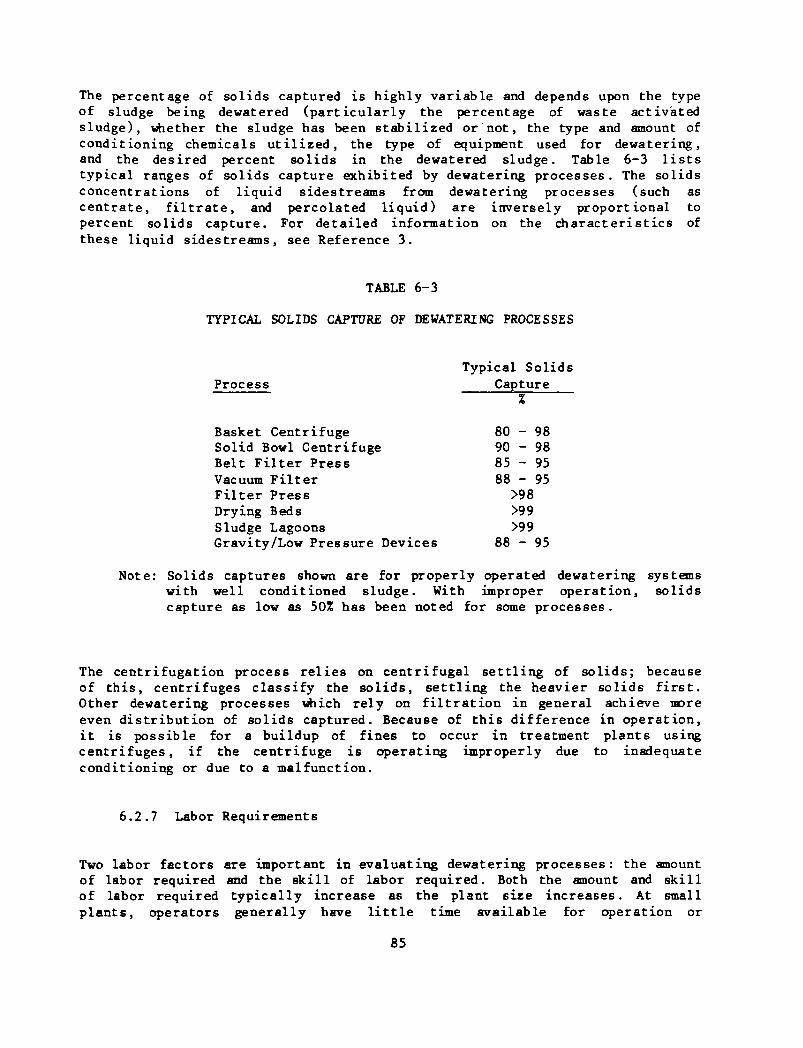
The percentage of solids captured is highly variable and depends upon the typeof sludge being dewatered (particularly the percentage of waste activatedsludge), whether the sludge has been stabilized or not, the type and amount ofconditioning chemicals utilized, the type of equipment used for dewatering,and the desired percent solids in the dewatered sludge. Table 6-3 liststypical ranges of solids capture exhibited by dewatering processes. The solidsconcentrations of liquid sidestreams from dewatering processes (such ascentrate, filtrate, and percolated liquid) are inversely proportional topercent solids capture. For detailed information on the characteristics ofthese liquid sidestreams, see Reference 3.
TABLE 6-3
TYPICAL SOLIDS CAPTURE OF DEWATERING PROCESSES
Process
Basket CentrifugeSolid Bowl CentrifugeBelt Filter PressVacuum FilterFilter PressDrying BedsSludge LagoonsGravity/Low Pressure Devices
Note: Solids captures shown are for properly operated dewatering systemswith well conditioned sludge. With improper operation, solidscapture as low as 50% has been noted for some processes.
The centrifugation process relies on centrifugal settling of solids; becauseof this, centrifuges classify the solids, settling the heavier solids first.Other dewatering processes which rely on filtration in general achieve moreeven distribution of solids captured. Because of this difference in operation,it is possible for a buildup of fines to occur in treatment plants usingcentrifuges, if the centrifuge is operating improperly due to inadequateconditioning or due to a malfunction.
6.2.7 Labor Requirements
Two labor factors are important in evaluating dewatering processes: the amountof labor required and the skill of labor required. Both the amount and skillof labor required typically increase as the plant size increases. At smallplants, operators generally have little time available for operation or
85
Typical SolidsCapture
80908588
88
X
- 98- 98- 95- 95>98>99>99- 95
maintenance of complex pieces of equipment. They also often have no desire toattempt proper operation of a complex mechanical dewatering device.
Generally drying beds, lagoons, or low pressure belt presses are best suitedto small facilities. Little time or skill is required for drying beds orlagoons. Low pressure belt press/gravity drainage processes require ratherlarge polymer dosages to achieve dewatering, but they are relatively easy tooperate and maintain.
6.2.8 Environmental Considerations
Environmental factors should be considered in the initial screening process.The key considerations which relate specifically to the dewatering processinclude:
Energy RequirementsNoiseVibrationOdor PotentialAesthetics (visual impact)Groundwater Contamination
An evaluation of each of these environmental considerations is presented inTable 6-4 for the principal dewatering processes , and they are furtherdiscussed in the following sections.
6.2.8.1 Energy Requirements
Energy requirements for mechanical dewatering equipment are moderate to high,with the exception of belt presses and other low pressure or gravity drainagetype devices, which have relatively low energy requirements. Generally, therequirement for energy is proportional to the degree of dryness required inthe cake. To some extent, energy utilization can be reduced by increasingthe level of conditioning, but this would generally not be cost-effective.Conditioning chemical dosage adjustment would usually only be made to increasemachine capacity, increase solids capture, or aid in cake removal from thedewatering equipment. Drying beds and sludge lagoons require energy only forpumping sludge to the beds or lagoons and for the equipment used to removedewatered sludge from the beds or lagoons. Energy requirements for these solarprocesses are low in relation to that needed by mechanical dewateringequipment.
Energy requirements for the dewatering equipment can not be considered withoutalso taking into account the energy and costs required for subsequent trans-portation and disposal of the dewatered sludge. Often dewatering to 20 to 25%cake solids and hauling at this solids content is more cost-effective and lessenergy consuming than the alternative of dewatering to 35 to 45% solids andincinerating. Naturally it is environmentally desirable to always utilize theoverall lowest energy consuming processes for treatment, transportation and
86
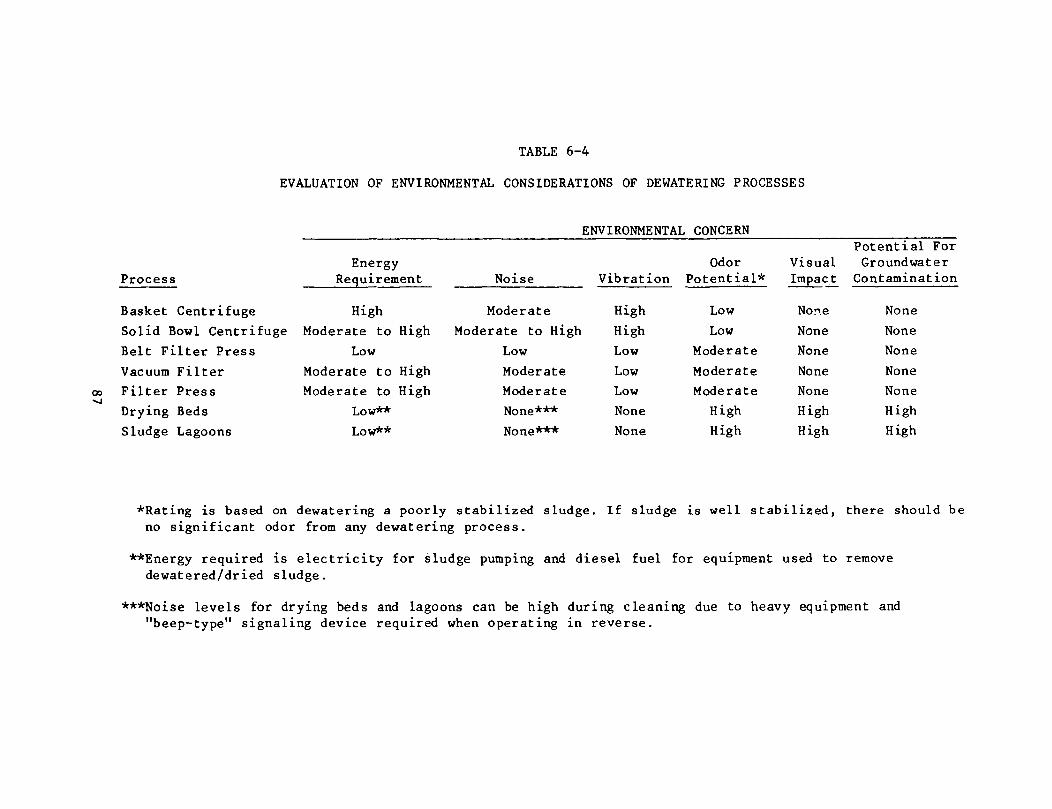
TABLE 6-4
EVALUATION OF ENVIRONMENTAL CONSIDERATIONS OF DEWATERING PROCESSES
ENVIRONMENTAL CONCERN
00
Process
Basket Centrifuge
Solid Bowl Centrifuge
Belt Filter Press
Vacuum Filter
Filter Press
Drying Beds
Sludge Lagoons
EnergyRequirement
High
Moderate to High
Low
Moderate to High
Moderate to High
Low**
Low**
Noise
Moderate
Moderate to High
Low
Moderate
Moderate
None***
None***
Vibration
High
High
Low
Low
Low
None
None
OdorPotential*
Low
Low
Moderate
Moderate
Moderate
High
High
VisualImpact
Nor>.e
None
None
None
None
High
High
Potential ForGroundwater
Contamination
None
None
None
None
None
High
High
*Rating is based on dewatering a poorly stabilized sludge. If sludge is well stabilized, there should beno significant odor from any dewatering process.
**Energy required is electricity for sludge pumping and diesel fuel for equipment used to removedewatered/dried sludge.
***Noise levels for drying beds and lagoons can be high during cleaning due to heavy equipment and"beep-type" signaling device required when operating in reverse.
ultimate disposal. Often, however, the alternative with the lowest overallcost for capital and operation and maintenance does not have the lowest energyconsumption. In such a situation, different individuals or ut i l i t ies reachdifferent conclusions; some select the lower cost alternative while othersselect the higher cost alternative which uses less energy.
A further discussion of energy requirements is presented in Chapter 8 of thismanual.
6.2.8.2 Noise
For equipment located indoors, noise is a consideration for plant operators,and for equipment located out of doors, noise is a consideration for bothoperators and neighbors to the treatment facility. The processes for vdiichnoise is a potential problem are basket centrifuges, solid bowl centrifuges,vacuum filters, and filter presses. High speed solid bowl centrifuges createmore noise problems than the lower speed models. Noise resulting from vacuumfilters and filter presses is primarily caused by vacuum pumps and highpressure hydraulic pumps, respectively. Often, vacuum pumps are located by thedesigner in another room away from vacuum filters, and this isolates vacuumfilter noise problems.
6.2.8.3 Vibration
Only centrifuges create major vibration problems, and this is essentially adesign consideration since with proper use of vibration isolators, the vibra-tions caused during normal centrifuge operation can be effectively dampened.Vibration can also be an indication of inadequate maintenance or the need formaintenance. These are factors which should be considered relative to thelocation of other equipment and operator's stations.
6.2.8.4 Odor Potential
Odor is a key concern relative to residential, commercial, and industrialneighbors of the treatment facility. It may also be of concern, depending onthe design, for indoor installations which have poor ventilation. Anotherfactor to consider is that operators may find the odor to be objectionableenough that they may prefer to stay away from the process, perhaps creatingoperation and/or maintenance problems. The kinds of odor vihich may presentproblems are hydrogen sulfide, mercaptans, indole, skatole, and ammonia.Ammonia is often released when the sludge pH is raised by the addition of limefor sludge conditioning.
Drying beds and sludge lagoons present the highest odor potential, but only ifsludge has not been adequately stabilized before application to the beds orlagoons. If sludge is properly stabilized, only an earthy or musty odor will
88
emanate from the beds or lagoons, and this odor is normally not offensive.During normal operation raw sludge or poorly stabilized sludge should not beplaced on drying beds. On a temporary basis, raw sludge that has been raisedto pH 12 by lime addition could be placed on drying beds.
For partially digested sludge, use of centrifuges will generally not create anodor problem, while use of vacuum filters, belt filter presses, and filterpresses may create a moderate odor problem.
For lime conditioned sludges, a localized occasional odor problem may occurdue to ammonia release. This is generally not a problem, although good venti-lation should be provided to protect workers and to prevent corrosion of metalsurfaces and electrical equipment.
6.2.8.5 Aesthetics (Visual Impact)
Depending on the plant location, lagoons and drying beds may create aestheticproblems. Landscaping around the plant perimeter as well as directly aroundthe beds or lagoons will help, as will berms. Well chosen, isolated locationson the plant site, or perhaps locations in remote areas, may be most suitablefor the beds or lagoons.
In mild climates, centrifuge installations may be outdoors. This shouldgenerally not create a visual problem, as centrifuges are visually compatiblewith other plant equipment.
6.2.8.6 Groundwater Contamination
Unlined lagoons or drying beds may allow downward percolation of water towardthe groundwater. The quantity and quality of this percolate will depend uponhow much the sludge has been previously thickened and the character of thesoil. Clay and clay containing soils will allow passage of water at very lowrates while filtering out solids. In general sand and gravel will allow down-ward passage at relatively high rates. Additionally, sludge lagoons often sealthemselves to a certain extent, greatly reducing percolation. Drying bedunderdrains also greatly reduce percolation, catching most of the percolatingwater so that it can be returned to the plant headworks for treatment. Thequality of the percolating water will also change as it moves downward throughthe soil. The reactions which occur will depend on the type of soil, how longthe soil has been used for this purpose, whether the soil is aerobic oranaerobic, and the depth to groundwater. Seasonal variations in groundwaterlevels may also create problems in certain areas and should be investigatedprior to process selection.
Sealing of drying beds or the use of underdrains should be considered if testsindicate that groundwater contamination will be likely to occur. Drying bedbottoms are commonly sealed with concrete or asphalt, while lagoons are sealedmost often with a compacted bentonite clay layer or an impermeable plasticmembrane.
89
6.2.9 Long Term Utility
The appropriateness and cost-effectiveness of the dewatering process isclosely linked with long-term consistency of sludge quality and the ultimatedisposal method which is utilized. Evaluation of the long term utility of adewatering process should involve consideration of these factors. For example,if the type of secondary treatment is changed from trickling filtration toactivated sludge, the resultant sludge characteristics will change and thiscan affect the cost of dewatering and the overall appropriateness of thedewatering process being used. Another example would be the expansion of sanddrying beds. Although such an expansion may be cost-effective at the presenttime, if the same land is required for future expansion of the liquid handlingcomponents of the treatment process, i t may be preferable to select adifferent dewatering strategy rather than changing a few years later. Anotherexample would be selection of a belt press, centrifuge, or vacuum filter fordewatering prior to landfill, when the landfill has only a few years of liferemaining, and no other nearby landfill site is available; in such a case, itmay be appropriate to consider a filter press, because of the probability of along truck haul to a landfill or land application s i te . In addition, the lowervolume of a filter press cake may help extend the life of the existinglandfill . Considerations such as these are important in evaluation of the longterm uti l i ty of a dewatering process.
6.2.10 Plant Location
Factors associated with plant location and the effect on dewatering processselection include:
• Land Availability• Proximity To Ultimate Disposal Location• Proximity To Developed Areas
6.2.10.1 Land Availability
Plant location can greatly influence land availability for plant expansion,for construction of land intensive dewatering processes such as drying bedsand lagoons, and for providing a buffer zone around the plant. Land availabil-ity is a factor in expansion of an existing plant including its dewateringfacilities. A plant in an isolated location is more likely to have room forexpansion or for drying beds or lagoons than a plant located in a heavilypopulated area. Land availability can also be important to provide room for abuffer zone around a plant, to help control odor problems with close neighborsor to allow landscaping to visually shield the plant.
Available land does not have to be immediately adjacent to the plant in caseswhere a plant is located in a heavily populated area. Although not common,
90
dewatering facilities can be located a distance from the main plant processeswith liquid sludge transported by pipeline or truck to the location fordewatering.
6.2.10.2 Proximity To Ultimate Disposal Location
Dewatering options are closely tied to either an existing or a future ultimatedisposal method. If a landfill or a site for composting or land application islocated nearby, this can influence the selection of the dewatering process,since dewatering to a very dry cake such as that produced by a filter pressmay be unnecessary. However, if there is no ultimate disposal locationnearby, dewatering by fil ter press for long distance hauling or for incinera-tion may be cost-effective.
6.2.10.3 Proximity to Developed Areas
The proximity of the wastewater treatment plant to residential, commercial, orindustrial development can limit the options available for dewatering. Sanddrying beds and lagoons both have a potential for major odor problems. Inaddition, lagoons and drying beds can be visually unattractive and may requireeither landscaping around the perimeter or construction of berms.
6.2.11 Experience at Other Operating Installations
Experience at other operating installations with similar sludges is anotherimportant screening criterion. There are undoubtedly other wastewater treat-ment plants somewhere in the region which have had similar dewateringproblems, and evaluation of their experiences can be invaluable. It is forthis reason that Chapter 4 with the capabilities of dewatering processes andChapter 9 with summaries of side-by-side comparisons were included in thismanual. For drying beds or lagoons, nearby locations with similar weather areparticularly good indicators of the type of performance which can beexpected.
6.2.12 Bias by Individuals or Agencies
The plant owner, plant operators, and/or the enforcement agency may havepreconceived biases for or against certain processes. The extent and rationalefor such biases should be investigated by the designer. A decision should bemade relative to the reasonableness of the bias and whether it should be usedas a basis for eliminating a process from further consideration.
91
6.3 Stage 2 - Init ial Cost Evaluation
The purpose of the init ial cost evaluation is to develop budget level costestimates for sludge treatment processes and techniques which remain after theini t ia l screening process, and to eliminate techniques which are not remotelycost-effective. Importantly, this cost evaluation must include not only thedewatering process, but also the entire sludge handling system, which includesprior treatment processes and subsequent transport and ultimate disposal ofthe sludge cake. Because of the number of treatment, dewatering,transportation, and ultimate disposal processes available, up to 10 to 20process combinations may be evaluated in the init ial cost evaluation.
This ini t ial cost evaluation uses budget level cost curves and cost data fordevelopment of total sludge treatment and disposal system costs. Generally,budget level cost estimates can be expected to be within + 15% of true cost,assuming appropriateness of the design parameters used to develop the costs. Anumber of references are available which present capital and O&M cost data formany sludge handling processes from which budget level costs can be developed(3-11). Construction cost and operation and maintenance cost curves for ninedifferent dewatering processes are presented in Appendix C. The curves arebased on April 1982 cost levels.
Equipment costs can also be obtained from equipment manufacturers andequipment suppliers. Often manufacturers do not have comprehensive dataavailable on O&M requirements and can offer only general guidelines. Thus O&Mrequirements should be based on the above references, the Appendix C costdata, or the experience of the designer or manufacturer.
I t is important that costs and O&M requirements presented in these or otherreferences be updated to either the time of the subject cost analysis, or somefuture time, depending upon the requirements of the project. The simplestapproach is to use a single composite index to update construction costs. Theindex most commonly used for this purpose is the Engineering News Record (ENR)Construction Cost Index (CCI). The ENR Construction Cost Index average for 20cit ies was 348.64 in April 1982.
The ini t ial cost evaluation should develop capital and O&M costs, and expressthe total cost in either total annual cost or present worth cost. The relativecost-effectiveness of alternatives is then evaluated by ranking the alterna-tives on the basis of either the total annual cost or the present worth cost.
An example cost evaluation, similar to one which should be conducted todevelop budget level costs during the init ial cost evaluation phase, has beenprepared for one solids handling alternative for a 1.1 cu m/s (25 mgd) acti-vated sludge plant operating at design capacity. A process flow diagram anddesign cri teria for solids treatment and handling are shown on Figure 6-3.
For this example, a raw wastewater flow of 25 mgd has suspended solids andBOD5 concentrations of 275 mg/1 and 230 mg/1, respectively. Primary clarif i-cation removes 65% of the suspended solids and 35% of the BOD5; the primarysludge has a 5% solids content with 65% of the solids being volatile. During
92
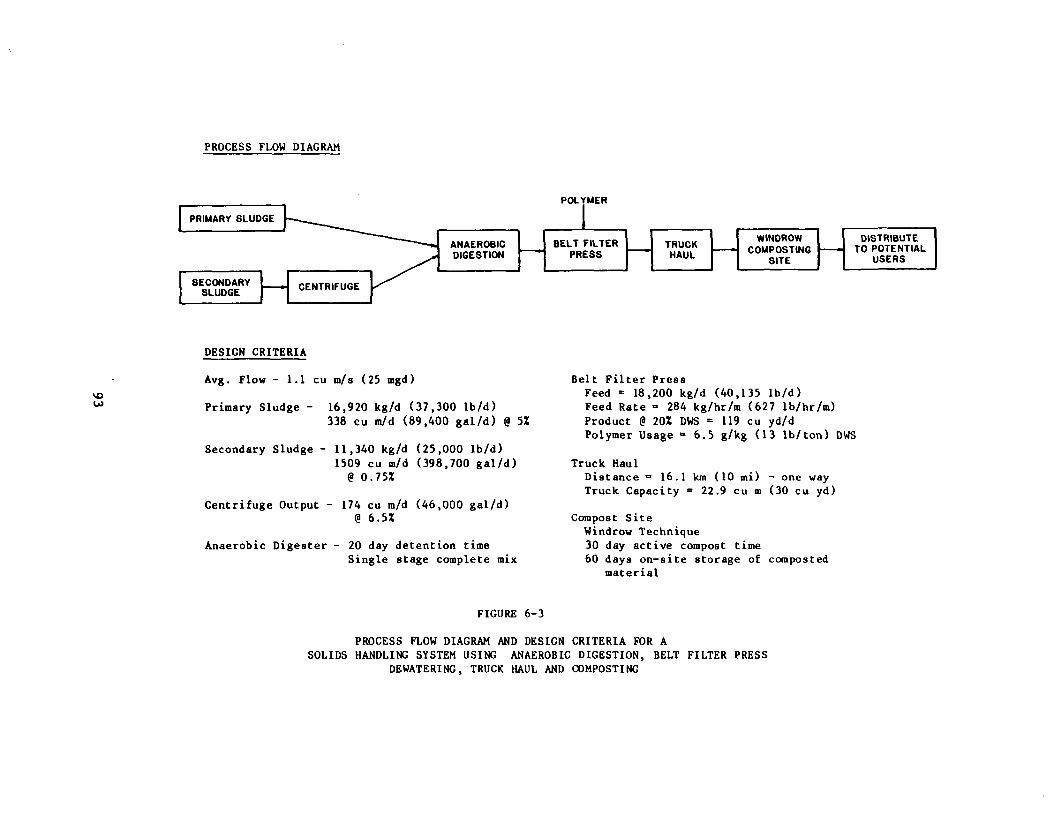
PROCESS FLOW DIAGRAM
POLYMER
ANAEROBICDIGESTION
IBELT FILTER
PRESSTRUCKHAUL
WINDROWCOMPOSTING
SITE
DISTRIBUTETO POTENTIAL
USERS
VO
DESIGN CRITERIA
Avg. Flow - 1.1 cu ml a (25 mgd)
Primary Sludge - 16,920 kg/d (37,300 lb/d)338 cu m/d (89,400 gal/d) @ 5Z
Secondary Sludge - 11,340 kg/d (25,000 lb/d)1509 cu m/d (398,700 gal/d)@ O.75Z
Centrifuge Output - 174 cu m/d (46,000 gal/d)<a 6.5Z
Anaerobic Digester - 20 day detention timeSingle stage complete mix
Belt Filter PressFeed = 18,200 kg/d (40,135 lb/d)Feed Rate = 284 kg/hr/ra (627 lb/hr/m)Product <? 20* DWS = 119 cu yd/dPolymer Usage =6.5 g/kg (13 lb/ton) DWS
Truck HaulDistance «> 16.1 km (10 mi) - one wayTruck Capacity = 22.9 cu m (30 cu yd)
Compost SiteWindrow Technique30 day active compost time60 days on-site storage of composted
material
FIGURE 6-3
PROCESS FLOW DIAGRAM AND DESIGN CRITERIA FOR ASOLIDS HANDLING SYSTEM USING ANAEROBIC DIGESTION, BELT FILTER PRESS
DEWATERING, TRUCK HAUL AND COMPOSTING
biological treatment, the remaining 65% of BOD5 is converted to cellularmaterial: 0.8 pounds of cells are produced per pound of BOD5 removed. V&Shas a 0.75% solids content, and the solids are 80% volatile. It is thickenedto a 6.5% solids content using a low-speed solid bowl centrifuge. Duringcomplete mix single-stage anaerobic digestion, 50% of the volatile solids aredestroyed, resulting in a feed to the belt press of 18,200 kg/d (40,135 lb/d)at a rate of 284 kg/hr/m (627 lb/hr/m). Polymer is used to condition thesludge at a rate of 6.5 g/kg (13 lb/ton). The belt press cake of 20% solids ishauled in a 22.9 cu m (30 cu yd) truck to a remote composting location.Composting is by the windrow technique with frequent turning of the windrows,particularly in the early stages. Composting time is 30 days followed by 60days on-site storage prior to stabilization. No income was included for saleof the compost product.
Installed, operating and standby equipment design capacities are shown inTable 6-5 for sludge handling processes. To develop construction costs andbuilding energy requirements, installed capacity was used as the basis.Operating capacity was used as the basis for labor, energy, maintenancematerial and chemical requirements.
Capital and operation and maintenance costs for sludge handling operations inthis example are shown in Table 6-5. Based upon the capital cost of$6,318,200, and an annual cost of $483,500/year, the total annual cost forsludge handling is $1,287,400/year. Development of construction cost and O&Mrequirements for the low-speed solid bowl centrifuge used for VftS thickeningand the belt filter press used for digested sludge dewatering are based uponAppendix C, Figures C-4 to C-6 and C-10 to C-12, respectively. Other construc-tion costs and O&M requirements were developed using references (3) through(11). Unit costs used for labor, electrical, digester gas, and diesel fuel areshown in Table 6-5.
Costs developed using this general approach will have an accuracy of + 15% ofthe actual equipment cost, which is sufficient for this stage of the analysis.After determining costs for each of the different alternatives, about four orfive of the lowest cost alternatives should be selected for more detailedscrutiny, and refinement of cost data by determining equipment loadings fromlaboratory and field scale testing. In many situations, more than one dewater-ing process would be included in the remaining four to five alternatives.
Naturally such cost estimates, although accurate to + 15%, must be based onconservative estimates of dewatering throughput rates at this stage of theanalysis, since no laboratory or field testing on the actual sludge has yetbeen performed. It is possible that the facility may be overdesigned by asmuch as 50 to 100 percent in this initial cost evaluation. Designs tailoredto the specific sludge require field and/or laboratory test data. This type ofinformation is required before final cost estimates for the dewateringalternatives can be made.
94
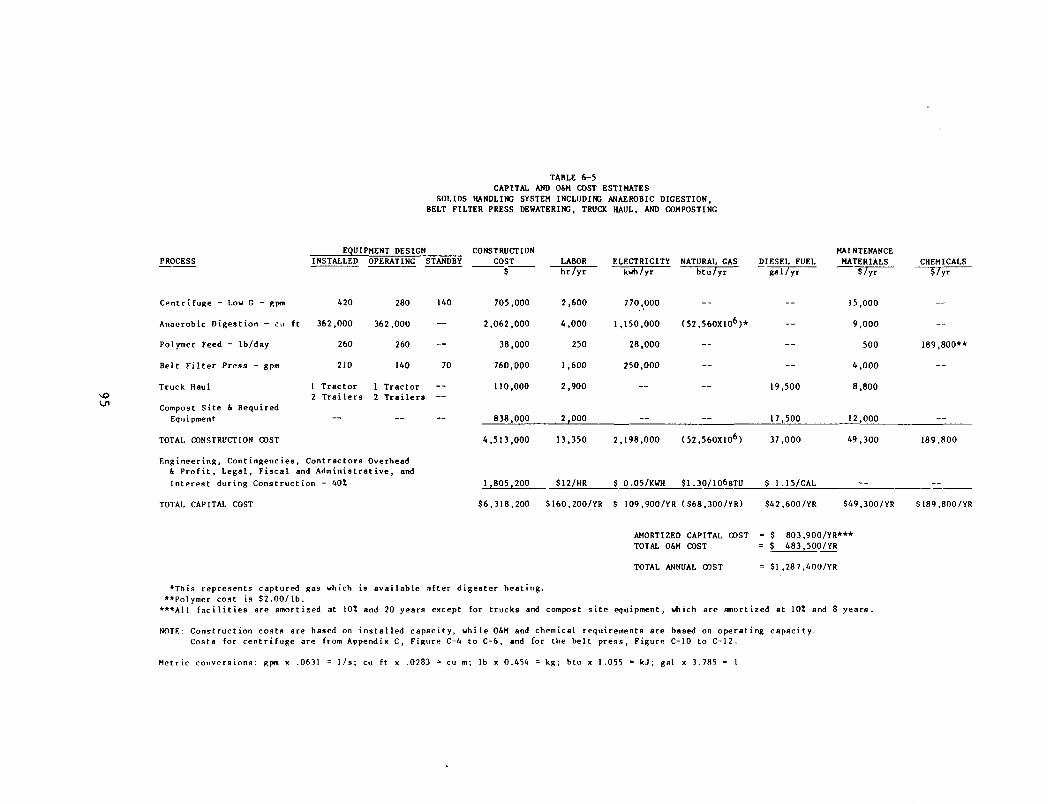
TABLE 6-5
CAPITAL AND 0&H COST ESTIMATES
SOLIDS HANDLING SYSTEM INCLUDING ANAEROBIC DIGESTION,
BELT FILTER PRESS DEWATERING, TRUCK HAUL, AND COMPOSTING
EQUIPHENT DESIGNPROCESS INSTALLED OPERATING STANDBY
Centrifuge - Low C - gpm 420
Anaerobic Digestion - Cii ft 362,000
260
210
280
362,000
260
140
1 Tractor 1 Tractor
2 Trailers 2 Trailers —
Polymer Feed - lb/day
Belt Filter Press - gpm
Truck Haul
Compost Site & Required
Equipment
TOTAL CONSTRUCTION COST
Engineering, Contingencies, Contractors Overhead
& Profit, Legal, Fiscal and Administrative, and
Interest during Construction - 40X
TOTAL CAPITAL COST
140
70
INSTRUCTIONCOST
$
705,000
2,062,000
38,000
760,000
110,000
838,000
LABOR
hr/yr
2,600
4,000
250
1 ,600
2,900
2,000
ELECTRICITYkwh/yr
770,000
1,150,000
28,000
250,000
—
NATURAL GASbtu/yr
—
(52.560X10⁶)*
—
—
—
DIESEL FUELgal/yr
—
—
—
—
19,500
17,500
MAINTENANCEMATERIALS
$/yr
15,000
9,000
500
4,000
8,800
12,000
CHEMICALS
$/yr
--
—
189,800**
—
4,513,000 13,350 2,198,000 (52.56OX1O6) 37,000
I ,805,200
49,300
$12/HR $ 0.05/KWH $ 1 . 3 0 / 1 0 6 B T U $ 1.15/CAL
189,800
$6,318,200 S16O.2OO/YR $ 109,900/YR (S68.300/YR) $42,600/YR S49.300/YR $189,800/YR
AMORTIZED CAPITAL COST - $ 8 0 3 , 9 0 0 / Y R * * *TOTAL O&M COST = $ 4 8 3 , 5 0 0 / Y R
TOTAL ANNUAL COST = $1 ,28 7 ,400/YR
*This represents captured gas which i s ava i lable after d iges ter heat ing."Polymer cost is $ 2 . 0 0 / l b .
***A11 f a c i l i t i e s are amortized at 10Z and 20 years except for trucks and compost s i t e equipment, which are amortized at 10Z and 8 y e a r s .
NOTF: Construction cos t s are based on i n s t a l l e d capaci ty , while O&M and chemical requirements are based on operating capaci ty .Costs for centr i fuge are from Appendix C, Figure C-4 to C-6, and for the belt press , Figure C-10 to C-12.
M e t r i c c o n v e r s i o n s : gpra x . 0 6 3 1 = 1 / s ; c u f t x . 0 2 8 3 =• c u m; l b x 0 . 4 5 4 = k g ; b t u x 1 . 0 5 5 - k j ; g a l x 3 . 7 8 5 = 1
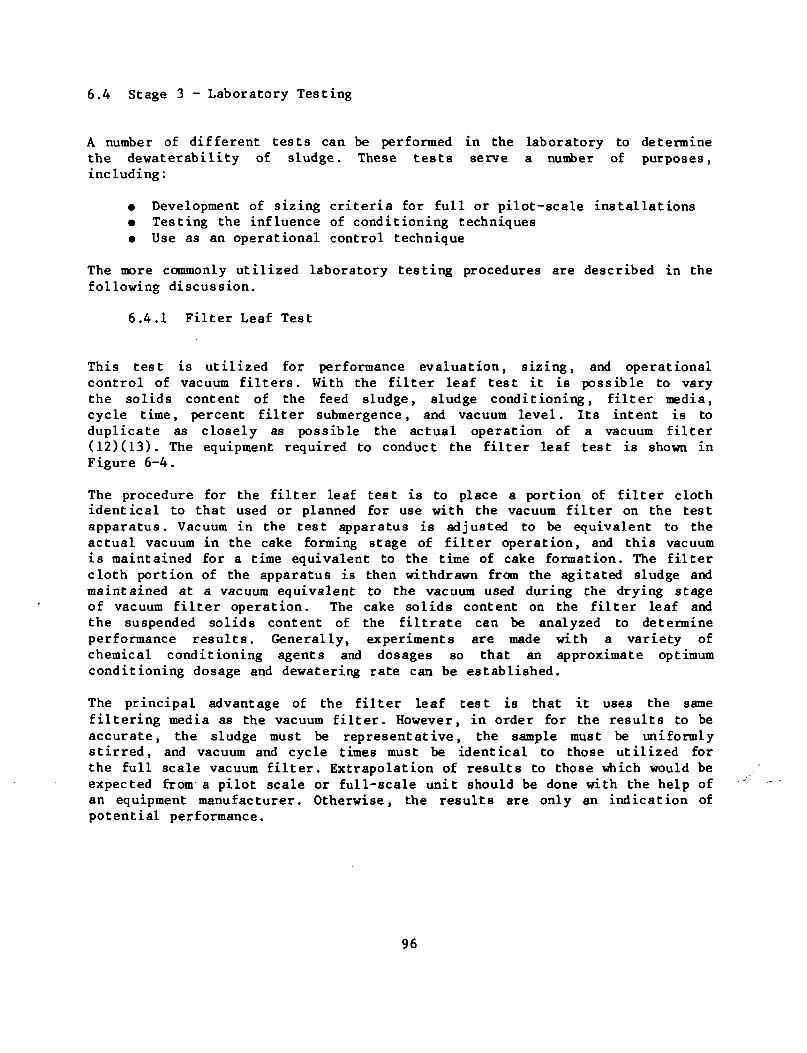
6.4 Stage 3 - Laboratory Testing
A number of different tests can be performed in the laboratory to determinethe dewaterability of sludge. These tests serve a number of purposes,including:
• Development of sizing criteria for full or pilot-scale installations• Testing the influence of conditioning techniques• Use as an operational control technique
The more commonly utilized laboratory testing procedures are described in thefollowing discussion.
6.4.1 Filter Leaf Test
This test is utilized for performance evaluation, sizing, and operationalcontrol of vacuum fi l ters . With the filter leaf test it is possible to varythe solids content of the feed sludge, sludge conditioning, filter media,cycle time, percent filter submergence, and vacuum level. Its intent is toduplicate as closely as possible the actual operation of a vacuum filter(12)(13). The equipment required to conduct the filter leaf test is shown inFigure 6-4.
The procedure for the filter leaf test is to place a portion of filter clothidentical to that used or planned for use with the vacuum filter on the testapparatus. Vacuum in the test apparatus is adjusted to be equivalent to theactual vacuum in the cake forming stage of fil ter operation, and this vacuumis maintained for a time equivalent to the time of cake formation. The filtercloth portion of the apparatus is then withdrawn from the agitated sludge andmaintained at a vacuum equivalent to the vacuum used during the drying stageof vacuum fil ter operation. The cake solids content on the filter leaf andthe suspended solids content of the fi l trate can be analyzed to determineperformance results. Generally, experiments are made with a variety ofchemical conditioning agents and dosages so that an approximate optimumconditioning dosage and dewatering rate can be established.
The principal advantage of the filter leaf test is that it uses the samefiltering media as the vacuum fil ter. However, in order for the results to beaccurate, the sludge must be representative, the sample must be uniformlystirred, and vacuum and cycle times must be identical to those utilized forthe full scale vacuum fi l ter . Extrapolation of results to those which would beexpected from a pilot scale or full-scale unit should be done with the help ofan equipment manufacturer. Otherwise, the results are only an indication ofpotential performance.
96
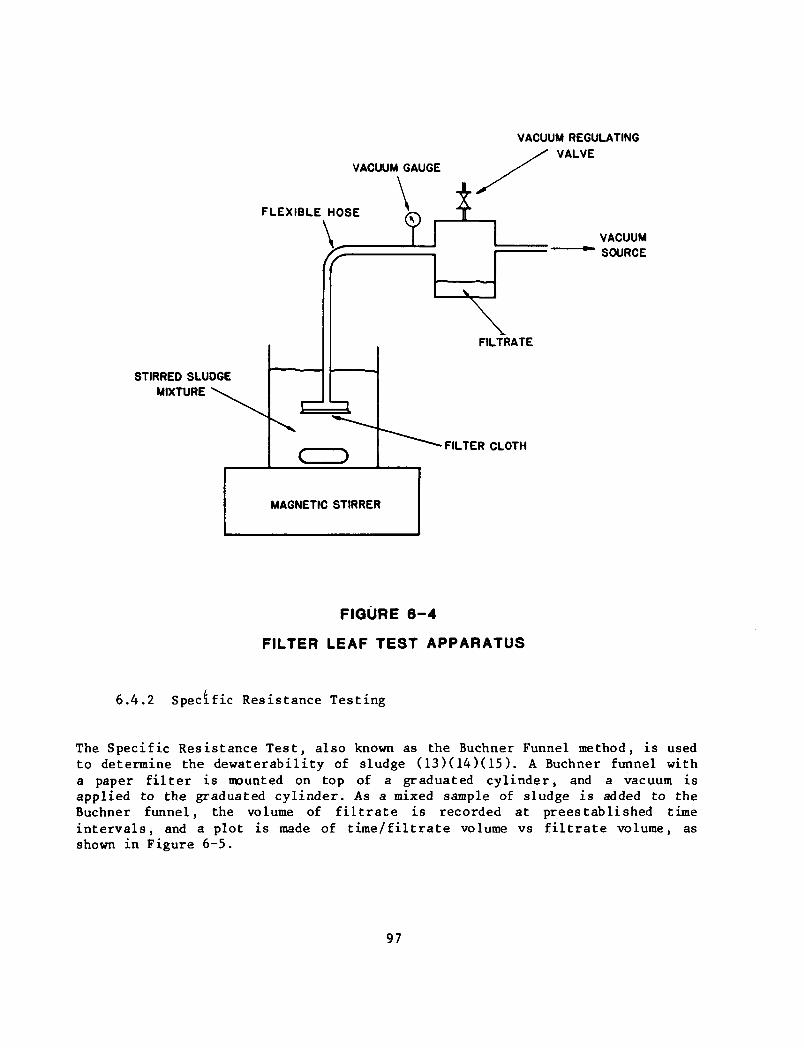
VACUUM REGULATING
VALVEVACUUM GAUGE
FLEXIBLE HOSE
STIRRED SLUDGEMIXTURE
VACUUMSOURCE
FILTER CLOTH
FIGURE 6-4
FILTER LEAF TEST APPARATUS
6.4.2 Specific Resistance Testing
The Specific Resistance Test , also known as the Buchner Funnel method, is usedto determine the dewaterability of sludge (13)(14)(15). A Buchner funnel witha paper f i l t e r is mounted on top of a graduated cylinder, and a vacuum isapplied to the graduated cylinder. As a mixed sample of sludge is added to theBuchner funnel, the volume of f i l t r a t e is recorded at preestablished timein te rva l s , and a plot is made of t ime / f i l t r a t e volume vs f i l t r a t e volume, asshown in Figure 6-5.
97
oUJco
SLOPE = b = - ,
V - M L
FIGURE 6-5TIME/FILTRATE VOLUME VS. FILTRATE VOLUME PLOT
USED IN SPECIFIC RESISTANCE TESTING
Using the slope of this line, specific resistance (r) is calculated from theformula:
r =2 PA2b
uwwhere:
r = specific resistance - m/kgP = pressure of filtration - PaA = area of filter - sq mb = slope of time/volume vs volume curve - s/mu = viscosity of filtrate - Pa.sw = weight of dry solids per volume of filtrate - kg/cu m
Although it is possible to utilize laboratory specific resistance data tocalculate filter size and loadings, this procedure is not recommended becauseof dissimilarities between the specific resistance test and actual vacuumfilter operation. Key dissimilarities are the use of top feed into theBuchner funnel in contrast to pickup of sludge from the feed tank in actualpractice, and use of a paper filtering medium rather than the actual filteringmedium used on the vacuum filter.
The best use of the specific resistance test is to indicate the influence ofvarying dosages of conditioning chemicals on sludge dewaterability. Figure 6-6illustrates such a plot and its usefulness in determining optimum conditioningchemical dosage.
98
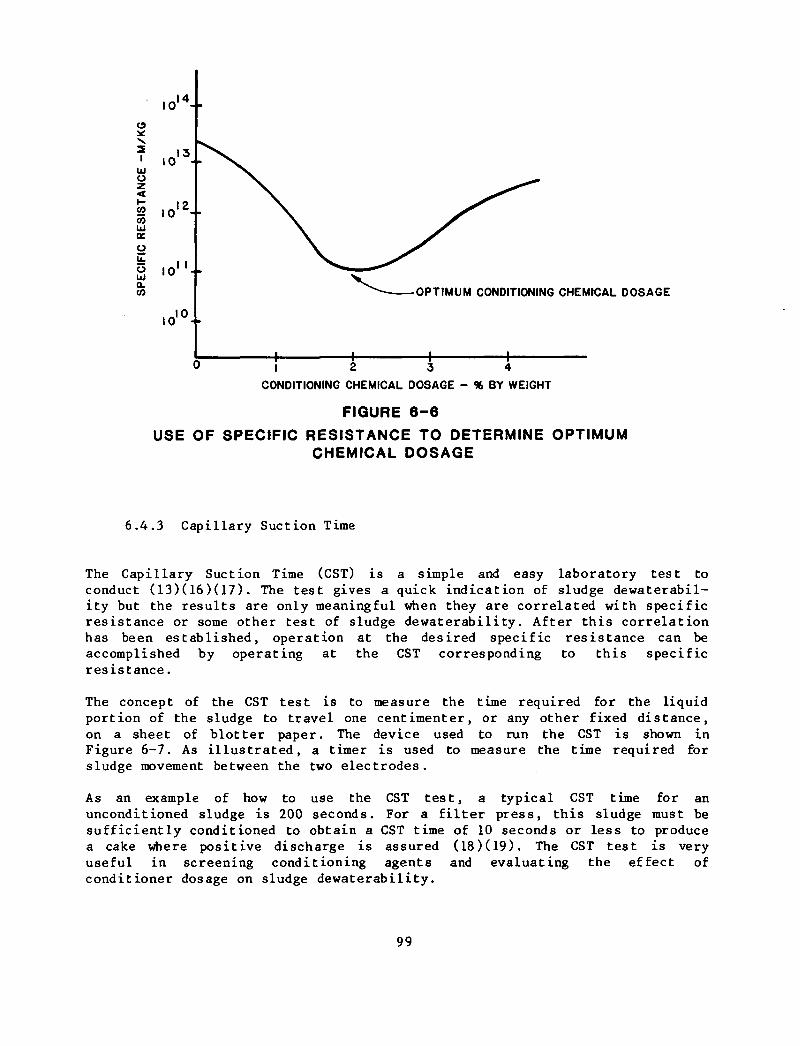
a
o<
l o 1 4 - -
«o l3+
J2
Id
<r
1 10" +a.co
«olo+
OPTIMUM CONDITIONING CHEMICAL DOSAGE
4-1 2 3 4
CONDITIONING CHEMICAL DOSAGE - % BY WEIGHT
FIGURE 6-6USE OF SPECIFIC RESISTANCE TO DETERMINE OPTIMUM
CHEMICAL DOSAGE
6.4.3 Capillary Suction Time
The Capillary Suction Time (CST) is a simple and easy laboratory test toconduct (13)(16)(17). The test gives a quick indication of sludge dewaterabil-ity but the results are only meaningful when they are correlated with specificresistance or some other test of sludge dewaterability. After this correlationhas been established, operation at the desired specific resistance can beaccomplished by operating at the CST corresponding to this specificresistance.
The concept of the CST test is to measure the time required for the liquidportion of the sludge to travel one centimenter, or any other fixed distance,on a sheet of blotter paper. The device used to run the CST is shown inFigure 6-7. As illustrated, a timer is used to measure the time required forsludge movement between the two electrodes.
As an example of how to use the CST test , a typical CST time for anunconditioned sludge is 200 seconds. For a f i l ter press, this sludge must besufficiently conditioned to obtain a CST time of 10 seconds or less to producea cake where positive discharge is assured (18)(19). The CST test is veryuseful in screening conditioning agents and evaluating the effect ofconditioner dosage on sludge dewaterability.
99
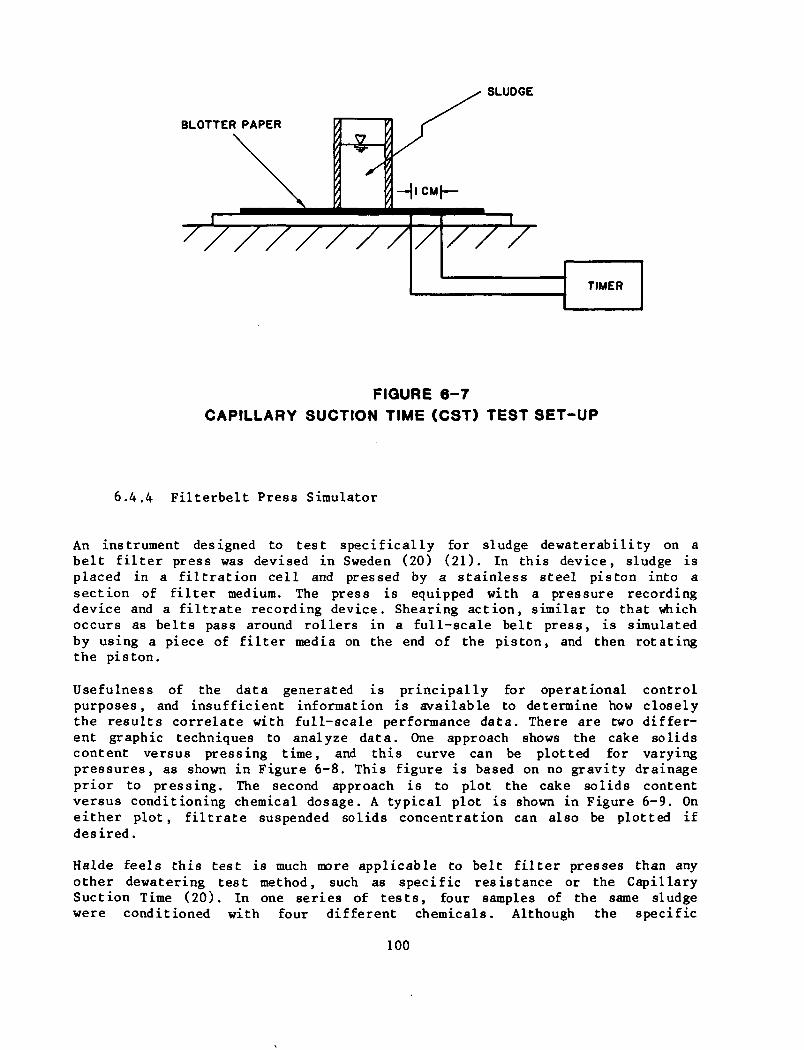
SLUDGE
BLOTTER PAPER
^
1
7 /y
7/1
TIMER
FIGURE 6-7CAPILLARY SUCTION TIME (CST) TEST SET-UP
6.4.4 Filterbelt Press Simulator
An instrument designed to test specifically for sludge dewaterability on abelt filter press was devised in Sweden (20) (21). In this device, sludge isplaced in a filtration cell and pressed by a stainless steel piston into asection of filter medium. The press is equipped with a pressure recordingdevice and a filtrate recording device. Shearing action, similar to that whichoccurs as belts pass around rollers in a full-scale belt press, is simulatedby using a piece of filter media on the end of the piston, and then rotatingthe piston.
Usefulness of the data generated is principally for operational controlpurposes, and insufficient information is available to determine how closelythe results correlate with full-scale performance data. There are two differ-ent graphic techniques to analyze data. One approach shows the cake solidscontent versus pressing time, and this curve can be plotted for varyingpressures, as shown in Figure 6-8. This figure is based on no gravity drainageprior to pressing. The second approach is to plot the cake solids contentversus conditioning chemical dosage. A typical plot is shown in Figure 6-9. Oneither plot, filtrate suspended solids concentration can also be plotted ifdesired.
Halde feels this test is much more applicable to belt filter presses than anyother dewatering test method, such as specific resistance or the CapillarySuction Time (20). In one series of tests, four samples of the same sludgewere conditioned with four different chemicals. Although the specific
100
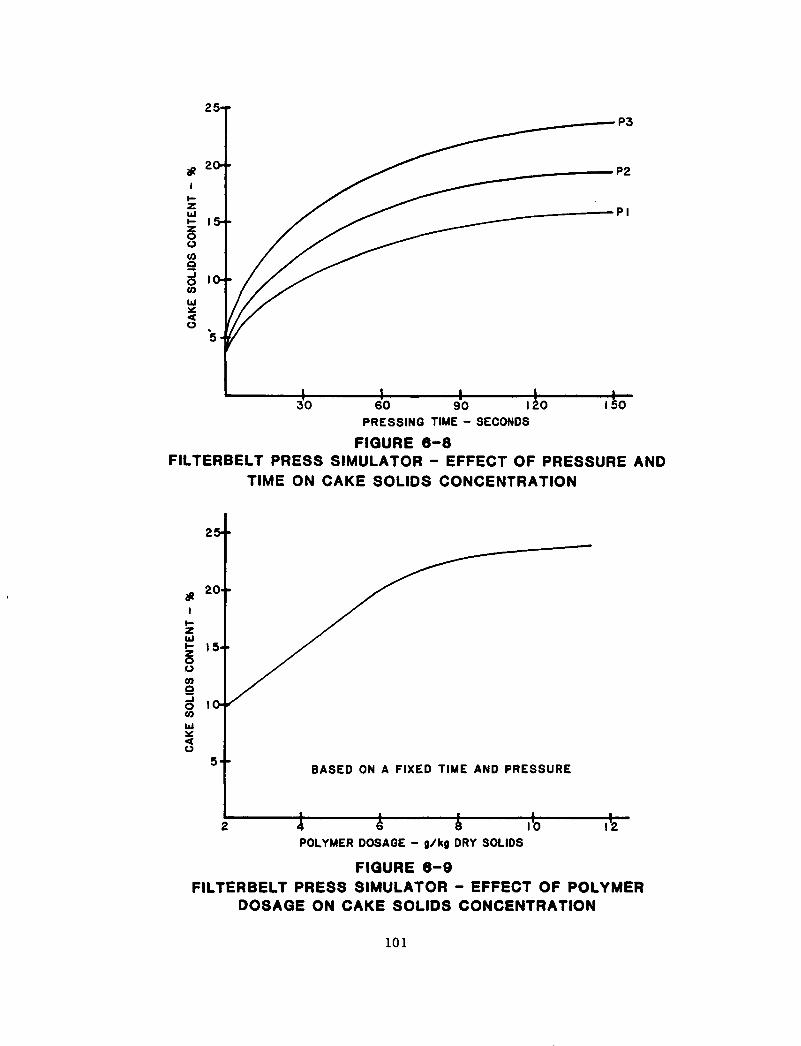
25-r
60 90 120 150PRESSING TIME - SECONDS
FIGURE 6-8FILTERBELT PRESS SIMULATOR - EFFECT OF PRESSURE AND
TIME ON CAKE SOLIDS CONCENTRATION
25-•
so(0
SCO
hi
O
5 - .BASED ON A FIXED TIME AND PRESSURE
POLYMER DOSAGE - g/kg DRY SOLIDS
FIGURE 6-9FILTERBELT PRESS SIMULATOR - EFFECT OF POLYMER
DOSAGE ON CAKE SOLIDS CONCENTRATION
101
resistance was the same for each of the conditioned sludges, cake solidscontents according to the filterbelt press simulator ranged from 8% to 23%(including conditioning chemical). This result appears to indicate that thistest may be more applicable to belt presses than specific resistance testing.
6.4.5 Laboratory Scale Centrifuge Testing
Laboratory centrifuge techniques have been developed. These tests are usefulfor determination of the effect of centrifugal force on cake solids concentra-tion, the influence of centrifuge retention time on cake concentration, andthe influence of conditioning chemicals on cake solids concentrations. Thefirst two, centrifugal force and retention time in the centrifuge are thefactors with the greatest influence on effectiveness of the centrifuge.
The most frequently used laboratory test technique, sometimes called thebottle centrifuge method, is to spin a graduated centrifuge tube at differentG forces or for different lengths of time. At the termination of testing, thecentrate is decanted and the cake solids are measured. A typical plot of datawhich could be obtained by this technique is shown in Figure 6-10. Retentiontime in the centrifuge and conditioning chemical dosage will affect the shapeof the curve and the cake solids concentration achievable. This test can alsobe used to evaluate the effect of various polymer dosages on sludge dewater-ability. It does not take into account the agitation and drainage which willoccur in a horizontal solid bowl centrifuge and thus the cake solids in thefull-scale unit may be higher than that predicted by the bottle centrifugetest . Such tests are used by manufacturers to determine quickly on unknownapplications whether or not a centrifuge is feasible. It provides an excellenttool for judging success, but is not effective for scale-up and sizing ofequipment.
Vesilind has proposed a modification of this technique in which a strobe lightis utilized to allow continuous observation of the sludge cake/centrateinterface (13). This technique can be useful for predicting optimum detentiontime in the centrifuge.
6.5 Stage 4 - Field Testing
Following the initial screening, initial cost evaluation, and laboratorytesting, often two or more dewatering alternatives have similar overall costsand it is often necessary to field test different dewatering processes. Theneed and justification for field level testing depends in part upon the sizeof the wastewater treatment plant. At very small plants with a capacity lessthan 0.04 cu m/s (1 mgd), it may not be cost-effective to conduct pilot-scaleor full-scale testing. Instead laboratory or bench-scale testing by themanufacturer may be adequate.
102
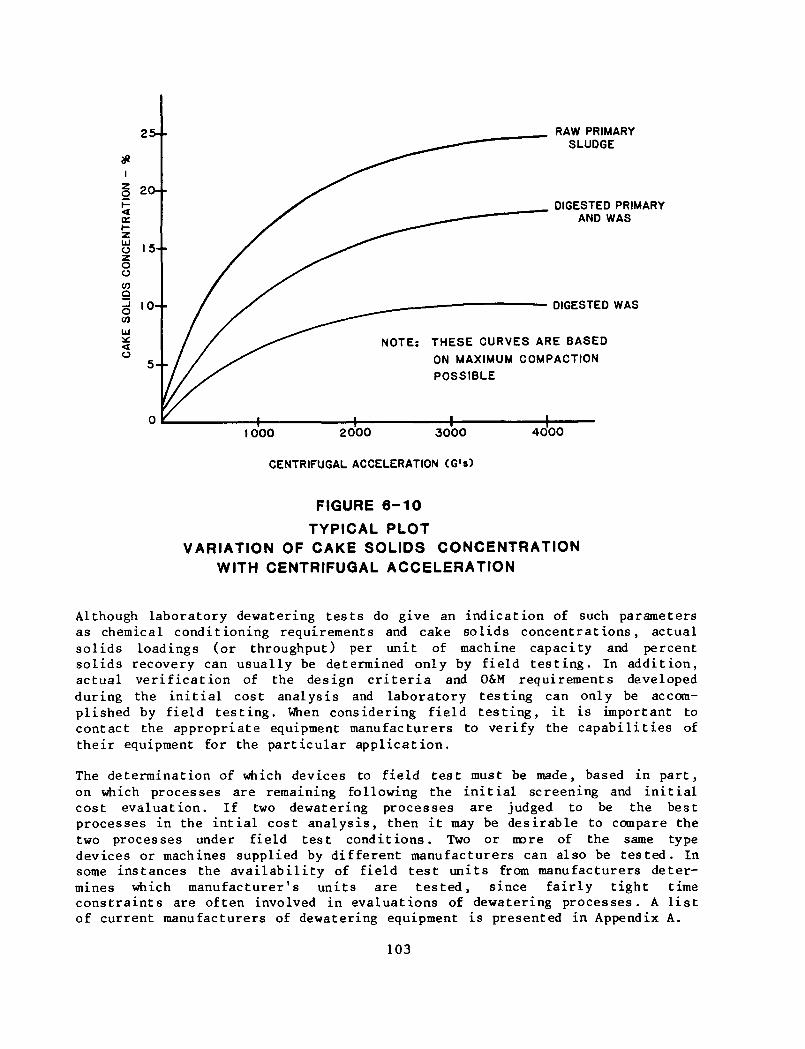
25- •
2O-•
I 5--oo
0
CO
o5 - -
RAW PRIMARYSLUDGE
DIGESTED PRIMARYAND WAS
DIGESTED WAS
1000 2000 3000
CENTRIFUGAL ACCELERATION (G'»)
NOTE: THESE CURVES ARE BASEDON MAXIMUM COMPACTIONPOSSIBLE
4000
FIGURE 6-10TYPICAL PLOT
VARIATION OF CAKE SOLIDS CONCENTRATIONWITH CENTRIFUGAL ACCELERATION
Although laboratory dewatering tests do give an indication of such parametersas chemical conditioning requirements and cake solids concentrations, actualsolids loadings (or throughput) per unit of machine capacity and percentsolids recovery can usually be determined only by field testing. In addition,actual verification of the design criteria and 0&M requirements developedduring the initial cost analysis and laboratory testing can only be accom-plished by field testing. When considering field testing, it is important tocontact the appropriate equipment manufacturers to verify the capabilities oftheir equipment for the particular application.
The determination of which devices to field test must be made, based in part,on which processes are remaining following the initial screening and initialcost evaluation. If two dewatering processes are judged to be the bestprocesses in the intial cost analysis, then it may be desirable to compare thetwo processes under field test conditions. Two or more of the same typedevices or machines supplied by different manufacturers can also be tested. Insome instances the availability of field test units from manufacturers deter-mines which manufacturer's units are tested, since fairly tight timeconstraints are often involved in evaluations of dewatering processes. A listof current manufacturers of dewatering equipment is presented in Appendix A.
103
Pilot-scale devices are usually the smallest production scale machinesavailable. Although these are production machines, they are typically referredto as pilot-scale units, while the larger units are typically referred to asfull-scale units. For example, a pilot-scale belt filter press would normallybe only 0.5 m or 1.0 m wide, versus a 2 m wide full-scale unit. Pilot-scalesolid-bowl centrifuges may have a capacity of only 0.95 to 2.2 1/s (15 to 35gpm) , while the largest centrifuges have capacities in excess of 25 1/s(400 gpm). Pilot-scale filter presses often have only four filtering chambers,while the largest presses have more than 40 chambers.
Scale-up from the small pilot-scale units to the larger full-scale units isgenerally predictable and can usually be estimated by the manufacturer basedupon previous field test experience. Thus, often pilot-scale field testing isall that is required prior to the final economic evaluation and selection of adewatering process. However, it is not always true that scale-up from pilot-scale to full-scale units is predictable. For example, at the Los AngelesCounty Sanitation Districts, both pilot- and full-scale testing of belt filterpresses and low-speed centrifuges was conducted (22)(23). Of the two beltpresses evaluated in detail, one manufacturer's belt press had a 50 percentlower sludge throughput capacity in the pilot-scale testing, but had athroughput capacity that was more than 30 percent higher than the othermachine in the full-scale testing. It was also concluded that the performanceof smaller belt presses was consistently better than that of larger units onall sludge blends tested. Some consideration should therefore be given by thedesigner to possible changes in performance when scaling-up the design andperformance of pilot-scale belt filter presses for full-scale operation.
Field testing of dewatering processes can be on an intermittent or continuousbasis, depending upon the ability to provide sludge feed and to provide forthe removal of sludge cake. In addition, the chemical conditioning costincreases in proportion to the length of testing. Ten different test programsperformed at various locations in the United States are summarized inChapter 9. The total time required for field testing ranged from several weeksto over six months. Pilot- and full-scale units were not operated continuouslyover the entire testing period; in most cases, the units from differentmanufacturers were operated at different times and not concurrently. At least15 separate runs covering three days or more each appears to be the minimumneeded to evaluate the many variables associated with each dewatering unit.
Field testing of several dewatering processes provides specific designcriteria which can be used to develop a more realistic cost comparison betweenunits. If practical, simultaneous pilot- or full-scale testing of thedifferent dewatering devices being evaluated is recommended to obtain directlycomparable results. In summary, field testing should include the following:
• Field test as many machines as possible.• Use actual sludge (or sludges) to be dewatered in final plant, if
possible.• Test various levels and types of conditioning.• Field test machines using same sludge feed in simultaneous side-by-
side comparisons, if possible.
104
• Field test machines which are as close in size to design machines aspossible.
• Have at least one engineer or senior operator be involved in fieldtesting program. Do not rely entirely on manufacturer's representativefor evaluation and reporting of test results.
• Verify or modify design criteria established in initial costevaluation.
6.6 Stage 5 - Final Evaluation Based on Detailed Design Parameters
After the results from the laboratory and/or field level testing areavailable, i t will be possible to scale-up or size the actual equipment whichwould be used in the final detailed design. A final evaluation should then bemade, with the objective being to determine the validity of the prior designcriteria, assumptions and conclusions which were made. A final cost analysisshould be performed on the lowest cost alternatives from Stage 2, using thesame approach to the cost evaluation that was taken in Stage 2. Generally, thelowest cost alternative will be selected, assuming all other factors arecomparable.
The most probable factors which may have changed based on results of fieldand/or laboratory testing are:
Cake solids concentrationSolids capture during dewateringConditioning requirementsEquipment throughput per unit of timeEquipment cost based on manufacturer's quotationsOperator acceptance and ease of equipment maintenanceMaintenance cost and energy consumptionReliability of equipmentAbility to handle variations in sludge quantity and quality
6.6.1 Cake Solids Concentration
Cake solids concentration will affect the cost of subsequent transportationand disposal. If cake solids are lower than original projections, transporta-tion and disposal costs will increase, and in some instances, the method ofultimate disposal may become unsuitable. Situations where this may occurinvolve either incineration or composting of the dewatered cake, or landfilloperations which require a minimum solids concentration for disposal. Arelated factor which may have changed from original assumptions for a filterpress is the ease of cake release. To achieve an adequate cake release mayrequire considerably more or less chemicals than originally planned.
105
6.6.2 Solids Capture During Dewatering
If solids capture is lower than originally expected, this will place a highersolids load on the liquid handling portion of the treatment plant. Thisincreased solids recycle could adversely affect plant performance and resultin poorer effluent quality. Low solids capture during laboratory or fieldtesting may indicate the need for reevaluation of the selected dewateringprocess.
6.6.3 Conditioning Requirements
Conditioning chemical dosages are highly dependent on the character of thesludge being dewatered, as discussed in Chapter 5. In the init ial cost evalua-tion, chemical dosages must be based upon "typical" dosages for similarsludges. After laboratory and/or field testing, more definitive informationwill be available on dosages, and this more accurate data should be used inthe final cost evaluation.
6.6.4 Equipment Throughput Per Unit Time
A variation in throughput from the ini t ial assumptions will affect the numberof pieces of equipment required and therefore the capital cost, and perhaps,the O&M costs of the dewatering process. A large variation could change theconclusion of the cost evaluation, and this should be checked during thisphase of the project.
6.6.5 Equipment Cost Based on Manufacturer's Quotations
At this point in the selection process, many contacts will have been made withmanufacturers, and equipment from several manufacturers may have been tested.Based upon refined design cri teria, equipment manufacturer's will be able tofurnish more accurate equipment costs than the budget level estimates used inStage 2 - Ini t ial Cost Evaluation.
6.6.6 Operator Acceptance and Ease of Equipment Maintenance
The acceptance by plant operators of new equipment plays a large role in howefficiently the equipment operates and how well i t is maintained. Generally,a piece of equipment which is difficult to operate and maintain will probablynot operate at peak efficiency or be adequately maintained. In several of thestudies evaluated in Chapter 9, the final decision between two types of equip-ment with comparable costs was made on the basis of overall operability. The
106
operator's role is particularly important in selecting between belt fi l terpresses and centrifuges, which have comparable overall costs.
6.6.7 Maintenance Cost and Energy Consumption
Full-scale testing can be helpful in gathering additional data on maintenancerequirements and energy consumption. Variations from original estimates mayoccur in belt or filter media l i fe, frequency of replacement of minor parts,wash water requirements for a f i l ter press or a belt filter press, and overallenergy consumption per unit weight of dry solids.
6.6.8 Reliability of Equipment
If equipment is prone to frequent breakdowns, maintenance costs will increaseand throughput will decrease. Effort should be directed to selection of themost reliable equipment available when all other factors are comparable.Should equipment be selected that is prone to frequent breakdowns, the normaltendency is for plant operators to dislike both operating and maintaining theequipment. The end result is that the equipment operates at low efficiency,is poorly maintained, and will probably need replacement well before i tsanticipated useful l ife.
6.6.9 Ability to Handle Variations in Sludge Quantity and Quality
Variations in sludge quality occur frequently, and without appropriate changesin conditioning chemical dosages, the conditioned sludge will be difficult todewater. Belt fi l ter presses are particularly susceptible to having largechanges in solids recovery due to changes in sludge quality or flow. Centri-fuges and vacuum filters can handle variations in sludge feed fairly well,although cake solids and solids recovery may be reduced somewhat. Properconditioning is important to all dewatering processes, however, and it is anecessary part of a process to be able to quickly and easily change chemicaldosages in response to changes in sludge characteristics or flow.
6.7 References
1. Haug, R. T., "Compost Engineering - Principles and Practice," Ann ArborScience Publishers, Inc., Ann Arbor, Michigan, 1980.
2. Wesner, G. M., "Sewage Sludge Composting," Sludge Treatment and Disposal,Volume 2 - Sludge Disposal, USEPA - Center for Environmental ResearchInformation, Cincinnati, Ohio, 45268, EPA-625/4-78-012, October 1978.
107
3. "Process Design Manual For Sludge Treatment and Disposal," USEPA - Centerfor Environmental Research Information, Cincinnati, Ohio, 45268,EPA-625/1-79/011, September 1979.
4. Culp, G. L., "Handbook of Sludge Handling Processes - Cost andPerformance," Garland STPM Press, New York, 1979.
5. "Innovative and Alternative Technology Assessment Manual," USEPA - Officeof Water Program Operations, Washington, D.C., 20460, MCD-53,EPA-430/9-78-009, February 1980.
6. Culp, Gordon L. and Hinrichs, Daniel J., "Municipal Wastewater SludgeManagement Alternatives," prepared for the EPA Technology TransferNational Conference on 208 Planning and Implementation, 1977. (Authorsare with Culp/Wesner/Culp, Cameron Park, California)
7. Benjes, H. H., Jr., Faisst, J. A., and Lineck, T. S., "Capital and O&MCost Estimates for Biological Wastewater Treatment Processes, "EPAContract No. 68-03-2556, August 1979. (Lead author is withCulp/Wesner/Culp, Denver, Colorado)
8. "Cost and Performance Handbook - Sludge Handling Processes,"Culp/Wesner/Culp, Wastewater Treatment and Reuse Seminar, South LakeTahoe, California, October, 1977. (Culp/Wesner/Culp, Cameron Park,California)
9. Ettlich, W. E., "Transport of Sewage Sludge," USEPA - Center forEnvironmental Research Information, Cincinnati, Ohio, 45268,EPA-600/2-77-216, December 1977.
10. Culp, G. L., et al., "Costs of Chemical Clarification of Wastewater,"U.S. EPA Task Order Contract 68-03-2186, 1976. (Lead author is withCulp/Wesner/Culp, Cameron Park, California)
11. Ewing, L. J., Jr., Almgren, H. H., and Culp, R. L., "Effects of ThermalTreatment of Sludge on Municipal Wastewater Treatment Costs," USEPA,Center for Environmental Research Information, Cincinnati, Ohio, 45268,EPA-600/2-78-073, 1973.
12. "Sludge Dewatering," Manual of Practice No. 20, Water Pollution ControlFederation, Washington, D. C., 1969.
13. Vesilind, P. A., "Treatment and Disposal of Wastewater Sludges," RevisedEdition, Ann Arbor Science Publishers, Ann Arbor, 1980.
14. Rich, Linvil G., "Unit Operations of Sanitary Engineering," John Wileyand Sons, Inc., New York, 1961.
15. Coakley, P. & Jones, B. R. S., "Vacuum Sludge Filtration, I.Interpretation of Results by the Concept of Specific Resistance, Sewage &Industrial Wastes, Vol. 28, p. 963, 1956.
108
16. Baskerville, R.C., and Gale, R.S., "A Simple Automatic Instrument forDetermining the Filterability of Sewage Sludges", Water Pollution Control(Br), Vol. 67, p.233, 1968.
17. Gale, R.S., and Baskerville, R.C., "Capillary Suction Method forDetermination of the Filtration Properties of a Solid/Liquid Suspension,"Chemistry and Industry, 1967.
18. Pietila, Kenneth A. and Joubert, Paul J., "Examination of ProcessParameters Affecting Sludge Dewatering with a Diaphragm Filter Press,"Journal Water Pollution Control Federation, Vol. 53, p. 1708, 1981.
19. Personal communication, Ken Pietila, Rexnord, Inc., Milwaukee, Wisconsin,February 1982.
20. Halde, Rolf E., "Filterbelt Pressing of Sludge - A LaboratorySimulation," Journal Water Pollution Control Federation, Vol. 52, p. 310,February 1980.
21. Baskerville, R.C., et al. , "Laboratory Techniques for Predicting andEvaluating the Performance of a Filterbelt Press," Filtration andSeparation, Vol. 15, p. 445, 1978.
22. "Mechanical Dewatering Study - Los Angeles County Sanitation Districts,"LA/OMA Project, Regional Wastewater Solids Management Program, LosAngeles-Orange County Metropolitan Area, September 1980.
23. Trubiano, R., Bachtel, D., LeBrun, T., and Horvath, R., "ParallelEvaluation of Low Speed Scroll Centrigues and Belt Filter Presses forDewatering Municipal Sewage Sludge," Draft EPA Report, Contract68-03-2745, 1981. (Authors are with County Sanitation Districts of LosAngeles County, Whittier, California)
109
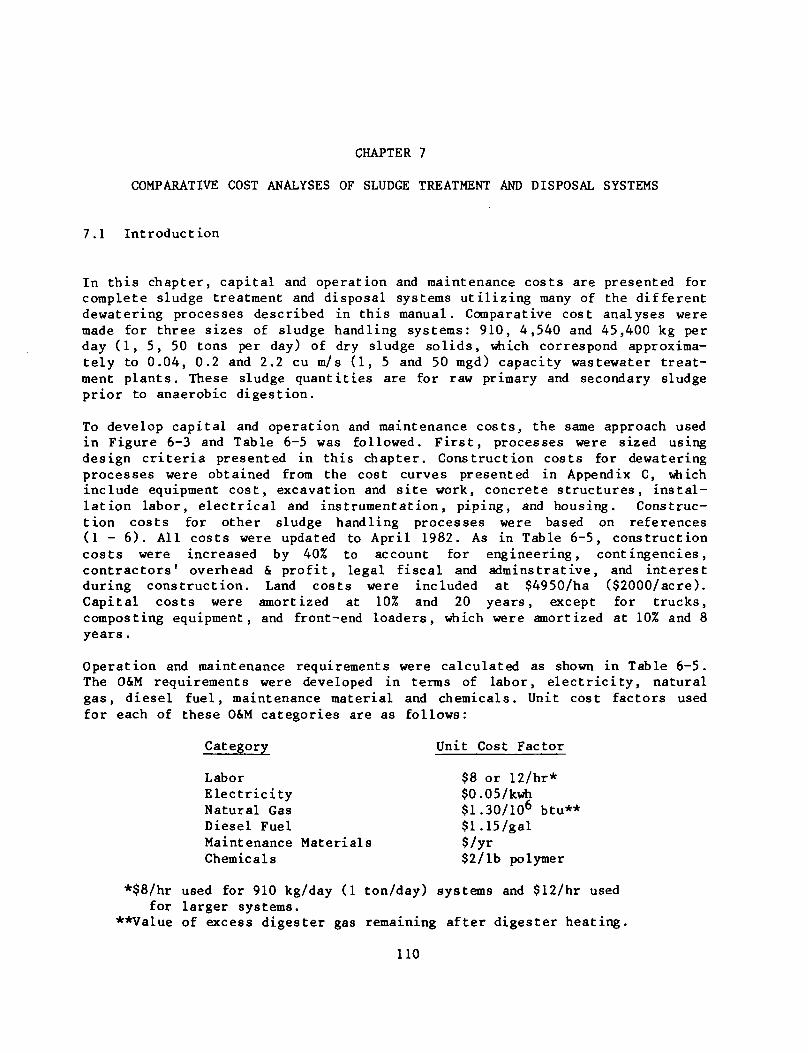
CHAPTER 7
COMPARATIVE COST ANALYSES OF SLUDGE TREATMENT AND DISPOSAL SYSTEMS
7.1 Introduction
In this chapter, capital and operation and maintenance costs are presented forcomplete sludge treatment and disposal systems utilizing many of the differentdewatering processes described in this manual. Comparative cost analyses weremade for three sizes of sludge handling systems: 910, 4,540 and 45,400 kg perday (1, 5, 50 tons per day) of dry sludge solids, which correspond approxima-tely to 0.04, 0.2 and 2.2 cu m/s (1, 5 and 50 mgd) capacity wastewater treat-ment plants. These sludge quantities are for raw primary and secondary sludgeprior to anaerobic digestion.
To develop capital and operation and maintenance costs, the same approach usedin Figure 6-3 and Table 6-5 was followed. First, processes were sized usingdesign criteria presented in this chapter. Construction costs for dewateringprocesses were obtained from the cost curves presented in Appendix C, whichinclude equipment cost, excavation and site work, concrete structures, instal-lation labor, electrical and instrumentation, piping, and housing. Construc-tion costs for other sludge handling processes were based on references(1 - 6). All costs were updated to April 1982. As in Table 6-5, constructioncosts were increased by 40% to account for engineering, contingencies,contractors' overhead & profit, legal fiscal and adminstrat ive, and interestduring construction. Land costs were included at $4950/ha ($2000/acre).Capital costs were amortized at 10% and 20 years, except for trucks,composting equipment, and front-end loaders, which were amortized at 10% and 8years.
Operation and maintenance requirements were calculated as shown in Table 6-5.The O&M requirements were developed in terms of labor, electricity, naturalgas, diesel fuel, maintenance material and chemicals. Unit cost factors usedfor each of these O&M categories are as follows:
Category Unit Cost Factor
Labor $8 or 12/hr*Electricity $0.05/kwhNatural Gas $1.30/106 btu**Diesel Fuel $1.15/galMaintenance Materials $/yrChemicals $2/lb polymer
*$8/hr used for 910 kg/day (1 ton/day) systems and $12/hr usedfor larger systems.
**Value of excess digester gas remaining after digester heating.
110
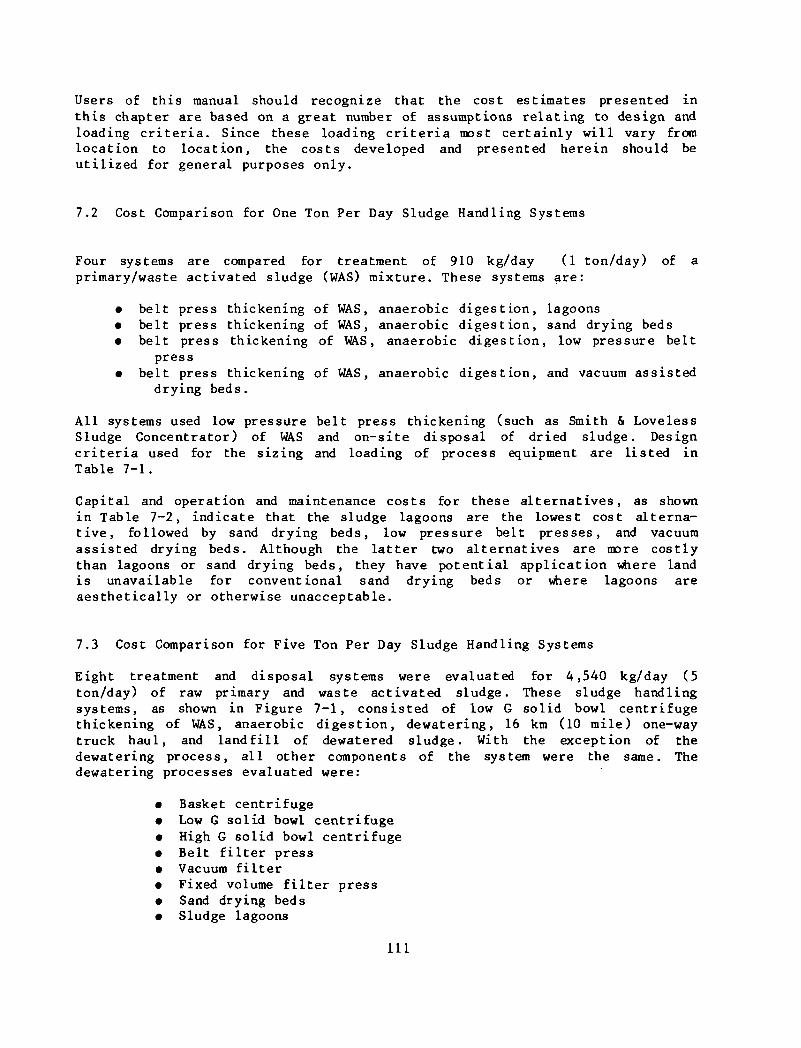
Users of this manual should recognize that the cost estimates presented inthis chapter are based on a great number of assumptions relating to design andloading criteria. Since these loading criteria most certainly will vary fromlocation to location, the costs developed and presented herein should beutilized for general purposes only.
7.2 Cost Comparison for One Ton Per Day Sludge Handling Systems
Four systems are compared for treatment of 910 kg/day (1 ton/day) of aprimary/waste activated sludge (WAS) mixture. These systems are:
• belt press thickening of WAS, anaerobic digestion, lagoons• belt press thickening of WAS, anaerobic digestion, sand drying beds• belt press thickening of WAS, anaerobic digestion, low pressure belt
press• belt press thickening of WAS, anaerobic digestion, and vacuum assisted
drying beds.
All systems used low pressure belt press thickening (such as Smith & LovelessSludge Concentrator) of WAS and on-site disposal of dried sludge. Designcri teria used for the sizing and loading of process equipment are listed inTable 7-1.
Capital and operation and maintenance costs for these alternatives, as shownin Table 7-2, indicate that the sludge lagoons are the lowest cost alterna-tive, followed by sand drying beds, low pressure belt presses, and vacuumassisted drying beds. Although the latter two alternatives are more costlythan lagoons or sand drying beds, they have potential application where landis unavailable for conventional sand drying beds or where lagoons areaesthetically or otherwise unacceptable.
7.3 Cost Comparison for Five Ton Per Day Sludge Handling Systems
Eight treatment and disposal systems were evaluated for 4,540 kg/day (5ton/day) of raw primary and waste activated sludge. These sludge handlingsystems, as shown in Figure 7-1, consisted of low G solid bowl centrifugethickening of WAS, anaerobic digestion, dewatering, 16 km (10 mile) one-waytruck haul, and landfill of dewatered sludge. With the exception of thedewatering process, all other components of the system were the same. Thedewatering processes evaluated were:
Basket centrifugeLow G solid bowl centrifugeHigh G solid bowl centrifugeBelt f i l ter pressVacuum fi l terFixed volume fi l ter pressSand drying bedsSludge lagoons
111
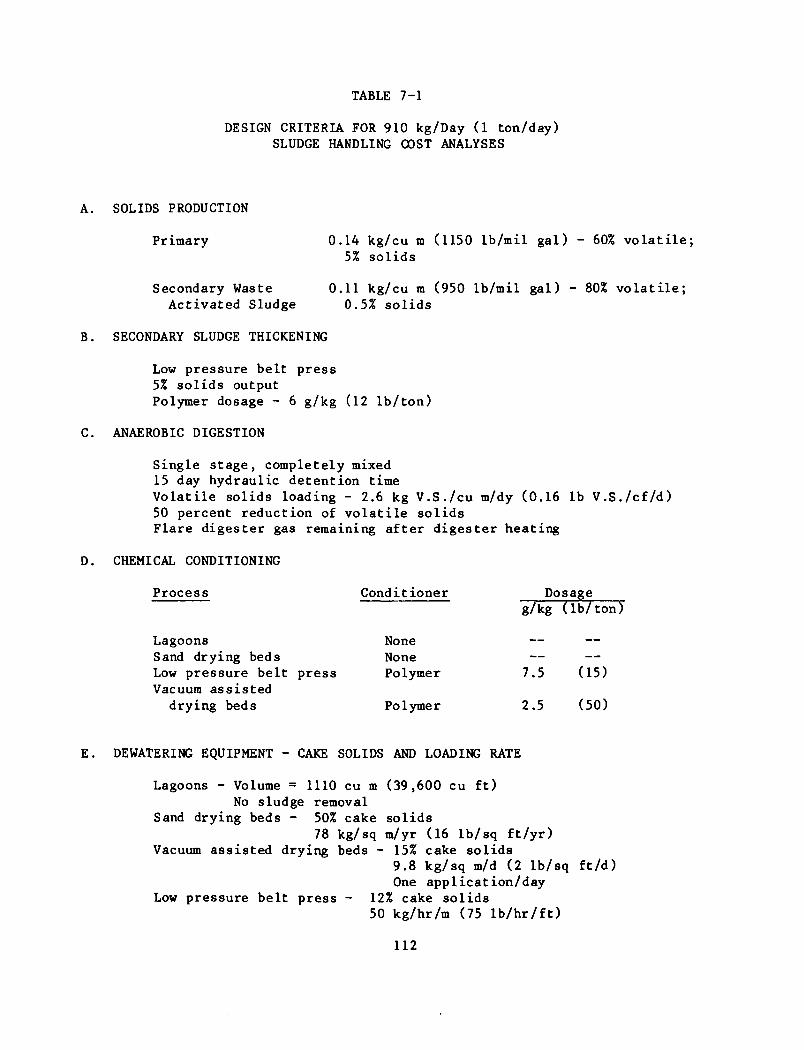
TABLE 7-1
DESIGN CRITERIA FOR 910 kg/Day (1 ton/day)SLUDGE HANDLING COST ANALYSES
A. SOLIDS PRODUCTION
Primary 0.14 kg/cu m (1150 lb/mil gal) - 60% volatile;5% solids
Secondary Waste 0.11 kg/cu m (950 lb/mil gal) - 80% volatile;Activated Sludge 0.5% solids
B. SECONDARY SLUDGE THICKENING
Low pressure belt press5% solids outputPolymer dosage - 6 g/kg (12 lb/ton)
C. ANAEROBIC DIGESTION
Single stage, completely mixed15 day hydraulic detention timeVolatile solids loading - 2.6 kg V.S./cu m/dy (0.16 lb V.S./cf/d)50 percent reduction of volatile solidsFlare digester gas remaining after digester heating
D. CHEMICAL CONDITIONING
Process
LagoonsSand drying bedsLow pressure belt pressVacuum assisted
drying beds
Conditioner
NoneNonePolymer
Polymer
Dosageg/kg (lb/ton)
— —
—7.5 (15)
2.5 (50)
E. DEWATERING EQUIPMENT - CAKE SOLIDS AND LOADING RATE
Lagoons - Volume = 1110 cu m (39,600 cu ft)No sludge removal
Sand drying beds - 50% cake solids78 kg/sq m/yr (16 lb/sq ft/yr)
Vacuum assisted drying beds - 15% cake solids9.8 kg/sq m/d (2 lb/sq ft/d)One application/day
Low pressure belt press - 12% cake solids50 kg/hr/m (75 lb/hr/ft)
112
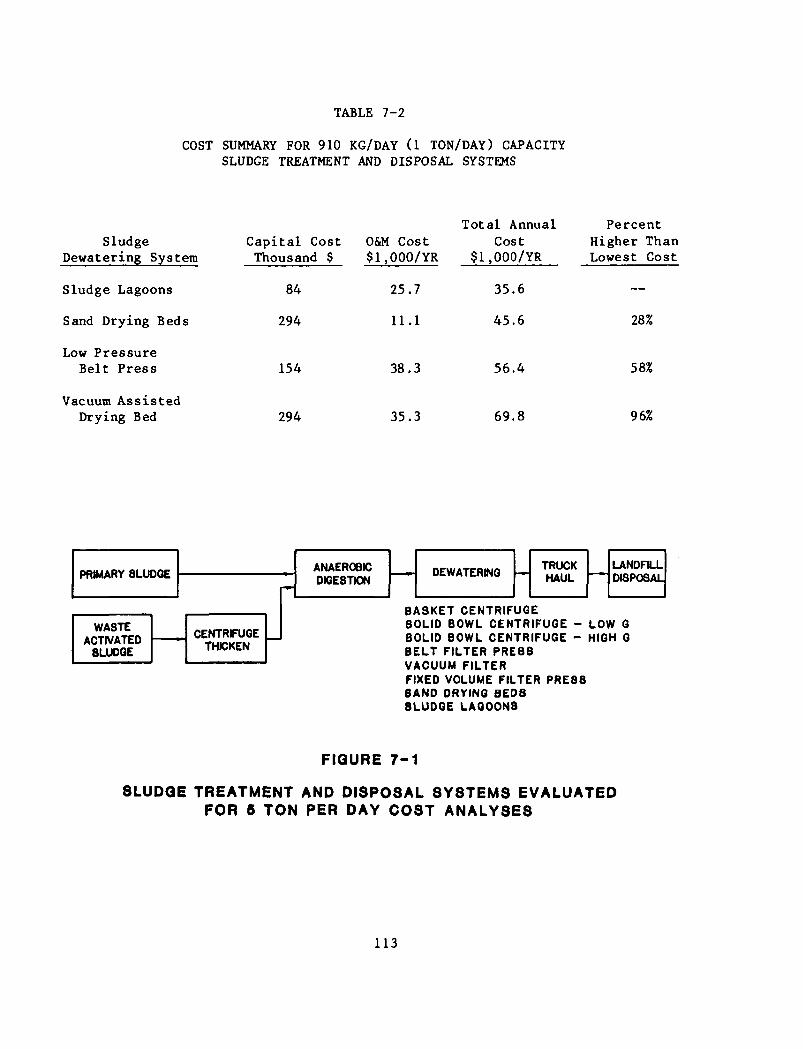
TABLE 7 - 2
COST SUMMARY FOR 910 KG/DAY (1 TON/DAY) CAPACITY
SLUDGE TREATMENT AND DISPOSAL SYSTEMS
Sludge
Dewatering System
Sludge Lagoons
Sand Drying Beds
Low Pressure
Belt Press
Vacuum Assisted
Drying Bed
Capital Cost
Thousand $
84
294
154
294
O&M Cost
$l,000/YR
25.7
11.1
38.3
35.3
Total Annual
Cost
$1,000/YR
35.6
45.6
56.4
69.8
Percent
Higher Than
Lowest Cost
—
28%
58%
96%
PRIMARY 8LUOOE
WASTEACTIVATED
8LUD0E
CENTRFUGETHICKEN
ANAEROBICDK3E8TKDN
DEWATERINGTRUCKHAUL
LANDFILLDISPOSAL!
8ASKET CENTRIFUGE8OLID BOWL CENTRIFUGE - LOW G8OLID BOWL CENTRIFUGE - HIGH GBELT FILTER PRE88VACUUM FILTERFIXED VOLUME FILTER PRE888AND DRYING BED8SLUDGE LAGOON8
FIGURE 7-1
8LUDQE TREATMENT AND DISPOSAL SYSTEMS EVALUATEDFOR 6 TON PER DAY COST ANALYSES
113
These dewatering techniques were selected on the basis of their applicabilityto systems of this general size. A flow diagram for the systems evaluated isshown in Figure 7-1 and design criteria used in the cost analyses are shown inTable 7-3.
Capital costs, operation and maintenance costs, and total annual costs arepresented in Table 7-4. As shown in this table, the sludge treatment systemusing centrifuge thickening of WAS, anaerobic digestion of primary and WAS,dewatering by sludge lagoons and then a 16 km (10 mile) one-way truck haul tolandfill disposal has the lowest total annual cost. The next lowest costdewatering alternatives are high G solid bowl centrifuges, followed in orderof increasing total annual cost by low G solid bowl centrifuges, belt filterpresses, sand drying beds, basket centrifuges, and vacuum filters. The fixedvolume filter press has the highest total annual cost (59 percent higher thansludge lagoons).
7.4 Cost Comparison For Fifty Ton Per Day Sludge Handling Systems
Nine treatment and disposal systems were evaluated for 45,400 kg/day (50tons/day) of raw sludge. These systems were:
• Centrifuge thicken WAS, anaerobic digestion, low G solid bowlcentrifuge, truck haul, landfill
• Centrifuge thicken WAS, anaerobic digestion, high G solid bowlcentrifuge, truck haul, landfill
• Centrifuge thicken WAS, anaerobic digestion, belt filter press, truckhaul, landfill
• Centrifuge thicken WAS, anaerobic digestion, vacuum filter, truckhaul, landfill
• Centrifuge thicken WAS, anaerobic digestion, fixed volume filterpress, truck haul, landfill
• Centrifuge thicken WAS, anaerobic digestion, diaphragm filter press,truck haul, landfill
• Centrifuge thicken WAS, fixed volume filter press, multiple hearthincineration, truck haul, landfill
• Centrifuge thicken WAS, heat treatment, vacuum filter, incinerate,truck haul, landfill
• Heat treatment, vacuum filter, incinerate, truck haul, landfill
For the first six of these systems, one-way haul distances of 16 km (10 miles)and 64 km (40 miles) were also evaluated, to determine the sensitivity of
114
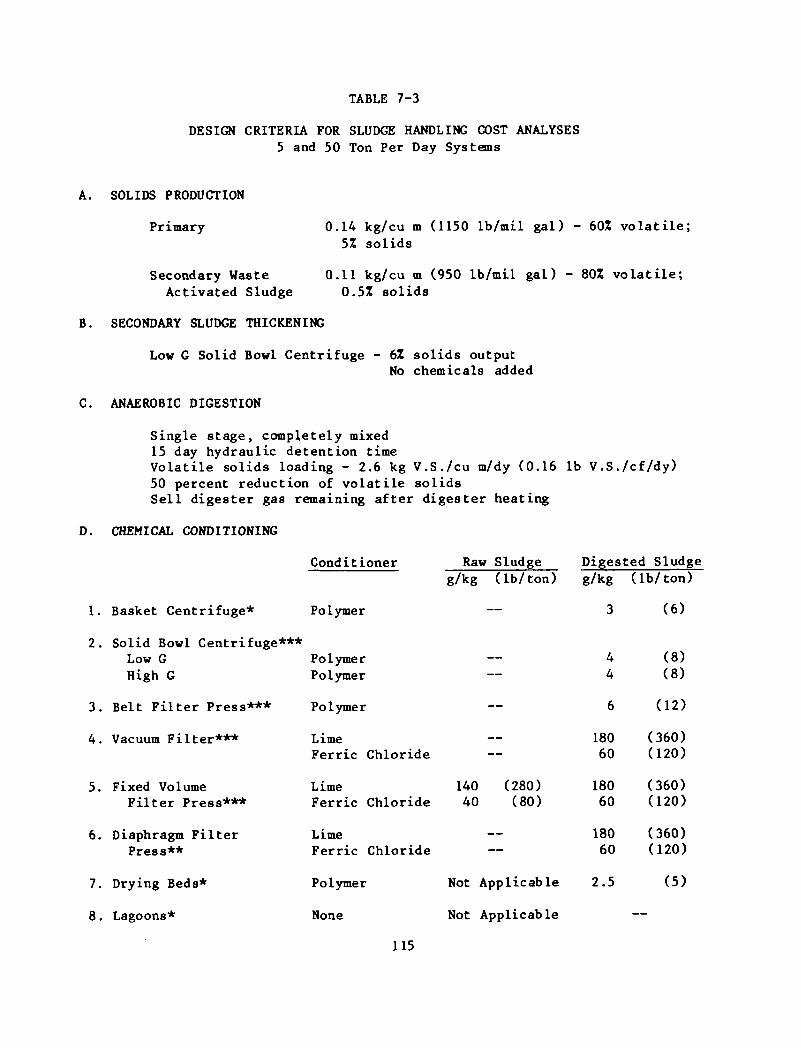
TABLE 7-3
DESIGN CRITERIA FOR SLUDGE HANDLING COST ANALYSES5 and 50 Ton Per Day Systems
A. SOLIDS PRODUCTION
Primary 0.14 kg/cu m (1150 lb/mil gal) - 601 volatile;5% solids
Secondary Waste 0.11 kg/cu m (950 lb/mil gal) - 80Z volatile;Activated Sludge 0.5Z solids
B. SECONDARY SLUDGE THICKENING
Low G S o l i d Bowl C e n t r i f u g e - 6Z s o l i d s output
No chemica l s added
C. ANAEROBIC DIGESTION
Single stage, completely mixed
15 day hydraulic detention timeVolatile solids loading - 2.6 kg V.S./cu m/dy (0.16 lb V.S./cf/dy)50 percent reduction of volatile solidsSell digester gas remaining after digester heating
D. CHEMICAL CONDITIONING
Conditioner Raw Sludge Digested Sludgeg/kg (lb/ton) g/kg (lb/ton)
1. Basket Centrifuge* Polymer — 3 (6)
2. Solid Bowl Centrifuge***Low GHigh G
3. Belt Filter Press***
4. Vacuum Filter***
5. Fixed VolumeFilter Press***
6. Diaphragm FilterPress**
7. Drying Beds*
8. Lagoons*
PolymerPolymer
Polymer
LimeFerric Chloride
LimeFerric Chloride
LimeFerric Chloride
Polymer
None
—
—
—
140 (280)40 (80)
—
Not Applicable
Not Applicable
44
6
18060
18060
18060
2.5
(8)(8)
(12)
(360)(120)
(360)(120)
(360)(120)
(5)
—
115
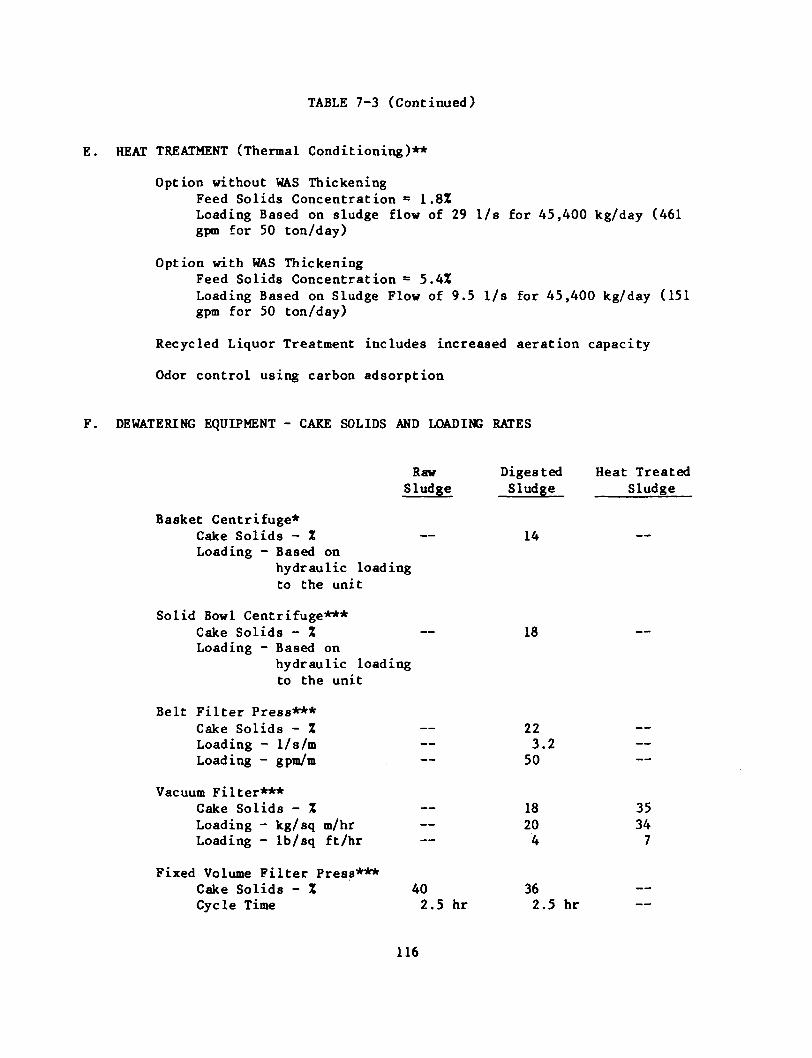
TABLE 7-3 (Continued)
E. HEAT TREATMENT (Thermal Conditioning)**
Option without WAS ThickeningFeed Solids Concentration = 1.8%Loading Based on sludge flow of 29 1/s for 45,400 kg/day (461gpm for 50 ton/day)
Option with WAS ThickeningFeed Solids Concentration = 5.4%Loading Based on Sludge Flow of 9.5 1/s for 45,400 kg/day (151
gpm for 50 ton/day)
Recycled Liquor Treatment includes increased aeration capacity
Odor control using carbon adsorption
F. DEWATERING EQUIPMENT - CAKE SOLIDS AND LOADING RATES
RawSludge
Basket Centrifuge*Cake Solids - %Loading - Based on
hydraulic loadingto the unit
Solid Bowl Centrifuge***Cake Solids - %Loading - Based on
hydraulic loadingto the unit
Belt Filter Press***Cake Solids - %Loading - 1/s/mLoading - gpm/m —
Vacuum Filter***Cake Solids - %Loading - kg/sq m/hrLoading - lb/sq ft/hr
Fixed Volume Filter Press***Cake Solids - Z 40Cvcle Time 2.5 hr
Digested Heat TreatedSludge Sludge
14
18
223.250
18 3520 34
4 7
362.5 hr
116
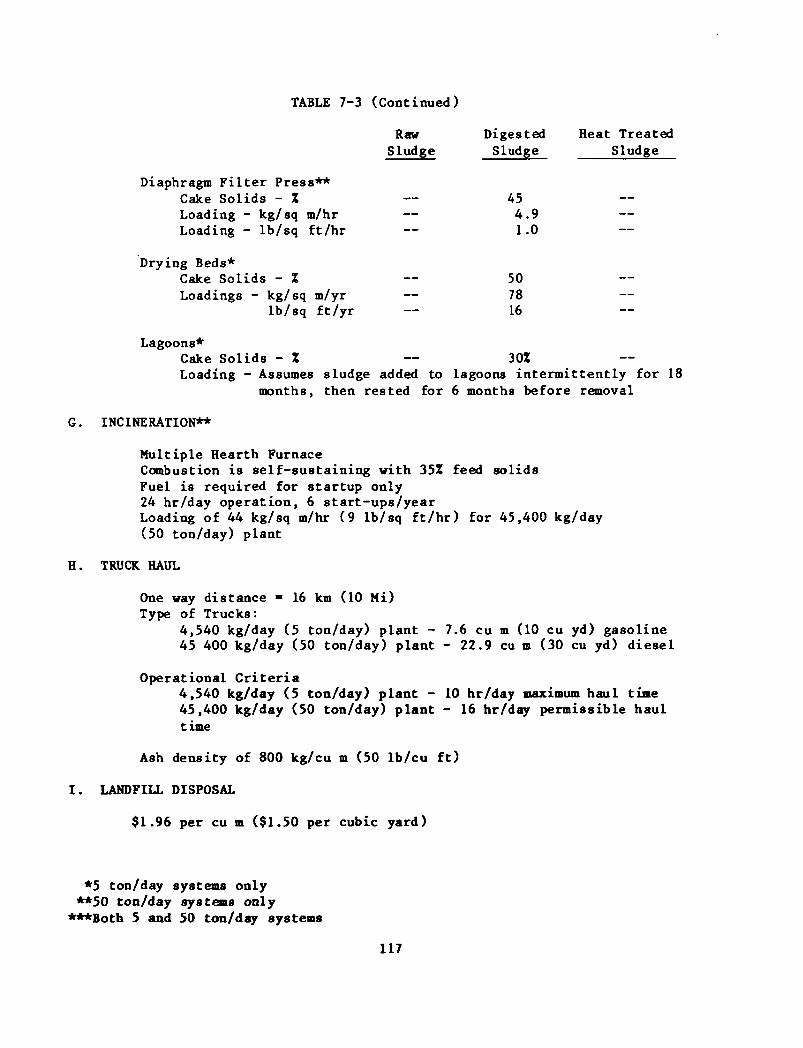
TABLE 7-3 (Continued)
RawSludge
———
—__
DigestedSludge
454.91.0
507816
Heat TreatedSludge
—
— —
—
Diaphragm Filter Press**Cake Solids - ZLoading - kg/sq m/hrLoading - lb/sq ft/hr
Drying Beds*Cake Solids - ZLoadings - kg/sq m/yr
lb/sq ft/yr
Lagoons*Cake Solids - Z — 30ZLoading - Assumes sludge added to lagoons intermittently for 18
months, then rested for 6 months before removal
G. INCINERATION**
Multiple Hearth FurnaceCombustion is self-sustaining with 35Z feed solidsFuel is required for startup only24 hr/day operation, 6 start-ups/yearLoading of 44 kg/sq m/hr (9 lb/sq ft/hr) for 45,400 kg/day(50 ton/day) plant
H. TRUCK HAUL
One way distance = 16 km (10 Mi)Type of Trucks:
4,540 kg/day (5 ton/day) plant - 7.6 cu m (10 cu yd) gasoline45 400 kg/day (50 ton/day) plant - 22,9 cu m (30 cu yd) diesel
Operational Criteria4,540 kg/day (5 ton/day) plant - 10 hr/day maximum haul time45,400 kg/day (50 ton/day) plant - 16 hr/day permissible haultime
Ash density of 800 kg/cu m (50 lb/cu ft)
I . LANDFILL DISPOSAL
$1.96 per cu m ($1.50 per cubic yard)
*5 ton/day systems only**50 ton/day systems only
***Both 5 and 50 ton/day systems
117
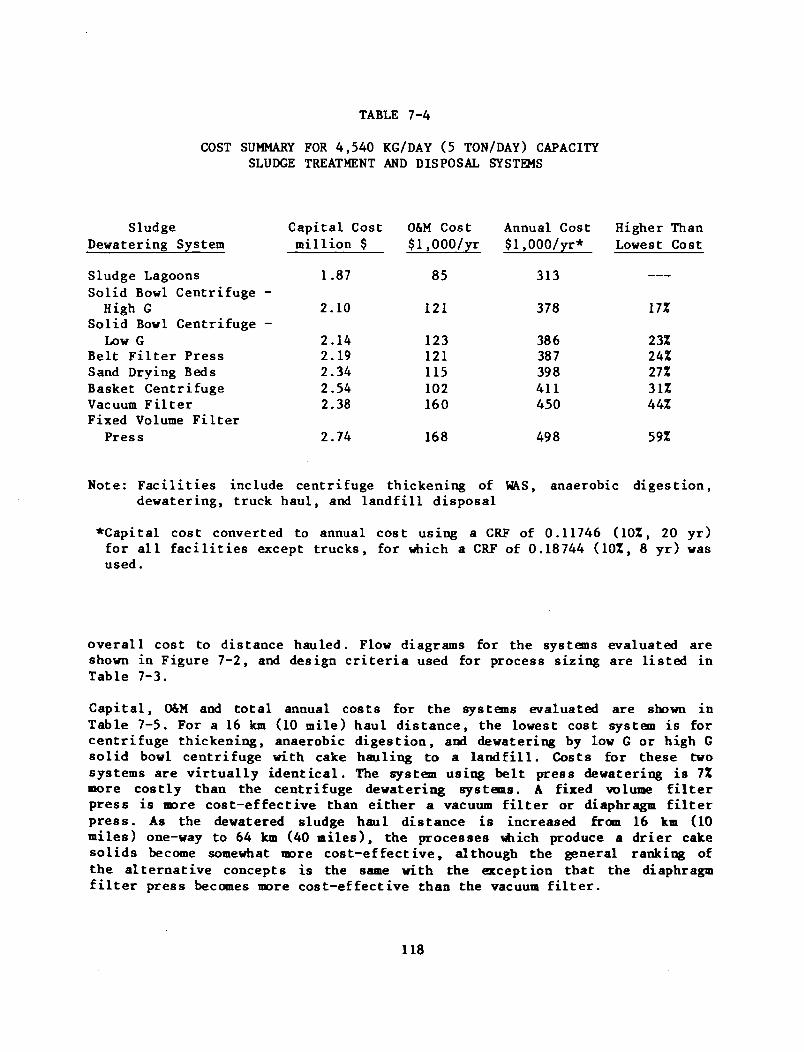
TABLE 7-4
COST SUMMARY FOR 4,540 KG/DAY (5 TON/DAY) CAPACITYSLUDGE TREATMENT AND DISPOSAL SYSTEMS
Sludge Capital Cost O&M Cost Annual Cost Higher ThanDewatering System million $ $l,000/yr $l>000/yr* Lowest Cost
Sludge Lagoons 1.87 85 313Solid Bowl Centrifuge -High G 2.10 121 378 17%
Solid Bowl Centrifuge -Low G
Belt Fi l ter PressSand Drying BedsBasket CentrifugeVacuum Fi l terFixed Volume Filter
Press 2.74 168 498 59%
Note: Fac i l i t i e s include centrifuge thickening of VkS, anaerobic digestion,dewatering, truck haul, and landfil l disposal
•Capital cost converted to annual cost using a CRF of 0.11746 (10%, 20 yr)for a l l f a c i l i t i e s except trucks, for which a CRF of 0.18744 (10%, 8 yr) wasused.
2.142.192.342.542.38
123121115102160
386387398411450
23%24%27%31%44%
overall cost to distance hauled. Flow diagrams for the systems evaluated areshown in Figure 7-2, and design cr i ter ia used for process sizing are l isted inTable 7-3.
Capital, O&M and total annual costs for the systems evaluated are shown inTable 7-5. For a 16 km (10 mile) haul distance, the lowest cost system is forcentrifuge thickening, anaerobic digestion, and dewatering by low G or high Gsol id bowl centrifuge with cake hauling to a landf i l l . Costs for these twosystems are virtual ly identical . The system using belt press dewatering is 7%more costly than the centrifuge dewatering systems. A fixed volume f i l t e rpress is more cost-effect ive than either a vacuum f i l t e r or diaphragm f i l t erpress. As the dewatered sludge haul distance is increased from 16 km (10miles) one-way to 64 km (40 mi les ) , the processes which produce a drier cakesol ids become somewhat more cost -e f fect ive , although the general ranking ofthe alternative concepts is the same with the exception that the diaphragmf i l t e r press becomes more cost-effect ive than the vacuum f i l t e r .
118
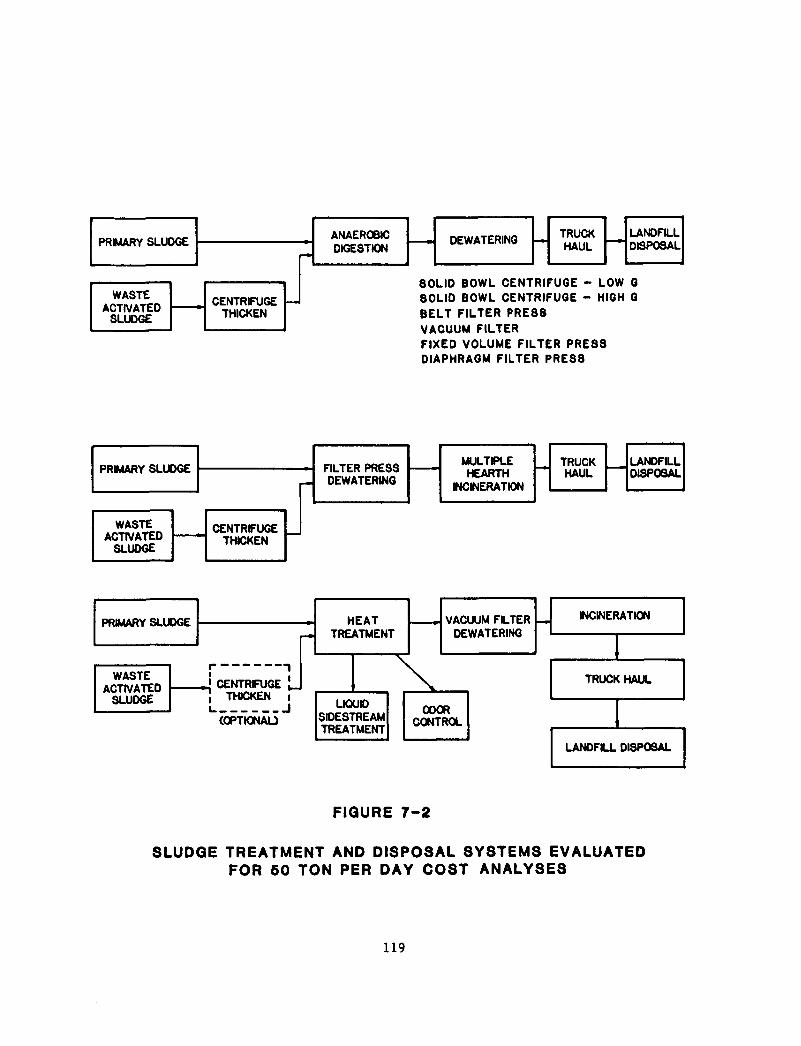
PRMARY SLUDGE
WASTEACTIVATED
SLUDGE
CENTRIFUGETHICKEN
ANAEROBICDIGESTION
DEWATERINGTRUCKHAUL
LANDFILLDISPOSAL
8OLID BOWL CENTRIFUGE - LOW G80LID BOWL CENTRIFUGE - HIGH GBELT FILTER PRE88
VACUUM FILTERFIXED VOLUME FILTER PRES3DIAPHRAGM FILTER PRE88
PRMARY SLUDGE
WASTEACTIVATED
SLUDGE
CENTRIFUGETHICKEN
FILTER PRESSDEWATERING
MULTIPLEHEARTH
NCINERATION
LANDFILLDISPOSAL
PRIMARY SLUDGE
WASTEACTIVATED
SLUDGE
r ~j' CENTRFUGE |_I THICKEN ii_ J
(OPTIONAL)
HEATTREATMENT
VACDE
JUM FILTERWATERING
\
LIQUK)SIOESTREAMTREATMENT
ODORCONTROL
INCINERATION
TRUCK HAUL
LANDFKJ. DISPOSAL
FIGURE 7-2
SLUDGE TREATMENT AND DISPOSAL SYSTEMS EVALUATEDFOR 50 TON PER DAY COST ANALYSES
119
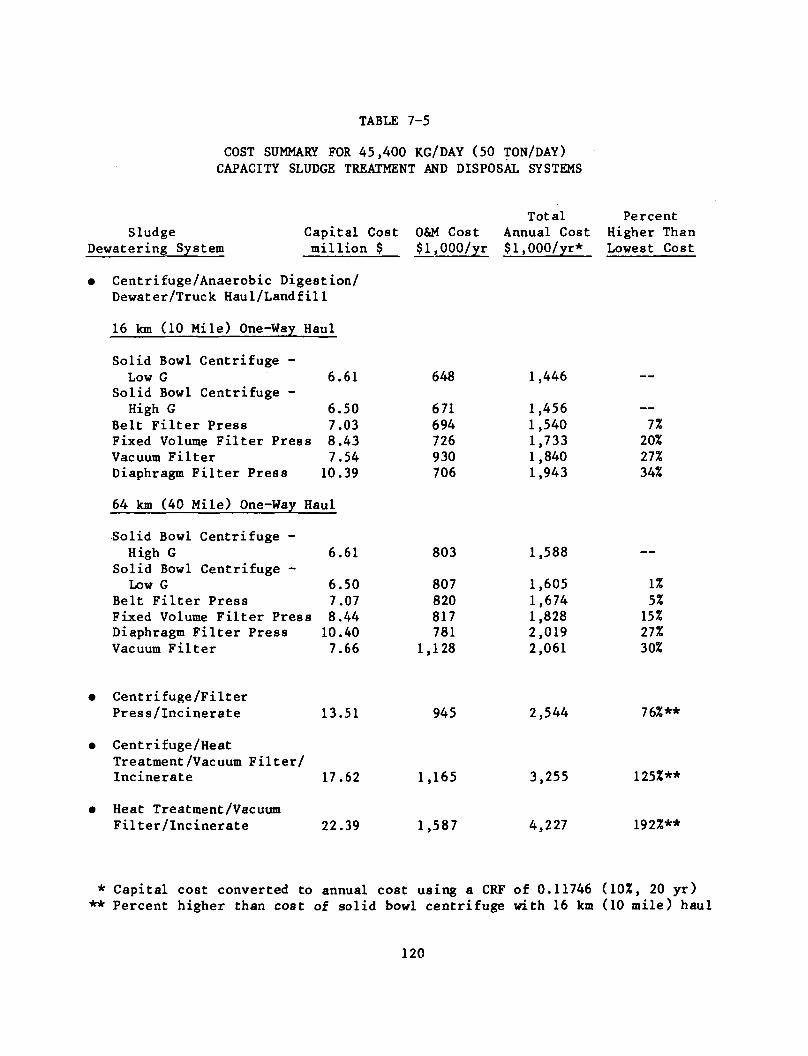
TABLE 7 - 5
COST SUMMARY FOR 4 5 , 4 0 0 KG/DAY ( 5 0 TON/DAY)CAPACITY SLUDGE TREATMENT AND DISPOSAL SYSTEMS
SludgeDewatering System
Capital Costmillion $
O&M Cost$l,000/yr
TotalAnnual Cost$l,000/yr*
PercentHigher ThanLowest Cost
• Centrifuge/Anaerobic Digestion/Dewater/Truck Haul/Landfill
16 km (10 Mile) One-Way Haul
Solid Bowl Centrifuge -Low G
Solid Bowl Centrifuge -6.61 648 1,446
High GBelt Filter PressFixed Volume Filter PressVacuum FilterDiaphragm Filter Press
6.507.038.437.5410.39
64 km (40 Mile) One-Way Haul
Solid Bowl Centrifuge -High G
Solid Bowl Centrifuge -Low G
Belt Filter PressFixed Volume Filter PressDiaphragm Filter PressVacuum Filter
6.61
6.507.078.4410.407.66
671694726930706
803
807820817781
1,128
1,4561,5401,7331,8401,943
1,588
1,6051,6741,8282,0192,061
—7%20%27%34%
—
1%5%15%27%30%
• Centrifuge/FilterPress/Incinerate
Heat Treatment/VacuumFilter/Incinerate
13.51
• Centrifuge/HeatTreatment/Vacuum Filter/Incinerate 17.62
22.39
945
1,165
1,587
2,544
3,255
4,227
76%**
125%**
192%**
* Capital cost converted to annual cost using a CRF of 0.11746 (10%, 20 yr)** Percent higher than cost of so l id bowl centrifuge with 16 km (10 mi le ) haul
120
The cost estimates shown in Tables 7-2, 7-4, and 7-5 are only presented toi l lustrate the procedure of evaluating dewatering processes as a part of acomplete sludge treatment system. These cost estimates are based upon the costcurves presented in Appendix C, several other references (1 to 6), and uponthe specific design cri teria assumed in this analysis. The costs presented aregeneral in nature, and therefore, should only be used for general purposesuntil detailed, site-specific cost estimates can be prepared.
7.5 References
1. Culp, G. L., "Handbook of Sludge Handling Processes - Cost andPerformance," Garland STPM Press, New York, 1979.
2. Benjes, H. H., Jr., Faisst, J. A., and Lineck, T. S. , "Capital and O&MCost Estimates for Biological Wastewater Treatment Processes, "EPAContract No. 68-03-2556, August 1979. (Lead author is withCulp/Wesner/Culp, Denver, Colorado)
3. "Cost and Performance Handbook - Sludge Handling Processes,"Culp/Wesner/Culp, Wastewater Treatment and Reuse Seminar, South LakeTahoe, California, October 1977. (Culp/Wesner/Culp, Cameron Park,California)
4. Ettlich, W. E., "Transport of Sewage Sludge," USEPA - Center forEnvironmental Research Information, Cincinnati, Ohio, 45268,EPA-600/2-77-216, December 1977.
5. Culp, G. L., et al., "Costs of Chemical Clarification of Wastewater,"U.S. EPA Task Order Contract 68-03-2186, 1976. (Lead author is withCulp/Wesner/Culp, Cameron Park, California)
6. Ewing, L. J., Jr., Almgren, H. H., and Culp, R. L., "Effects of ThermalTreatment of Sludge on Municipal Wastewater Treatment Costs," USEPA -Center for Environmental Research Information, Cincinnati, Ohio, 45268,EPA-600/2-78-073, 1973.
121
CHAPTER 8
ENERGY CONSIDERATIONS IN DEWATERING PROCESS SELECTION
8.1 Introduct ion
Energy required for sludge dewatering i s important because energy c o s t s caninf luence o v e r a l l project cos t as we l l as process s e l e c t i o n . This chapterp r e s e n t s an a n a l y s i s of both "direc t" energy requirements, as wel l as the" i n d i r e c t " energy requirements a s soc ia ted with production of the condi t ion ingc h e m i c a l s . Considerat ion of both the d i r e c t and ind irec t energy requirementsi s important in conducting an energy s e n s i t i v i t y a n a l y s i s . Such an a n a l y s i sshould be conducted to determine the impact of energy cost e s c a l a t i o n s atrates greater than or less than the average inflation rate.
As is stressed in other portions of this manual, evaluation of the dewateringprocess can not be performed independently of other sludge treatment anddisposal processes. This is true from an energy standpoint also. In manyprocess flow concepts, dewatering energy requirements may be low, but theoverall energy requirement for solids treatment, transportation, and disposalmay be high. In other cases the converse is true.
8.2 Direct Energy Requirements for Dewatering
In order to compare direct energy requirements of the various dewateringoptions available, information was gathered from full scale equipment opera-ting at wastewater treatment plants across the country, from dewatering equip-ment manufacturers, and from the EPA report "Energy Conservation in MunicipalWastewater Treatment—MCD-32" (1). A summary of this information is presentedin Table 8-1. It is important to note that while all of the sludges shown inTable 8-1 are digested mixtures of primary and waste activated sludge (WAS),the percentage of difficult-to-dewater WAS in the mixture varies from 25 to 90percent. Generally, as the ratio of primary to secondary sludge decreases, theenergy required for dewatering increases.
Based upon the information in Table 8-1, ranges in electricity and fuelrequirements for sludge dewatering were developed and are presented inTable 8-2. The ranges in total energy requirements presented for each dewater-ing process further il lustrate the fact that sludges from different wastewatertreatment plants vary greatly in their dewaterability. This variabilityemphasizes the need for full-scale testing of equipment comparable to theactual equipment which would be installed in order to define the actualthroughput rates achievable. In addition to sludge quality, there are several
122
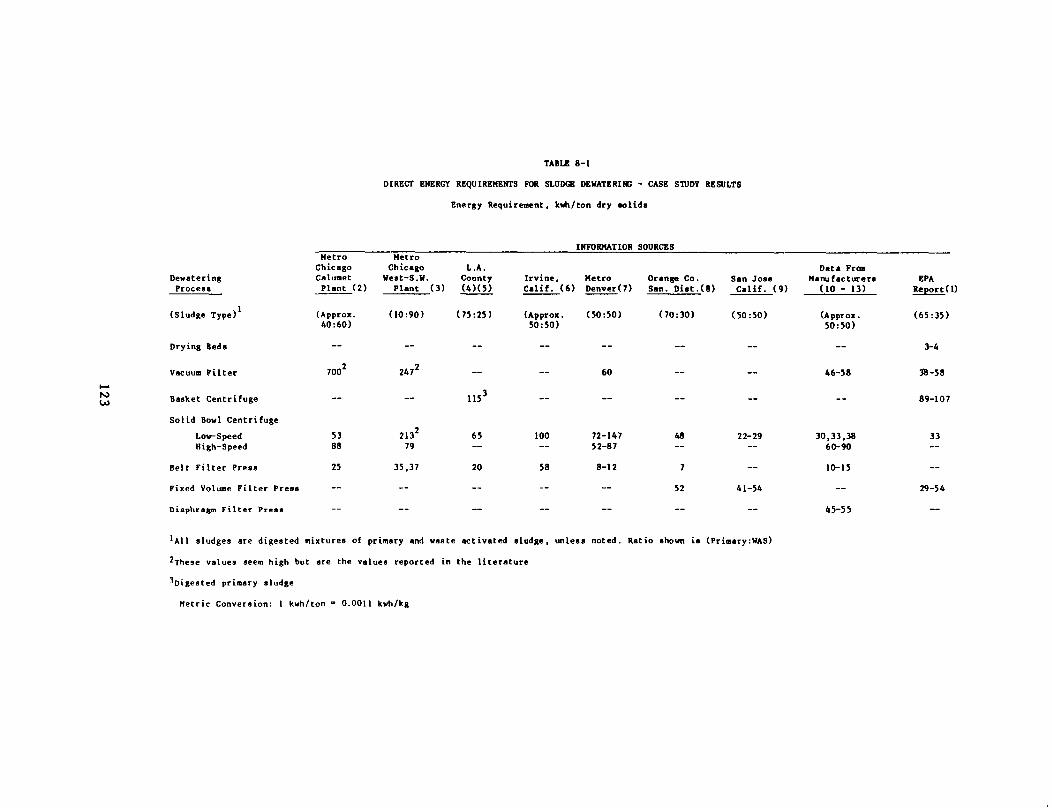
TABLE 8-1
DIRECT ENERGY REQUIREMENTS FOR SLUDGE DEWATERING - CASE STUDY RESULTS
Energy Requirement, kwh/ton dry s o l i d s
INFORMATION SOURCES
DewateringProceaa
(Sludge Type) 1
Drying Beds
Vacuum F i l t e r
Basket Centr i fuge
S o l i d Bowl Centri fuge
Low-SpeedHigh-Speed
Belt Filter Press
Fixed Volume Filter Press
Diaphragm Filter Preas
MetroChicagoCalumetPlant (2)
(Approx.40:60)
700
5388
25
MetroChicago L.A.
West-S.W. CountyPlant (3) (4)(5)
(10:90)
247'
21379
35,37
(75:25)
115
65
20
Irvine, Metro Orange Co. San JoseCalif. (6) Denver(7) San. Dist.(8) Calif. (9)
(Approx.50:50)
(50:50)
60
(70:30) (50:50)
100
58
72-14752-87
8-12
48
7
52
22-29
41-54
1AlI sludges are digested mixtures of primary and waste activated sludge, unless noted. Ratio shown ia (Primary:WAS)
^These values seem high but are the values reported in the literature
•^Digested primary sludge
Metric Conversion: 1 kwh/ton » 0.0011 kwh/kg
Data FrcnManufacturers
(10 - 13)
(Approx.50:50)
—
46-58
—
30,33,3860-90
EPAReport (1)
(65:35)
3-4
38-58
89-107
33
10-15
45-55
29-54
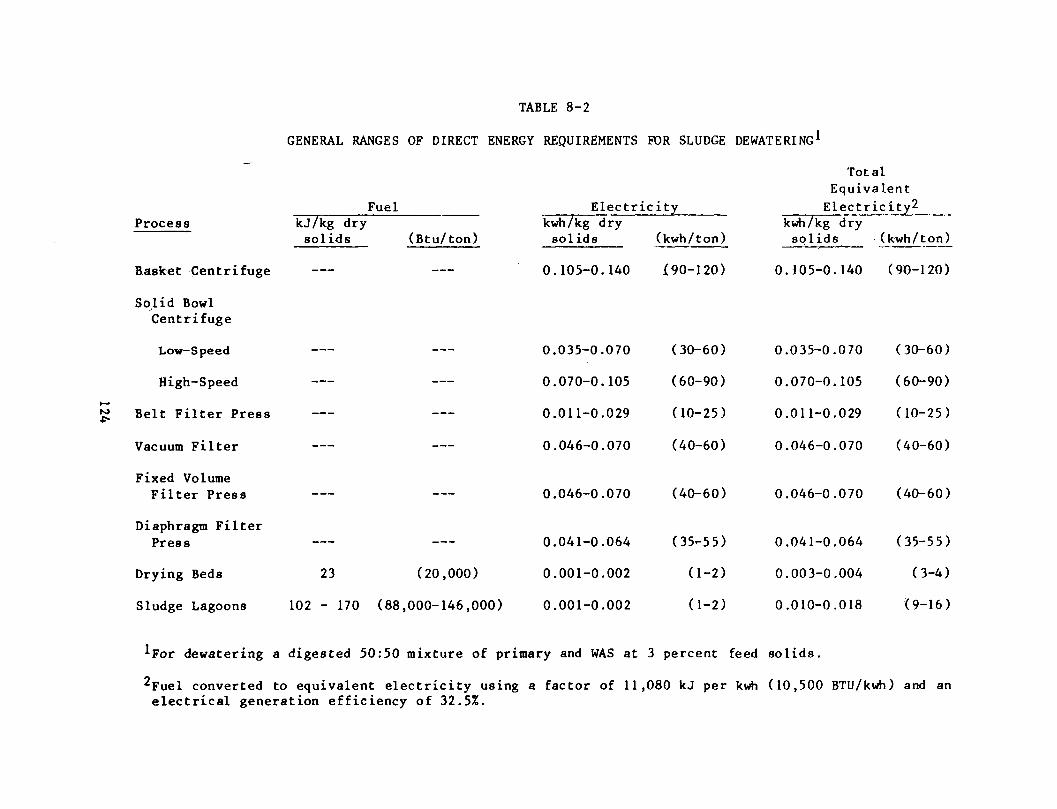
Process
Basket Centrifuge
Solid BowlCentrifuge
Low-Speed
High-Speed
£ Belt Filter Press
Vacuum Filter
Fixed VolumeFilter Press
Diaphragm FilterPress
Drying Beds
Sludge Lagoons
TABLE 8-2
GENERAL RANGES OF DIRECT ENERGY REQUIREMENTS FOR SLUDGE DEWATERING 1
FuelkJ/kg drysolids (Btu/ton)
23 (20,000)
kwh/kg drysolids
Electricity
102 - 170 (88,000-146,000)
0.035-0.070
0.070-0.105
0.011-0.029
0.046-0.070
0.046-0.070
0.041-0.064
0.001-0.002
0.001-0.002
(kwh/ton)
0.105-0.140 {90-120)
(30-60)
(60-90)
(10-25)
(40-60)
(40-60)
(35-55)
(1-2)
(1-2)
Total
Equivalent
Electricity2
kwh/kg drysolids (kwh/ton)
0.105-0.140 (90-120)
0.035-0.070
0.070-0.105
0.011-0.029
0.046-0.070
(30-60)
(60-90)
(10-25)
(40-60)
0.046-0.070 (40-60)
0.041-0.064 (35-55)
0.003-0.004 (3-4)
0.010-0.018 (9-16)
dewatering a digested 50:50 mixture of primary and WAS at 3 percent feed solids.
^Fuel converted to equivalent electricity using a factor of 11,080 kJ per kwh (10,500 BTU/kwh) and anelectrical generation efficiency of 32.5%.
other variables which affect dewatering energy requirements: (1) solidsconcentration of sludge feed; (2) conditioning method selected; (3) number ofmachines - more energy is generally required to run two smaller machines thanone large machine of equivalent capacity, although this is not generally truefor solid bowl centrifuges if the same G force is used in both small and largecentrifuges; (4) solids throughput achieved; and (5) differences in machinesproduced by different manufacturers.
The energy requirements for drying beds shown in Table 8-2 include anelectricity requirement for sludge pumping to the beds and a fuel requirementfor operating a front-end loader used for sludge removal. The power requiredfor pumping sludge to the drying beds is based on a TDH of 4.6 m (15 feet) .This value could be low in some plants where long pumping distances arerequired, or high in a plant where there is gravity flow to the beds. Appro-priate corrections need to be made for situations significantly different than4.6 m (15 feet) of TDH. In smaller plants it is possible that manual labor isused for sludge removal and not a front-end loader.
The direct energy requirements presented in Table 8-2 are also shown inFigure 8-1. For the seven mechanical dewatering processes presented, theorder of direct energy used, from lowest to highest, i s :
Belt f i l ter pressLow G solid bowl centrifugeDiaphragm f i l ter pressFixed volume f i l ter pressVacuum f i l terHigh G solid bowl centrifugeBasket centrifuge
8.3 Indirect Energy Requirements for Dewatering
Most of the sludge dewatering processes operate more efficiently when thesludge is conditioned, typically with chemicals, prior to dewatering.Secondary energy is indirect energy required to produce consumables(chemicals) used in wastewater and sludge treatment processes. Considerationof these secondary energy requirements is supplemental to any cost-effective-ness analysis that may be performed in evaluating alternatives. However, thefuture cost of chemicals is directly affected by increases in the cost ofenergy, and this would be apparent in an energy sensitivity analysis whichincluded secondary energy. A dewatering alternative having a relatively highsecondary energy requirement has a greater dependence on energy than isindicated by the direct energy alone. Indirect energy requirements for sludgedewatering are shown in Table 8-3 and Figure 8-1. As shown, processes whichuti l ize polymer conditioning (centrifuges and belt f i l ter press) have lowindirect energy requirements, while processes which ut i l ize lime and ferricchloride conditioning (vacuum f i l ter and f i l ter presses) have high indirectenergy requirements.
125
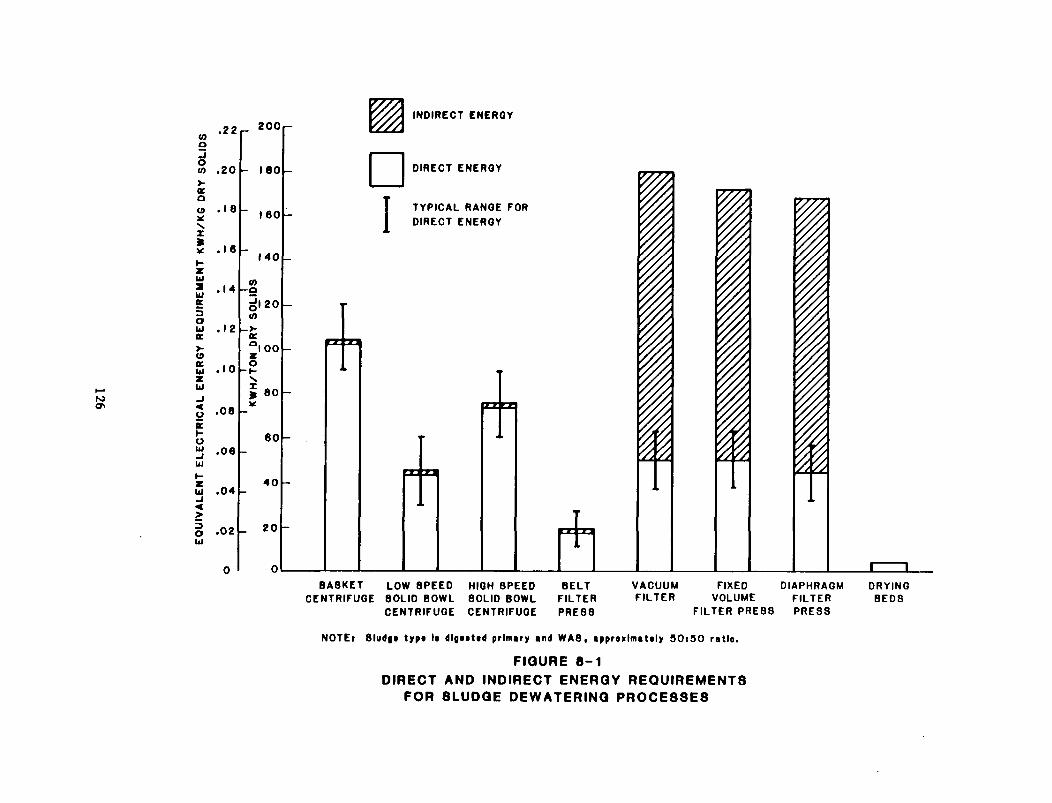
ON
SO
LID
!atou
|
i -
Ul
LJCE3orbla>-
IER
G
m.bl
KHO
ELE
Kbl-1
3Obl
.22
. 2 0
.18
.1 6
.14
.12
. 1 0
.08
.06
.04
.02
0
-
-
IDS
M
Ka
'TO
N
X
2 0 0
160
160
140
120
100
80
60
4 0
2 0
0
I
INDIRECT ENERGY
DIRECT ENERGY
TYPICAL RANGE FORDIRECT ENERGY
m
BASKET LOW 8PEED HIGH 8PEED BELTCENTRIFUGE 80LID BOWL 80LID BOWL FILTER
CENTRIFUGE CENTRIFUGE PRE88
VACUUM FIXED DIAPHRAGM DRYINGFILTER VOLUME FILTER BEDS
FILTER PRE88 PRESS
NOTEt Sludg* typt I* dlgiittd primary tnd WAS, ipproxlmattly 90t90 ratio.
FIGURE 8-1DIRECT AND INDIRECT ENERGY REQUIREMENTS
FOR 8LUDQE DEWATERINQ PROCE38E8
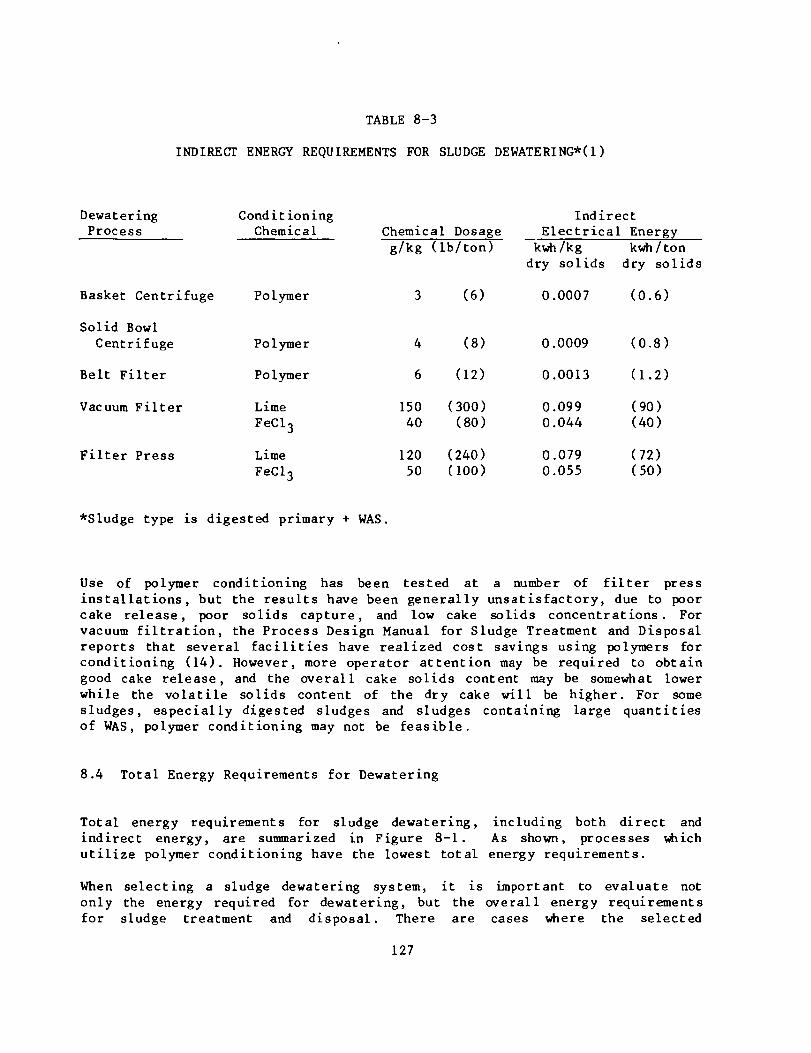
TABLE 8-3
INDIRECT ENERGY REQUIREMENTS FOR SLUDGE DEWATERING*(1)
DewateringProcess
Basket Centr i fuge
Condi t ioningChemical
Polymer
Chemical Dosageg/kg (lb/ton)
(6)
IndirectElectrical Energy
kwh/kg kwh/tondry solids dry solids
0.0007 (0.6)
Solid BowlCentrifuge
Belt Filter
Vacuum Filter
Filter Press
Polymer
Polymer
LimeFeCl3
LimeFeClo
4
6
15040
12050
(8)
(12)
(300)(80)
(240)(100)
0.0009
0.0013
0.0990.044
0.0790.055
(0.8)
(1.2)
(90)(40)
(72)(50)
*Sludge type is digested primary + WAS.
Use of polymer conditioning has been tested at a number of filter pressinstallations, but the results have been generally unsatisfactory, due to poorcake release, poor solids capture, and low cake solids concentrations. Forvacuum filtration, the Process Design Manual for Sludge Treatment and Disposalreports that several facilities have realized cost savings using polymers forconditioning (14). However, more operator attention may be required to obtaingood cake release, and the overall cake solids content may be somewhat lowerwhile the volatile solids content of the dry cake will be higher. For somesludges, especially digested sludges and sludges containing large quantitiesof WAS, polymer conditioning may not be feasible.
8.4 Total Energy Requirements for Dewatering
Total energy requirements for sludge dewatering, including both direct andindirect energy, are summarized in Figure 8-1. As shown, processes whichutilize polymer conditioning have the lowest total energy requirements.
When selecting a sludge dewatering system, it is important to evaluate notonly the energy required for dewatering, but the overall energy requirementsfor sludge treatment and disposal. There are cases where the selected
127
dewatering process consumes more energy than other alternatives, but the totalsludge treatment and disposal energy requirements are lower. In someinstances, the most cost-effective dewatering alternative may require moreenergy than other alternatives. In such cases an energy sensitivity analysisshould be made to determine the effect of escalating energy costs. Forexample, if energy costs outpace inflation by 10 or 20 percent over the next10 years, the cost-effective alternative at current energy prices may nolonger be cost-effective at future energy prices.
8.5 References
1. Wesner G. M., et al., "Energy Conservation in Municipal WastewaterTreatment," USEPA - Office of Water Program Operations, Washington,D. C , 20460, MCD-32, EPA-430/9/77-011, March 1978.
2. Zenz, D. R., et al., "Evaluation of Unit Processes for Dewatering ofAnaerobically Digested Sludge at Metro Chicago's Calumet Sewage TreatmentPlant," The Metropolitan Sanitary District of Greater Chicago, October1976.
3. Sawyer, Bernard; Watkins, Robert; and Lue-Hing, Cecil, "Evaluation ofUnit Processes for Mechanical Dewatering of Anaerobically Digested Sludgeat Metro Chicago's West-Southwest Sewage Treatment Plant," Paperpresented at the 31st Annual Purdue Industrial Waste Conference, May1976. (Authors are with the Research and Development Department of TheMetropolitan Sanitary District of Greater Chicago)
4. Trubiano, R. , Bachtel, D., LeBrun, T., and Horvath, R., "ParallelEvaluation of Low Speed Scroll Centrifuges and Belt Filter Presses forDewatering Municipal Sewage Sludge," Draft EPA Report, Contract68-03-2745, 1981. (Authors are with County Sanitation Districts of LosAngeles County, Whittier, California)
5. Personal Communication, Thomas J. LeBrun, Supervisor of Research Section,Joint Water Pollution Control Plant, County Sanitation Districts of LosAngeles County, Carson, California, June 1982.
6. CH2M-Hill, "Michelson Water Reclamation Plant - Engineering Report forDewatering Equipment Selection," Irvine Ranch Water District, IrvineCalifornia, June 1979.
7. Tavery, M. A., "Evaluation of Sludge Dewatering Equipment at the MetroDenver Sewage District," paper presented at the Colorado AWWA-WPCATechnical Activities Committee, May 3, 1979. (Author is with the Metro-politan Denver Sewage Disposal District No. 1, Denver, Colorado).
8. John Carollo Engineers, "Design Memorandum No. 5 - Dewatering Methods,"County Sanitation Districts of Orange County, Fountain Valley,California, April 1979.
128
9. Consoer, Townsend & Associates Ltd., "Draft Project Report - SludgeProcessing Facilities Plan For the Cities of San Jose and Santa Clara,California," May 1980.
10. Ingersoll-Rand, Unpublished data on filter press and centrifuge testresults, 1977 - 1979. (Information received from Wayne B. Gendron,Ingersoll-Rand, Nashua, New Hampshire)
11. Personal communication, Brian Scholes, KHD Humboldt Wedag, Atlanta,Georgia, April 1981.
12. Personal communication, Gordon Wilson, Ingersoll-Rand salesrepresentative, from Tom Ponton Industries, Santa Fe Springs, California,June 1979.
13. Personal communication, Dick Gray, Komline Sanderson EngineeringCorporation, Peapack, New Jersey, July 1982.
14. "Process Design Manual For Sludge Treatment and Disposal,"USEPA - Municipal Environmental Research Laboratory, Cincinnati, Ohio,45268, EPA-625/1-79/011, September 1979.
129
C h a p t e r 9
SUMMARY OF RECENT SIDE-BY-SIDE COMPARISONS OF DEWATERINGPROCESSES AT TEN TREATMENT PLANTS
9.1 Introduction
In this chapter, the evaluation studies of dewatering alternatives conductedby ten large ut i l i t i e s in various parts of the U.S. are summarized. In each ofthe evaluations, pilot tests and full-scale field tests of at least two andsometimes three or four different types of mechanical dewatering processeswere considered.
Of the ten evaluations, four recommended belt f i lter presses, four recommendedsolid bowl centrifuges, one recommended a fixed volume recessed plate fi lterpress, and for one study no recommendation was made. A summary of thesestudies showing the equipment evaluated and the type of dewatering equipmentrecommended by the evaluation is shown in Table 9-1.
These ten studies are presented to show the manner in which different largeut i l i t i e s approached the selection of dewatering equipment. Although eight ofthe ten ut i l i t i e s selected centrifuges or belt presses, this does not neces-sarily imply that all u t i l i t i e s of comparable size should select one of thesetwo types of dewatering devices. Each application is unique, and decisions ondewatering equipment selection should be made using the approach recommendedin Chapter 6.
9.2 County Sanitation Districts of Los Angeles County (California)
During a two-year period from 1977 through 1979, several pilot-scale and somefull-scale mechanical dewatering equipment including belt f i l ter presses,centrifuges, and a diaphragm filter press were tested at the Joint WaterPollution Control Plant in Carson. At the time of the dewatering evaluations,no method of ultimate disposal had yet been selected.
Six different manufacturers sent pilot-scale belt f i l ter presses to theSanitation Districts for testing (1):
Ashbrook-Simon-Hartley WinklepressParkson Magnum PressTait-Andritz SDMCarter Belt Filter PressKomiine-Sanderson UnimatEnvirotech Eimco High-Solids Press
130
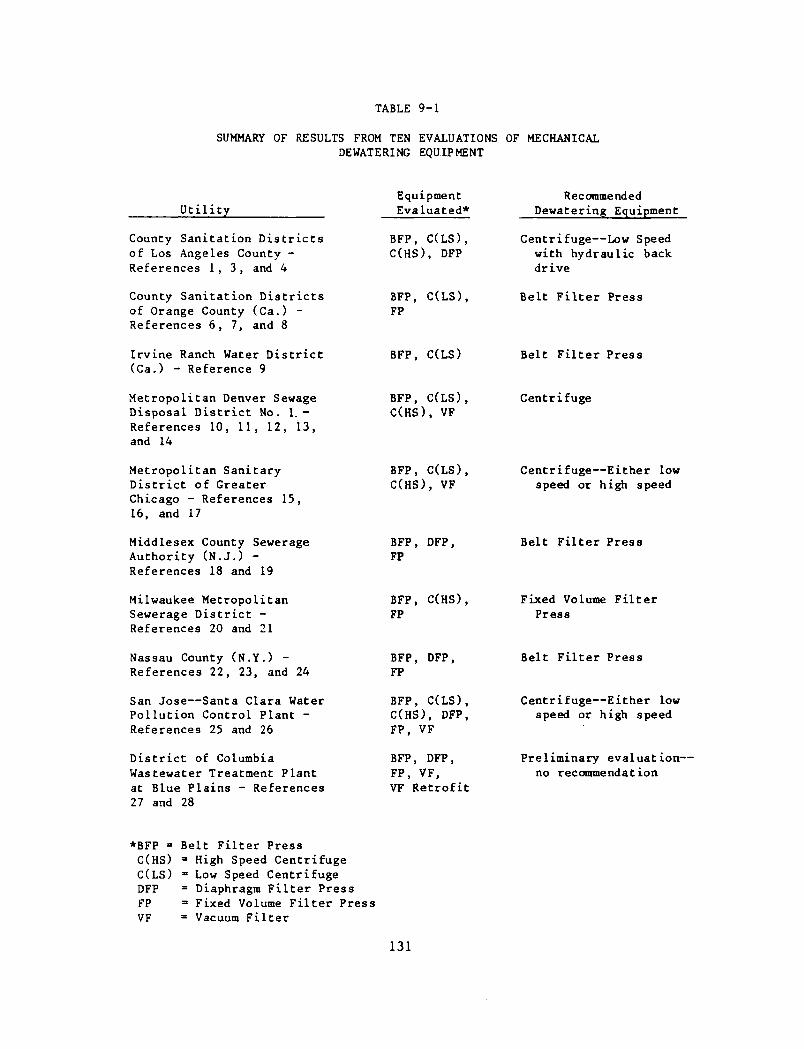
TABLE 9-1
SUMMARY OF RESULTS FROM TEN EVALUATIONS OF MECHANICALDEWATERING EQUIPMENT
Utility
County Sanitation Districtsof Los Angeles County -References 1,3, and 4
County Sanitation Districtsof Orange County (Ca.) -References 6, 7, and 8
Irvine Ranch Water District(Ca.) - Reference 9
Metropolitan Denver SewageDisposal District No. 1.-References 10, 11, 12, 13,and 14
Metropolitan SanitaryDistrict of GreaterChicago - References 15,16, and 17
Middlesex County SewerageAuthority (N.J.) -References 18 and 19
Milwaukee MetropolitanSewerage District -References 20 and 21
Nassau County (N.Y.) -References 22, 23, and 24
San Jose—Santa Clara WaterPollution Control Plant -References 25 and 26
District of ColumbiaWastewater Treatment Plantat Blue Plains - References27 and 28
EquipmentEvaluated*
BFP, C(LS),C(HS), DFP
BFP, C(LS),FP
BFP, C(LS)
BFP, C(LS),C(HS), VF
BFP, C(LS),C(HS), VF
BFP, DFP,FP
BFP, C(HS),FP
BFP, DFP,FP
BFP, C(LS),C(HS), DFP,FP, VF
BFP, DFP,FP, VF,VF Retrofit
RecommendedDewatering Equipment
Centrifuge—Low Speedwith hydraulic backdrive
Belt Filter Press
Belt Filter Press
Centrifuge
Centrifuge—Either lowspeed or high speed
Belt Filter Press
Fixed Volume FilterPress
Belt Filter Press
Centrifuge—Either lowspeed or high speed
Preliminary evaluation-no recommendation
*BFP = Belt Filter PressC(HS) = High Speed CentrifugeC(LS) » Low Speed CentrifugeDFP = Diaphragm Filter PressFP = Fixed Volume Filter PressVF = Vacuum Filter
131
The Eimco High-Solids Press is not actually a belt f i l ter press but rather avacuum fi l ter which advances sludge cake intermittently to a pneumaticallyoperated press. Use of the unit was considered infeasible because of therequirement for large amounts of lime and ferric chloride for conditioning.The other five belt f i l ter presses were tested on a number of blends ofdigested primary and waste activated sludge (WAS). With a blend of 30 percentprimary and 70 percent WAS, cake solids concentrations of 20 percent andsolids recoveries of 90 percent were obtained on the Winklepress and theMagnum Press. Cake solids concentrations on the Andritz SDM were 16 to 17percent. Polymer requirements for the belt f i l ter presses were 3 to 6 g/kg (6to 12 lb/ton) dry solids. Descriptions, sketches, and differences in designand operation for many of the different manufacturers' belt f i l ter presses arepresented in an EPA Technology Transfer Seminar Publication (2).
Three different types of pilot-scale centrifuges were tested (1):
Sharpies PM-35000 High-Speed Solid Bowl (Scroll) CentrifugeKruger 250 Low-Speed Solid Bowl (Scroll) CentrifugeRobatel Basket Centrifuge (existing)
The Robatel basket centrifuge required only 2 to 2.5 g/kg (4 to 5 lb/ton) ofpolymer but could produce a cake solids concentration of only 15 to 20 percenton blends consisting of 30 to 50 percent WAS. Also, the basket centrifugesused a batch operation and required much operator and maintenance attention.Because of high cake disposal and O&M costs, the basket centrifuge was notconsidered further for dewatering blends of digested primary and WAS.
The Sharpies centrifuge produced cake solids concentrations of 22 to 26percent solids with 94 to 99 percent solids recoveries for the 100 percentdigested primary sludges. The polymer doses ranged from 2 to 3 g/kg (4 to 6lb/ton). For a 60 percent primary and 40 percent WAS mixture, cake solidsconcentrations were 16 to 20 percent, recoveries 94 to 97 percent, and polymerdosages 2.5 to 4.5 g/kg (5 to 9 lb/ton).
The Kruger centrifuge had problems with plugged centrate tubes after a fewmonths and operation was judged to be unpredictable and unreliable. It wasestimated that on 100 percent digested primary sludge a cake solids concentra-tion of 24 to 27 percent and 90 percent solids recovery could be achievedusing a polymer dosage of 3.5 to 4.0 g/kg (7 to 8 lb/ton). On a mixture of 70percent primary and 30 percent WAS, polymer requirements were 7.5 g/kg (15lb/ton) to achieve adequate solids recoveries.
The Ingersoll Rand Lasta automatic diaphragm f i l ter press was evaluated in afour chamber pilot unit. The Lasta press produced sludge cakes ranging from 40to 53 percent solids, however, lime and ferric chloride requirements were veryhigh. On a 50:50 blend of digested primary and WAS, a cake solids concentra-tion of 49 percent was produced, however 47 percent lime and 21 percent ferricchloride were required for conditioning, resulting in a corrected cake sludgesolids of only 26 percent. Use of the Lasta diaphragm fi l ter press wasconsidered impractical because of the large amounts of conditioning chemicalsrequired. Belt f i l ter presses and scroll centrifuges proved to be the mosteffective dewatering devices.
132
Following the extensive pilot-scale testing study, two belt f i l ter presses andtwo low speed scroll centrifuges were selected for full-scale parallelevaluation (3):
Ashbrook-Simon-Hartley Winklepress Model 3V - 2.2 m belt widthParkson Magnum Press Model MP50 - 2.0 m belt widthBird HB5900 Centrifuge - 0.9 m (36 in) bowl diameterKruger 280 MC Centrifuge - 0.8 m (32 in) bowl diameter
The Sanitation Districts did not evaluate full-scale high speed centrifugessuch as are manufactured by Sharpies. They chose to evaluate only low speedcentrifuges because they felt low speed centrifuges had lower energy, polymerand maintenance time requirements for their operation (3).
The Magnum Press consistently produced about 4% drier cakes for all the sludgeblends tested than did the Winklepress. However, polymer dosages for theWinklepress were consistently 1.5 to 2.0 g/kg (3 to 4 lb/ton) lower than forthe Magnum Press. Solids recovery was also considerably better on the Winkle-press. Because of superior performance of the Winklepress, i t was used incomparisons with the centrifuge. Cake solids of 23 percent were achieved onthe Winklepress for a 75/25 blend of digested primary to WAS with a polymerdose of 4.5 g/kg (9 lb/ton). On a 50/50 blend, the Winklepress produced a 22percent cake with 89 percent solids recovery and a polymer dose of 7.3 g/kg(14.6 lb/ton).
The Bird centrifuge produced 19 percent cake solids and 95 percent recovery ata polymer dose of about 6 g/kg (12 lb/ton) on the 50/50 blend of digestedprimary and WAS. Although the operation of both the belt f i l ter press and thecentrifuge was judged to be unpredictable and fairly unstable on the 50/50blend, it appeared on the average that the belt f i l ter press could produce adrier cake but required more polymer than the centrifuge.
The results of the test work led to the following conclusions: 1) within theaccuracy of the tests , there was no significant cost advantage for either thebelt fi l ter presses or the low speed scroll centrifuges equipped with automa-tically controlled hydraulic backdrives; the slightly drier cakes produced bybelt fi l ter presses and their lower power costs were offset by their increasedpolymer requirements; 2) low speed scroll centrifuge operation may be moredifficult for the novice operator to understand because the process was not asvisible as it was for the belt f i l ter press; the centrifuges also producedmore noise and vibration; 3) belt f i l ter presses were found to require greatermaintenance due primarily to a belt life of only three to six months; weresusceptible to acute loss of solids recovery due to changes in sludge qualityor flow; required greater operator attention and frequent washdown; emittednoticeable odors; and required prescreening of sludge to remove large objectsand fibrous materials; and 4) low speed scroll centrifuges with hydraulicbackdrives were judged to be preferable to belt f i l ter presses for dewateringdigested sewage sludge (3).
As a result of the side-by-side testing evaluation, the Districts advertisedfor bids for low-G scroll centrifuges in 1980. In August 1980, the bid wasawarded to KHD Humboldt Wedag to provide 19 S-4-1 centrifuges to dewater an
133
anaerobically digested 50:50 blend of primary and WAS. An 8.8 cu m/s (200 mgd)pure oxygen activated sludge plant to be completed in 1983 will generate WASto be dewatered along with the existing primary sludge. The centrifuges, to beinstalled in two separate buildings with nine centrifuges in one building andten in another, are expected to be on-line by late 1983 or early 1984 (4).
In October and November 1981 a Sharpies PM 35000 high G solid bowl centrifugeand a KHD Humboldt Wedag S3-0 low G centrifuge were tested at the District 32water reclamation plant in Valencia, California (4). The Sharpies centrifugewas equipped with all of the Polymizer features and a manual version of theeddy current brake, and the Humboldt centrifuge was equipped with a hydraulicbackdrive. The centrifuges were tested several weeks apart on an anaerobicallydigested 50:50 blend of primary and WAS. The feed sludge quality was somewhatdifferent at the time the two machines were tested:
Feed Solids Volatile Solids
Sharpies 2.7% TS 68%Humboldt 3.0% TS 66%
At the start of the t e s t s , the Distr icts ' cr i ter ia for acceptable performancewas a minimum cake solids of 15% and solids recovery of 95%. The Sharpiesmachine never had a solids capture above 90%, and the cake solids contentranged up to 11.5 percent for solids captures of 80 to 90% and polymer dosagesof 3.5 to 7 g/kg (7 to 14 lb/ton) . The Humboldt machine was able to produce acake solids concentration up to 16 percent with a 91 percent capture and apolymer dosage of 7 g/kg (14 lb/ton).
Based upon the test results , the Humboldt centrifuge was rated as a viablealternative for the dewatering fac i l i ty and the Sharpies centrifuge was ratedas unacceptable. It should be noted that the centrifuge tests were not simul-taneous side-by-side t e s t s . A representative from Sharpies described thedifference in sludge quality (as noted by volat i le solids content) as themajor reason for the performance differences between the machines (5) .
9.3 County Sanitation Districts of Orange County (California)
An evaluation of dewatering processes was undertaken by the Orange CountySanitation Districts during 1979 and 1980. The dewatering equipment processedan anaerobically digested mixture of primary and WAS consisting of about 70percent primary and 30 percent T&S. The sludge was generated from a 6.0 cu m/s(138 mgd) primary treatment plant and a 2.0 cu m/s (46 mgd) activated sludgeplant. At the time of the dewatering evaluation, ultimate sludge disposalalternatives had not yet been evaluated. A desktop cost evaluation of centri-fuges, f i l t er presses and belt f i l t er presses was made in a prior designmemorandum in 1979, and the results are shown in Table 9-2 (6) .
Almost concurrently, pi lot-scale field tes ts using one-meter presses wereconducted on three different belt f i l t er presses (7) , to see if the actualbelt press performance matched the design cr i ter ia in the earlier memorandum.
134
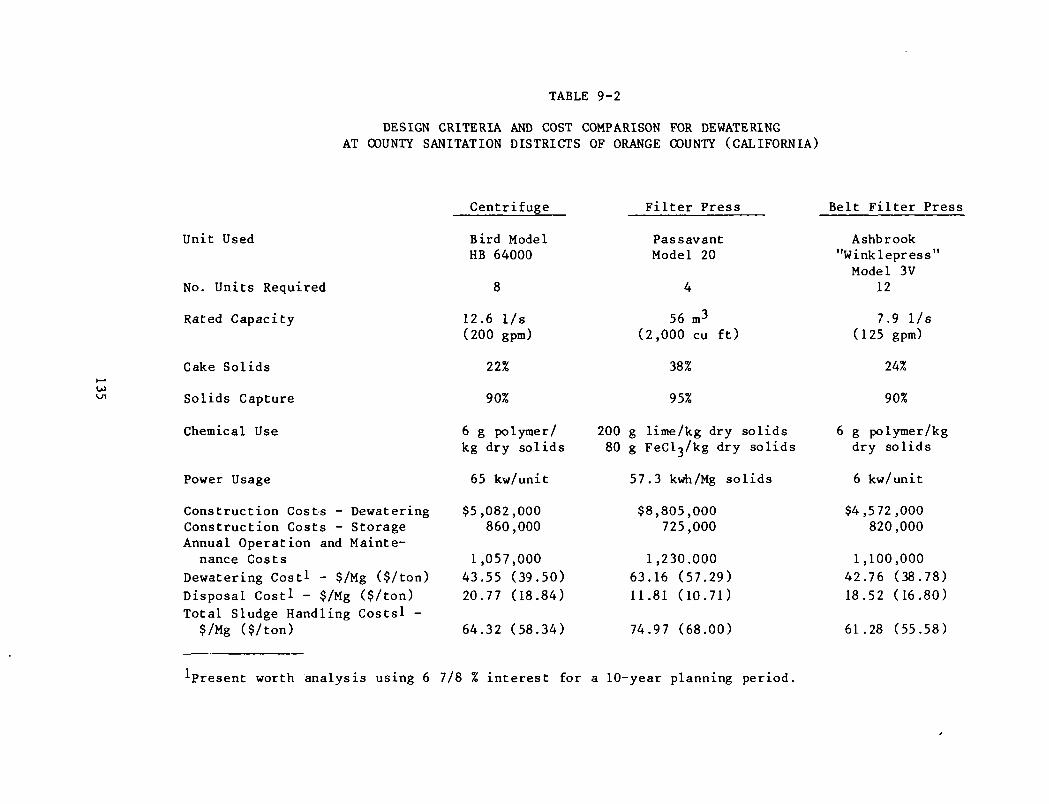
TABLE 9 - 2
DESIGN CRITERIA AND COST COMPARISON FOR DEWATERINGAT COUNTY SANITATION DISTRICTS OF ORANGE COUNTY (CALIFORNIA)
00
Unit Used
No. Units Required
Rated Capacity
Cake Solids
Solids Capture
Chemical Use
Power Usage
Construction Costs - DewateringConstruction Costs - StorageAnnual Operation and Mainte-
nance Costs
Dewatering Cost1 - $/Mg ($/ton)Disposal Cost1 - $/Mg ($/ton)Total Sludge Handling Costsl -
$/Mg ($/ton)
Centrifuge
Bird ModelHB 64000
8
12.6 1/s(200 gpm)
22%
90%
6 g po 1 ytne r /kg dry solids
65 kw/unit
$5,082,000860,000
1,057,00043.55 (39.50)20.77 (18.84)
64.32 (58.34)
Fil ter Press
Pas savantModel 20
4
56 m3
(2,000 cu ft)
38%
95%
200 g lime/kg dry solids80 g FeCl3/kg dry solids
57.3 kwh/Mg solids
$8,805,000725,000
1,230.00063.16 (57.29)11.81 (10.71)
74.97 (68.00)
Belt Fil ter Press
Ashbrook"Winklepress"
Model 3V12
7.9 1/s(125 gpm)
24%
90%
6 g polymer/kgdry solids
6 kw/unit
$4,5 72,000820,000
1,100,00042.76 (38.78)18.52 (16.80)
61.28 (55.58)
•'•Present worth analysis using 6 7/8 % interest for a 10-year planning period.
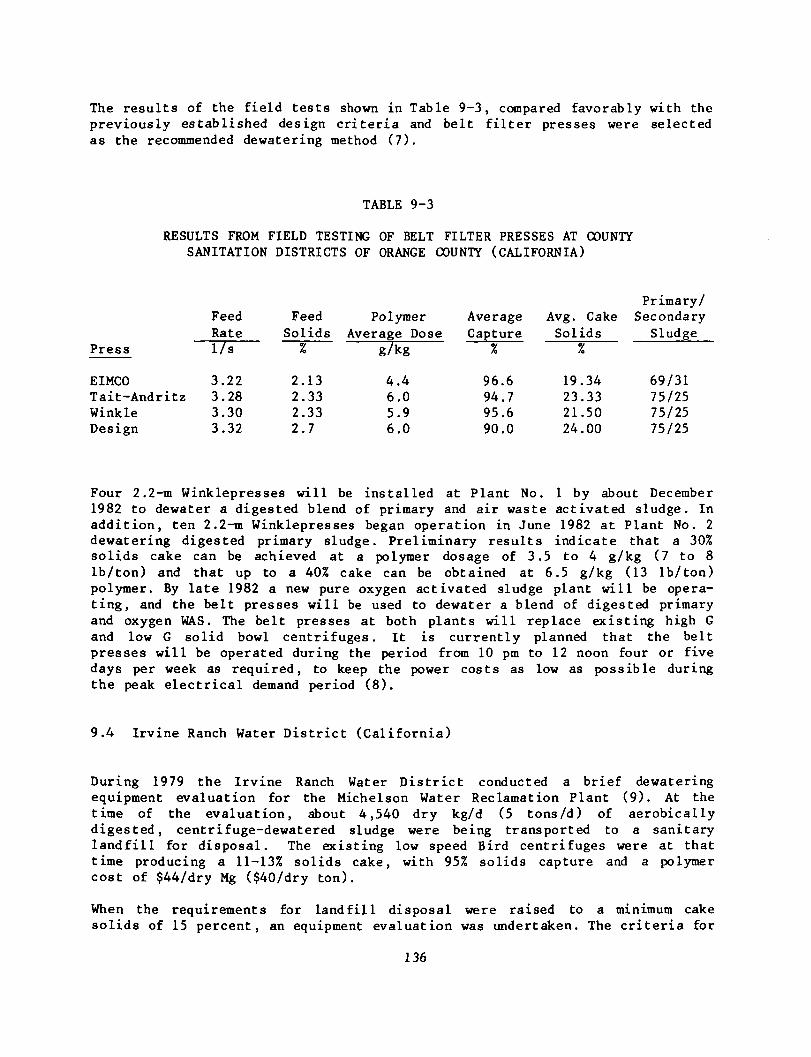
The results of the field tests shown in Table 9-3, compared favorably with thepreviously established design criteria and belt filter presses were selectedas the recommended dewatering method (7).
TABLE 9-3
RESULTS FROM FIELD TESTING OF BELT FILTER PRESSES AT COUNTYSANITATION DISTRICTS OF ORANGE COUNTY (CALIFORNIA)
Press
EIMCOTait-AndritzWinkleDesign
FeedRate1/s
3.223.283.303.32
FeedSolids%
2.132.332.332.7
PolymerAverage Dose
g/kg
4.46.05.96.0
AverageCapture
%
96.694.795.690.0
Avg. CakeSolids
%
19.3423.3321.5024.00
Primary/Secondary
Sludge
69/3175/2575/2575/25
Four 2.2-m Winklepresses will be installed at Plant No. 1 by about December1982 to dewater a digested blend of primary and air waste activated sludge. Inaddition, ten 2.2-m Winklepresses began operation in June 1982 at Plant No. 2dewatering digested primary sludge. Preliminary results indicate that a 30%solids cake can be achieved at a polymer dosage of 3.5 to 4 g/kg (7 to 8lb/ton) and that up to a 40% cake can be obtained at 6.5 g/kg (13 lb/ton)polymer. By late 1982 a new pure oxygen activated sludge plant will be opera-ting, and the belt presses will be used to dewater a blend of digested primaryand oxygen WAS. The belt presses at both plants will replace existing high Gand low G solid bowl centrifuges. It is currently planned that the beltpresses will be operated during the period from 10 pm to 12 noon four or fivedays per week as required, to keep the power costs as low as possible duringthe peak electrical demand period (8).
9.4 Irvine Ranch Water District (California)
During 1979 the Irvine Ranch Water District conducted a brief dewateringequipment evaluation for the Michelson Water Reclamation Plant (9). At thetime of the evaluation, about 4,540 dry kg/d (5 tons/d) of aerobicallydigested, centrifuge-dewatered sludge were being transported to a sanitarylandfill for disposal. The existing low speed Bird centrifuges were at thattime producing a 11-13% solids cake, with 95% solids capture and a polymercost of $44/dry Mg ($40/dry ton).
When the requirements for landfill disposal were raised to a minimum cakesolids of 15 percent, an equipment evaluation was undertaken. The cr i ter ia for
136
selecting new dewatering equipment were to produce a minimum of 15 percentcake solids at substantially lower operating costs than were possible with theexisting centrifuges.
Four types of dewatering equipment were discussed as possible options for theMichelson Plant: existing centrifuges; belt f i l ter presses; vacuum filters;and filter presses. Vacuum filters were not evaluated in detail because oftheir typical requirement for large quantities of lime and ferric chloride.Filter presses were eliminated early from consideration because of their highcosts and requirements for lime and ferric chloride. This left belt filterpresses to be compared with the existing centrifuges.
A pilot test of a 1-m Winklepress on site proved that a belt press couldachieve a dewatered cake of 15 to 17 percent solids at a polymer cost of about$33/Mg ($30/ton) and a capture of 94 to 95 percent. An economic evaluationshowed that leasing a 2-m belt press and operating an interim facility wouldreduce the annual cost of operation from about $480,000 to about $280,000. Inaddition, it was recommended that two belt f i l ter presses be purchased if theleased unit operated satisfactorily for at least two months. Satisfactoryoperation of the belt fi l ter press was obtained, and the existing centrifugebuilding was modified by the addition of two 2.2-m Winklepresses.
9.5 Metropolitan Denver Sewage Disposal District No. 1 (Colorado)
The Metro Denver Sewage District currently operates a 7.5 cu m/s (172 mgd)activated sludge plant. In 1979 the District completed an evaluation of threetypes of sludge dewatering equipment: belt f i l ter presses, centrifuges andvacuum filters (10). The study was undertaken because the District could notprocess all the anaerobically digested sludge produced with six existing coilspring vacuum fi l ters . At the time of the evaluation, the sludge disposaloption chosen for the treatment plant was an agricultural reuse system. Analternate form of dewatering and disposal, however, was required on an interimbasis. The staff recommended that pilot-scale production models of centrifugesand belt presses be brought to the District for on-site testing so the opera-tional characteristics and costs could be evaluated and compared with thevacuum f i l ters .
Two manufacturers of belt presses, the Parkson Corporation and theTait-Andritz Company, and two firms which manufacture centrifuges, thePennwalt-Sharples Corporation and Bird Machine Company, were invited todemonstrate their pilot units at the District . The above companies wereselected primarily on their ability to provide equipment for evaluation priorto January 1979. The pilot equipment was operated by the associated companiesunder the supervision of the District 's Operations Control Specialist. Theaverage performance and costs of the belt press, centrifuge and vacuum filterare compared in Table 9-4 (10).
137
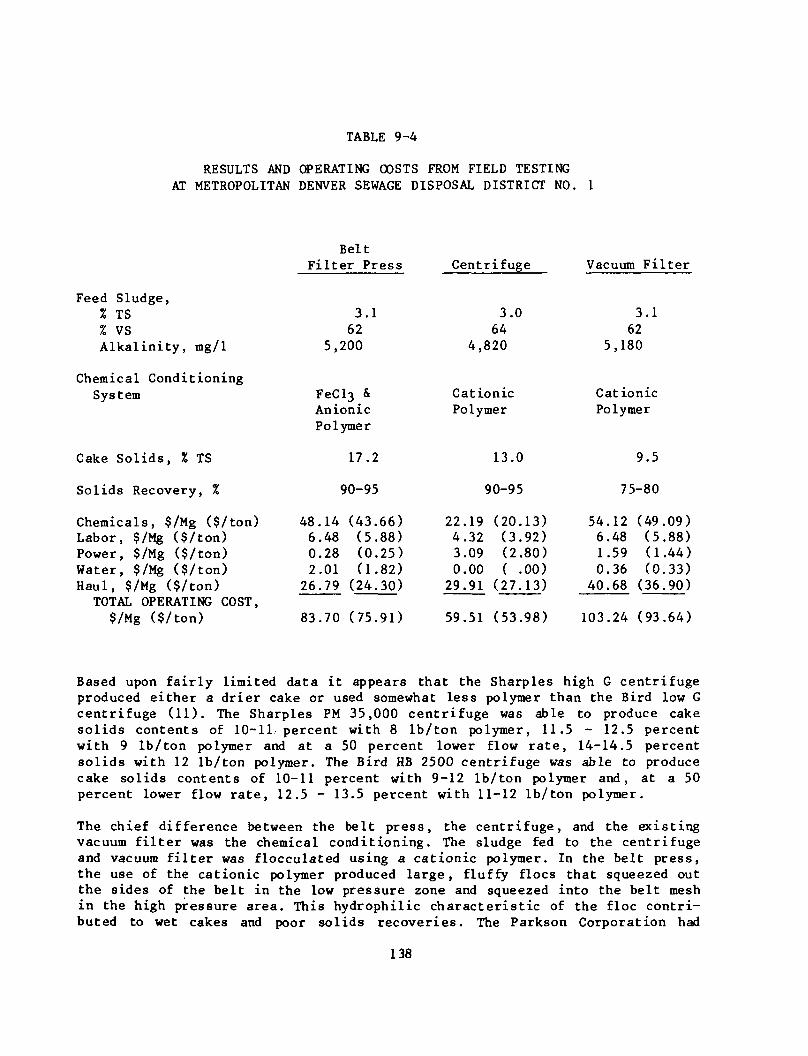
TABLE 9 - 4
RESULTS AND OPERATING COSTS FROM FIELD TESTINGAT METROPOLITAN DENVER SEWAGE DISPOSAL DISTRICT NO. 1
Feed Sludge,% TS% VSAlkalinity, mg/1
Chemical ConditioningSystem
Cake Solids, % TS
Solids Recovery, %
Chemicals, $/Mg ($/ton)Labor, $/Mg ($/ton)Power, $/Mg ($/ton)Water, $/Mg ($/ton)Haul, $/Mg ($/ton)
TOTAL OPERATING COST,$/Mg ($/ton)
BeltFilter Press
3.162
5,200
FeCl3 &AnionicPolymer
17.2
90-95
48.14 (43.66)6.48 (5.88)0.28 (0.25)2.01 (1.82)
26.79 (24.30)
83.70 (75.91)
Centrifuge
3.064
4,820
CationicPolymer
13.0
90-95
22.19 (20.13)4.32 (3.92)3.09 (2.80)0.00 ( .00)
29.91 (27.13)
59.51 (53.98)
Vacuum Filter
3.162
5,180
CationicPolymer
9.5
75-80
54.12 (49.09)6.48 (5.88)1.59 (1.44)0.36 (0.33)
40.68 (36.90)
103.24 (93.64)
Based upon fairly limited data it appears that the Sharpies high G centrifugeproduced either a drier cake or used somewhat less polymer than the Bird low Gcentrifuge (11). The Sharpies PM 35,000 centrifuge was able to produce cakesolids contents of 10-11 percent with 8 lb/ton polymer, 11.5 - 12.5 percentwith 9 lb/ton polymer and at a 50 percent lower flow rate, 14-14.5 percentsolids with 12 lb/ton polymer. The Bird HB 2500 centrifuge was able to producecake solids contents of 10-11 percent with 9-12 lb/ton polymer and, at a 50percent lower flow rate, 12.5 - 13.5 percent with 11-12 lb/ton polymer.
The chief difference between the belt press, the centrifuge, and the existingvacuum fi l ter was the chemical conditioning. The sludge fed to the centrifugeand vacuum fil ter was flocculated using a cationic polymer. In the belt press,the use of the cationic polymer produced large, fluffy floes that squeezed outthe sides of the belt in the low pressure zone and squeezed into the belt meshin the high pressure area. This hydrophilic characteristic of the floe contri-buted to wet cakes and poor solids recoveries. The Parkson Corporation had
138
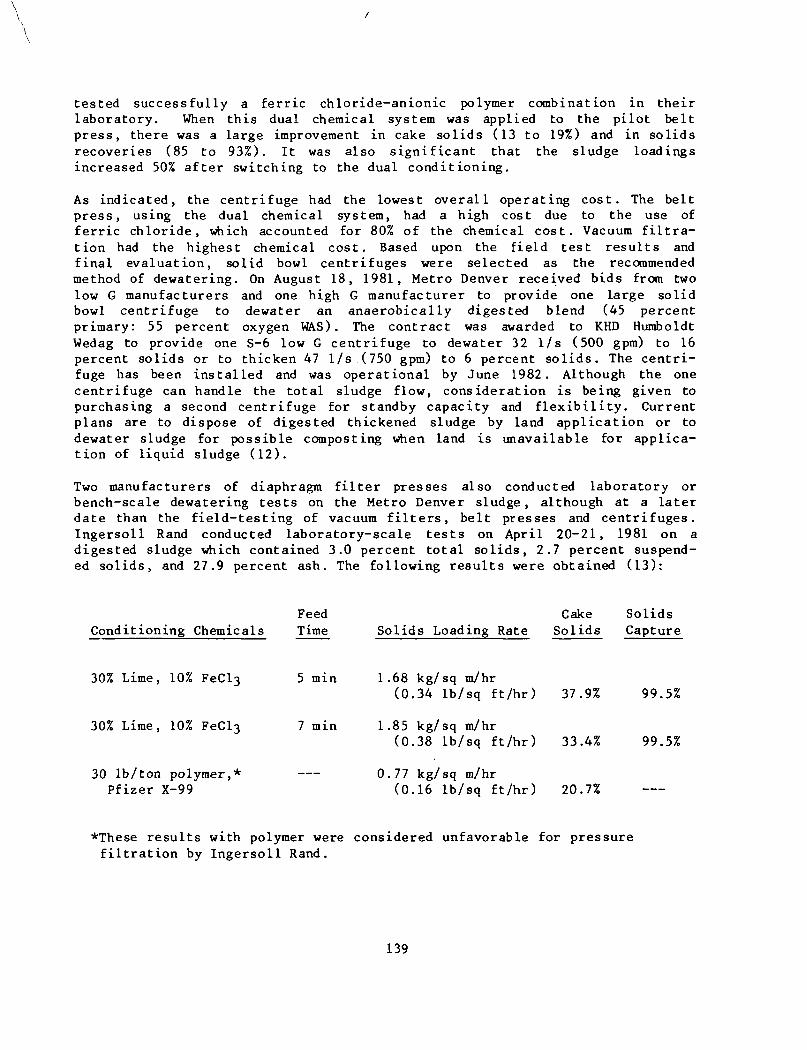
\\
tested successfully a ferric chloride-anionic polymer combination in theirlaboratory. When this dual chemical system was applied to the pilot beltpress, there was a large improvement in cake solids (13 to 19%) and in solidsrecoveries (85 to 93%). I t was also significant that the sludge loadingsincreased 50% after switching to the dual conditioning.
As indicated, the centrifuge had the lowest overall operating cost. The beltpress, using the dual chemical system, had a high cost due to the use offerric chloride, which accounted for 80% of the chemical cost. Vacuum f i l t r a -tion had the highest chemical cost. Based upon the field test results andfinal evaluation, solid bowl centrifuges were selected as the recommendedmethod of dewatering. On August 18, 1981, Metro Denver received bids from twolow G manufacturers and one high G manufacturer to provide one large solidbowl centrifuge to dewater an anaerobically digested blend (45 percentprimary: 55 percent oxygen WAS). The contract was awarded to KHD HuraboldtWedag to provide one S-6 low G centrifuge to dewater 32 1/s (500 gpm) to 16percent solids or to thicken 47 1/s (750 gpm) to 6 percent sol ids. The centr i -fuge has been installed and was operational by June 1982. Although the onecentrifuge can handle the total sludge flow, consideration is being given topurchasing a second centrifuge for standby capacity and f lex ib i l i ty . Currentplans are to dispose of digested thickened sludge by land application or todewater sludge for possible composting when land is unavailable for applica-tion of liquid sludge (12).
Two manufacturers of diaphragm f i l t e r presses also conducted laboratory orbench-scale dewatering tests on the Metro Denver sludge, although at a laterdate than the field-testing of vacuum f i l t e r s , belt presses and centrifuges.Ingersoll Rand conducted laboratory-scale tes ts on April 20-21, 1981 on adigested sludge which contained 3.0 percent total solids, 2.7 percent suspend-ed solids, and 27.9 percent ash. The following resul ts were obtained (13):
Feed Cake SolidsConditioning Chemicals Time Solids Loading Rate Solids Capture
30% Lime, 10% FeCl3 5 min 1.68 kg/sq m/hr(0.34 lb/sq ft /hr) 37.9% 99.5%
30% Lime, 10% FeCl3 7 min 1.85 kg/sq m/hr(0.38 lb/sq ft/hr) 33.4% 99.5%
30 lb/ton polymer,* 0.77 kg/sq m/hrPfizer X-99 (0.16 lb/sq ft/hr) 20.7%
*These results with polymer were considered unfavorable for pressuref i l t ra t ion by Ingersoll Rand.
139
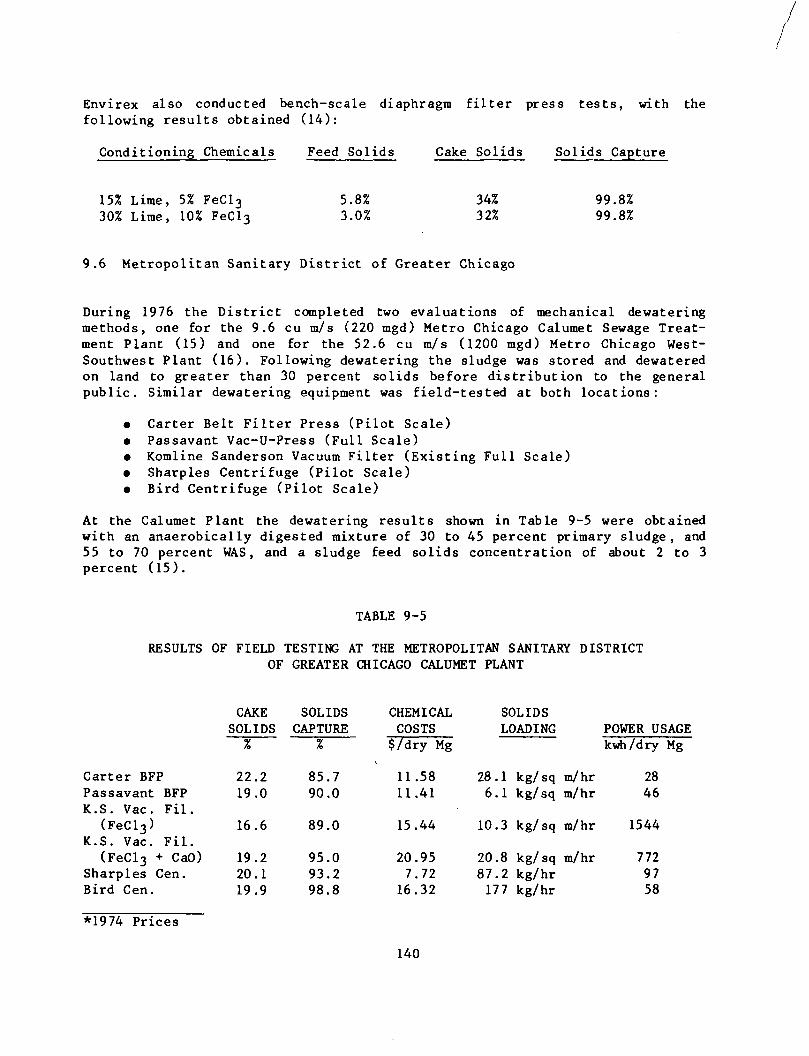
Envirex also conducted bench-scale diaphragm filter press tests, with thefollowing results obtained (14):
Conditioning Chemicals Feed Solids Cake Solids Solids Capture
15% Lime, 5% FeCl3
30% Lime, 10% FeCl3
5.8%3.0%
34%32%
99.8%99.8%
9.6 Metropolitan Sanitary District of Greater Chicago
During 1976 the District completed two evaluations of mechanical dewateringmethods, one for the 9.6 cu m/s (220 mgd) Metro Chicago Calumet Sewage Treat-ment Plant (15) and one for the 52.6 cu m/s (1200 mgd) Metro Chicago West-Southwest Plant (16). Following dewatering the sludge was stored and dewateredon land to greater than 30 percent solids before distribution to the generalpublic. Similar dewatering equipment was field-tested at both locations:
• Carter Belt Filter Press (Pilot Scale)• Passavant Vac-U-Press (Full Scale)• Komline Sanderson Vacuum Filter (Existing Full Scale)• Sharpies Centrifuge (Pilot Scale)• Bird Centrifuge (Pilot Scale)
At the Calumet Plant the dewatering results shown in Table 9-5 were obtainedwith an anaerobically digested mixture of 30 to 45 percent primary sludge, and55 to 70 percent WAS, and a sludge feed solids concentration of about 2 to 3percent (15).
TABLE 9-5
RESULTS OF FIELD TESTING AT THE METROPOLITAN SANITARY DISTRICTOF GREATER CHICAGO CALUMET PLANT
Car te r BFPPassavantK.S. Vac.
(FeCl3)K.S. Vac.
(FeCl 3 HSharpies (Bird Cen.
BFPFil.
Fil.i- CaO)]en.
*1974 Prices
CAKESOLIDS
%
22.219.0
16.6
19.220.119.9
SOLIDSCAPTURE
%
85.790.0
89.0
95.093.298.8
CHEMICALCOSTS
$ /d ry Mg
11.5811.41
15.44
20.957.72
16.32
SOLIDSLOADING
28.1 k g / s q6.1 kg/sq
10.3 kg/sq
20.8 kg/sq87.2 kg/hr
177 kg/hr
m/hrm/hr
m/hr
m/hr
POWER USAGEk w h / d r y Mg
2846
1544
7729758
140
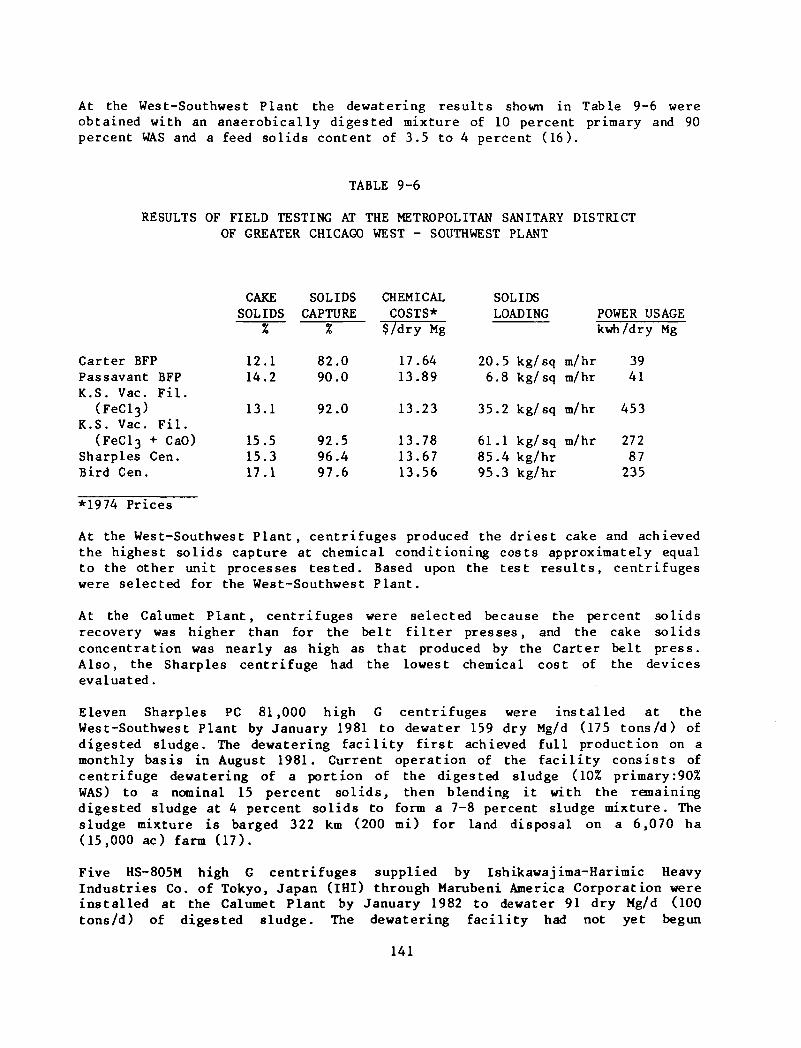
At the West-Southwest Plant the dewatering results shown in Table 9-6 wereobtained with an anaerobically digested mixture of 10 percent primary and 90percent WAS and a feed solids content of 3.5 to 4 percent (16).
TABLE 9-6
RESULTS OF FIELD TESTING AT THE METROPOLITAN SANITARY DISTRICTOF GREATER CHICAGO WEST - SOUTHWEST PLANT
Carter BFPPassavantK.S. Vac.
(FeCl3)K.S. Vac.
(FeCl3 •Sharpies (Bird Cen.
BFPF i l .
F i l .f- CaO):en.
*1974 Pr ices
CAKESOLIDS
%
1 2 . 114.2
13.1
15.515.317.1
SOLIDSCAPTURE
%
8 2 . 090.0
92.0
92.596.497.6
CHEMICALCOSTS*
$ / d r y Mg
17.6413.89
13.23
13.7813.6713.56
SOLIDSLOADING
2 0 . 56 .8
3 5 . 2
6 1 . 18 5 . 495.3
kg/sqkg/sq
kg/sq
kg/sqkg/hrkg/hr
m/hrm/hr
m/hr
m/hr
POWER USAGEkwh/dry Mg
3941
453
27287
235
At the West-Southwest Plant, centrifuges produced the driest cake and achievedthe highest solids capture at chemical conditioning costs approximately equalto the other unit processes tested. Based upon the test results, centrifugeswere selected for the West-Southwest Plant.
At the Calumet Plant, centrifuges were selected because the percent solidsrecovery was higher than for the belt f i l ter presses, and the cake solidsconcentration was nearly as high as that produced by the Carter belt press.Also, the Sharpies centrifuge had the lowest chemical cost of the devicesevaluated.
Eleven Sharpies PC 81,000 high G centrifuges were installed at theWest-Southwest Plant by January 1981 to dewater 159 dry Mg/d (175 tons/d) ofdigested sludge. The dewatering facility first achieved full production on amonthly basis in August 1981. Current operation of the facility consists ofcentrifuge dewatering of a portion of the digested sludge (10% primary:90%WAS) to a nominal 15 percent solids, then blending it with the remainingdigested sludge at 4 percent solids to form a 7-8 percent sludge mixture. Thesludge mixture is barged 322 km (200 mi) for land disposal on a 6,070 ha(15,000 ac) farm (17).
Five HS-805M high G centrifuges supplied by Ishikawajima-Harimic HeavyIndustries Co. of Tokyo, Japan (IHI) through Marubeni America Corporation wereinstalled at the Calumet Plant by January 1982 to dewater 91 dry Mg/d (100tons/d) of digested sludge. The dewatering facility had not yet begun
141
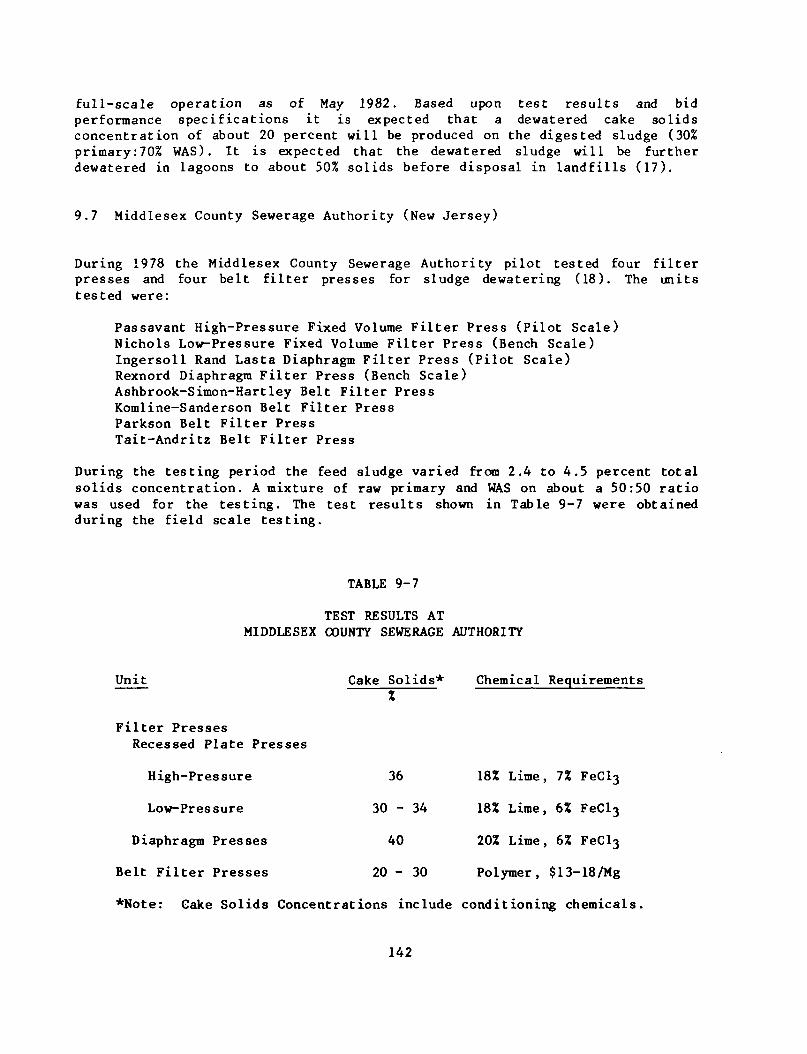
full-scale operation as of May 1982. Based upon test results and bidperformance specifications it is expected that a dewatered cake solidsconcentration of about 20 percent will be produced on the digested sludge (30%primary:70% WAS). It is expected that the dewatered sludge will be furtherdewatered in lagoons to about 50% solids before disposal in landfills (17).
9.7 Middlesex County Sewerage Authority (New Jersey)
During 1978 the Middlesex County Sewerage Authority pilot tested four f i l terpresses and four belt f i l ter presses for sludge dewatering (18). The unitstested were:
Passavant High-Pressure Fixed Volume Fil ter Press (Pilot Scale)Nichols Low-Pressure Fixed Volume Filter Press (Bench Scale)Ingersoll Rand Lasta Diaphragm Filter Press (Pilot Scale)Rexnord Diaphragm Fil ter Press (Bench Scale)Ashbrook-Simon-Hartley Belt Filter PressKomline-Sanderson Belt Filter PressParkson Belt Fil ter PressTait-Andritz Belt Fil ter Press
During the testing period the feed sludge varied from 2.4 to 4.5 percent totalsolids concentration. A mixture of raw primary and WAS on about a 50:50 ratiowas used for the testing. The test results shown in Table 9-7 were obtainedduring the field scale testing.
TABLE 9-7
TEST RESULTS ATMIDDLESEX COUNTY SEWERAGE AUTHORITY
Unit Cake Solids* Chemical Requirements
Filter Presses
Recessed Plate Presses
High-Pressure
Low-Pressure
Diaphragm Presses
Belt Filter Presses
36 18% Lime, 7% FeCl3
30 - 34 18% Lime, 6% FeCl3
40 20% Lime, 6% FeCl3
20 - 30 Polymer, $13-18/Mg
*Note: Cake Solids Concentrations include conditioning chemicals
142
Both belt f i l ter presses and f i l ter presses were considered to be capable ofproducing sludge cake suitable for landfilling, composting, starved aircombustion, and co-disposal operations. A cost analysis indicated that beltpress dewatering was the most economical system from among these disposalalternatives evaluated, and belt f i l ter presses were selected. Although beltf i l te r presses were selected for dewatering, as of July 1982 there are noplans for design and installation of belt presses. Current plans are tocontinue using barges for ocean disposal of liquid sludge (19).
9.8 Milwaukee Metropolitan Sewerage District (Wisconsin)
Field testing of pilot-scale and full-scale thickening and dewateringequipment was conducted by the Milwaukee Metropolitan Sewerage District at theJones Island and South Shore Wastewater Treatment Plants during the periodfrom June 1980 to January 1981 (20). The following dewatering units weretested on an anaerobically digested mixture of primary and WAS:
1. Centrifuge
• Sharpies PM-35,000 Polymizer horizontal solid bowl unit
2. Belt Fi l ter Press
• Pas savant 2-m Vac-U-Press• Komline-Sanderson 0.5-m Kompress• Ralph B. Carter 0.8-m Model 32 unit
3. Fixed Volume Fil ter Press
• Passsavant press (four round chambers, each with effective f i l t r a -tion area of 0.56 sq m [6.05 sq ft])
• Edwards and Jones press (four square chambers, each with effectivefi l t rat ion area of 0.30 sq m [3.21 sq ft])
4. Diaphragm Fil ter Press (14)
• Envirex press (six square chambers, each with a total f i l t ra t ionarea of 0.97 sq m [10.4 sq ft])
Based on a feed solids concentration of 2.5 to 3.0 percent from the anaerobicdigester, both the centrifuge and belt press could produce a cake solidsconcentration of 18 percent with a 95 percent solids recovery. However, thebelt press typically required 50 percent more polymer than the centrifuge - 6versus 4 g/kg (12 versus 8 lb/ton). The centrifuge option was shown to be 12percent less costly than a belt press on a present worth basis.
For the f i l ter press tes ts , with a feed solids concentration of 2.4 percentsolids, typically a 41 percent cake solids was achieved using a lime dose of35% (as CaO) and a ferric chloride dose of 5.5%. Centrifuge thickening thesludge before the f i l ter press reduced the required chemical dosages to
143
17 to 24 percent lime and to 3.2 to 4.4 percent ferric chloride and produced acake solids of about 38 percent. Prethickening also increased the machinethroughput anywhere from 64 to 125 percent (20). Diaphragm filter press testsproduced cake solids concentrations of 35 to 55 percent total solids withsolids recoveries greater than 99.5 percent (14).
Fixed volume filter presses were selected as the recommended dewateringprocess for both the Jones Island Plant and the South Shore Plant in theMilwaukee Solids Handling Studies as of May 1981 (20). At the Jones IslandPlant, filter cake would be landfilled in a sludge-only landfill. At theSouth Shore Plant, sludge storage in a building would be required duringwinter months. The ability to stack filter press cake in a ten-foot pile witha front-end loader with minimal drainage favored the filter press cake overthe centrifuge or belt press cake. There was some concern over applying afilter press cake containing substantial quantities of lime to the alkalinesoils available for land application. Thickening ahead of the filter press wasrecommended, in part because this greatly reduced the quantity of limerequired for conditioning.
In May 1982 the District's plans were somewhat different than those describedabove. For the Jones Island Plant, the current plan is to use filter pressesfor dewatering primary sludge from primary clarifiers which are not yetconstructed. Waste activated sludge will be thickened by solid bowl centri-fuges and dewatered on existing vacuum filters for continued production ofMilorganite. For the South Shore Plant, the current plan is to use existingflotation thickening of waste activated sludge and centrifugal dewatering of adigested blend of primary and waste activated sludge (21).
9.9 Nassau County (New York)
During 1978 and 1979, a sludge handling demonstration project was conducted aspart of the Nassau County Sludge Management Plan to evaluate dewatering andcomposting of sewage sludge (22). The Cedar Creek Water Pollution ControlPlant processes 72.6 Mg (80 tons) of sludge solids per day. Dewateringmachines evaluated from the various manufacturers included:
Komline-Sanderson Belt Filter Press (Unimat) - 0.5 mAshbrook-Simon-Hartley Belt Filter Press (Klam press) - 0.5 mPassavant Recessed Plate Filter Press (Pilot Scale)Shriver Diaphragm Filter Press (Pilot Scale)Envirex Diaphragm Filter Press (Bench Scale)Nichols Engineering Diaphragm Filter Press (Full Scale)
Anaerobically digested sludge solids concentrations ranged from 1 to 5 percentand averaged about 2.3 percent. Both the fixed volume recessed plate anddiaphragm filter presses were able to dewater the sludge to a solids contentof 35 percent or greater (including chemicals). Chemical requirements for allfilter presses tested were significantly higher than reported by equipmentmanufacturers for similar sludge types. The fixed volume recessed plate pressrequired 45 to 67 percent lime and 15 to 27 percent ferric chloride. The
144
Envirex diaphragm press required 27 to 53 percent lime and 8 to 14 percentferric chloride. The Nichols diaphragm fi l ter press was able to produce a cakesolids content of 31 percent when conditioning with polymer at a dosage of18.5 g/kg (37 lb/ton). The polymer, however, was an experimental polymer notcommercially available. The Nichols Engineering report also recommended theuse of a precoat when conditioning the sludge with polymer.
The Komline-Sanderson belt f i l ter press produced a sludge cake of about 20percent solids, operating on a sludge solids feed of 2.5 percent and anaverage polymer dosage of 11 g/kg (22 lb/ton) dry solids, for a polymer costof $43.65/Mg ($39.60/ton). The Ashbrook-Simon-Hartley belt f i l ter press wasable to produce a sludge cake of 30 percent solids, but required an averagepolymer dosage of 23 g/kg (46 lb/ton) dry solids, for a polymer cost of $90/Mg($82/ton). Thus, by increasing polymer dosage, cake solids as high as 30percent were achieved with a belt f i l ter press. Advantages of the belt f i l terpress cake were that i t had relatively few inert chemical solids and it waseasily broken up, which are desirable cake characteristics for disposal eitherby composting or by incineration.
Based upon the results of the dewatering demonstration and an economicevalution of each treatment alternative, the belt f i l ter press system wasselected as the most cost-effective and most compatible with the disposaloptions considered feasible for implementation (composting or incineration).
A dewatering building housing eight 2.5-m Belt Press Dewatering belt f i l terpresses has been constructed (23), yet the facility was not being operated asof May 1982. There was tremendous public opposition to the plans for dewater-ing, composting, and landfill disposal, due to the possibility of contamina-ting the major water aquifer on Long Island. Because of this, the digestedsludge is currently barged at 2.5 percent solids 19 km (12 mi) off the coastfor ocean disposal. Current plans are for a continuation of this method ofsludge disposal (24).
9.10 San Jose-Santa Clara Water Pollution Control Plant (California)
In 1977, a facili t ies planning study for the handling and disposal ofwastewater sludge solids at the 6.26 cu m/s (143 mgd) activated sludge plantwas started (25). In a preliminary screening the following devices or methodsto achieve the required unit processes were reviewed for the purpose ofdeveloping system alternatives.
Unit Process Method
1. Stabilization 1. Chlorine Oxidation2. Lime Treatment3. Heat Treatment4. Composting Raw Sludge5. Aerobic Digestion6. Anaerobic Digestion7. Aerobic-Anaerobic Digestion
145
Unit Process Method
2. Primary SludgeThickening
3. Conditioning
4. Sludge Dewatering
5. Final Disposal
1. Centrifuge2. Gravity Thickening3. Dissolved Air Flotation
1. Polymer2. Elutriation3. Heat Treatment4. Ferric Chloride and Lime
1. Rotary Vacuum Filter2. Centrifuge3. Filter Press4. Belt Filter5. Sandbed Drying6. Asphalt Drying7. Drying of Lagoon Sludge
1. Compost and Market Product2. Landfill On-Site3. Landfill - Off-Site
Primary sludge thickening was considered because during the canning season(July through August), large quantities of primary solids are removed.Primary sludge thickening would reduce the volume of sludge for digestion andwas considered as an alternative to increasing digester capacity.
All stabilization alternatives were excluded except anaerobic digestion andlime stabilization primarily because of high costs and incompatibility withexisting anaerobic digestion facilities. Elutriation for digested sludgeconditioning was eliminated because of incompatibility with existing secondarytreatment facilities.
All other methods were retained at this stage of analysis. Several pilot plantand laboratory studies were conducted to obtain information needed for thedevelopment and comparison of project alternatives, including anaerobicdigestion, heat treatment of digested sludge, mechanical dewatering, primarysludge thickening, lime stabilization, and large scale solar dewatering.
The following types of mechanical dewatering devices were field tested onbench-scale and pilot-scale units during canning and noncanning seasons on ananaerobically digested mixture of primary and waste activated sludge:
1. Centrifuge (high and low speed)2. Belt Filter Press3. Filter Press (high pressure fixed volume and diaphragm)4. Vacuum Filter
The San Jose sludge was found to be difficult to dewater on all types ofmechanical dewatering devices. Higher than expected chemical dosages and lower
146
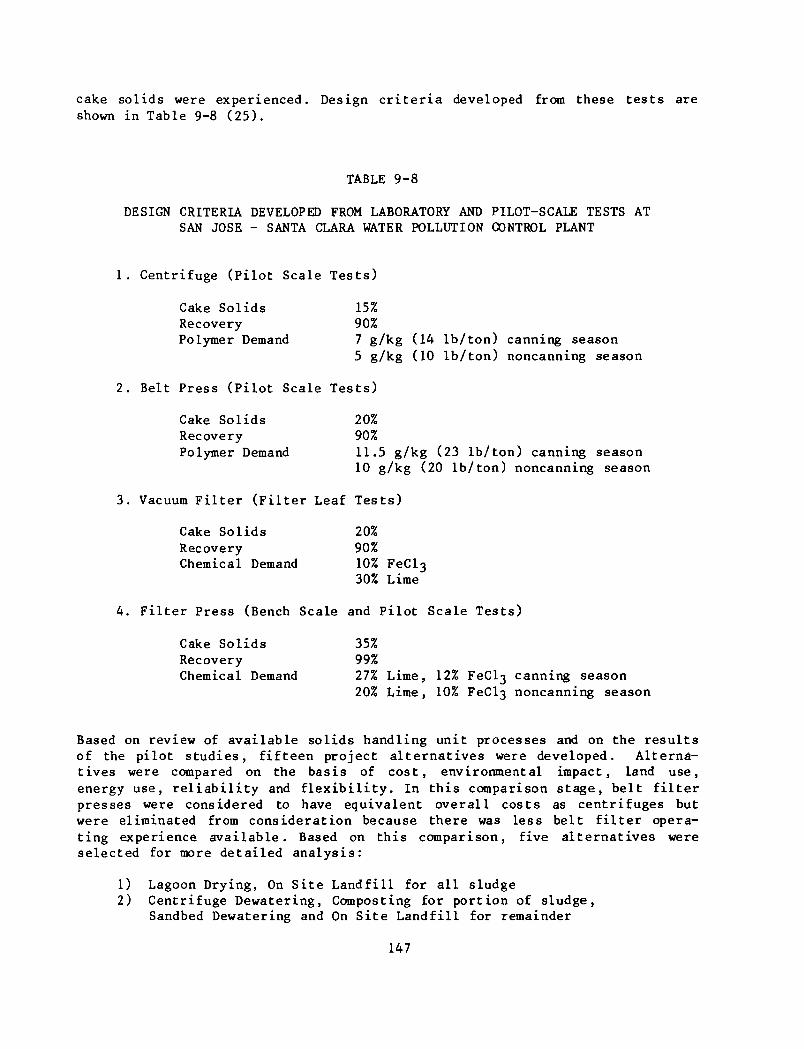
cake solids were experienced. Design criteria developed from these tests areshown in Table 9-8 (25).
TABLE 9-8
DESIGN CRITERIA DEVELOPED FROM LABORATORY AND PILOT-SCALE TESTS ATSAN JOSE - SANTA CLARA WATER POLLUTION CONTROL PLANT
1. Centrifuge (Pilot Scale Tests)
Cake Solids 15%Recovery 90%Polymer Demand 7 g/kg (14 lb/ton) canning season
5 g/kg (10 lb/ton) noncanning season
2. Belt Press (Pilot Scale Tests)
Cake Solids 20%Recovery 90%Polymer Demand 11.5 g/kg (23 lb/ton) canning season
10 g/kg (20 lb/ton) noncanning season
3. Vacuum Filter (Filter Leaf Tests)
Cake Solids 20%Recovery 90%Chemical Demand 10% FeCl3
30% Lime
4. Filter Press (Bench Scale and Pilot Scale Tests)
Cake Solids 35%Recovery 99%Chemical Demand 27% Lime, 12% FeCl3 canning season
20% Lime, 10% FeCl3 noncanning season
Based on review of available solids handling unit processes and on the resultsof the pilot studies, fifteen project alternatives were developed. Alterna-tives were compared on the basis of cost, environmental impact, land use,energy use, reliability and flexibility. In this comparison stage, belt filterpresses were considered to have equivalent overall costs as centrifuges butwere eliminated from consideration because there was less belt filter opera-ting experience available. Based on this comparison, five alternatives wereselected for more detailed analysis:
1) Lagoon Drying, On Site Landfill for all sludge2) Centrifuge Dewatering, Composting for portion of sludge,
Sandbed Dewatering and On Site Landfill for remainder
147
3) Centrifuge Dewatering to Compost for portion of sludge,Lagoon Drying and On Site Landfill for remainder
4) Filter Press Dewatering, Composting for portion of sludge,Sandbed Drying and On Site Landfill for remainder
5) Filter Press Dewatering, Composting for portion of sludge,Lagoon Drying and On Site Landfill for remainder
These alternatives were more closely compared by determining factors forcomparison, assigning a relative weight to each factor and assigning a valuefor each alternative. The factors used in the final evaluation were:
annual cost land useenvironmental effects dewatering flexibilitydewatering experience disposal flexibilityweather dependency chemical usemarket constraint resource recoveryenergy
Alternative 2, consisting of anaerobic digestion for stabilization, acombination of centrifuging, sandbed drying, and lagoon drying for dewatering,and compost/market and landfill for disposal, had the highest total score andwas selected as the apparent best alternative system. No preference was madefor either high-speed or low-speed centrifuges.
As of May 1982, no design or construction of the recommended dewateringfacilities had begun. There were plans to construct additional anaerobicdigesters, and this would precede any construction of new dewatering facili-ties. Current practice is to dispose of digested sludge in on-site sludgelagoons (26).
9.11 Blue Plains Wastewater Treatment Plant (District of Columbia)
In 1976 and 1977, a study was conducted of pilot-scale dewatering devicescapable of producing high-solids sludge cakes (27). This study was funded byEPA Region III and EPA's Municipal Environmental Research Laboratory inCincinnati.
The pilot-scale dewatering processes investigated were:
Vacuum filterVacuum filter retrofit (add-on) units - three manufacturersBelt Press - two manufacturersFixed volume filter press - two manufacturers, one high pressure and one
low pressureDiaphragm filter press - three manufacturers
148
The ultimate plan at the time of this study was to dewater and incinerate thesludge. While the plant had vacuum f i l te rs , incinerators had not beenobtained. Recent fuel cost increases appeared to have changed the cost-effectiveness of incineration of vacuum filtered sludge cake, and the studywas conducted to evaluate several dewatering processes capable of producingcakes with significantly higher solids contents than vacuum f i l ters .
Feed solids to the units averaged 5% total solids with a range of 2.4 to 10%.Several different ratios of raw primary sludge to raw WAS were tested, withemphasis on a 33:67 rat io . Conditioning chemicals investigated were lime,ferric chloride and polymer.
Conclusions of the study (27) were:
Chemical Conditioning
• The lime and ferric chloride dosages required to produce a filterablesludge varied with the percentage of WAS. Fibrous primary sludgefiltered quite readily; WAS required greater quantities of condition-ers and was more difficult to dewater. Generally, a 3/1 ratio oflime-to-ferric chloride was optimum for conditioning the raw BluePlains sludge. Bench-scale fi l terabil i ty tests were found to be usefulwhen optimizing and controlling the lime and ferric chloride dosages.
• Polymer conditioning of the raw 33:67 mixture of primary-to-WAS sludgewas generally ineffectual. No single polymer was found which couldadjust to the daily variations in the quality of sludge received fromthe primary and secondary treatment processes.
Filter Press-General
• Each of the filter presses was capable of dewatering all sludge ratiosand total feed solids in the range of 2.4 to 10% to at least a 30%solids cake. The diaphragm press, however, was the only unit capableof dewatering the marginally conditioned sludges to the 35% solidsrequired for an autocombustible cake.
• Once a minimum chemical conditioning requirement of lime and ferricchloride for adequate dewatering was established, increases in f i l t ra-tion yields (up to 20%) were obtained by slight increases in chemicaldosages.
• In all the presses, suspended solids recovery in the fil ter cake wasgreater than 99%. The quantity of suspended solids in the f i l t rate wasaffected primarily by the type of f i l ter cloth used and the degree ofchemical conditioning.
• The filter presses did not satisfactorily dewater polymer conditionedsludges.
• The average specific resistance-to-filtration parameter was correlateddirectly with filter press yield.
149
Filter Press - Diaphragm Unit
• Average results for conditioning with 19.6% lime and 6.5% FeCl3» anddewatering a 33:67 mixture of raw primary and WAS were a 38.7% solidscake with a yield between 2.39 and 2.93 kg/sq m/hr (0.49 to 0.6 lb/sqf t /hr ) . The pumping pressure required to feed the press was alwaysless than 690 kPa (100 psig). The pumping cycle time averaged 17minutes and was controlled by monitoring the total solids feed rate. Asqueezing pressure of 1,470 kPa (213 psig) was generally used. Thesqueezing cycle time (18 minutes) was controlled by filtering to aspecified f i l t ra te flow rate.
• Different f i l ter cloths were tested on both presses. All gaveacceptable f i l t ra te quality, but cloth l i fe , resistance to abrasion,etc . , were not evaluated.
Filter Press - Fixed Volume Unit
• The high-pressure press (225 psig) had an averge fi l tration yield of1.51 kg/sq m/hr (.31 lb/sq ft/hr) and required 62.3% more fi l trationarea than the diaphragm presses to produce equivalent results . Thelow-pressure press (100 psig) had an average full-scale yield of 1.07kg/sq m/hr (.22 lb/sq ft/hr) and needed 126.8% more f i l ter area thanthe diaphragm presses to produce equivalent results .
• Cycle time on the presses averaged 2-3 hours and was determined byfiltering to a specified f i l t ra te flow rate.
• The cakes from the fixed volume presses always contained a dry outersection and a wetter inner core. This resulted in a substantialvariation in the solids content across the cake.
Belt Press
• Because of the highly variable sludge at Blue Plains, no polymer wasfound that could adjust to these variations and adequately conditionthe sludge at all times. The operation of the belt press, therefore,was not consistent.
• With thickened sludge feeds, the press capacity, final cake solids,and polymer consumption were all affected by the percentage of waste-activated sludge. The unit performed best when dewatering highpercentages of fibrous, primary sludge.
• Suspended solids recovery in the f i l te r cake averaged only 95%. Thiswas felt to be insufficient due to plant discharge requirements.
Vacuum Filter Retrofit Unit
• The only vacuum fi l ter retrofit device which showed promise was thehigh-pressure section of the continuous belt press when used tofurther dewater the vacuum f i l ter cake. Cake solids of 35% were
150
• achieved in bench-scale work; however, demonstration of the system ina full-scale test was not successful because of problems with feedingthe vacuum filtered cake to the press.
Economic Comparison
• The belt press at $35.63/Mg ($32.39/ton) and the vacuum filter at$43.01/Mg (S39.10/ton) provided the lowest cost for dewatering.
• Dewatering costs for each of the filter presses were nearly equal withunit costs of approximately $60.50/Mg ($55 .00/ton).
As of July 1982, the Blue Plains plant is vacuum filtering two sludge types:anaerobically digested sludge and raw sludge, which have been conditioned withlime and ferric chloride. Dewatered sludge is composted. Future plans areindefinite, but should incineration become a viable alternative, it is likelythe District would elect to dewater by pressure filtration. This choice isbecause of the desire to produce an autogenous sludge cake (28).
9.12 References
1. "Mechanical Dewatering Study - Los Angeles County Sanitation Districts,"LA/OMA Project, Regional Wastewater Solids Management Program, LosAngeles-Orange County Metropolitan Area, September 1980.
2. Harrison, J. R., "Review of Developments in Dewatering WastewaterSludges," Sludge Treatment and Disposal, Volume 1 - Sludge Treatment,USEPA - Center for Environmental Research Information, Cincinnati, Ohio,45268, EPA-625/4-78-012, October 1978.
3. Trubiano, R., Bachtel, D., LeBrun, T., and Horvath, R., "ParallelEvaluation of Low Speed Scroll Centrifuges and Belt Filter Presses forDewatering Municipal Sewage Sludge," Draft EPA Report, Contract68-03-2745, 1981. (Authors are with County Sanitation Districts of LosAngeles County, Whittier, California)
4. Personal communication, Thomas J. LeBrun, Supervisor of Research Section,Joint Water Pollution Control Plant, County Sanitation Districts of LosAngeles County, Carson, California, June 1982.
5. Personal communication, Richard T. Moll, Manager of Process Engineering,Sharpies-Stokes Division, Pennwalt Corporation, Warminster, Pennsylvania,June 9, 1982.
6. John Carollo Engineers, "Design Memorandum No. 5 - Dewatering Methods,"County Sanitation Districts of Orange County, Fountain Valley,California, April 1979.
151
7. "Mechanical Dewatering Study - Orange County Sanitation Districts,"LA/OMA Project, Regional Wastewater Solids Management Program, LosAngeles-Orange County Metropolitan Area, September 1980.
8. Personal communication, Blake P. Anderson, Chief of Operations, CountySanitation Districts of Orange County, Fountain Valley, California, June1982.
9. CH2^~Hi.H> "Michelson Water Reclamation Plant - Engineering Report forDewatering Equipment Selection," Irvine Ranch Water District, Irvine,California, June 1979.
10. Tavery, M. A., "Evaluation of Sludge Dewatering Equipment at the MetroDenver Sewage District," paper presented at the Colorado AWWA-WPCA Tech-nical Activities Committee, May 3, 1979. (Author is with the MetropolitanDenver Sewage Disposal District No. 1, Denver, Colorado).
11. Personal communication, Mary Ann Tavery, Metropolitan Denver SewageDisposal District No. 1, Denver, Colorado, March 1981.
12. Personal communication, Colin McKenna, Facilities Engineer, MetropolitanDenver Sewage Disposal District No. 1, Denver, Colorado, June 1982.
13. Ingersoll-Rand, "Laboratory Test Report - Denver Metro - AnaerobicallyDigested Sludge," Ingersoll-Rand Company, Nashua, New Hampshire, April20-21, 1981.
14. Personal communication, Kenneth A. Pietila, "Detailed Review of DraftProcess Design Manual for Dewatering Municipal Wastewater Sludge,"February 26, 1982. (Author is with Rexnord in Milwaukee, Wisconsin)
15. Zenz, D. R., et al., "Evaluation of Unit Processes for Dewatering ofAnaerobically Digested Sludge at Metro Chicago's Calumet Sewage TreatmentPlant," The Metropolitan Sanitary District of Greater Chicago, October1976.
16. Sawyer, Bernard; Watkins, Robert; and Lue-Hing, Cecil, "Evaluation ofUnit Processes for Mechanical Dewatering of Anaerobically Digested Sludgeat Metro Chicago's West-Southwest Sewage Treatment Plant," Paperpresented at the 31st Annual Purdue Industrial Waste Conference, May1976. (Authors are with the Research and Development Department of TheMetropolitan Sanitary District of Greater Chicago)
17. Personal communication, David R. Zenz, Coordinator of Research,Metropolitan Sanitary District of Greater Chicago, May-June, 1982.
18. Kupper Associates and Metcalf & Eddy, Inc., "Pilot Plant DewateringTesting For The Recommended Land-Based Sludge Management Plan," MiddlesexCounty Sewerage Authority, New Jersey, January 1979.
19. Personal communication, Allan Jacobs, Vice President, Metcalf & Eddy,Somerville, New Jersey, July 1982.
152
20. Moser, J.H., et.al., "Milwaukee Water Pollution Abatement Program SolidsHandling Study," Milwaukee Metropolitan Sewerage District, May 1981.(Author is with Milwaukee Metropolitan Sewerage District)
21. Personal communication, John H. Moser, Milwaukee Metropolitan SewerageDistrict, Milwaukee, Wisconsin, May 1982.
22. Greenhorne & O'Mara Engineers," Nassau County Sludge Study Composting andDewatering Demonstration Program—Final Report," July 1979. (Greenhorne &O'Mara Engineers are in Riverdale, Maryland)
23. Personal communication, Ray Advendt, Greenhorne & O'Mara Engineers,Riverdale, Maryland, May 1982.
24. Personal communication, John J. Pascucci, Department of Public Works,Nassau County, New York, May 1982.
25. Consoer, Townsend & Associates Ltd., "Draft Project Report - SludgeProcessing Facilities Plan For the Cities of San Jose and Santa Clara,California," May 1980.
26. Personal communication, Douglas C. Humphrey, Sanitary Engineer, SanJose/Santa Clara Water Pollution Control Plant, San Jose, California, May1982.
27. Cassel, Alan F. and Johnson, Berinda, P., "Evaluation of DewateringDevices for Producing High-Solids Sludge Cake," USEPA - MunicipalEnvironmental Research Laboratory, Cincinnati, Ohio, 45268,EPA-600/2-79-123, August 1979.
28. Personal communication, Russ Thomas, Superintendent of District ofColumbia's Wastewater Treatment Plant at Blue Plains, Washington, D. C.,July 30, 1982.
153
APPENDIX A
MANUFACTURERS OF DEWATERING EQUIPMENT
During Che l a s t s eve ra l y e a r s , a number of well known manufacturers havewithdrawn from the produc t ion of dewater ing equipment, while o the r s haveentered the field with new products. Table A-l presents a listing of suppliersof different dewatering equipment which is intended to be up-to-date andcomplete, although it is possible that some manufacturers are excluded. Due tothe dynamic nature of the equipment manufacturing business, i t is probable inthe future that some on the l ist may discontinue making the equipment.References such as the Journal Water Pollution Control Federation, PollutionEquipment News, and Water & Wastes Digest should be consulted for additionalsuppliers.
This listing is presented as an aid to individuals involved in the selectionof equipment, and does not represent an endorsement of any particular manufac-turer or piece of equipment by either the EPA or Culp/Wesner/Culp. Suppliersare listed alphabetically, and the order of presentation does not constitutean order of preference.
154
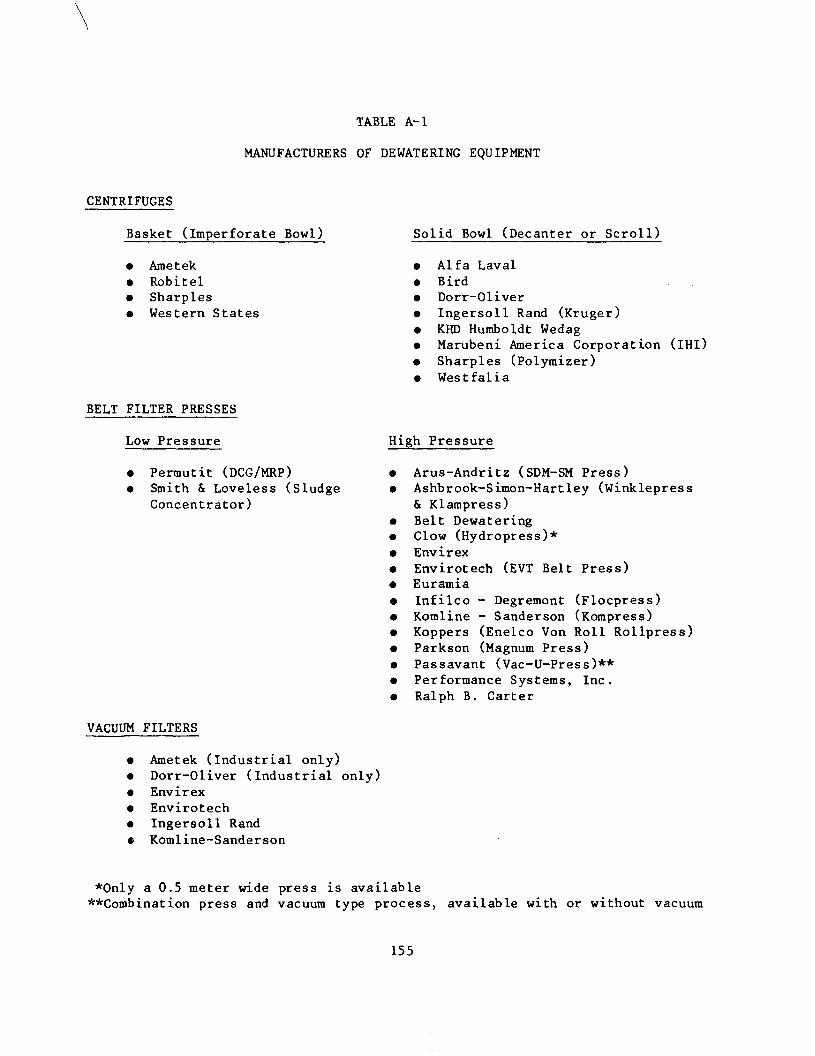
TABLE A-l
MANUFACTURERS OF DEWATERING EQUIPMENT
CENTRIFUGES
Basket (Imperforate Bowl)
• Ametek• Robitel• Sharpies• Western States
BELT FILTER PRESSES
Low Pressure
• Permutit (DCG/MRP)
• Smith & Loveless (SludgeConcentrator)
VACUUM FILTERS
Solid Bowl (Decanter or Scroll)
Alfa LavalBirdDorr-OliverIngersoll Rand (Kruger)KHD Humboldt WedagMarubeni America Corporation (IHI)Sharpies (Polymizer)Westfalia
High Pressure
Arus-Andritz (SDM-SM Press)Ashbrook-S imon-Hartley (Winklepres s& Klampress)Belt DewateringClow (Hydropress)*EnvirexEnvirotech (EVT Belt Press)EuramiaInfilco - Degremont (Flocpress)Komline - Sanderson (Kompress)Koppers (Enelco Von Roll Rollpress)Parkson (Magnum Press)Passavant (Vac-U-Press)**Performance Systems, Inc.Ralph B. Carter
Ametek (industrial only)Dorr-Oliver (Industrial only)EnvirexEnvirotechIngersoll RandKomiine-Sanderson
*Only a 0.5 meter wide press is available**Combination press and vacuum type process, available with or without vacuum
155
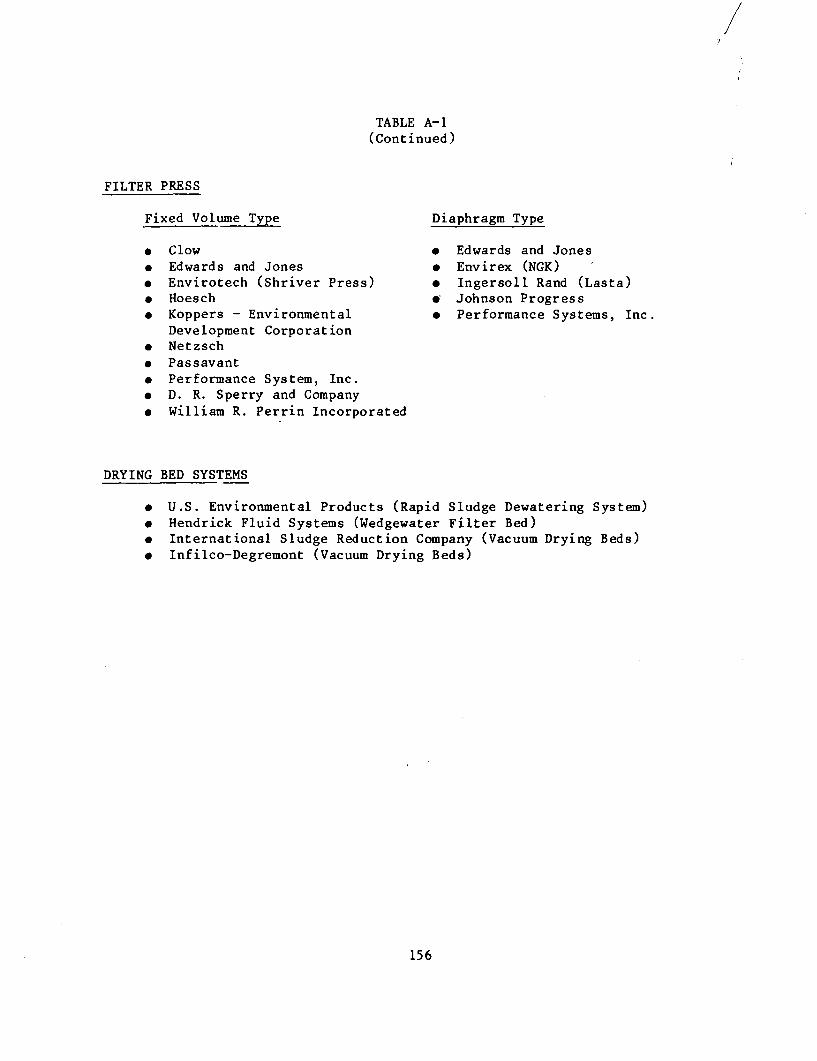
TABLE A-l(Continued)
FILTER PRESS
Fixed Volume Type
ClowEdwards and JonesEnvirotech (Shriver Press)HoeschKoppers - EnvironmentalDevelopment CorporationNetzschPassavantPerformance System, Inc.D. R. Sperry and CompanyWilliam R. Perrin Incorporated
Diaphragm Type
• Edwards and Jones• Envirex (NGK)• Ingersoll Rand (Lasta)• Johnson Progress• Performance Systems, Inc
DRYING BED SYSTEMS
• U.S. Environmental Products (Rapid Sludge Dewatering System)• Hendrick Fluid Systems (Wedgewater Filter Bed)• International Sludge Reduction Company (Vacuum Drying Beds)• Infilco-Degremont (Vacuum Drying Beds)
156
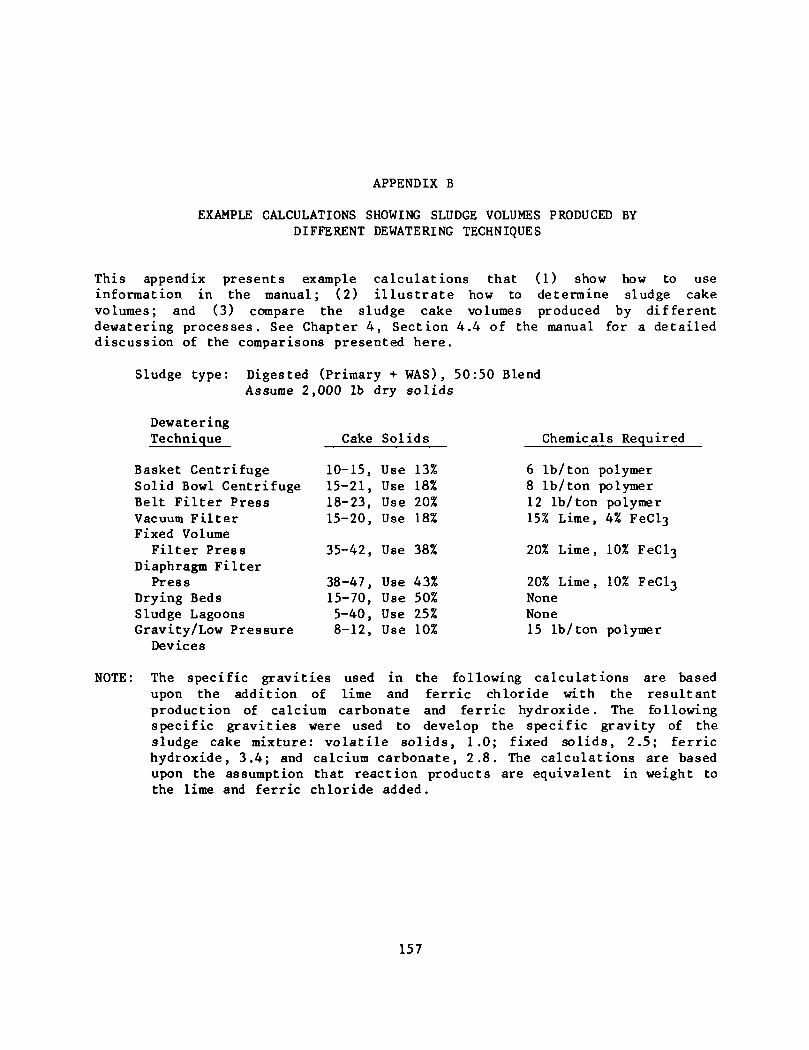
APPENDIX B
EXAMPLE CALCULATIONS SHOWING SLUDGE VOLUMES PRODUCED BYDIFFERENT DEWATERING TECHNIQUES
This appendix presents example calculations that (1) show how to useinformation in the manual; (2) illustrate how to determine sludge cakevolumes; and (3) compare the sludge cake volumes produced by differentdewatering processes. See Chapter 4, Section 4.4 of the manual for a detaileddiscussion of the comparisons presented here.
Sludge type:
DewateringTechnique
Digested (Primary + WAS), 50:50 BlendAssume 2,000 lb dry sol ids
Basket CentrifugeSolid Bowl CentrifugeBelt Filter PressVacuum FilterFixed Volume
Filter PressDiaphragm Filter
PressDrying BedsSludge LagoonsGravity/Low Pressure
Devices
Cake Solids
10-15, Use 13%15-21, Use 18%18-23, Use 20%15-20, Use 18%
35-42, Use 38%
38-47, Use 43%15-70, Use 50%5-40, Use 25%8-12, Use 10%
Chemicals Required
6 lb/ton polymer8 lb/ton polymer12 lb/ton polymer15% Lime, 4%
20% Lime, 10% FeCl3
20% Lime, 10% FeCl3
NoneNone15 lb/ton polymer
NOTE: The specific gravities used in the following calculations are basedupon the addition of lime and ferric chloride with the resultantproduction of calcium carbonate and ferric hydroxide. The followingspecific gravities were used to develop the specific gravity of thesludge cake mixture: volatile solids, 1.0; fixed solids, 2.5; ferrichydroxide, 3.4; and calcium carbonate, 2.8. The calculations are basedupon the assumption that reaction products are equivalent in weight tothe lime and ferric chloride added.
157
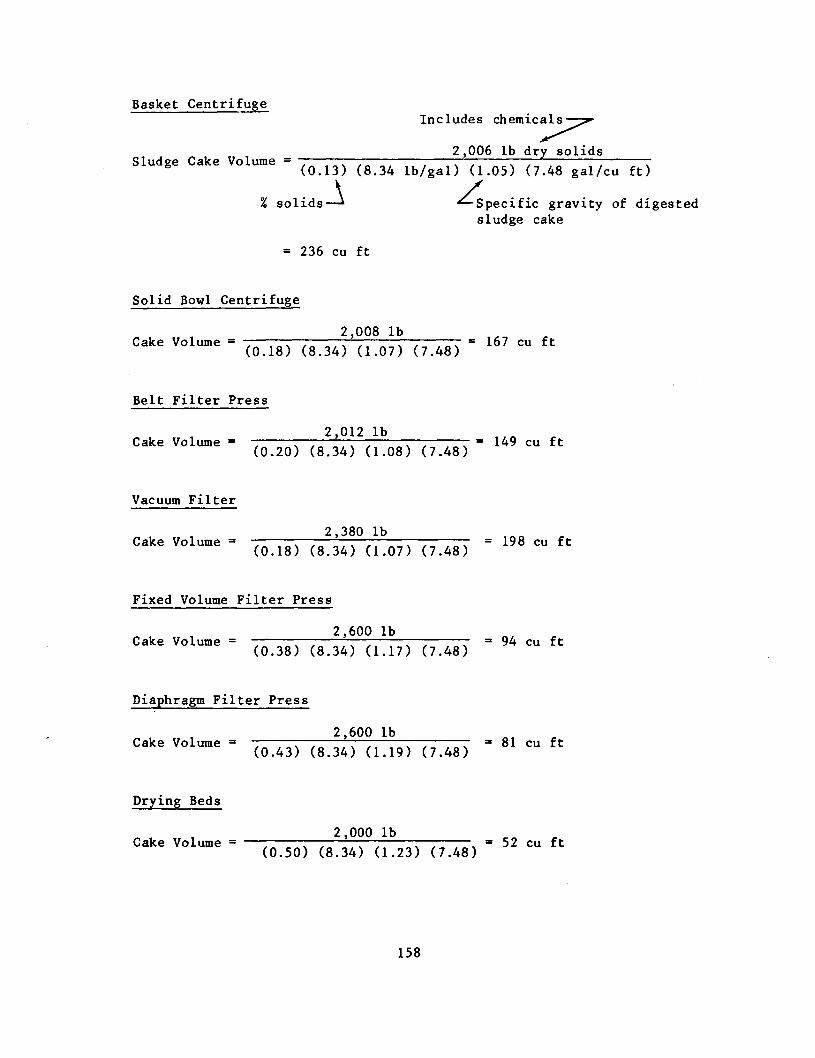
Basket CentrifugeIncludes chemicals-
2,006 lb dry solidsSludge Cake Volume = •*
(0.13) (8.34 lb/gal) (1.05) (7.48 gal/cu ft)
\ /% solids—* ^-Specific gravity of digested
sludge cake
= 236 cu ft
Solid Bowl Centrifuge
2,008 lb
(0.18) (8.34) (1.07) (7.48)
Belt Filter Press
(0.20) (8.34) (1.08) (7.48)
Vacuum Filter
(0.18) (8.34) (1.07) (7.48)
Fixed Volume Filter Press
2,600 lbCake Volume = — — —— r = 94 cu ft
(0.38) (8.34) (1.17) (7.48)
Diaphragm Filter Press
2,600 lb
(0.43) (8.34) (1.19) (7.48)
Drying Beds
2,000 lb
(0.50) (8.34) (1.23) (7.48)
158
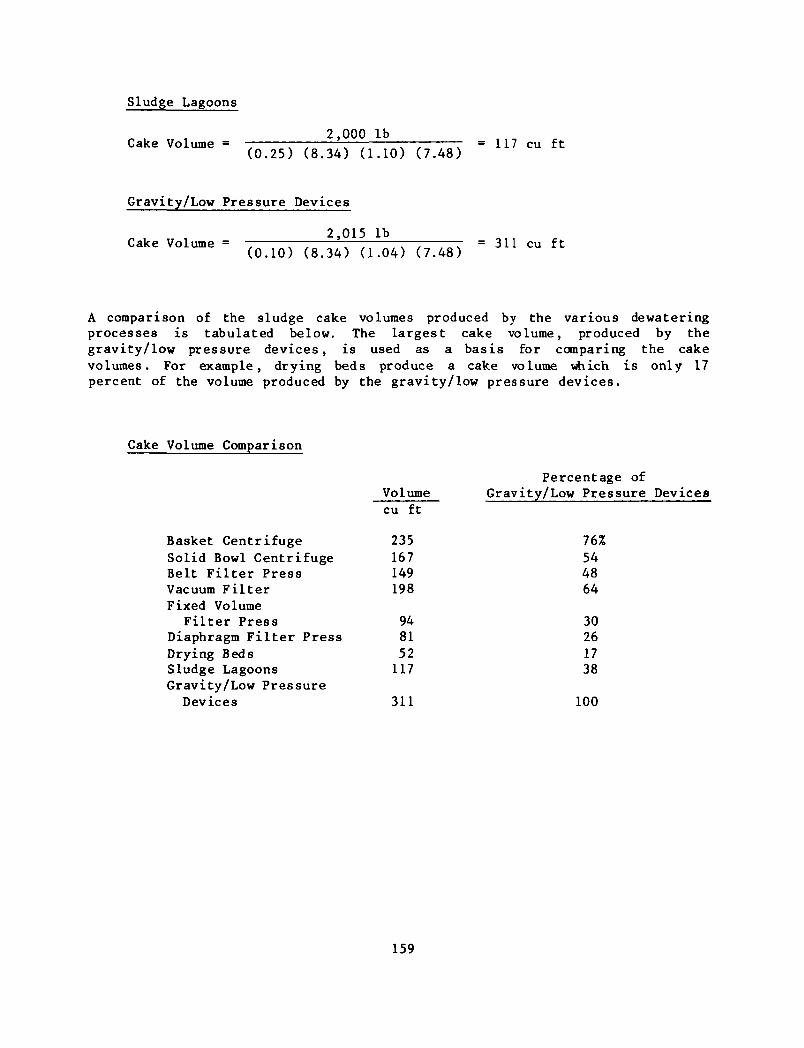
Sludge Lagoons
2,000 lbCake Volume = —— *-— :—; = 117 cu ft
(0.25) (8.34) (1.10) (7.48)
Gravity/Low Pressure Devices
2,015 lb
(0.10) (8.34) (1.04) (7.48)
A comparison of the sludge cake volumes produced by the various dewateringprocesses is tabulated below. The largest cake volume, produced by thegravity/low pressure devices, is used as a basis for comparing the cakevolumes. For example, drying beds produce a cake volume which is only 17percent of the volume produced by the gravity/low pressure devices.
Cake Volume Comparison
Basket CentrifugeSolid Bowl CentrifugeBelt Filter PressVacuum FilterFixed Volume
Filter PressDiaphragm Filter PressDrying BedsSludge LagoonsGravity/Low PressureDevices
Volumecu ft
235167149198
948152117
311
Percentage ofGravity/Low Pressure Devices
76%544864
30261738
100
159
APPENDIX C
COST OF DEWATERING EQUIPMENT
C.I Introduction
This section presents costs for the construction and operation of ninedifferent dewatering processes. These processes in the order that they arepresented are:
Basket CentrifugeSolid Bowl Centrifuge - Low GSolid Bowl Centrifuge - High GBelt Filter PressVacuum FilterFilter Press - Fixed VolumeFilter Press - DiaphragmSand Drying BedsSludge Dewatering Lagoons
For each of these processes, curves are presented for construction cost,process and building energy, diesel fuel, maintenance material costs, labor,and total O&M cost.
C.I.I Construction Cost
The construction cost curves were developed from data supplied by equipmentmanufacturers, from actual bid prices, as well as from unit cost take-offsfrom both actual and conceptual designs. In developing the aggregate construc-t ion cost , separate cost estimates were made for eight principal components:(1) excavation and s i t e work; (2) manufactured equipment; (3) concrete; (4)s t e e l ; (5) labor; (6) pipe and valves; (7) e l ec t r i ca l equipment and processinstrumentation; and (8) housing. This approach was used to enhance theaccuracy of the cost data. Following development of the construction costs,15% was added for contingencies which might be expected to be encounteredduring construction. The construction cost for each unit process is presentedas a function of the most applicable design parameter for the process. Forexample, solid bowl centrifuge and belt press costs are presented in terms ofgpm of machine capacity, vacuum f i l t e r costs are presented versus square feetof f i l t e r surface area, and plate and frame press costs are presented versuscubic feet of machine capacity. This approach of selecting a most applicabledesign parameter was ut i l ized in both developing and presenting costs , as i tallows the costs to be u t i l i zed with the greatest degree of f l ex ib i l i t y .
160
The construction cost curves were developed using specific conceptual designsfor equipment sizing and layout. In these conceptual designs, single units ofequipment were used up to the maximum feasible size, and in larger installa-tions multiple pieces of equipment were used. When preliminary cost analysesare being conducted for smaller installations, however, often multiple unitsare desired for operational flexibility or standby purposes. In these cases,it is recommended that the cost curve be entered with the desired size, thenmultiply the cost by the number of units, and finally reduce this cost by afactor of 25-35% for economy of scale.
Construction cost curves are based upon costs experienced in April 1982. Itshould be recognized that the curve for construction cost is not capital cost.The curve does not include costs for special site work, general contractoroverhead and profit, engineering, land, legal, fiscal, and administrative workand interest during construction. These cost items are all more directlyrelated to the total cost of a project rather than the cost of any one of theindividual unit processes. These costs are therefore most appropriately addedfollowing cost summation of the individual unit processes, if more than oneunit process is required. Typically, these costs add 35 to 45%, depending onproject size and complexity, to the actual construction costs which are shownin the curves.
C.I.2 Operation and Maintenance Cost
Operation and maintenance requirements were developed from informationcollected at existing wastewater treatment facilities. For newer types ofequipment for which actual full-scale operating data are limited or not avail-able, such as the diaphragm filter press, O&M requirements which are presentedare based upon the manufacturers' estimates and the experience of theauthors.
Electrical energy requirements are presented for both building-related energyand process energy. Building energy includes heating, cooling, lighting andventilation, and was based upon the required building size and an annualrequirement of 904 kwh/sq m/yr (84 kwh/sq ft/yr). This number represents anaverage for 21 cities across the U.S., but it is highly variable and dependson heating and cooling requirements. It is suggested that this number beadjusted either upward or downward depending upon locally experienced require-ments. Process energy requirements are for motors required to drive and other-wise operate the dewatering mechanism and appurtenant equipment. Processenergy requirements will be constant from location to location. Electricalenergy costs are expressed in terms of kwh/yr, and, in calculating annual O&Mcosts, the electrical cost component can be calculated using the localelectrical cost in $/kwh. Certain processes such as sand drying beds andsludge dewatering lagoons require use of equipment which utilizes diesel fuel.Curves which are presented for diesel fuel requirements are presented in termsof gallons of fuel required per year.
Maintenance material cost includes the cost of periodic replacement ofcomponent parts necessary to keep the process operable and functioning.
161
Examples of maintenance material items which are required are valves, motors,instrumentation, and other process items of similar nature. Maintenancematerial cost shown in the curves are based upon April 1982 costs. The main-tenance material requirements do not include the cost of chemicals requiredfor process operation since chemical requirements will vary widely from sludgeto sludge.
The labor requirement curve includes both operation and maintenance laborand is presented in terms of hours per year. Labor requirements were basedupon 24 hour per day operation, including any required clean-up time.
A curve is also presented for total annual O&M costs. This curve was developedusing an electrical energy cost of $0.05/kwh, a diesel fuel cost of $0.30/1($1.15/gal) and a labor cost of $12/hour. If significantly different labor,electrical or diesel fuel costs are experienced, the total annual O&M costshould be adjusted as appropriate.
C.2 Basket Centrifuge
C.2.1 Construction Cost
Basket style centrifuges, because of design and operating features, areideally suited to dewatering of light and hard-to-handle sludges such as wasteactivated sludge. Construction costs are for single units at smaller capaci-t ies and multiple units at larger capacities. Centrifuge costs are forautomatic machines operating on a preprogrammed cycle, an approach whichrequires only minimal operator attention.
In addition to the basic machines, the costs include equipment for polymerpreparation, storage, and application. If other conditioning chemicals areused, the costs would have to be adjusted accordingly. The costs do notinclude sludge and centrate pumping, sludge conveying, and sludge storage. Itwas assumed that centrifuges are located in two story concrete block buildingswith bottom discharge to trucks or storage bins. Housing requirements weredeveloped from equipment manufacturers' recommended layouts.
Figure C-l presents construction costs for basket centrifuge installationswith total installed machine capacities between 0.15 and 30.7 1/s (3500 and700,000 gpd).
C.2.2 Operation and Maintenance Cost
Electrical energy requirements were computed from connected and operatinghorsepower information provided by equipment manufacturers. Basket centrifugeoperating horsepower, computed on the basis of a complete cycle involvingmachine acceleration, sludge feeding, skimming, decelerating, and sludgeplowing, averages 40 to 60 percent of the connected horsepower. Electrical
162
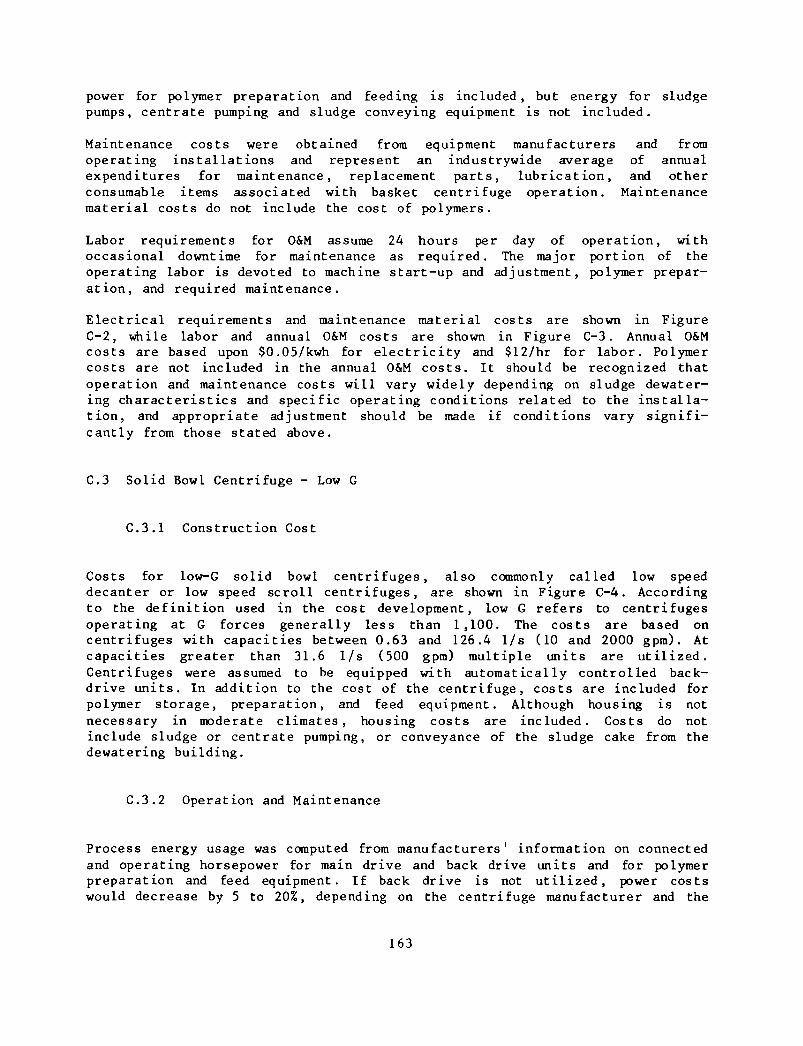
power for polymer preparation and feeding is included, but energy for sludgepumps, centrate pumping and sludge conveying equipment is not included.
Maintenance costs were obtained from equipment manufacturers and fromoperating installations and represent an industrywide average of annualexpenditures for maintenance, replacement parts, lubrication, and otherconsumable items associated with basket centrifuge operation. Maintenancematerial costs do not include the cost of polymers.
Labor requirements for O&M assume 24 hours per day of operation, withoccasional downtime for maintenance as required. The major portion of theoperating labor is devoted to machine start-up and adjustment, polymer prepar-ation, and required maintenance.
Electrical requirements and maintenance material costs are shown in FigureC-2, while labor and annual O&M costs are shown in Figure C-3. Annual O&Mcosts are based upon $0.05/kwh for electricity and $12/hr for labor. Polymercosts are not included in the annual O&M costs. It should be recognized thatoperation and maintenance costs will vary widely depending on sludge dewater-ing characteristics and specific operating conditions related to the installa-tion, and appropriate adjustment should be made if conditions vary signifi-cantly from those stated above.
C.3 Solid Bowl Centrifuge - Low G
C.3.1 Construction Cost
Costs for low-G solid bowl centrifuges, also commonly called low speeddecanter or low speed scroll centrifuges, are shown in Figure C-4. Accordingto the definition used in the cost development, low G refers to centrifugesoperating at G forces generally less than 1,100. The costs are based oncentrifuges with capacities between 0.63 and 126.4 1/s (10 and 2000 gpm). Atcapacities greater than 31.6 1/s (500 gpm) multiple units are utilized.Centrifuges were assumed to be equipped with automatically controlled back-drive units. In addition to the cost of the centrifuge, costs are included forpolymer storage, preparation, and feed equipment. Although housing is notnecessary in moderate climates, housing costs are included. Costs do notinclude sludge or centrate pumping, or conveyance of the sludge cake from thedewatering building.
C.3.2 Operation and Maintenance
Process energy usage was computed from manufacturers1 information on connectedand operating horsepower for main drive and back drive units and for polymerpreparation and feed equipment. If back drive is not utilized, power costswould decrease by 5 to 20%, depending on the centrifuge manufacturer and the
163
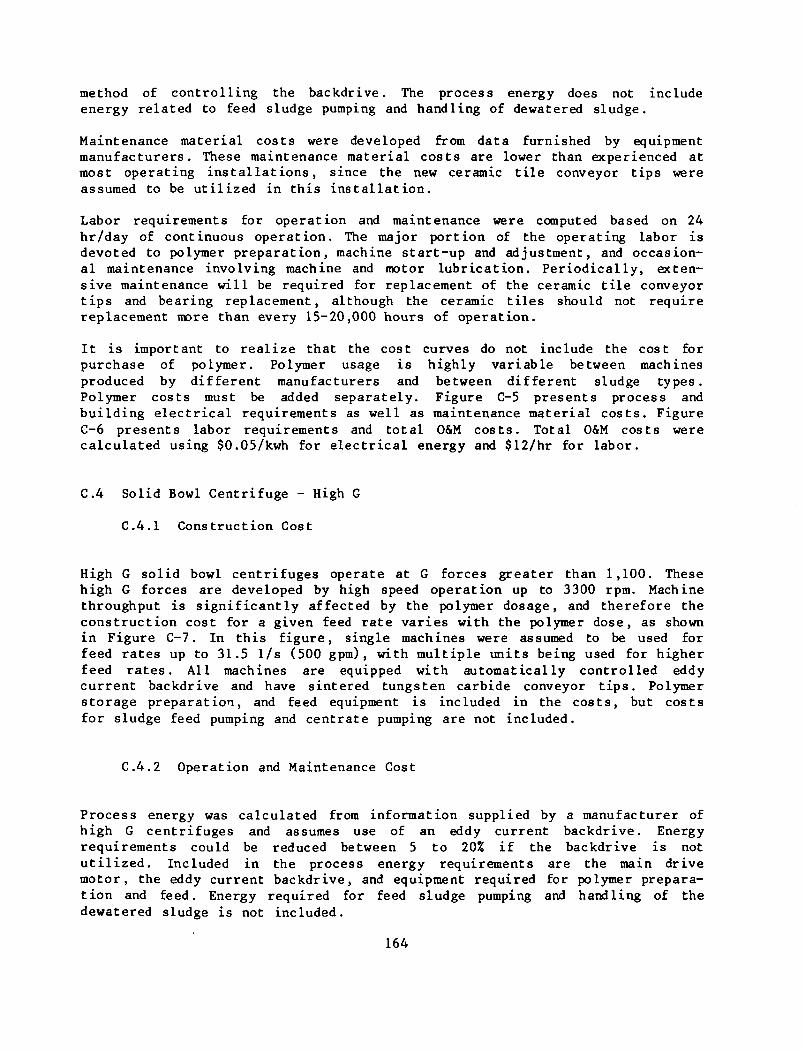
method of controlling the backdrive. The process energy does not includeenergy related to feed sludge pumping and handling of dewatered sludge.
Maintenance material costs were developed from data furnished by equipmentmanufacturers. These maintenance material costs are lower than experienced atmost operating installations, since the new ceramic tile conveyor tips wereassumed to be utilized in this installation.
Labor requirements for operation and maintenance were computed based on 24hr/day of continuous operation. The major portion of the operating labor isdevoted to polymer preparation, machine start-up and adjustment, and occasion-al maintenance involving machine and motor lubrication. Periodically, exten-sive maintenance will be required for replacement of the ceramic tile conveyortips and bearing replacement, although the ceramic tiles should not requirereplacement more than every 15-20,000 hours of operation.
It is important to realize that the cost curves do not include the cost forpurchase of polymer. Polymer usage is highly variable between machinesproduced by different manufacturers and between different sludge types.Polymer costs must be added separately. Figure C-5 presents process andbuilding electrical requirements as well as maintenance material costs. FigureC-6 presents labor requirements and total O&M costs. Total O&M costs werecalculated using $0.05/kwh for electrical energy and $12/hr for labor.
C.4 Solid Bowl Centrifuge - High G
C.4.1 Construction Cost
High G solid bowl centrifuges operate at G forces greater than 1,100. Thesehigh G forces are developed by high speed operation up to 3300 rpm. Machinethroughput is significantly affected by the polymer dosage, and therefore theconstruction cost for a given feed rate varies with the polymer dose, as shownin Figure C-7. In this figure, single machines were assumed to be used forfeed rates up to 31.5 1/s (500 gptn) , with multiple units being used for higherfeed rates. All machines are equipped with automatically controlled eddycurrent backdrive and have sintered tungsten carbide conveyor tips. Polymerstorage preparation, and feed equipment is included in the costs, but costsfor sludge feed pumping and centrate pumping are not included.
C.4.2 Operation and Maintenance Cost
Process energy was calculated from information supplied by a manufacturer ofhigh G centrifuges and assumes use of an eddy current backdrive. Energyrequirements could be reduced between 5 to 20% if the backdrive is notutilized. Included in the process energy requirements are the main drivemotor, the eddy current backdrive, and equipment required for polymer prepara-tion and feed. Energy required for feed sludge pumping and handling of thedewatered sludge is not included.
164
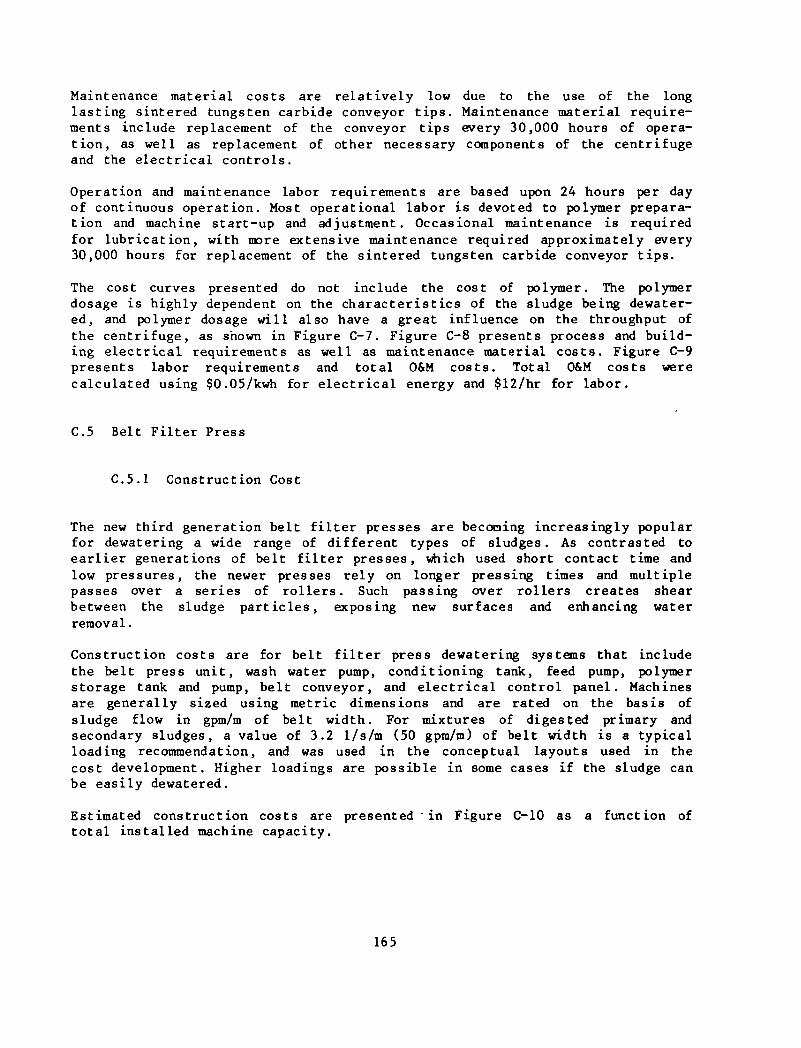
Maintenance material costs are relatively low due to the use of the longlasting sintered tungsten carbide conveyor t ips. Maintenance material require-ments include replacement of the conveyor tips every 30,000 hours of opera-tion, as well as replacement of other necessary components of the centrifugeand the electrical controls.
Operation and maintenance labor requirements are based upon 24 hours per dayof continuous operation. Most operational labor is devoted to polymer prepara-tion and machine start-up and adjustment. Occasional maintenance is requiredfor lubrication, with more extensive maintenance required approximately every30,000 hours for replacement of the sintered tungsten carbide conveyor t ips.
The cost curves presented do not include the cost of polymer. The polymerdosage is highly dependent on the characteristics of the sludge being dewater-ed, and polymer dosage will also have a great influence on the throughput ofthe centrifuge, as shown in Figure C-7. Figure C-8 presents process and build-ing electrical requirements as well as maintenance material costs. Figure C-9presents labor requirements and total O&M costs. Total O&M costs werecalculated using $0.05/kwh for electrical energy and $12/hr for labor.
C.5 Belt Filter Press
C.5.1 Construction Cost
The new third generation belt fi l ter presses are becoming increasingly popularfor dewatering a wide range of different types of sludges. As contrasted toearlier generations of belt f i l ter presses, which used short contact time andlow pressures, the newer presses rely on longer pressing times and multiplepasses over a series of rollers. Such passing over rollers creates shearbetween the sludge particles, exposing new surfaces and enhancing waterremoval.
Construction costs are for belt f i l ter press dewatering systems that includethe belt press unit, wash water pump, conditioning tank, feed pump, polymerstorage tank and pump, belt conveyor, and electrical control panel. Machinesare generally sized using metric dimensions and are rated on the basis ofsludge flow in gpm/m of belt width. For mixtures of digested primary andsecondary sludges, a value of 3.2 1/s/m (50 gpm/m) of belt width is a typicalloading recommendation, and was used in the conceptual layouts used in thecost development. Higher loadings are possible in some cases if the sludge canbe easily dewatered.
Estimated construction costs are presented in Figure C-10 as a function oftotal installed machine capacity.
165
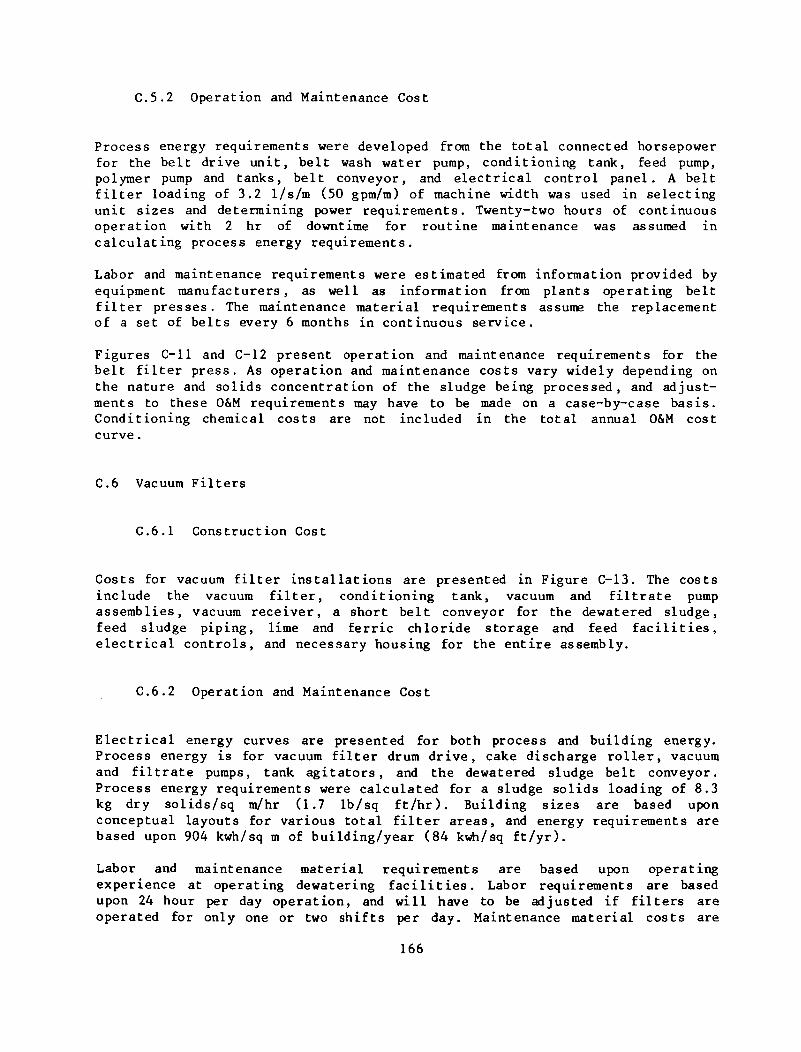
C.5.2 Operation and Maintenance Cost
Process energy requirements were developed from the total connected horsepowerfor the belt drive unit, belt wash water pump, conditioning tank, feed pump,polymer pump and tanks, belt conveyor, and electrical control panel. A beltf i l t e r loading of 3.2 1/s/m (50 gpm/m) of machine width was used in selectingunit sizes and determining power requirements. Twenty-two hours of continuousoperation with 2 hr of downtime for routine maintenance was assumed incalculating process energy requirements.
Labor and maintenance requirements were estimated from information provided byequipment manufacturers, as well as information from plants operating beltf i l ter presses. The maintenance material requirements assume the replacementof a set of belts every 6 months in continuous service.
Figures C-ll and C-12 present operation and maintenance requirements for thebelt f i l ter press. As operation and maintenance costs vary widely depending onthe nature and solids concentration of the sludge being processed, and adjust-ments to these O&M requirements may have to be made on a case-by-case basis.Conditioning chemical costs are not included in the total annual O&M costcurve.
C.6 Vacuum Filters
C.6.1 Construction Cost
Costs for vacuum filter installations are presented in Figure C-13. The costsinclude the vacuum filter, conditioning tank, vacuum and filtrate pumpassemblies, vacuum receiver, a short belt conveyor for the dewatered sludge,feed sludge piping, lime and ferric chloride storage and feed facilities,electrical controls, and necessary housing for the entire assembly.
C.6.2 Operation and Maintenance Cost
Electrical energy curves are presented for both process and building energy.Process energy is for vacuum filter drum drive, cake discharge roller, vacuumand filtrate pumps, tank agitators, and the dewatered sludge belt conveyor.Process energy requirements were calculated for a sludge solids loading of 8.3kg dry solids/sq m/hr (1.7 lb/sq ft/hr). Building sizes are based uponconceptual layouts for various total filter areas, and energy requirements arebased upon 904 kwh/sq m of building/year (84 kwh/sq ft/yr).
Labor and maintenance material requirements are based upon operatingexperience at operating dewatering facilities. Labor requirements are basedupon 24 hour per day operation, and will have to be adjusted if filters areoperated for only one or two shifts per day. Maintenance material costs are
166
for periodic repair and replacement of equipment. Costs are not included forpurchase of the lime or ferric chloride utilized for conditioning, sincechemical requirements are highly variable from sludge to sludge, and are notgenerally a function of vacuum fi l ter surface area.
Electrical energy and maintenance material costs are shown in Figure C-14, andlabor and total O&M costs are shown in Figure C-15. Total O&M costs werecalculated using a rate of $0.05/kwh for electrical energy and a rate of$12/hr for labor. Conditioning chemical costs are not included in the totalO&M cost.
C.7 Filter Press - Recessed Plate
C.7.1 Construction Cost
The recessed plate f i l ter press has gained popularity for dewatering sludgesbecause it can produce a high solids content cake suitable for incinerationor any other subsequent process requiring a high solids content sludge. Theintroduction of semi-automatic and fully automatic presses along with otherlabor and maintenance saving improvements has further stimulated interest inf i l ter presses.
Construction costs, as shown in Figure C-16, were developed for a series ofsingle and multiple recessed plate f i l ter press systems ranging in size from0.12 to 25.4 cu m (4.3 to 896 cu f t ) . The largest single press utilized inthe cost estimates had a capacity of 6.3 cu m (224 cu ft) . The constructioncosts include the f i l ter press, feed pumps (including one standby), a limestorage bin and feeders, ferric chloride liquid solution storage and feeders,a sludge conditioning and mixing tank, an acid wash system, and housing.Housing costs are for a two story, concrete block building, with the fi l terpress located on the upper floor and discharging through~»a floor opening to atruck located on the lower level.
C.7.2 Operation and Maintenance Cost
Operation and maintenance costs were developed for a f i l ter loading of 80 to90 kg dry solids/cu m/hr (5 to 5.6 lb/cu f t /hr) , a dry solids density of 1030kg/cu m (64 lb/cu f t) , and 19 hr of operation/day. The remaining 5 hr/daywould be devoted to press preparation, sludge removal, cleanup, and pressmaintenance.
Most of the process energy consumed by the fi l ter press is related tooperation of the sludge feed pump. Energy is also consumed by the open-closemechanism and the tray mover. Pumping power requirements were calculated for asolids loading of 4 percent at a cycle time of 2.25 hr, with a 20 minute turn-around time between cycles. Power required for chemical preparation, mixing,
167
and feeding is also included in process energy. Energy requirements related tobuilding heating, cooling, lighting, and ventilation were based upon a usageof 904 kwh/sq m/yr (84 kwh/sq ft/yr).
Maintenance material costs and labor requirements were estimated based onmanufacturers' experience and data from a number of operating installations.
Process and building electrical requirements and maintenance materialrequirements are shown in Figure C-17, and labor and annual O&M costs areshown in Figure C-18. Annual O&M costs do not include the cost for lime andferric chloride conditioning chemicals.
C 8 Filter Press - Diaphragm
C.8.1 Construction Cost
The diaphragm filter press has several operational advantages over aconventional recessed plate type filter press. One of the more importantadvantages is the production of a higher solids content cake, often up to 8%solids higher. Other advantages include more positive cake release, a shorteroverall cycle time, lower pumping pressure for sludge fed to the press, andthe ability to successfully dewater poorly conditioned sludges. Diaphragm typepresses are generally fully automatic, including automatic cloth washing. Theproduct cake solids content is varied by changing the time of compression,with compression being created by inflating the diaphragm.
Construction costs shown in Figure C-19 are for diaphragm presses with pressareas between 111 and 1398 sq m (1200 and 15,050 sq ft). The largest machinemanufactured is 557 sq m (6000 sq ft), and the larger areas shown in FigureC-19 are for multiple presses. The construction costs shown include thediaphragm press, feed pump, pumps for the diaphragm and cloth washing, vacuumpumps, an air compressor and receiver, lime and ferric chloride storage andfeed facilities, and all electrical and controls necessary for complete auto-matic operation. Housing is for a two story, concrete block building, with thefilter press discharging through an opening, in the floor to a truck on thelower level.
C.8.2 Operation and Maintenance Cost
Operation and maintenance costs were developed for a 4% feed of anaerobicallydigested sludge, chemically conditioned with 5% ferric chloride and a 20%lime. Press loading was 4.9 kg/sq m/hr (1.0 lb/sq ft/hr), without chemicals,and cake discharge was taken at 35X. Press operation time was 19 hours perday, with the remaining time dedicated to press cleanup and maintenance.
Process energy requirements are for the sludge feed pump, the air pump forinflating the diaphragm, and a vacuum pump for removal of liquid sludge
168
remaining in the internal piping prior to opening the press. Energy is alsorequired to open and close the press, for cloth washing, and for conditioningchemical preparation and feed. Building energy requirements are based upon 904kwh/sq m/yr (84 kwh/sq ft/yr).
Maintenance material costs consist principally, over 90%, of replacement ofdiaphragms and filter cloths. Other costs are for miscellaneous equipmentparts and for miscellaneous electrical components.
Labor required is for both operation and maintenance, with the majority of thelabor devoted to operational requirements. Labor requirements are based uponoperational experience of the manufacturer.
Electrical requirements for process energy and building energy, as well asmaintenance material requirements are presented in Figure C-20. Labor andannual O&M costs are shown in Figure C-21 . Conditioning chemical costs are notincluded in the annual O&M cost, since they vary widely between differentsludges. Chemical costs must be added separately to arrive at a total annualO&M cost.
C.9 Sand Drying Beds
C.9.1 Construction Cost
Sand drying beds are an economical method of producing a dry sludge cake fromdigested sludge. Sludge thickening prior to application on the drying beds isnot required, although thickening will decrease the area of beds required, andwill also decrease the time required for sludge drying. Dewatering on thesand beds is by a combination of draining and air drying, and beds performbest when both of these processes are optimized. Removal of dried sludge isnormally accomplished by front-end loader. Although sand drying beds offer alow-cost approach to sludge drying, this advantage may be offset by the amountand cost of the land area required and poor performance during cold and/or wetperiods.
Cost estimates are for uncovered and unlined sand drying beds. The estimatesinclude the sludge distribution piping, 23 cm (9 in) of sand media overlying23 cm (9 in) of gravel media, 0.6 m (2 ft) high concrete dividers betweenbeds, and an underdrain system to remove percolating water. Land costs andlining to prevent downward percolation are not included in the cost estimates.If bed lining or land purchase are required, the costs would have to beadjusted accordingly.
Construction cost estimates are presented in Figure C-22.
169
C.9.2 Operation and Maintenance Cost
Diesel fuel requirements are for a front-end loader to remove dried sludgefrom the beds and to prepare the bed for the next sludge application. A clean-ing and preparation time of 3 hr for a 372 sq m (4,000 sq ft) bed, a dieselfuel consumption of 15 1/hr (4 gal/hr), and 20 cleanings/bed per year wereused to calculate fuel requirements.
Maintenance material requirements are for replacement of sand lost during bedcleaning. One-quarter inch of sand loss per cleaning was used to calculatemaintenance material costs.
Labor costs are for sludge removal, bed preparation, and changing of valves todirect sludge flow to different drying beds. Labor costs were based uponexperience at a number of different locations.
The diesel fuel and maintenance material requirements are presented inFigure C-23 and labor and total annual O&M cost are presented in Figure C-24.Total annual O&M cost is based on a labor rate of $12/hr and a diesel fuelcost of $0.30/1 ($1.15/gal).
CIO Sludge Dewatering Lagoons
C.10.1 Construction Cost
Sludge dewatering or storage lagoons are used at many plants to receive,store, and partially dewater waste sludge before further treatment or ultimatedisposal. Depending on the climate for solar/air drying and the ability ofwater to percolate from the lagoon, sludge can thicken to a solids content of15 to 40 percent (20 to 25 percent average) during 6 months of storage.Generally, when sufficient land area is available, lagooning represents thelowest cost system for sludge dewatering. Other factors must also beconsidered however, particularly aesthetics.
Construction costs are for unlined lagoons with a 3 m (10 ft) sludge depth anda 0.6 m (2 ft) freeboard depth. Dikes were assumed to have a 3 m (10 ft) crestwidth and 3:1 side slopes. It was assumed that the excavation volume is equalto the dike f i l l volume. Lagoons were designed with an inlet structure thatwould prevent disturbance of settling material, and an outlet structure toskim clarified water.
Construction costs are presented in Figure C-25. The costs are shown as afunction of effective volume, which is the volume of the lagoon minus free-board volume. The costs do not include land cost or pond lining.
170
C.10.2 Operation and Maintenance Cost
Operation and maintenance requirements are primarily associated with sludgeremoval from the lagoons. Removal is generally done with a front-end loader orwith dragline dredging. Dredging is used to allow further dewatering by airdrying on the lagoon periphery. After air drying, the concentrated sludge isremoved by a front end loader. The costs and requirements presented are for acombination of these approaches. Sludge was assumed to be removed from alagoon, on the average of once every 2 years, and hauled in dump trucks towithin 1 mile of the lagoons. If a further haul distance is required, theadditive cost of this hauling must be added.
Energy costs are for diesel fuel for the front end loader and the dragline, aswell as for trucks to haul sludge one mile from the lagoons. Requirements arefor removal of 20% sludge, which is generally the lowest concentration thatsludge is removed from a lagoon. Requirements are expressed in terms of thevolume of sludge removed annually.
Periodic repair and maintenance of the lagoon dikes and the roadway at the topof the dike is required. These costs comprise the maintenance material costs.
Labor requirements consist of labor required for sludge removal from thelagoons, loading the sludge into dump trucks, hauling the sludge 1.6 km(1.0 mi) from the plant s i te , and maintenance of the roadways.
Figure C-26 presents diesel fuel and maintenance material costs, whileFigure C-27 presents labor and total annual O&M costs. Cost for total annualO&M is based on $0.30/1 ($1.15/gal) for diesel fuel and $12/hr for labor.
171
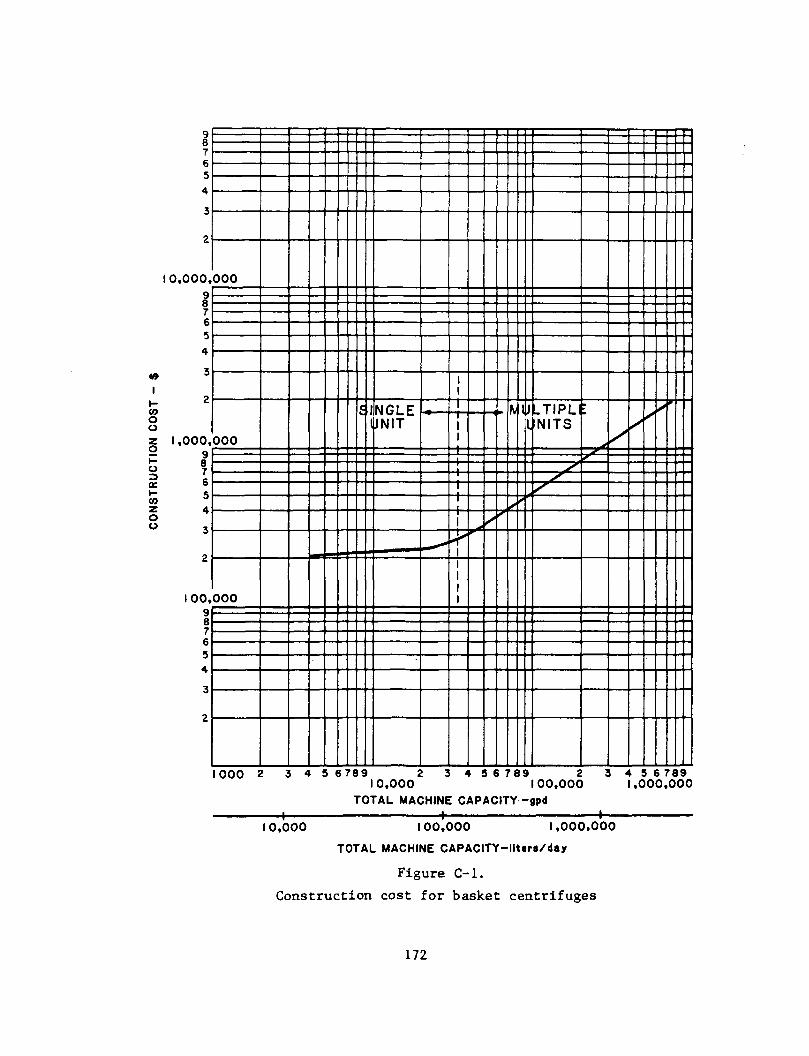
COou
ot -cozoo
987654
3
2
0,000,987654
3
2
1,000,9
654
3
2
100,987654
3
2
000
000
000
C4. INGLE
UNIT
. ———• —*-
*
1
""1
1-
M
^»'
IATIPLUNITS
—~?*\y
y*
1000 2 3 4 5 6789 210,000
3 4 5 6 789 2100,000
3 4 5 6 7891,000,000
T0TAL MACHINE CAPACITY -gpd-4- •+•
10,000 100,000 1,000,000
TOTAL MACHINE CAPACITY-llters/day
Figure C-l.
Construction cost for basket centrifuges
172
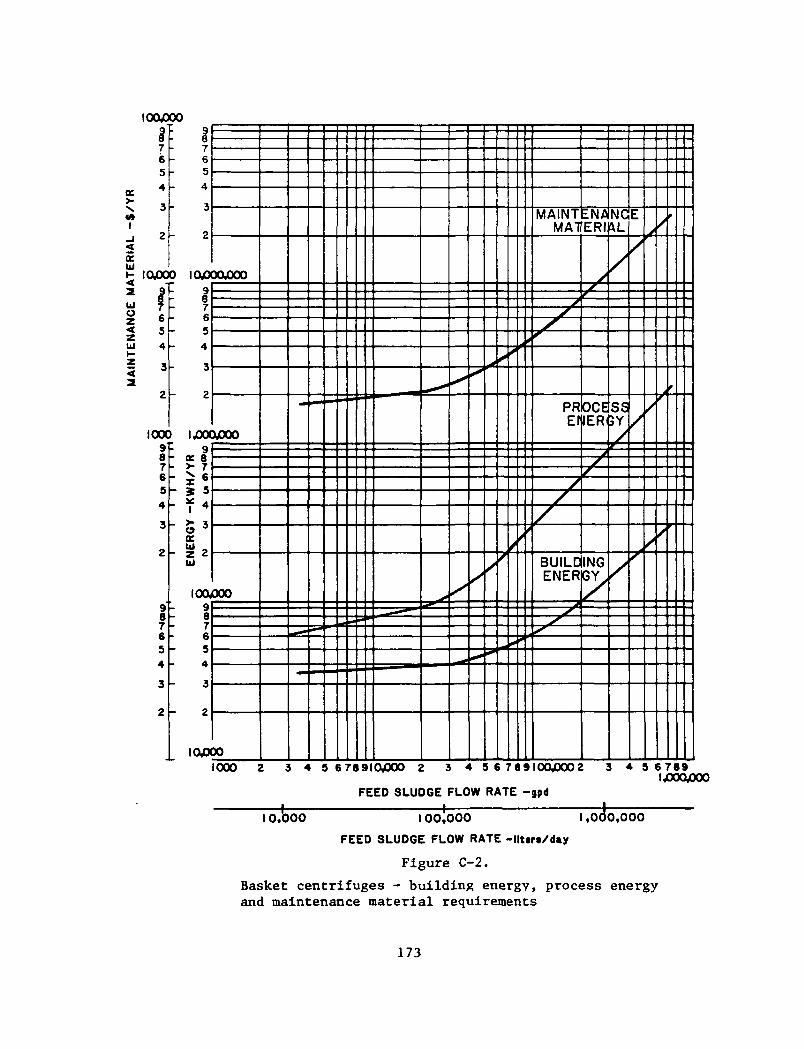
I0O000
>-•s
I
uzzUJ
7654
3
2
tOjOO9
f65
4
3
2
IOCX987654
3
2
9876S4
3
2
t Kl76543
2
0 lOgOl
t 8*L 6
54
3
2
> ijoa9
- <r 8EM- * 5
K * 4
r S3
cr
- Z*2UJ
ioar 9
87654
3
2
IOJCX
DOOOO
xooo
000
DO
M M
-
•
a — • •
^ ^ = :
- i—
/
/
MAINTMAT
PREr
//
/
BUILDENER
ENAERI
OCEIER
j
/
s
ING
r
NG<\L
/
SS3Y/
/
E
/
/
/
/
/
/
/
/
>
1000 2 3 4 5 6 78 9IO000 2 3 4 5 6789100^002 3 4 5 6 7891400,000
FEED SLUDGE FLOW RATE -gpd
teI 0,000 0,000100,000 IFEED SLUDGE FLOW RATE -liters/day
Figure C-2.
Basket centrifuges - building energy, process energyand maintenance material requirements
173
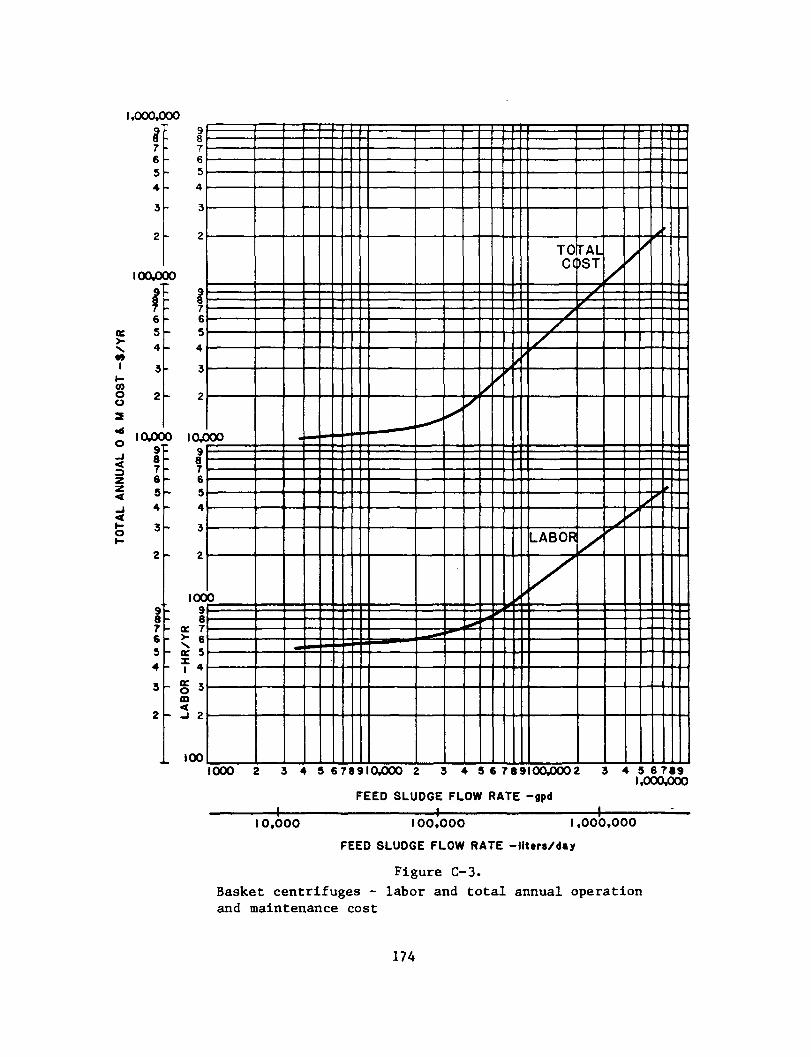
1,000,000
QC>• »
I
0)Ou3•6O
<
176543
2
ooo
987654
3
2
CO
g": 9f654
3
2
IO0C987654
3
2
1654
3
2
654
3
2
O IOC98
654
3
Z
IOC98
- <E 7
- K 5- f4- S 3
ffi<
- -1 2
. 100
XX)
0
M M
H I : - — =
/
ti.
y y
TOC(
//
/
LABOR
TAL)ST
/
/
/
y
1000 2 3 4 5 6 789IO000 2 3 4 S 6 7 89100400 2 3 4 9 6 7891,000/500
FEED SLUDGE FLOW RATE -gpd1 1 1 ^ _
10,000 100,000 1,000,000
FEED SLUDGE FLOW RATE -liters/day
Figure C-3.Basket centrifuges - labor and total annual operationand maintenance cost
174
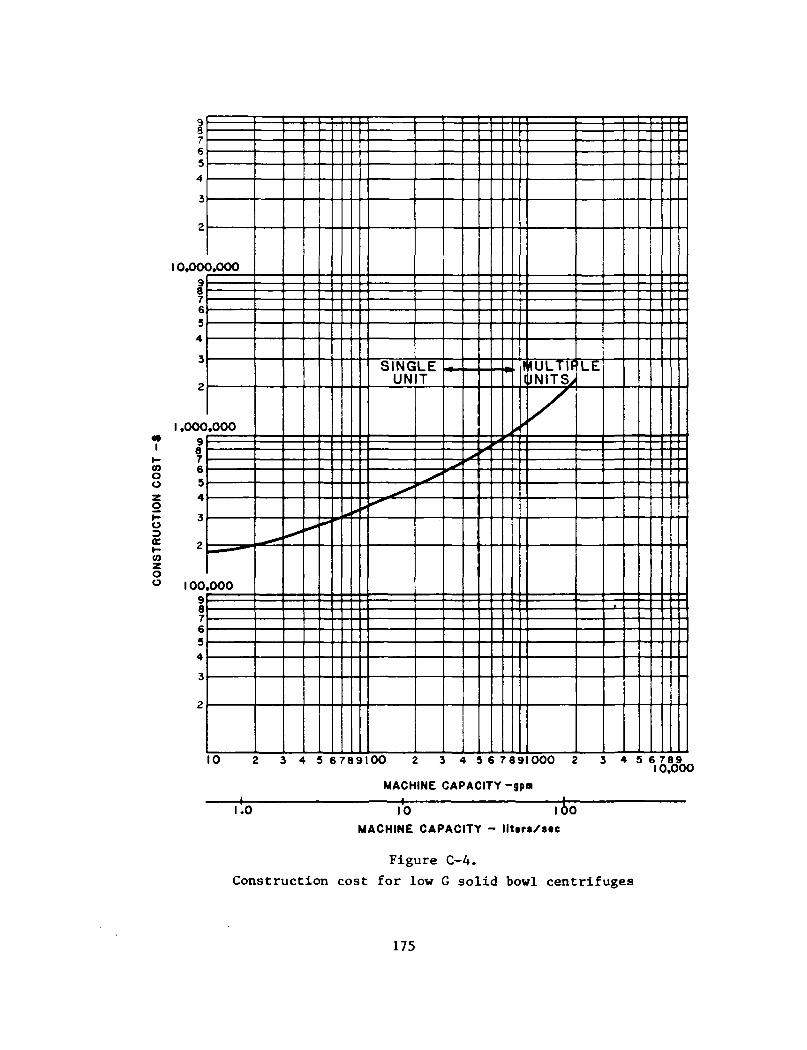
0}ou
ootr
co
oo
1\7654
3
2
I0.0CKa i6543
2
1.000987654
3
2
1009876543
2
3,000
.000
—'
000
<•
SINGLEUNIT
*
lULTIf 1 $UNITS^
/
10 2 3 4 5 6789100 2 3 4 5 6 7891000 2
MACHINE CAPACITY -gpm-f-
3 456.ofo9oo
1.0 10 1MACHINE CAPACITY - llttrs/s«c
Figure C-4.
Construction cost for low G solid bowl centrifuges
175
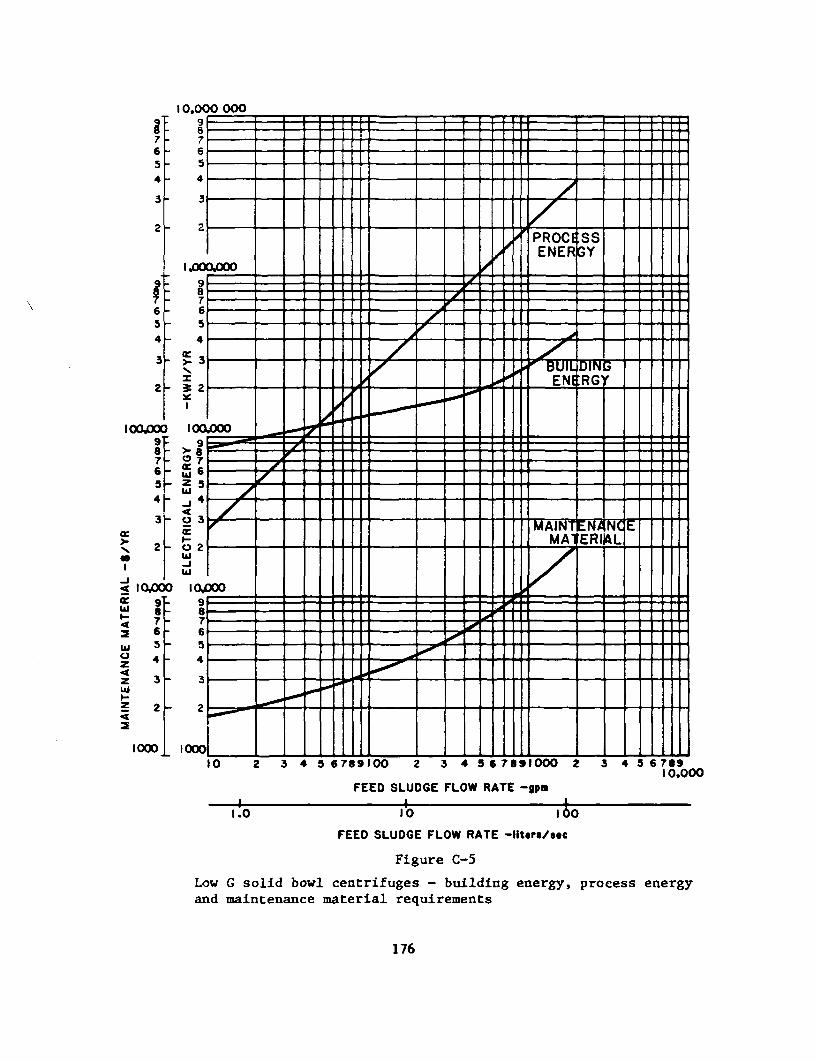
10003 4 5 6789100 3 4 567891000 2 4 5 6 789
10.000FEED SLUDGE FLOW RATE -gpa
-I-f.O 10 100
FEED SLUDGE FLOW RATE -llt.rs/s.c
Figure O 5
Low G solid bowl centrifuges - building energy, process energyand maintenance material requirements
176
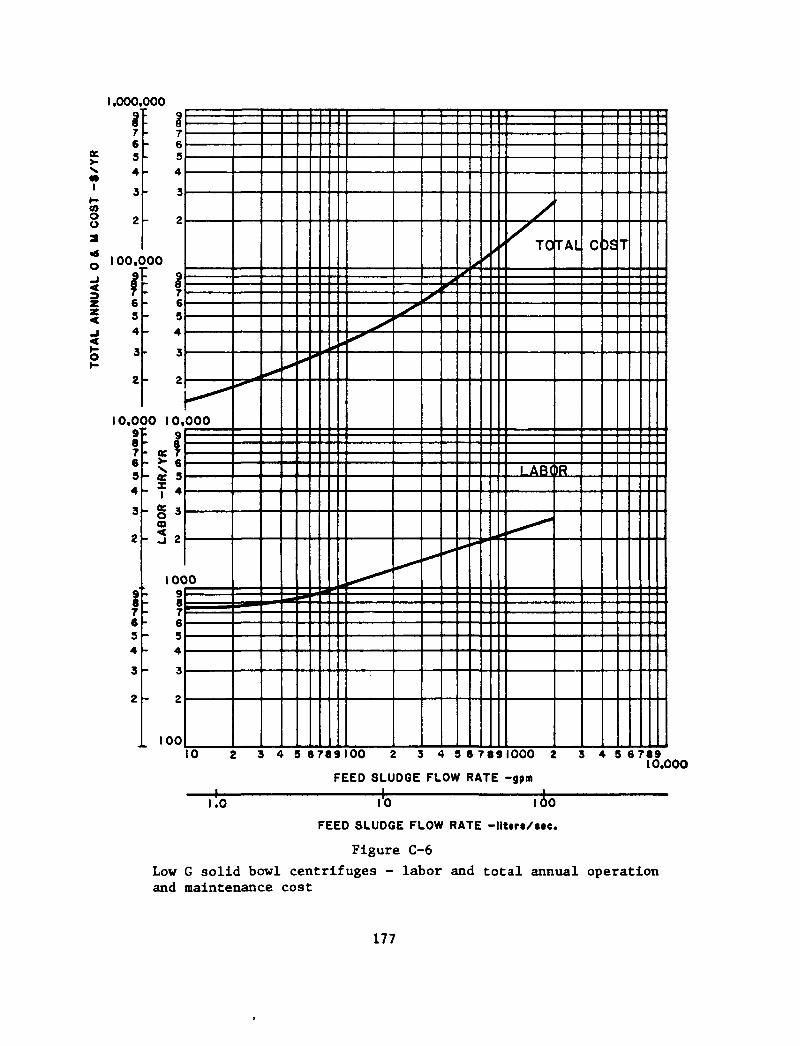
1,000,000
<r
ou
-J
I694
3
2
oo.c
i634
3
2
10,01987694
3
2
634
3
2
t g769
4
3
2
)00
7694
3
2
30 10,
- f 4
CO
- 32
IOC987694
3
2
100
0 0 0
>0
—
. * -
***-*-
y
> ' TO
LAB(
fAL
>R
C )£ T
10 2 3 4 9 6789100 2 3 4 9 6 7891000 2 3 4 9 678910,000
FEED SLUDGE FLOW RATE -gptn•+•1.0
•k. to10 I
FEED SLUDGE FLOW RATE -litirt/s«c
Figure C-6Low G solid bowl centrifuges - labor and total annual operationand maintenance cost
177
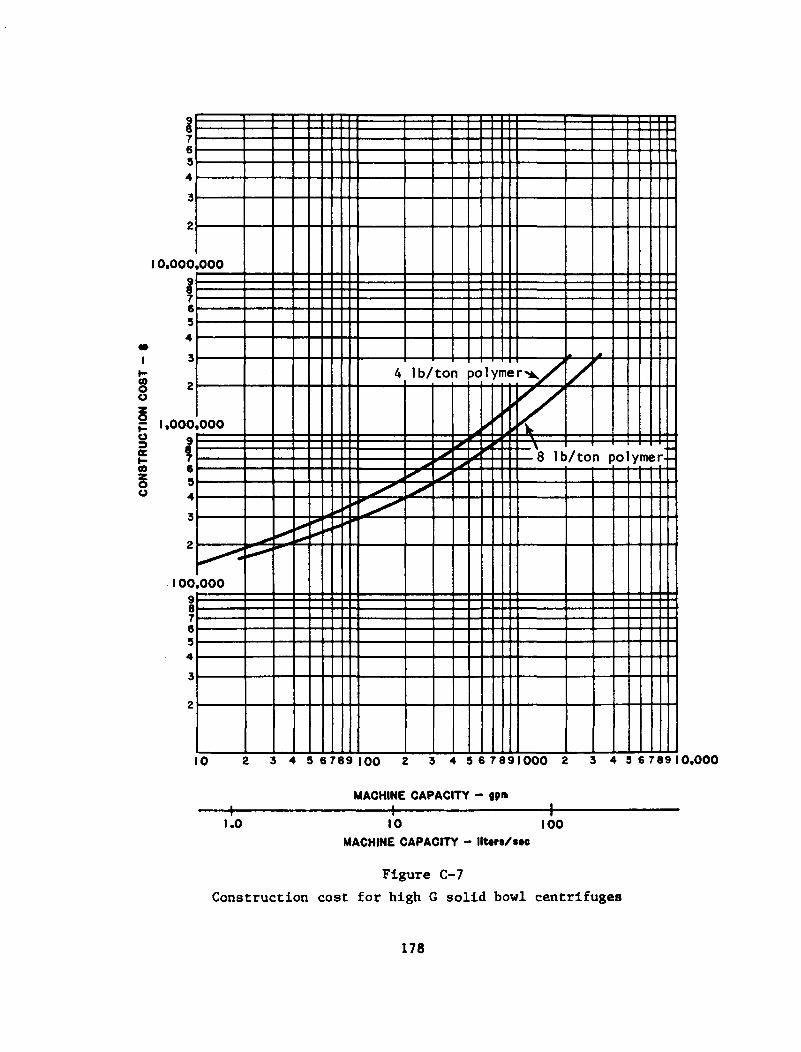
7694
3
2
10,000
694
1 3
§ 2O
p 1,000O Q
i i° 4
3
2
100987694
3
2
,000
,000
,000
> -
0*0
4 Ib/ton 30 1
/
8 lh
z
10 2 3 4 9 6789 100 2 3 4 9 6 7891000 2 3 4 9 6789 10,000
1.0
MACHINE CAPACITY -1 1_
10 100MACHINE CAPACITY - liters/Me
Figure C-7
Construction cost for high G solid bowl centrifuges
178
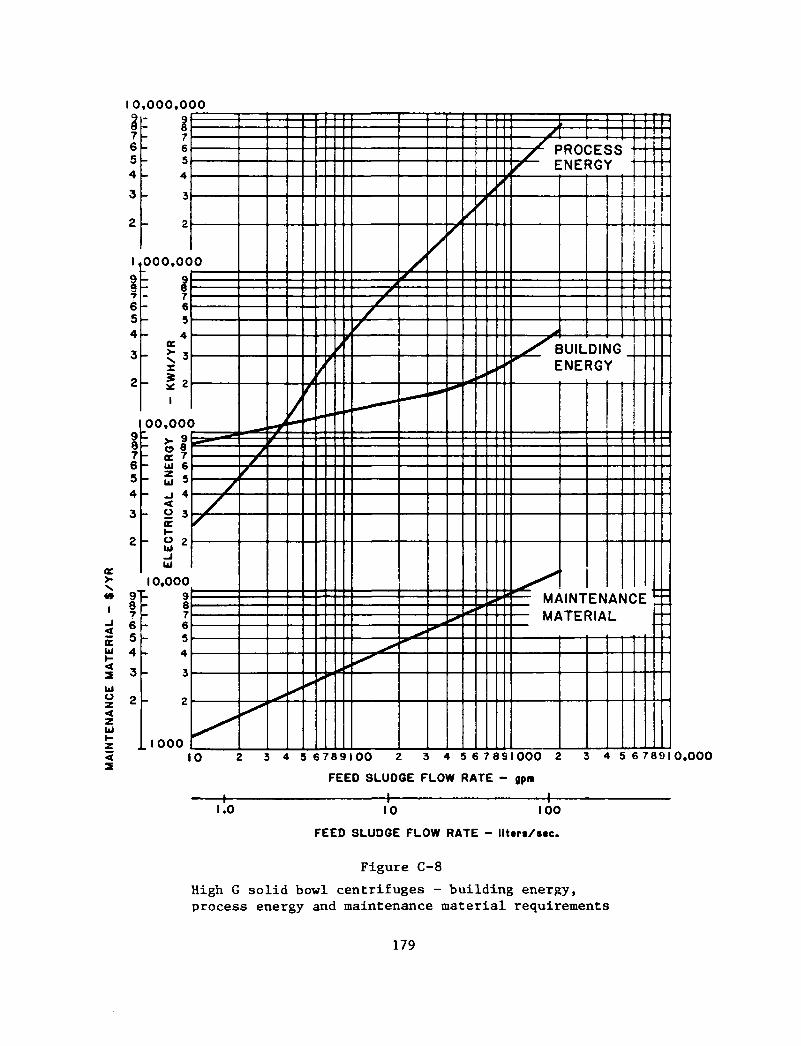
10,000,000
I6543
2
<z
: ill76543
2
000.00Q
654
K
i,i
oo.ooc
- M- a: 7- UJ 6- ui 5- _l 4
CE
- O 2Ui
UI
10.000987654
3
2
1000
0
)
/
y
-ym
ys
/
~~———
/
***
A
*
*
/ E
E
1 — M/
>R0<:NEIRGY
JUILDING:NERGY
UNTENANCESERIAL
10 2 3 4 5 6 7 8 9 1 0 0 2 3 4 5 6 7 8 S I 0 0 0 2 3 4 5 6 7 8 9 1 0 , 0 0 0
FEED SLUDGE FLOW RATE - gpm
—t—1.0
•+• 4-10 100
FEED SLUDGE FLOW RATE - lit«r«/stc.
Figure C-8
High G solid bowl centrifuges - building energy,process energy and maintenance material requirements
179
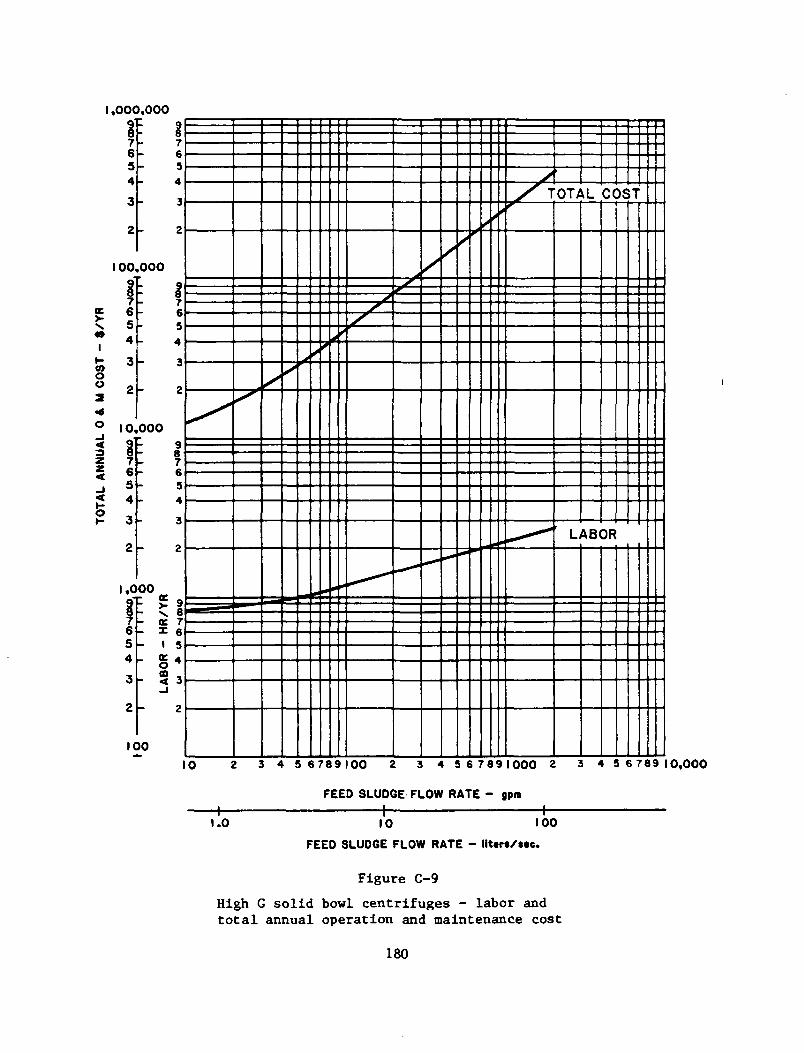
1,000,000
2?
I 00.000
oc
Ou
° 10,000-
Z
, 0 0 0 ^
- K 7x 6
- I 5
r 53
100
e IB H
- « -
j f TOTAL COST
LABOR
10 2 3 4 5 6789 100 2 3 4 5 6 789 1000 2 3 4 5 6789 10,000
FEED SLUDGE FLOW RATE - gpn1 1 1
1.0 10 100FEED SLUDGE FLOW RATE - littra/Mc.
Figure C-9
High G solid bowl centrifuges - labor andtotal annual operation and maintenance cost
180
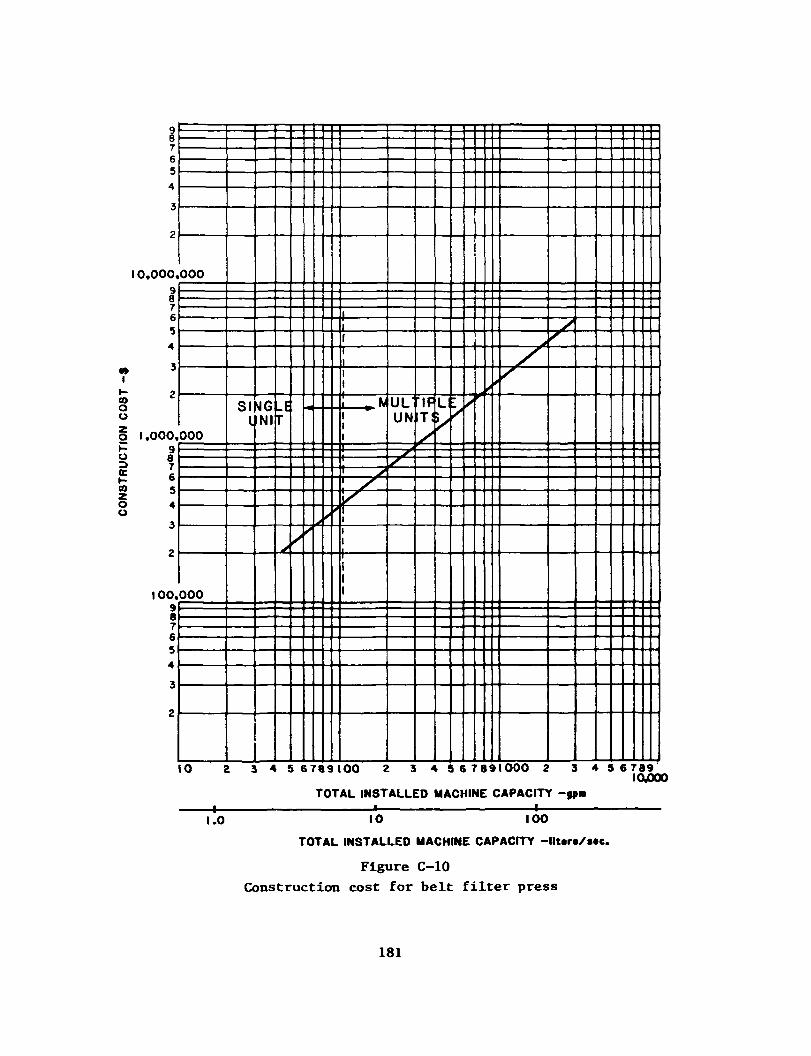
4»I
09OU
O
Kt-CO
oo
987654
3
2
0.000,816543
2
1 .000,98
654
3
2
100.987654
3
2
000
000
000
SII Nl
LET
1
Ii
ii
! . K
11
• 1
1 >1 syMiiI
111
ULtlFUN
-^-
IT.L
V
10 2 3 4 5 6789100 2 3 4
TOTAL INSTALLED MA1 '
6 784
CHINE
y>
HOOO 2 3 4 5 6 789IO000
CAPACITY -gpa
1.0 10 100
TOTAL INSTALLED MACHINE CAPACITY -lit«r«/stc.
Figure C-10
Construction cost for belt filter press
181
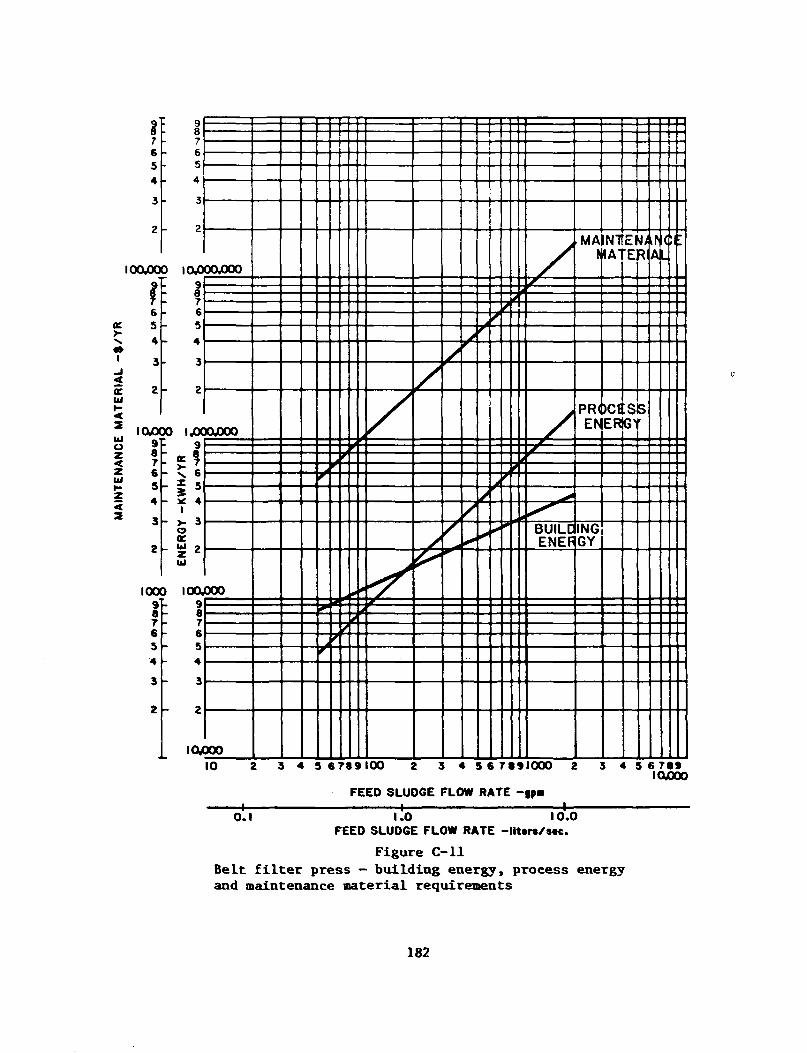
cc
£uit-42UIuz<zUI
I6S4
3
2
I0O00
I6s
4
32
ICUX9876S4
3
2
IOOI
|
654
3
2
7654
3
2
0 IO0
654
3
2
30 I.OC9
1- >- 3
oK
- gtUI
3 lOOj987654
3
2
iom
oaooo
JOjOOO
000
X30
t
/
/
i
/
/
/
/
/
A
7 j
r
A*
i
BUILDENER
MA1
PR(E^
INGGY
INT1*A'
)C1ER
ElE
:s~>
R
3
,rA
10 2 3 4 9 6789100 2 3 4 5 6 7891000 2 3 4 5 6 769IOJOOO
FEED SLUDGE FLOW RATE - » •1 1 1
O.I 1.0 10.0FEED SLUDGE FLOW RATE -lit«r»/s«c.
Figure C-llBelt filter press - building energy, process energyand maintenance material requirements
182
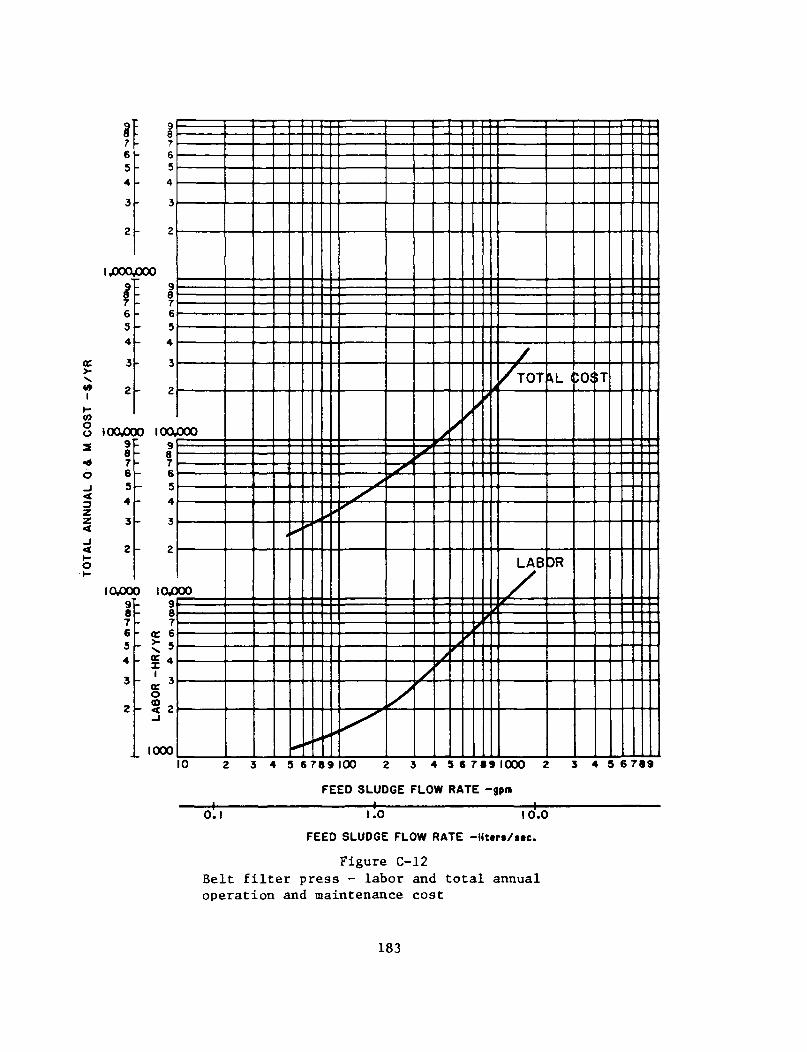
cooo2
o
—7654
3
2
000987654
3
2
0 lOOg98
654
3
2
) lOfi987
- QC 6- ^ 5
§L
AB
OR
000
0 0
t
1 * - • *
1 j
y
-
/TOT
LAB
(^L <
DR
;T
10 2 3 4 5 6 7 8 9 100 2 3 4 5 6 7 8 9 1000 2 3 4 5 6 789
FEED SLUDGE FLOW RATE -gpn
0.1• 4 - • 4 -1.0 I 0.0
FEED SLUDGE FLOW RATE -l i tars/sec.
Figure C-12Belt filter press - labor and total annualoperation and maintenance cost
183
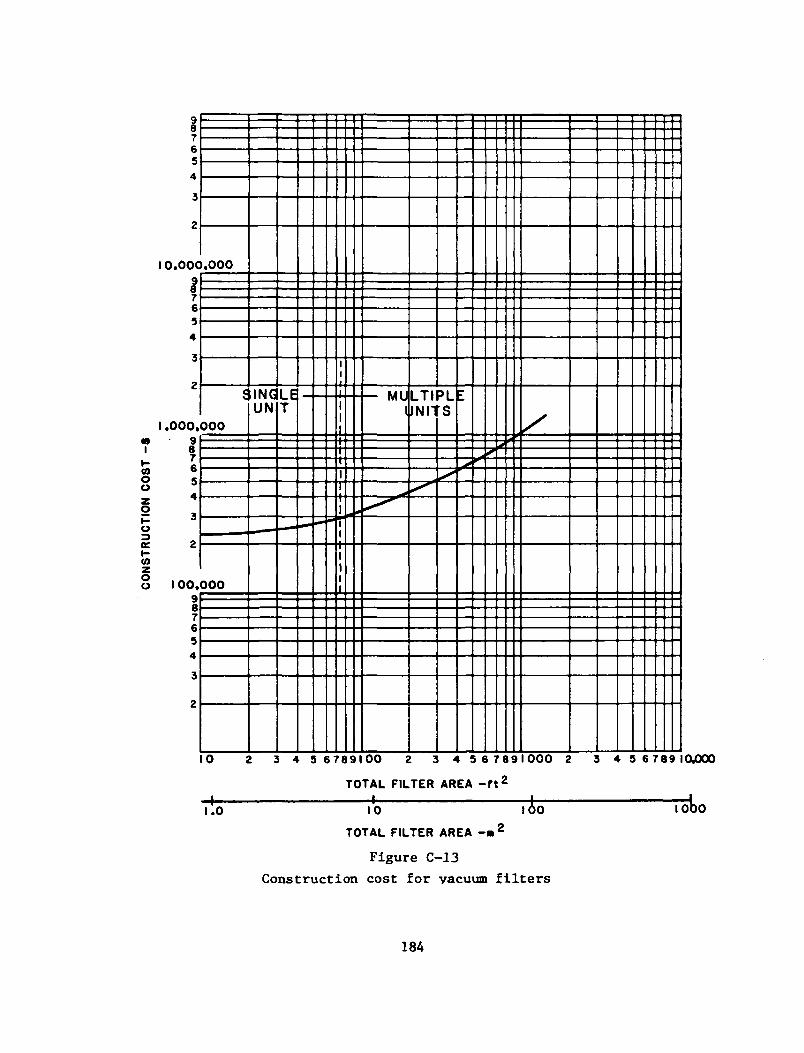
COooootcy-tnou
987654
3
2
O.OOC
1654
3
2
1 .000.98
6S
4
3
2
100,987654
3
2
.000
c
000
^ _ — — •
000
INGUN
— —
LET
•«" -»
iiii111
1l1
1
i
Ili
-
• M l I
11 TIP'
INT S
10 2 3 4 5 6 7 8 9 1 0 0 2 3 4 5 6 7 8 9 1 0 0 0 2 3 4 5 6 7 8 9 KX0O0
TOTAL FILTER AREA - f t 2
4-1.0 fo too
TOTAL FILTER AREA -m 2
Figure C-13
Construction cost for vacuum filters
I 000
184
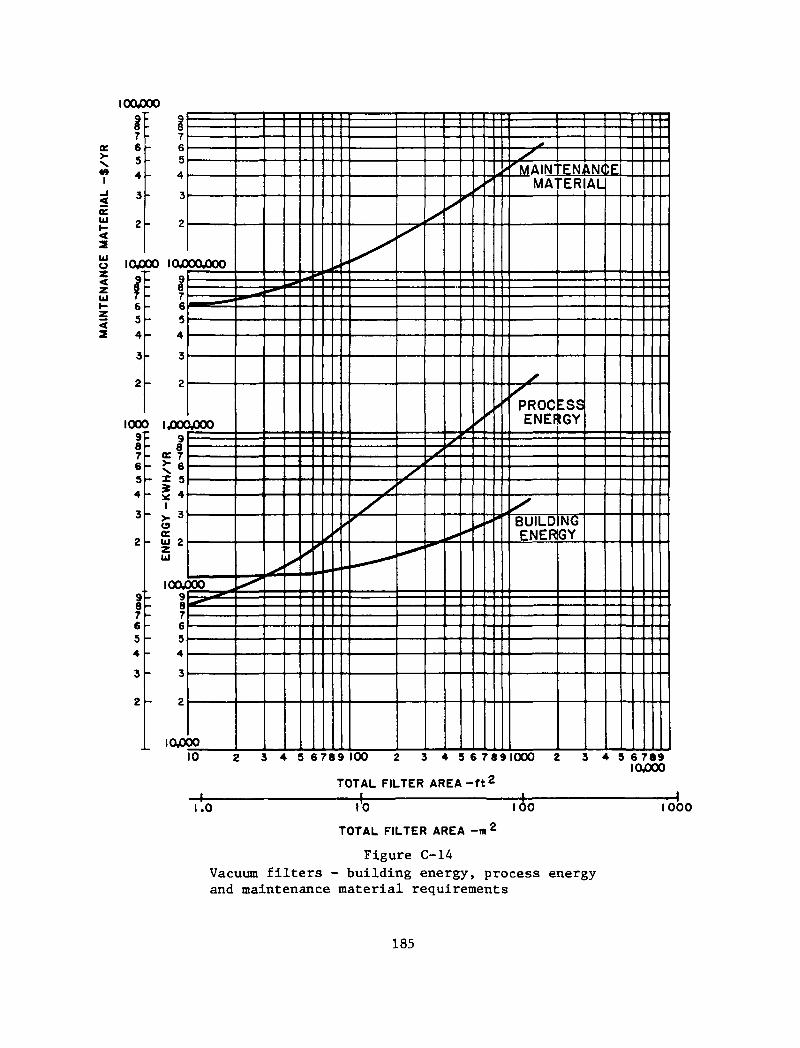
loaoooQ
87
cr 6N 5
T 4
^ 3£
S 2
2S IOJO
z 2UJ '
I !2 4
32
IOOC98765
4
3
2
98
65
4
3
2
t Hi76543
i- 2
00 IOC
654
3
2
) IjOOC98
1" > 3
o<r
- U2UJ
IOOC987654
3
2
IO0
oaooo
—
woo
XX)
30
y
r
^^
/<
4
9
- rMAIN'MA
' PROCENEF
yBUILDENER
rENAN(rER
:ss!GY
NGGY
ALJE
-
10 2 3 4 9 6 7 8 9 1 0 0 2 3 4 3 6 789 1000 2
TOTAL FILTER A R E A - f t 2
3 4 5 6 789IO000
1.0 10
TOTAL FILTER AREA -m 2
100 1000
Figure C-14
Vacuum filters - building energy, process energyand maintenance material requirements
185
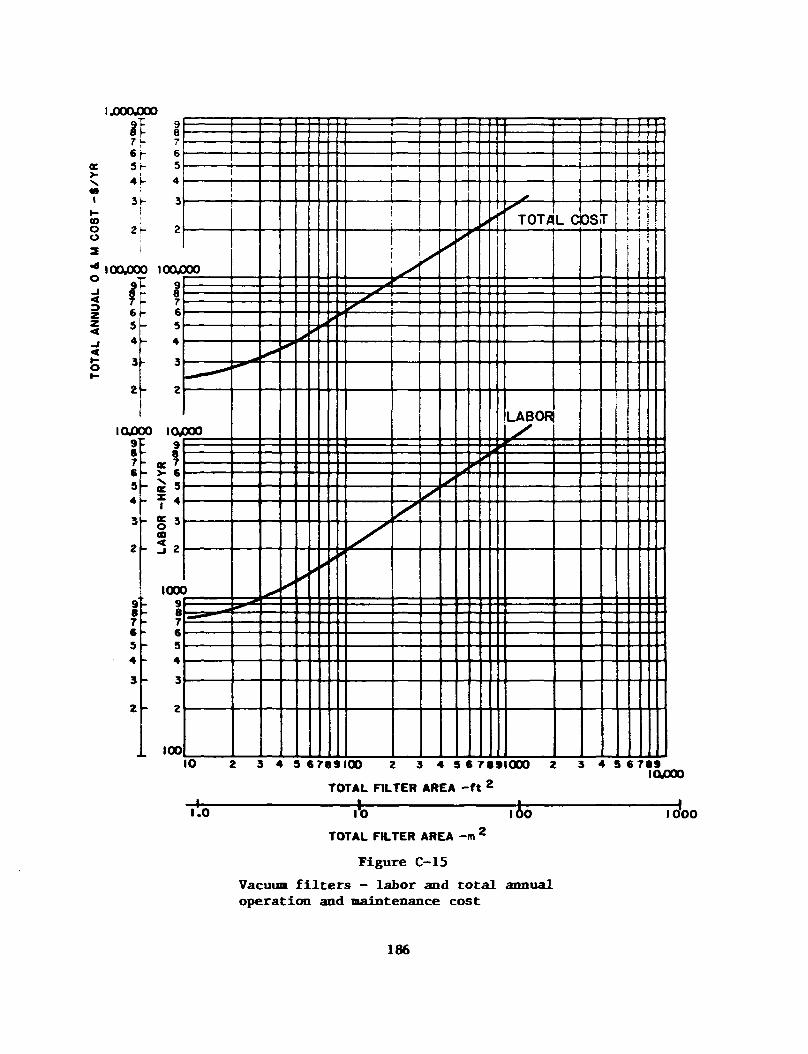
\JXOJXQ
t»I
»-<DOO
<O
7 (- 76j- 65 r 5
4t- 4
2
lOOjOO
634
3
2
IOJOI987es4
3
2
98634
3
2
2
0 IOOJC
h 65
t- 4
3
2
X IOJ
: s !r *4
- S 3
CO
- 32
IOOC9
7634
3
2
100
1t1
100
TOO
>
r—I
/y>
>
* TOT/!
LABOR
L COSr
- + • - -
10 3 4 S 6789100 2 3 4 S S 7891000
TOTAL FILTER AREA - f t 2
4
3 4 5 6 789IOUOOO
1001.0 |'O
TOTAL FILTER AREA - m 2
Figure C-15
Vacuum f i l t e r s - labor and total annualoperation and maintenance cost
0 0
186
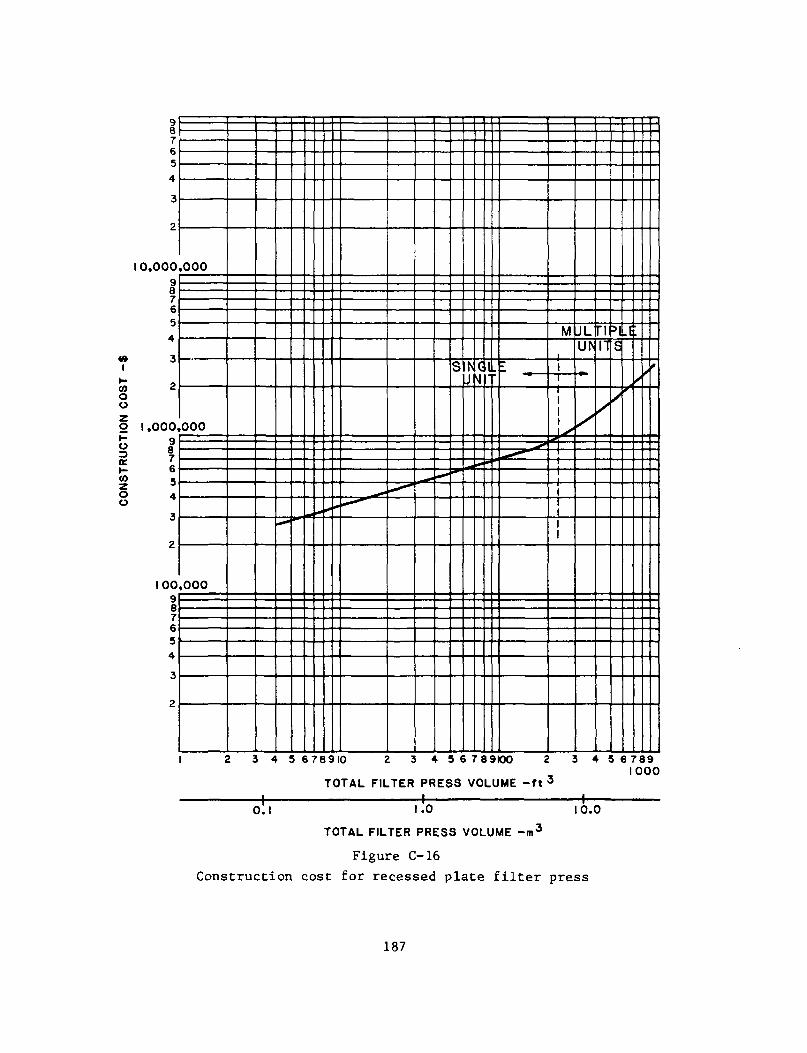
COoo
o
C0
oo
7654
3
2
10.000
7654
3
2
1.000,98
654
3
2
1009876543
2
.000
000
,000
<•* • •
s c u.
M
"1
JLFIu
/
ns-B
y
2 3 4 5 678910 2 3 4 56789100 2 3 4 5 6 7891000
TOTAL FILTER PRESS VOLUME - f t 3
1 1 11.0 10.0
TOTAL FILTER PRESS VOLUME -m3
Figure C-16
Construction cost for recessed plate filter press
187
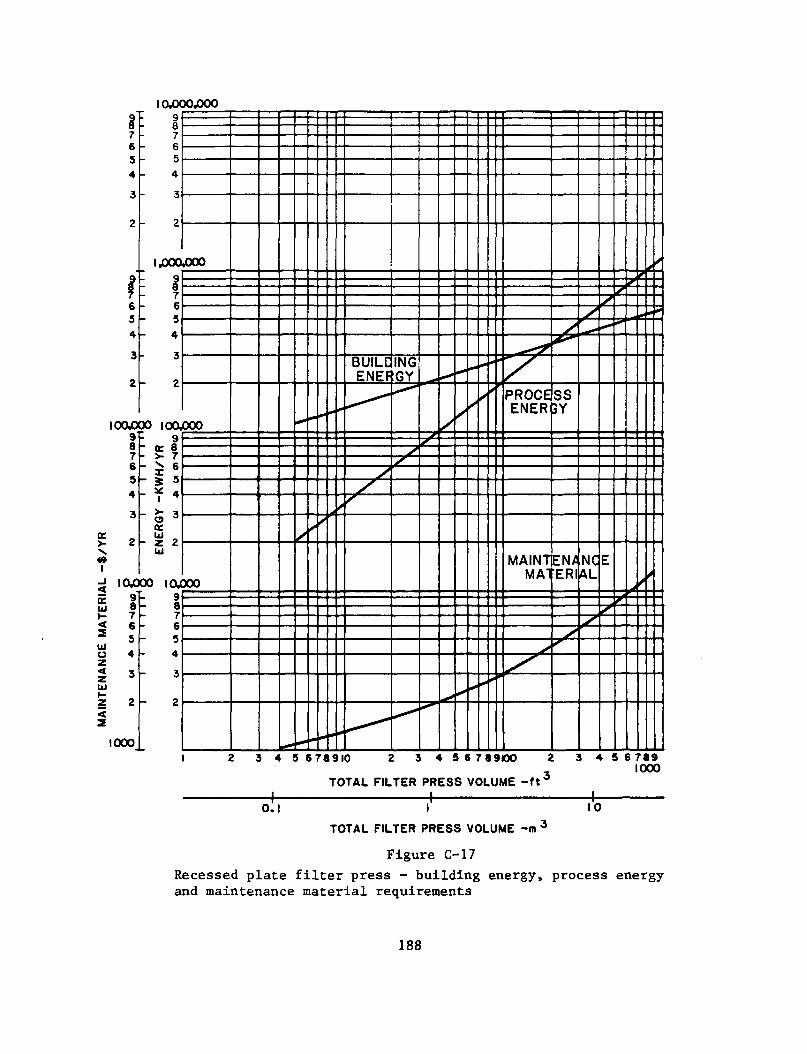
10000,000
UJ
o
87654
3
2
a
9
654
3
2
ICXXO987654
3
2
IOC9
7654
3
2
000
7654
3
2
1.000
654
3
2
DO ICO,9
_ >- *cc
- Z 2UJ
00 lOgC987654
3
2
000
x»
<•
•
/
BUILQENEfl
ING
/
0*
/ PROCEENER<
MAINTMAI
SS3Y
EN/•ERI
>/
NCAL
E
•
2 3 4 5 6 78 910 2 3 4 5 6 7 89100 2 3 4 5 6 7 8 91000
TOTAL FILTER PRESS VOLUME - f t 3
1 1 hO.I I
TOTAL FILTER PRESS VOLUME -m :
10
Figure C-17
Recessed plate filter press - building energy, process energyand maintenance material requirements
188
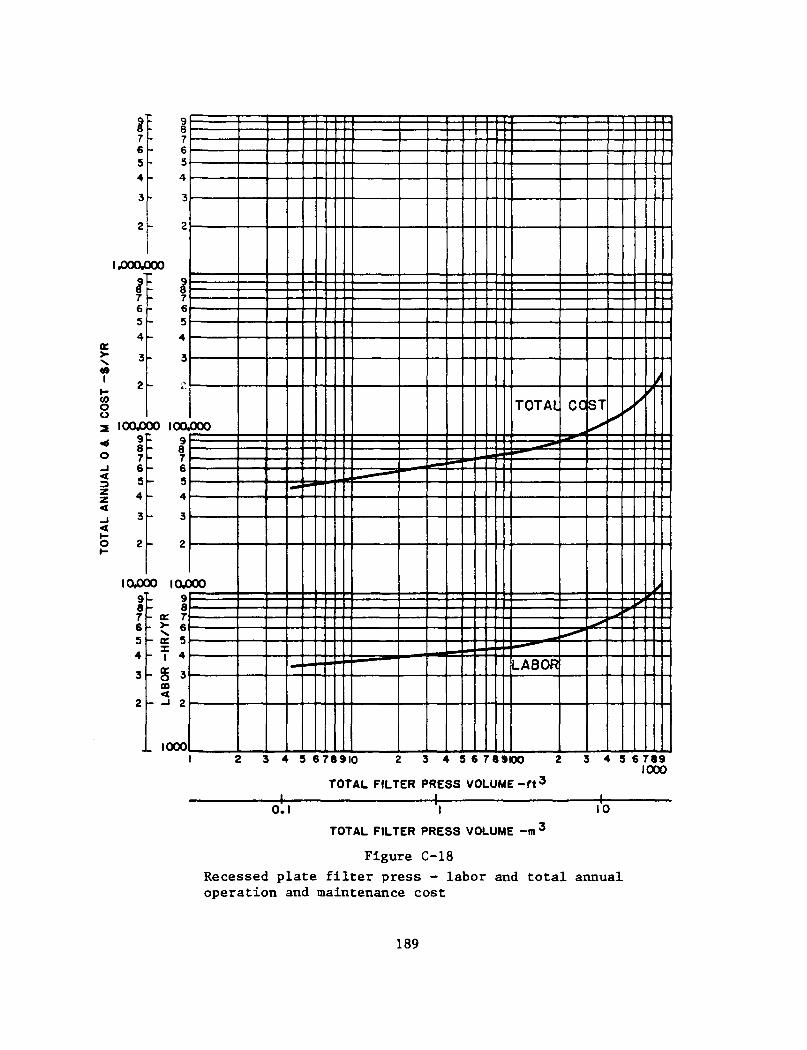
7654
7654
1.000000
1}654
I
I654
COoo
lOOOOO I0O0009P 98 - 87 - 76 - 65 - 34 - 4
IO000 IO00098
- cc 7
- T 4
1 1000
,000
XX}
• . —
•
• •
TOTAL
LABOR
CO
^ *
STy
//
I/
2 3 4 9 6 7 8 9 1 0 2 3 4 5 6 7 8 9 1 0 0 2 3 4 5 6 7 8 91000
TOTAL FILTER PRESS V O L U M E - f t 3
1 1 y-O.I 10
TOTAL FILTER PRESS VOLUME -m 3
Figure C-18Recessed plate filter press - labor and total annualoperation and maintenance cost
189
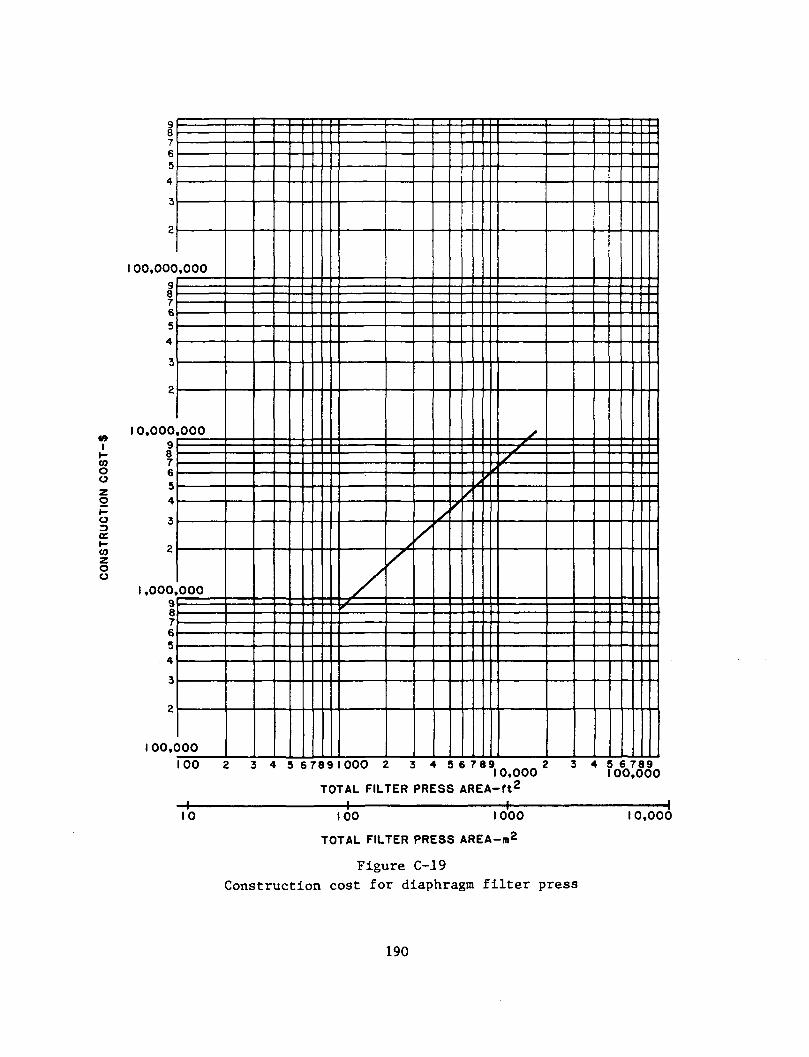
oo
o
ITco
oo
9
7654
3
2
1 00.000
i\654
3
2
1 0,00098654
3
2
1,000,987654
3
2
I00.C
.000
000
000
)00
/
/
/
/
100 3 4 5 67891000 2
TOTAL FILTER PRESS AREA-ft2
3 4 5 6 7 8 9 .o.ooo2 3 4 ?o6o789000
•+• -f-10 100 1000
TOTAL FILTER PRESS AREA-m*
Figure C-19
Construction cost for diaphragm filter press
10.000
190
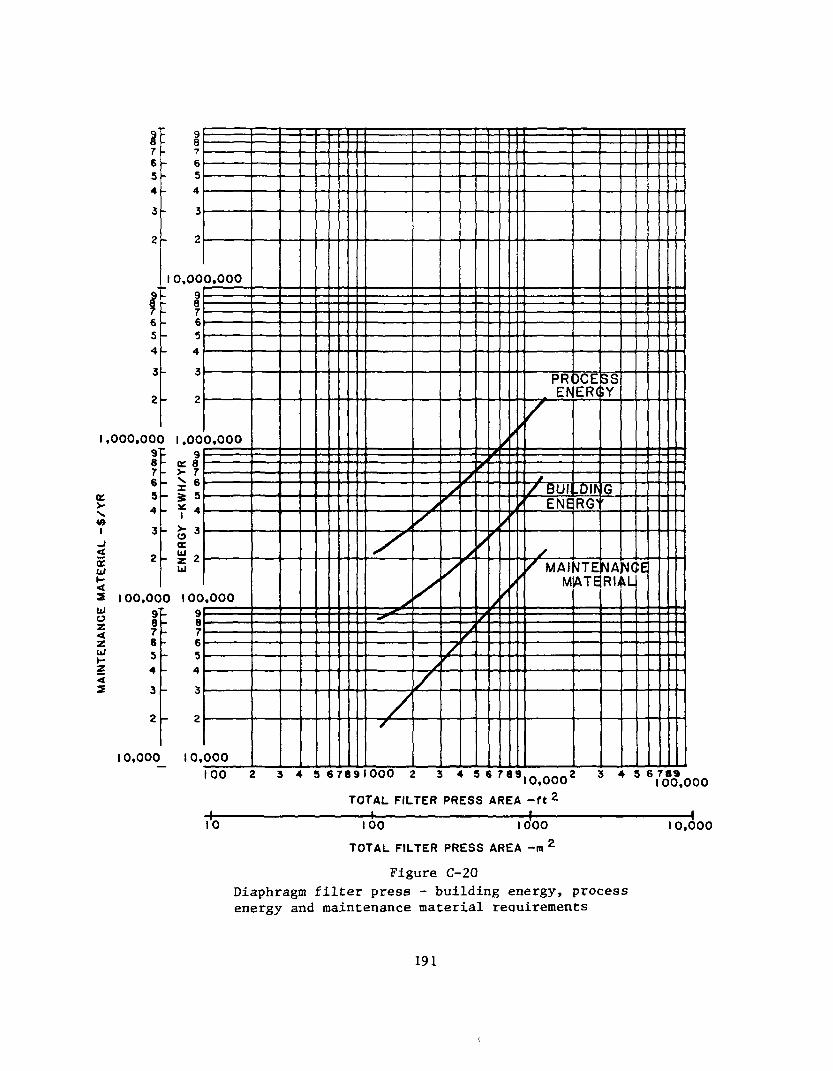
I
SUJ
UJ
Oz<z
I7654
3
2
9$654
3
2
oo.ooc987654
3
2
IOO.OC987654
3
2
0,000
7654
3
2
10,00
p 81654
3
2
) 1.009
E ? *
- S3
(T- Z2
Ul
0 100987634
3
2
10,
0.000
0,000
,000
000
>
/
>
/
/
/
/r
/
/
Jf
/r
/
/
/
/
V
PRIs E ^
/
/ BUIIENE
// MAf
M
DCEERd
.DirRG'
WTEATE
SSY
G
NARli
NC\L
E
100 2 3 4 S 6 7 8 9 1 0 0 0 2 3 4 5 S 7 8 9 | O Q O O 2 3 4
TOTAL FILTER PRESS AREA - f t 2
\ • t 110 100 1000
TOTAL FILTER PRESS AREA -m 2
Figure C-20Diaphragm filter press - building energy, processenergy and maintenance material requirements
10,000
191
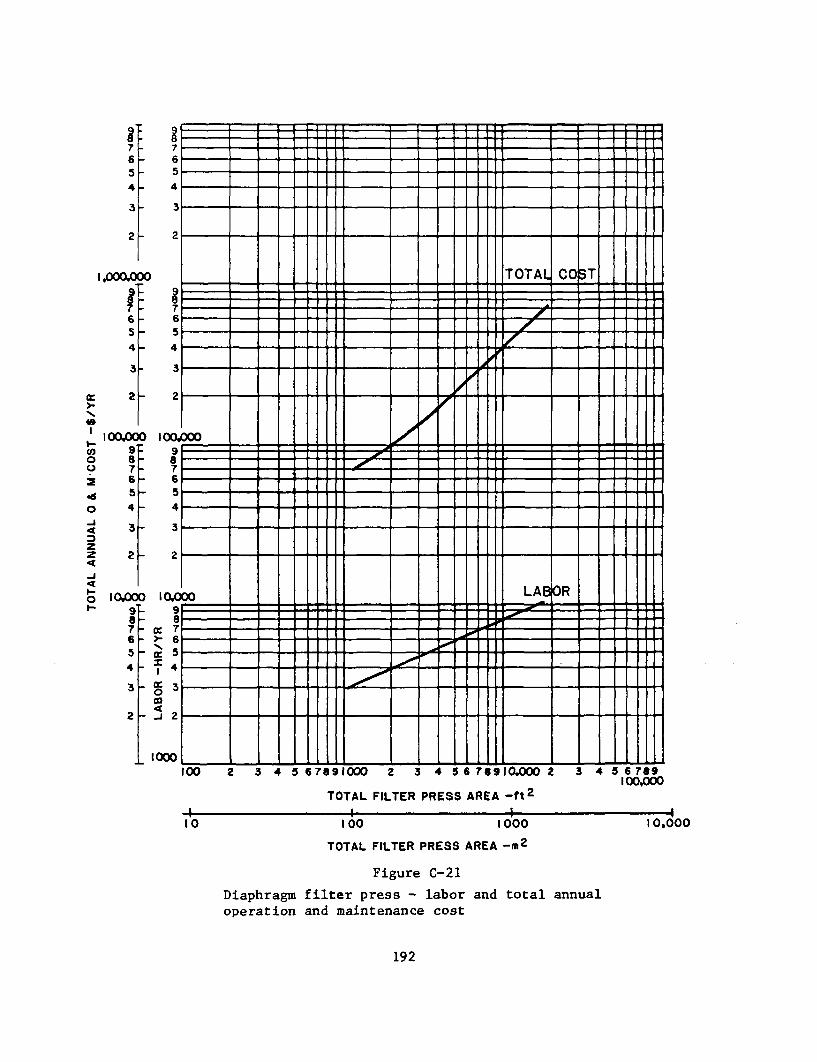
cooo
o
3Z
<
I76S4
3
2
,00001
7654
3
2
309~F 9f6s
4
3
2
I0O00987654
3
2
IO00
1654
3
2
654
3
2
0 100V98654
3
i- 2
0 IO098
- tc 3
rS ^CD
- 3 2
1000
DOO
00
^ ^
/
//
*
TOTAL
_//
/f
LAB
CO
OR
ST
100 2 3 4 5 6 7891000 2 3 4 5 6 789 10,000
TOTAL FILTER PRESS AREA - f t 2
4-
3 4 9 6 789100,000
10 100 1000
TOTAL FILTER PRESS AREA - m *
Figure C-21
Diaphragm filter press - labor and total annualoperation and maintenance cost
-I10,000
192
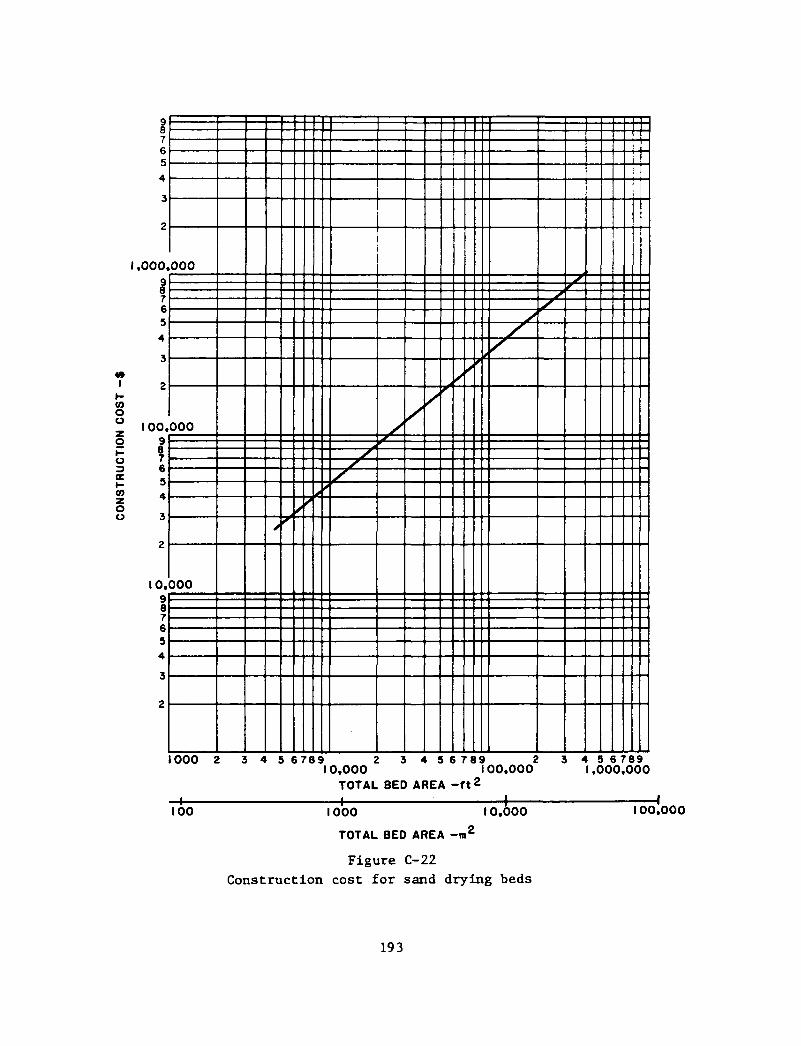
4 *I
t-COOo
o
moo
j}765
4
3
2
1.000,98
654
3
2
100.9?_654
3
2
10.987654
3
2
0 0 0
0 0 0
300
i
•
——}/
1000 2 3 4 5 6 7 8 9 2 3 4 9 6 7 8 9 2 3 4 5 6 7 8 910.000 100.000 1.000.000
TOTAL BED AREA - f t 2•+•100
•+• ±I 000 10.000
TOTAL BED AREA -m2
Figure C-22Construction cost for sand drying beds
-I100.000
193
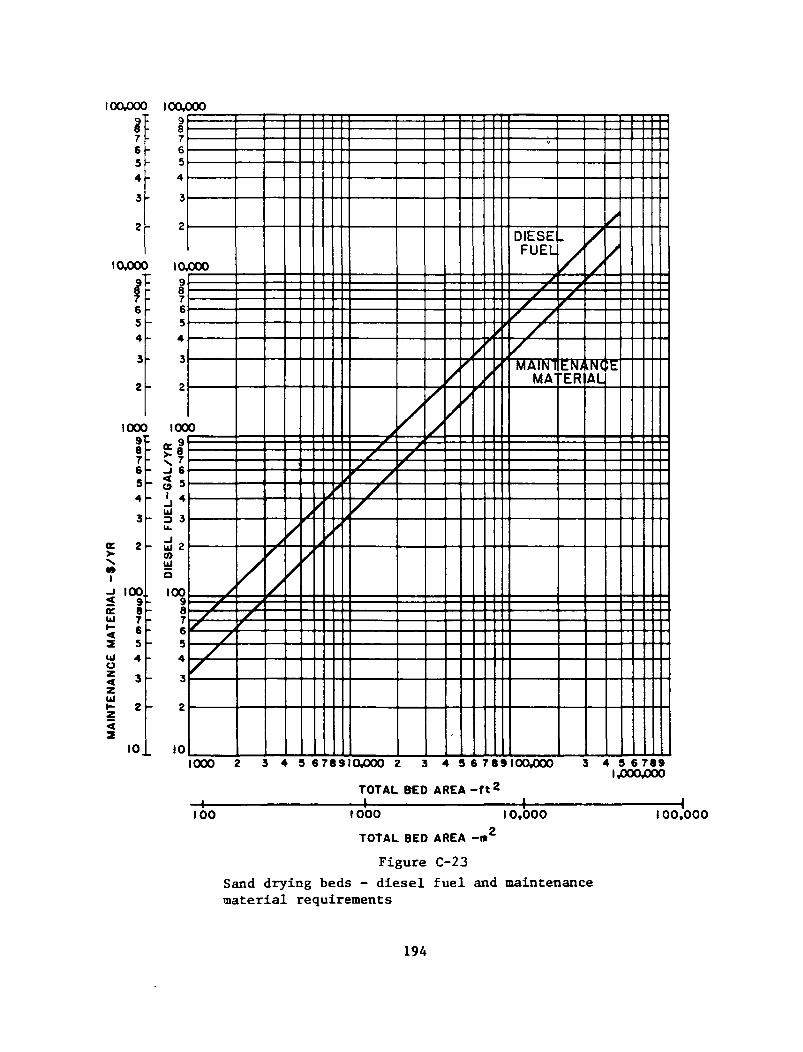
IOOOOO IOOOOO
IOOOO
it
IOOO987654
100.
I 1<
<2
uz<
K 2
10
987654
3
2
10.987654
3
2
100
K ^* " 7
-J 6
?u.
J2CO
HJ
5100
987654
3
2
10
000
0
y
/
r
/
/
t
/
4
yy>' X
//
y
//
/
4/
*
DIESEFUEL
y y
y' MAINll
MA'
/
EN/jfER
/
N(jAL
/
/
E
IOOO 2 3 4 5 6 78 9ICWXX) 2 3 4 96789100 ,000
TOTAL BED AREA-f t 2
3 4 5 6 7891,000^000
•+ •100
•4-1000 10.000
-K100,000
TOTAL BED AREA - « '
Figure C-23
Sand drying beds - diesel fuel and maintenancematerial requirements
194
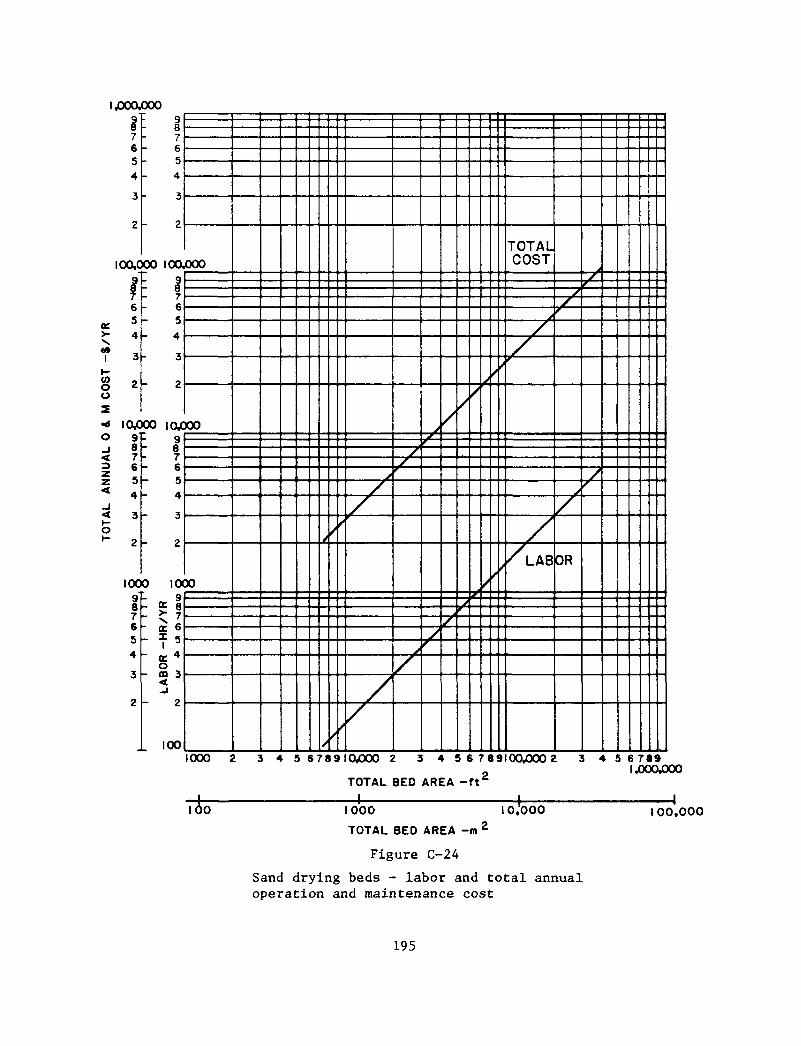
ixwoooo
0)Oa2
O_l<=>ZZ
<o
7654
3
2
00.C
7654
3
2
OO 100,aV 9f654
3
2
lOrf987654
3
2
IOC987654
3
2
r 8
7654
3
2
CO IOC98
654
3
2
0 ICX- K 9
O- co 3
_j
2
100
000
100
30
/ /
/
/
r
j
/
r
/
/
TOTALCOST
j
/
/
/
/LAB
s
r
J
/
OR
/
1000 2 3 4 9 6 789IO000 2 3 4 5 6 7 8 9100,000 2 3 4 5 6 789_ ^OO
TOTAL BED AREA - f t *
100 1000
TOTAL BED AREA -m 2I 0,000 100,000
Figure C-24
Sand drying beds - labor and total annualoperation and maintenance cost
195
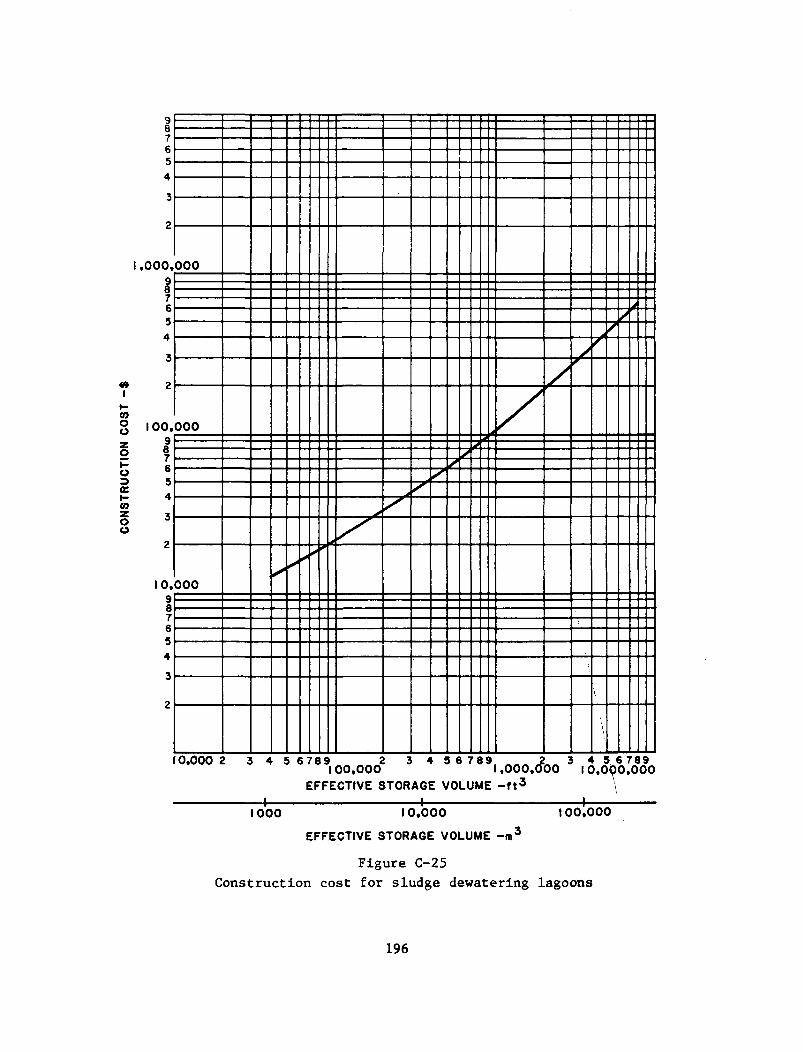
0}oo
01
ou
987654
3
2
1.000.
|
654
3
2
100,
1654
3
2
10.987654
3
2
000
000
000*
y
0 . 0 0 0 2 3 4 5 6 7 8 9 ^ 2 3 4 5 6 7 8 91 0 0 , 0 0 0
E F F E C T I V E S T O R A G E V O L U M E
/
/
A
/
\
\
/
>
2 3 4 5, 6 789,000,000 10,000,000
1 •1000 10.000
EFFECTIVE STORAGE VOLUME -m 3
100.000
Figure C-25
Construction cost for sludge dewatering lagoons
196
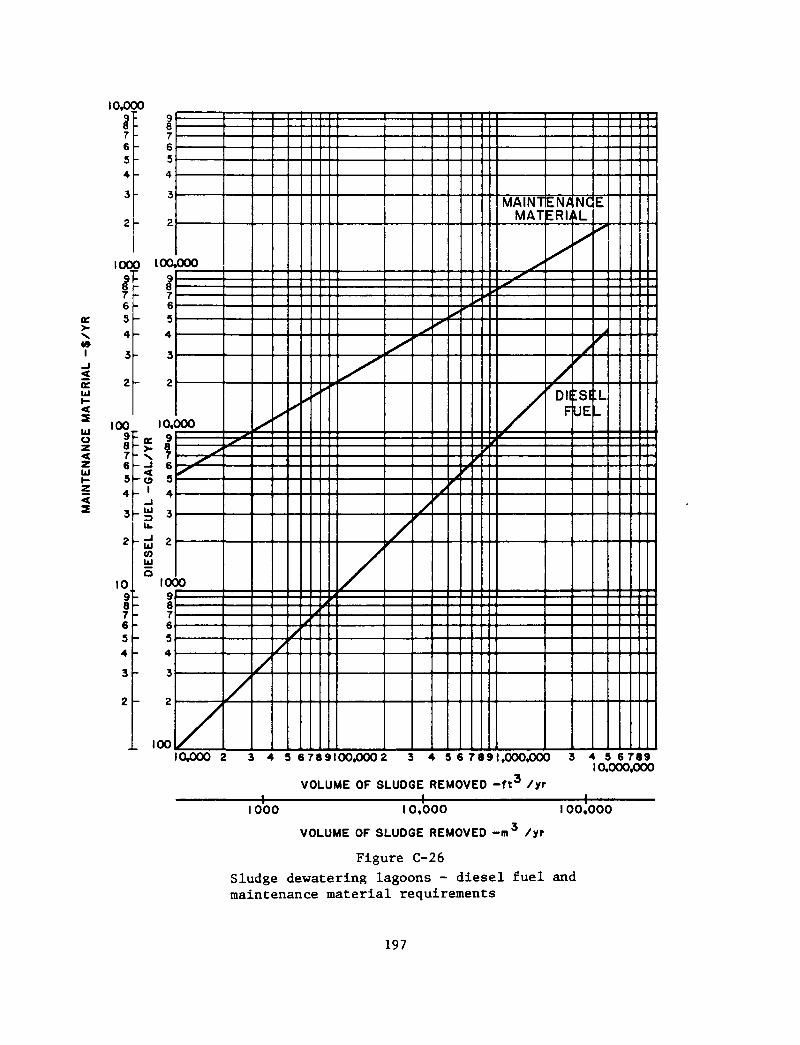
10.000
uit-
2
UJoz
LJ
1654
3
2
1009
654
3
2
00987654
3
2
1098
654
3
2
7654
3
2
0 100,
t *654
3
2
IO,(• K 9
< 87- -» 6- O 3- ' 4
_lu.
UJ Z
COUJQ
IOCU 9h 8i- 7
654
3
2
_ 100
000
300
o
/
/
y
A
A
Vr
ff
MAINTiMAT
/
EN/SERI>
/
'DIF
NC
UE
E
ICWXJO 2 3 4 3 6 789100^00 2 3 4 3 6 7 8 91,000,000 3 4 5 678910,000,000
1
VOLUME OF SLU0GE REMOVED -ft3 /yr1
1000 10,000
VOLUME OF SLUDGE REMOVED - m 3 /yr
I 00.000
Figure C-26
Sludge dewatering lagoons - diesel fuel andmaintenance material requirements
197
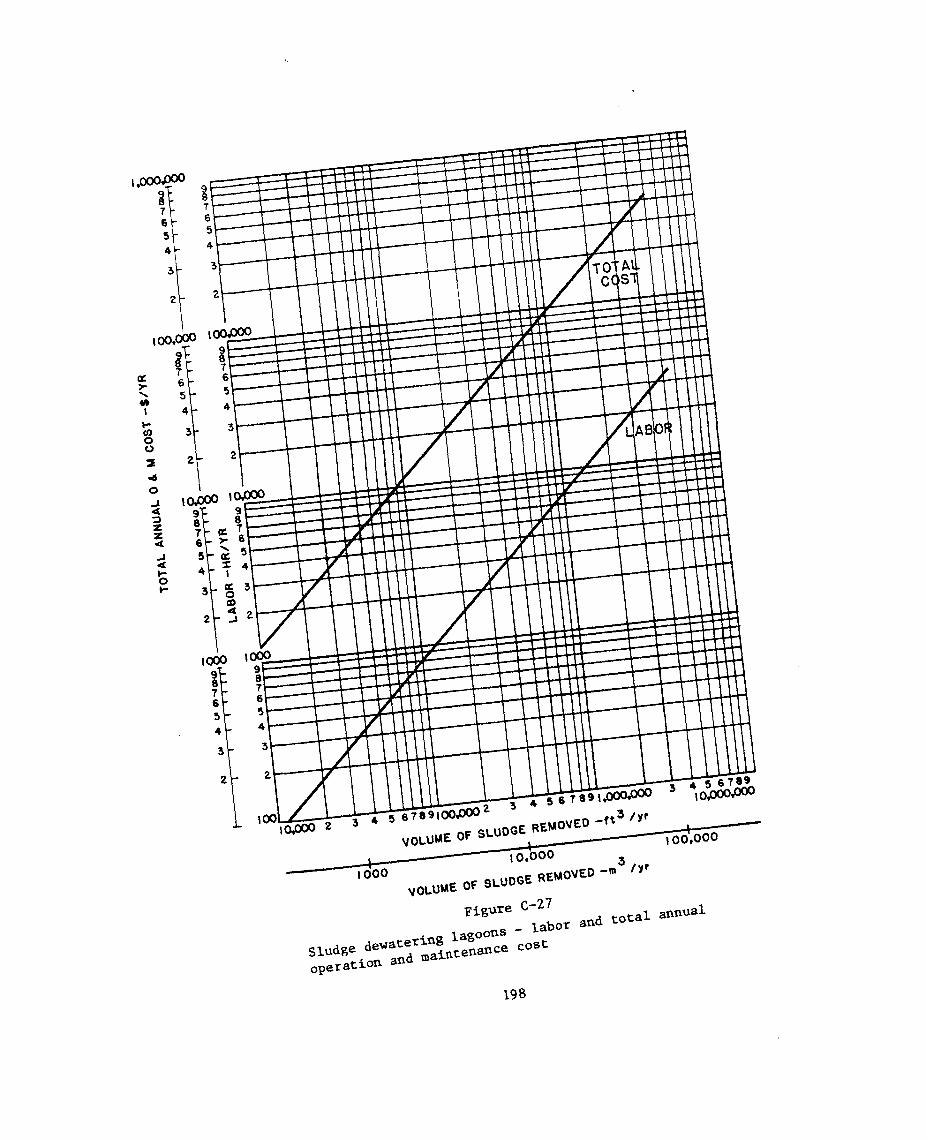
VOLUME OF SLUDGE REMOVED - f t 3
198
BIBLIOGRAPHY
Adam, F., "Dehydration of Fine Suspensions by Means of the SettlingCentrifuge," Environmental Protection Engineering (Ger.), Vol. 3, p. 7,January/February, 1977; Chem. Abs., Vol. 89, 11610.
Adam, F., "Dewatering of Fine Suspensions by Means of Settling CentrifugePlant II—Dewatering Plant -for Municipal and Industrial Sludges."Environmental Protection Engineering (Ger.), Vol. 4, p. 5, January 1978;Poll. Abs. 79-01809.
Agrawal, S., and Goyal, A., "Vacuum Filtration Calculation," Poll. Eng.,Vol. 10, p. 60, March 1978.
Alt, C., "Pusher Centrifuges—Optimum Conditions," Filtration andSeparation, Vol. 17, p. 47, 1980.
Ames, R. K., et al., "Sludge Dewatering/Dehydration Results withMini-B.E.S.T.," Proc . 30th Ind. Waste Conf., Purdue Univ., Ann Arbor Sci.Publ., Inc., Ann Arbor, Mich., 897, 1977.
"Areawide Assessment Procedures Manual - Volume III, MunicipalEnvironmental Research Laboratory, Cincinnati, Ohio 45268, EPA600/9-76-014, July 1976.
Atwell, J. S., "Sludge Dewatering Techniques Must Meet Pollution ControlRequirements," Pulp & Paper, Vol. 42, p. 180, November 1978.
Austin, E. P., "The Filter Belt Press - Application and Design,"Filtration and Separation, p. 320, July/August 1978.
Bassett, D. J., et al., "Performance Comparison of Filter Press, BeltPress and Centrifuge Units for Dewatering of Citrus Processing/ActivatedSludge," Proc. 33rd Ind. Waste Conf., Purdue, Univ., Ext. Ser., 1978.
Basso, A. J., "Getting the Most Out of Filter Aids," ChemicalEngineering, p. 185, September 1977.
Beardall, L. R., and Scarlett, B., "Separation and Classification onRotating Surfaces," Filtration & Separation, Vol. 17, p. 248, 1980.
Beardsley, J. A., "Sludge Drying Beds are Practical," Water and SewageWorks, Part 1, p. 82, July; Part 2, p. 42. August 1976.
199
Bechir, M.H., and Herbert, W.A., "Sludge Processing Using Som-A-Press,"Presented at the New England Water Pollution Control Association, October1976.
Bell, J.A., Higgins, R., and Mason, Donald G., "Dewatering, a New MethodBows," Water and Wastes Engineering, April 1977.
Bennett, E. R., Rein, D. A., and Linstedt, K. D., "Economic Aspects ofSludge Dewatering and Disposal," Journal of the Environmental EngineeringDivision ASCE, Vol. 99, p. 55, 1973.
Bergstedt, D. C , and Swanson, G. J., "Evaluation of a Twin-RollContinuous Press For Municipal Sludge Dewatering." Presented at the 49thAnnual Conference Water Pollution Control Federation, Minneapolis, MN,October 1976.
Bizjak, G. J., and Becker, A. E., Jr., "Wausau Solves Dual Problem byUsing Filter Press," Water and Wastes Engineering, p. 28, February 1978.
Brown and Caldwell Consulting Engineers, "Study of Wastewater SolidsProcessing and Disposal," Prepared for the Sacramento Regional CountySanitation District, June 1975.
Camp, Dresser & McKee, Inc., "Centrifugal Dewatering of Waste ActivatedSludge," Report on testing and equipment proposals for Jones IslandWastewater Treatment Plant, Milwaukee, Wisconsin, October 1977.
Cassel, Alan F., and Iwata, N., "Operation of a Pilot-ScaleDiaphragm-Type Filter Press," Proc. 3rd National Conf. on SludgeManagement Disposal and Utilization, Information Transfer, Inc.,Rockville, Md., p. 188, 1977.
Cassel, Alan F., and Johnson, Berinda P., "Evaluation of Filter Pressesto Produce High Solids Sludge Cake," Jour. New England Water Poll.Control Assn., Vol. 12, p. 137, February 1978.
Cassel, Alan F., and Johnson, Berinda P., "Toward Better Incineration:New Press Evaluated," Water and Sewage Works, Vol. 125, November 1978.
"Centrifugal, Dewatering of Sludges," Environmental Poll. Mgmt., Vol. 8,June 1978.
Cherry, G. B., and Walton, M., "A New Concept in the Use of FilterPresses: Development of the 'Six Eye1 Plate and Frame," Filtration &Separation, Vol. 17, p. 209, 1980.
Clark, E. I., and Fisk, B., "Dewatering Mixed Sludges," Water Poll.Control, Vol. 77, p. 509, 1978.
Clarke, W. N., et. al., "Digested Sludge Dewatering Experiences at OrangeCounty, California," Journal Water Pollution Control Federation, Vol. 53,p. 530, May 1981.
200
Clewett, M. A., and Handyside, R. N., "Asphaltic Concrete Sludge DryingBeds," Water, (Austral.), Vol. 3, p. 15 (1976); Water Res. Abs., Vol. 10,p. 11, W77-O5525, 1977.
"Construction Costs for Municipal Wastewater Treatment Plants," U.S. EPA,Office of Water Program Operations, Washington, D.C. 20460, MCD 37,January 1978.
"Cost of Landspreading and Hauling Sludge from Municipal WastewaterTreatment Plants," Office of Solid Waste, Washington, D.C. 20460, EPA530/SW-619, October 1977.
Cox, C. H., "Sludge Dewatering," U. S. Patent No. 4,041,854 (August 16,1977); Water Res. Abs., Vol. 10, p. 24, W77-12951, 1977.
Creek, John, "Tait Andritz SDM Sludge Dewatering Machine," WWEMAConference paper, April 20, 1977, Atlanta, GA.
Culp, G. L., "Handbook of Sludge Handling Processes - Cost andPerformance," Garland STPM Press, New York, 1979.
Culp, G. L., et. al., "Evaluation of Sludge Management Systems -Evaluation Checklist and Supporting Commentary," Office of Water ProgramOperations, Washington, D.C, 20460, EPA 430/9-80-001, February 1980.
Culp, Gordon L., and Heim, Nancy Folks, "Performance Evaluation andTroubleshooting at Municipal Wastewater Treatment Facilities," Office ofWater Program Operations, Washington, D.C. 20460, EPA 430/9-78-002,February 1978.
Culp/Wesner/Culp, "Energy Considerations in Wastewater Treatment,"Presented at CWC's Ninth Annual Wastewater and Water Treatment Seminar,September 1980.
Dembitz, A. E., "Belt Filter Press: A New Solution to Dewatering?" Waterand Wastes Engineering, p. 36, February 1978.
"Dewatering Sewage Sludge by Electro Osmosis, Part I - Basic Studies,Part II - Scale Up Data," Prepared by the Electricity Council ResearchCentre, Capenhurst, England, NTIS PB-276 and NTIS PB-276 412, 19 75 and1976.
Edmondson, B. R., and Brooks, D. R., "The Membrane Filter Plate," WaterServ., (G.B.), Vol. 81, p. 975, 272, 1977.
Eichmann, Bruce W. , "Dewatering Machine Solves Sludge Drying Problems,"Water and Sewage Works, October 1977.
Famang, M. A., and Martire, A. A., "A Disposal-Costing Method forEvaluating Sludge Dewatering Chemicals," Journal Water Pollution ControlFederation, Vol. 53, p. 162, February 1981.
201
Fernbach, E. and Tchobanoglous, G., "Centrifugal Screen Concentration forActivated Sludge Process," Water and Sewage Works, Part I, January; PartII, February 1975.
Fischer, R. , "An Economic Process for Drying Sewage Sludge,"Environmental Poll. Management, Vol. 6, p. 5, January 1976.
Galloway, F. R., "Cost Cutting is in the Basket," Water & WasteEngineering, Vol. 15, p. 10, 1978.
Gasper, H., "Selection of Equipment for Dewatering Sewage Sludge,"Filtration & Separation, Vol. 16, p. 23, 1979.
Goodman, B. L., and Higgins, R. B., "A New Device for WastewaterTreatment Sludge Concentration," Water and Wastes Engineering, August1970.
Guidi, Eugene J., "Growth and Benefits of Low-Speed Centrifuges," Waterand Sewage Works, Vol. 124, June 1977.
Gulas, Victor; Bond, Marvin; and Benefield, Larry, "Use of ExocellularPolymers for Thickening and Dewatering Activated Sludge, Journal WPCF,pp. 798-807, April 1979.
Gwilliam, R. D., "The E.C.C. Tube Filter Press," Filtration andSeparation, March/April 1971.
Hagstroem, L. G., "Two-Stage Sludge Dewatering with Decanter and BasketCentrifuge," Environ. Poll. Mgmt., Vol. 8, p. 1, January 1978.
Halde, R. E., "Fundamental Principles of Sewage Sludge Filtration,"Vatten (Swed.), Vol. 35, p. 200, 1979; Poll. Abs. 80-03310."Handling and Disposal of Sludges From Combined Sewer Overflow TreatmentPhase III - Treatability Studies," Environmental Protection TechnologySeries, Office of Research and Development, Cincinnati, Ohio 45268,EPA-600/2-77H)53C, December 1977.
Harnson, J. R., "Belt Filter Presses: Varieties to Choose From," Ind.Wastes, Vol. 25, p. 40, March 1979.
Howard, M. G., "The Economics of Horizontal Leaf Pressure Filter Designand Operation," Filtration & Separation, Vol. 16, p. 150, 1979.
"Innovative and Alternative Technology Assessment Manual," USEPA Officeof Water Program Operations, Washington, D.C., 20460, MCD 53, February1980.
Jaeger, E. A., "The Geometry of Scroll Centrifuges," Filtration &Separation, Vol. 16, p. 244, 1979.
Jeffrey, E. A., "Dewatering Rates for Digested Sludge in Lagoons,"Journal Water Pollution Control Federation, Vol. 32, p. 1153, 1960.
202
Johnson, A. F. , et al., "Construction, Operation and Performance of a NewVacuum Pressure Filter," Filtration & Separation, Vol. 17, p. 268, 1980.
Jordon, J. L., "Process for Sludge Disposal and Circular LandfillSystem," U. S. Patent No. 4,016,073 (April 5, 1977); Water Res. Abs. ,Vol. 10, p. 24 W77-12920, 1977.
Joyce, T. W., et al., "Factors Affecting Dewaterability of PrimarySludges," Tappi, Vol. 63, p. 73, March 1980.
Karr, P. R., and Keinath, T. M., "Limitations of the Specific Resistanceand CST Test for Sludge Dewatering," Filtration & Separation, Vol. 15, p.543, June 1978.
Kavanagh, B. V., "The Dewatering of Activated Sludge: Measurement ofSpecific Resistance to Filtration and Capillary Suction Time," WaterPoll. Contr., Vol. 79, p. 388, 1980.
Keener, Phillip M., and Metzger, Larry R., "Startup and OperatingExperience With a Twin Wire Moving-belt Press for Primary Sludge," Vol.60, No. 9, September 1977, TAPPI.
Kini, A. D., and Nayak, S. L., "Optimising Vacuum Filtration of SewageSludge," Filtration & Separation, Vol. 17, p. 313, 1980.
Kurita, T. and Suwa, S., "Filtration and Expression of Municipal Sludgesby the Automatic Press," Filtration & Separation, Vol. 17, p. 242, 1980.
Kurita, T., and Suwa, S-I., "How the Fully Automatic Filter Press HasDeveloped," Filtration & Separation, Vol. 15, p. 109, February 1978.
Leary, R. D., Ernest, L. A., Douglas, G. R. , Geinopolos, A., and Mason,D. G. , "Top-feed Vacuum Filtration of Activated Sludge," Journal WaterPollution Control Federation, Vol. 46, p. 1761, 1974.
Lee, S., "Diatomite Vacuum Filtration Improves Sludge Handling," Chem.Proc, Chicago, Vol. 42, p. 28, January 1979.
Leonard, R. J., and Parrott, J. W., "Sludge Dewatering at the Rohn andHaas Houston Plant," Proc, 33rd Ind. Waste Conf., Purdue Univ., Ext.Ser., 1978.
Marecek, J. and Novotny, P., "Optimizing the Performance of LeafFilters," Filtration & Separation, Vol. 17, p. 34, 1980.
Masters, A. L., "Filter Aids," Solid-Liquid Separation, Butterworths,Inc., Ladislav Svarovsky, editor, 1977.
Miner, R. E., et al., "Pilot Investigation of Secondary Sludge DewateringAlternatives," EPA-600/2-78/014, PB-280 982/OWP, 1978.
203
(I
I:
Moll, R. T., and Letki, A. G., "The Role of Centrifuges inMinimizing/Eliminating the Use of Chemical Additives in Dewatering andThickening of Industrial Wastes," Proc. 34th Ind. Waste Conf., PurdueUniv., (Ann Arbor Science, Ann Arbor, Mich.) 1979, p. 606, 1980.
Morris, K., "Microcomputers and Microprocessors in Filter Design and Con-trol," Filtration & Separation, Vol. 17, p. 109, 1980.
Murkes, J., and Carlsson, C-G., "Mathematical Modeling and Optimizationof Centrifugal Separation," Filtration & Separation, Vol. 15, p. 18,January 1978.
NCASI, "A Pilot Plant Study of Mechanical Dewatering Devices Operated onWaste Activated Sludge," Prepared for National Council of the PaperIndustry for Air and Stream Improvement, Technical Bulletin 288, November1976.
NCASI, "A Review of the Operational Experience with Belt Filter Pressesfor Sludge Dewatering in the North American Pulp and Paper Industry,"Prepared for National Council of the Paper Industry for Air and StreamImprovement, Technical Bulletin 315, October 1978.
Nelson, John K., and Tavery, Mary Ann H., "Chemical Conditioning Alterna-tives and Operational Control For Vacuum Filtration," Journal WPCF, pp.507-517, March 1978.
Nelson, 0. F., "Operational Experience with Filter Pressing," Water Pol-lution Control Federation - Deeds and Data, March 1978.
Nilsson, P., "Sludge Dewatering with Roto-Sieve," Vatten, (Swed.), Vol.32, p. 253, March 1976; Chem. Abs., 86, 16, 1977.
Novak, J. T., and Haugan, B., "Mechanisms and Methods for Polymer Condi-tioning of Activated Sludge," Journal Water Pollution Control Federation,Vol. 52, p. 2571, October 1980.
Novak, John T., and Langford, Mark, "The Use of Polymers for ImprovingChemical Sludge Dewatering on Sand Beds," Journal AWWA, pp. 106-110,February 1977.
Ohara, G. T., Raksit, S. K., and Olson, D. R. , "Sludge Dewatering Studiesat Hyperion Treatment Plant," Journal WPCF, pp. 912-925, May 1978.
Ohmiya, K., "Engineering Evaluation of New Sludge Treatment Facilities,"Journal Water Pollution Control Federation, Vol. 52, p. 943, 1980.
Osborne, D. G., "Screening," Solid-Liquid Separation, Butterworths, Inc.,Ladis lav Svarovsky, editor, 1977.
Pearse, M. J., and Barnett, J., "Chemical Treatment for Thickening andFiltration," Filtration & Separation, Vol. 17, p. 460, 1980.
204
"Pilot Investigation of Secondary Sludge Dewatering Alternatives,"Industrial Environmental Research Lab, Cincinnati, Ohio 45268, NTISPB-280-982, February 1978.
"Pressure Filtration of Wastewater Sludge With Ash Filter Aid," Office oResearch and Development, Cincinnati, Ohio 45268, EPA-R2-73-231, 1973.
Prinssen, A. A. J. A., "Vacuum Belt Filters," Filtration & Separation,Vol. 16, p. 176, 1979.
"Process Design Manual - Municipal Sludge Landfills," EPA-625/1-78-010,SW-705, October 1978.
Purchas, D., "A Practical View of Filtration Theory," Filtration &Separation, Vol. 17, p. 147, 1980.
Purchas, D. B., "Solid Sludge Liquid Separation Equipment: A PreliminarySelection Programme," The Chemical Engineer, Vol. 47, p. 1, 1978.
"Recommended Standards for Sewage Works," Great Lakes/Upper MississippiRiver Board of State Sanitary Engineers, 1971.
Regan, J. M., "Filter-Presses—Still Alive and Kicking!" Filtration &Separation, Vol. 14, p. 485, 1977.
"Review of Techniques for Treatment and Disposal of Phosphorus-LadenChemical Sludges," Office of Research and Development, Cincinnati, Ohio45268, EPA 600/2-79-083, February 1979.
Rodman, C. A., "Filter Media Performance and Fibre Morphology,"Filtration & Separation, Vol. 17, p. 543, 1980.
Rush, R. J., "Natural Freeze-Thaw Sewage Sludge Conditioning andDewatering," Canada Environ. Prot. Ser. Tech. Dev. Rep. EPS 4-WP-79-1,1979.
Rushton, A., et al., "Shear Effects in Cake Formation Mechanisms,"Filtration & Separation, Vol. 16, p. 456, 1979.
Salmi, M. W. , "Choose Dewatering Unit According to the Type of Sludge,"Water & Wastes Eng., Vol. 16, 1979.
Sandstedt, H. N., "Non-Wovens in Filtration Applications," Filtration &Separation, Vol. 17, p. 358, 1980.
Shaw, F. J., "Filter Press Feed Systems," Filtration & Separation, Vol.17, p. 454, 1980.
"Sludge Dewatering and Drying on Sand Beds," Office of Research andDevelopment, Cincinnati, Ohio 45268, EPA-600/2-78-141, August 1978.
"Sludge Filter Bags," Water & Water Trt. Jour. (G.B.), Vol. 21, p. 47,September 1978.
205
"Sludge Handling and Conditioning," Special Issue of Water and WastesEngineering, February 1978.
Sludge Handling and Disposal Practices at Selected Municipal WastewaterTreatment Plants," Office of Water Program Operations, Washington, D.C.20460, MCD 36, April 1977.
Stahl, W., "Cost/Performance Comparisons between Disk and Drum Filters,"Filtration & Separation, Vol. 15, p. 38, January 1978.
Svarovsky, L., "Filtration Fundamentals," Solid-Liquid Separation,Butterworths, Inc., Ladislav Svarovsky, editor, 1977.
Svarovsky, L., "Hydrocyclones," Solid-Liquid Separation, Butterworths,Inc., Ladislav Svarovsky, editor, 1977.
Syal, R. K., "Compare Sludge Handling Alternatives," Water and WastesEngineering, Vol. 16, p. 60, March 1979.
Szymanski, J. R. , "Evaluation of a Belt Filter Press," Jour. New EnglandWater Poll. Control Assn., Vol. 12, p. 155, February 1978.
Taylor, J. A., "Evaluation of Somat Som-A-System Dewatering Method forthe Norwich Water Pollution Control Plant, Norwich, Connecticut," SomatCorporation, Pomeroy, Pennsylvania, July 1978.
Tiller, F. M. , "Characteristics of Staged Delayed-Cake Filters,"Filtration & Separation, Vol. 15, p. 204, March 1978.
Vesilind, P. A., "Characterizing Sludge for Centrifugal Dewatering,"Filtration & Separation, Vol. 14, p. 115, 1977.
Viraraghavan, T., and Landine, R. C., "Economic Evaluation of Four SludgeDewatering Devices," Pollution Engineering, September 1978.
Wakeman, R. J., "Pressure Filtration," Solid-Liquid Separation,Butterworths, Inc., Ladislav Svarovsky, editor, 1977.
Wakeman, R. J., "The Performance of Filtration Post-Treatment Processes.1. The Prediction and Calculation of Cake Dewatering Characteristics,"Filtration & Separation, Vol. 16, p. 655, 1979.
Walker, J. T., "Unique Sludge Handling System Chosen in Dubuque," Water &Wastes Eng., Vol. 15, p. 20, February 1978.
Walski, T. M. , "Mathematical Model Simplifies Design of Sludge DryingBeds," Water and Sewage Works, p. 64, April 1976.
Wiksell, H. , and DeBesche, S., "Automatic Control of a CentrifugeProcess," Vatten (Swed.), Vol. 34, p. 10, January 1978; Chem. Abs., Vol.89, 117097.
206
Wilhelm, J. H., "The User of Specific Resistance Data in Sizing BatchType Pressure Filters," Jour. Water Poll. Control Fed., Vol. 50, p. 471,1978.
Young, R. A., "Cat Finds the Track to Sludge Disposal," Poll. Eng., Vol.10, p. 55, October 1978.
Yukawa, H., et al., "Fundatmental Study on Electroosmotic Dewatering ofSludge at a Constant Electric Current," Jour. Chem. Eng. of Japan, Vol.9, p. 402, May 1976; Chem. Abs., Vol. 86, p. 26, 194497m (1977).
Zacharias, D. R., and Pietila, K. A., "Full-Scale Study of SludgeProcessing and Land Disposal Utilizing Centrifugation for Dewatering,"presented at the 50th Annual Meeting of the Central States WaterPollution Control Association, May 18-20, 1977, Milwaukee, Wisconsin.
Zenz, David R., Sawyer, Bernard, and Watkins, Robert, "Evaluation ofDewatering Equipment For Anaerobically Digested Sludge," Journal WaterPollution Control Federation, Vol. 50, p. 1965, August 1978.
•a U.S. GOVERNMENT PRINTING OFFICE: 1902 - 5 5 9 - 0 9 Z / O 4 5 0 207