3. binary electrodes under equilibrium or near-equilibrium
TRANSCRIPT

1. Binary phase diagrams
2. A real example, the lithium: antimony system
3. Another example, the lithium: bismuth system
4. Temperature dependence of the potential
5. Application to oxides and similar materials
6. Ellingham diagrams
7. Liquid binary electrodes
3. Binary electrodes under equilibrium or near-equilibrium
(Huggins, ch. 3)

1. Binary Phase Diagrams
-Phase diagrams are figures that graphically represent the
equilibrium state of a chemical system.


The condition for balance is the ratio of the lengths L2 and
L1 be equal to the ratio of the masses M1 and M2. i.e.
M1/M2 = L2/L1
1.1 The Lever Rule

Q1/Q2 = L2/L1
Q1 and Q2 represent the amounts of phases 1 and 2

1.2 Examples of Binary Phase Diagrams
-four one-phase regions. The solid phases are designated as
phases α, β and γ. Liquid phase at higher T. Two-phase
regions
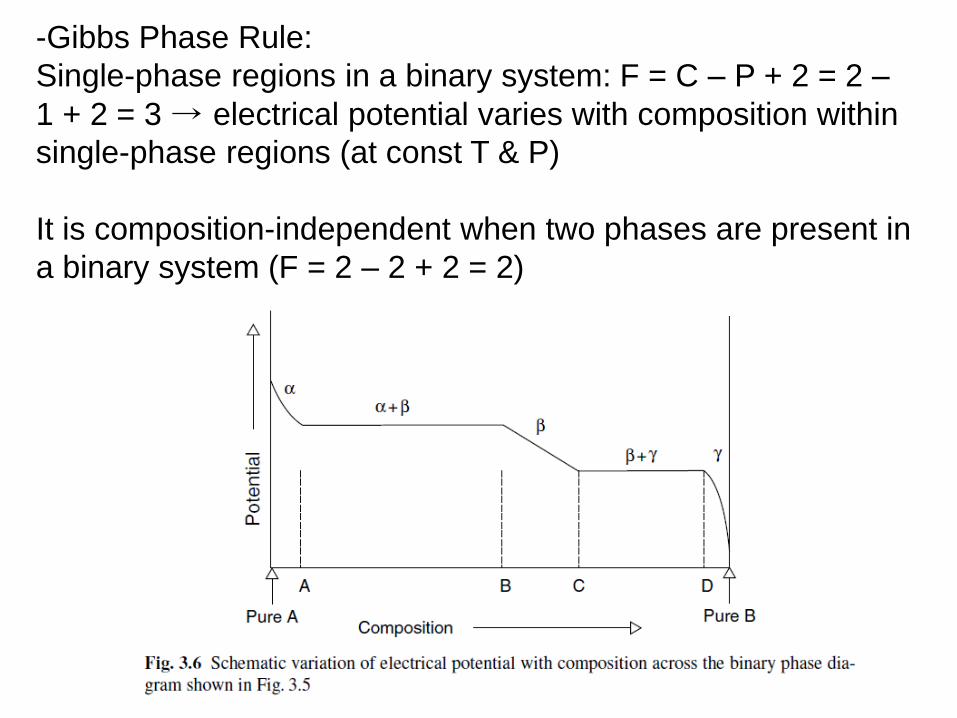
-Gibbs Phase Rule:
Single-phase regions in a binary system: F = C – P + 2 = 2 –
1 + 2 = 3 → electrical potential varies with composition within
single-phase regions (at const T & P)
It is composition-independent when two phases are present in
a binary system (F = 2 – 2 + 2 = 2)

-Line phase (β): quite narrow

-Potential drops abruptly due to line phase (β): quite narrow

2. A real example, the lithium: antimony system
<615℃, two intermediate phase: Li2Sb, Li3Sb

In pure Sb, addition of Li,
2Li+Sb = Li2Sb
On further addition of lithium,
Li+Li2Sb = Li3Sb
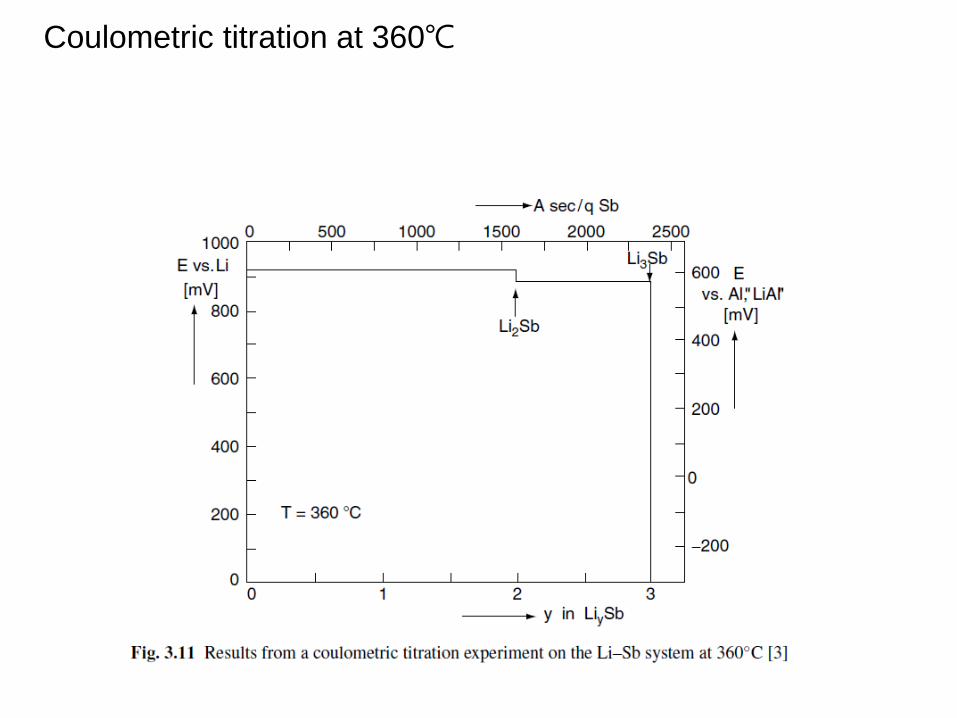
Coulometric titration at 360℃

Potentials of the two plateaus are calculated from
thermodynamic data on the standard Gibbs free energies of
formation of the two phases, Li2Sb and Li3Sb. (−176.0 kJ/mol
and −260.1 kJ/mol, respectively, at 360℃)
1st plateau: standard Gibbs free energy change(ΔGro) =
formation of phase Li2Sb, ΔGfo(Li2Sb)
E −Eo= −ΔGro/2F
where Eo is the potential of pure Li. This was 912mV in the
experiment
2nd plateau:
ΔGr◦ = ΔGf◦(Li3Sb)−ΔGf◦(Li2Sb)
E −Eo= −ΔGro/F
This was 871mV in the experiment
HW#6

-Maximum theoretical energy → total energy A + B
-Energy(J) = Voltage (V) x Capacity(C)
-total energy can be converted into specific energy (kJ/kg)
1st plateau, maximum theoretical specific energy (MTSE)
→ 1,298 kJ/kg = 360Wh/kg
2nd plateau, MTSE = 589 kJ/kg = 164Wh/kg
HW#6
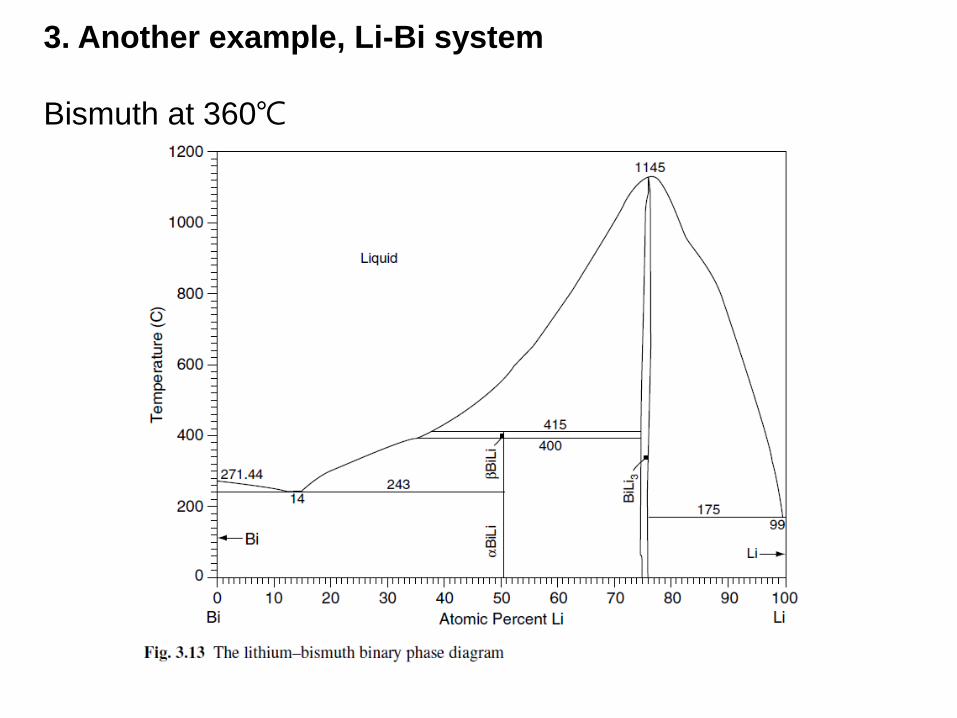
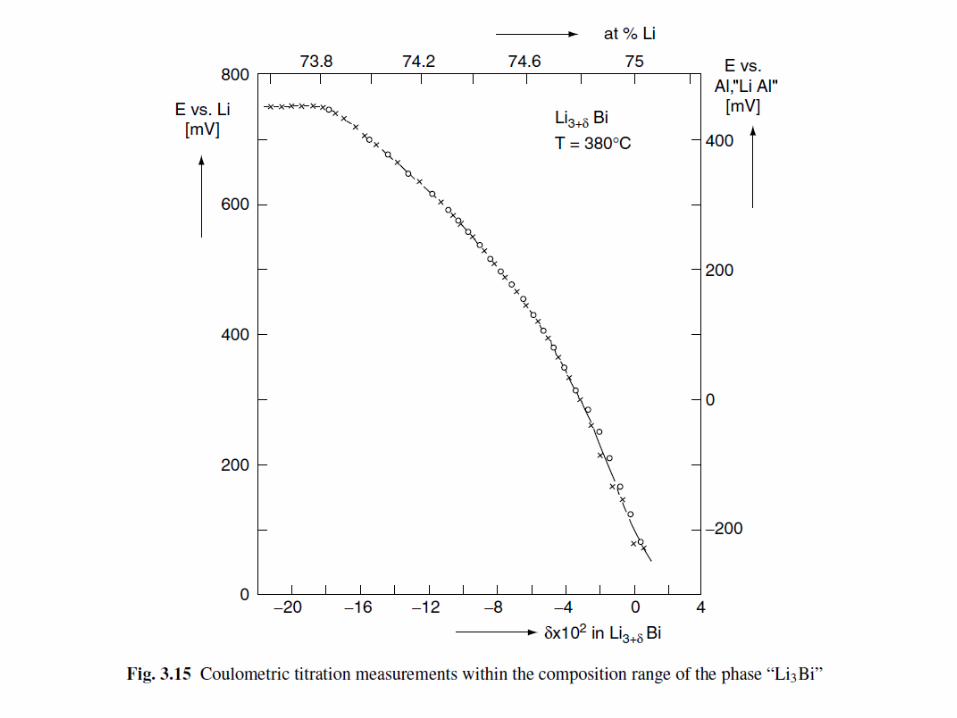
3. Another example, Li-Bi system
Bismuth at 360℃

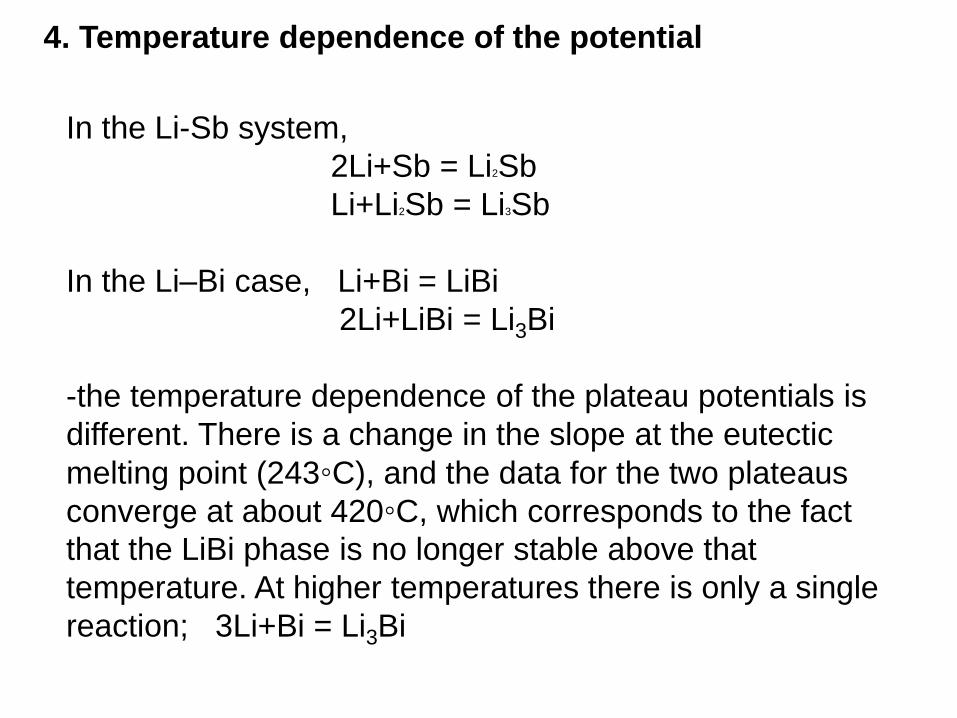
4. Temperature dependence of the potential
In the Li-Sb system,
2Li+Sb = Li2Sb
Li+Li2Sb = Li3Sb
In the Li–Bi case, Li+Bi = LiBi
2Li+LiBi = Li3Bi
-the temperature dependence of the plateau potentials is
different. There is a change in the slope at the eutectic
melting point (243◦C), and the data for the two plateaus
converge at about 420◦C, which corresponds to the fact
that the LiBi phase is no longer stable above that
temperature. At higher temperatures there is only a single
reaction; 3Li+Bi = Li3Bi


-the temperature dependence of the value of ΔGr◦, is evident
from the relation between the Gibbs free energy, the
enthalpy, and the entropy
ΔGr◦ = ΔHr
◦ − TΔSr◦
where ΔHr◦ is the change in the standard enthalpy and ΔSr
◦ is
the change in the standard entropy resulting from the
reaction. Thus it can be seen that
dΔGr◦/dT = ΔSr
◦
From such data, the value of the standard molar entropy
changes involved in these several reactions is obtained.

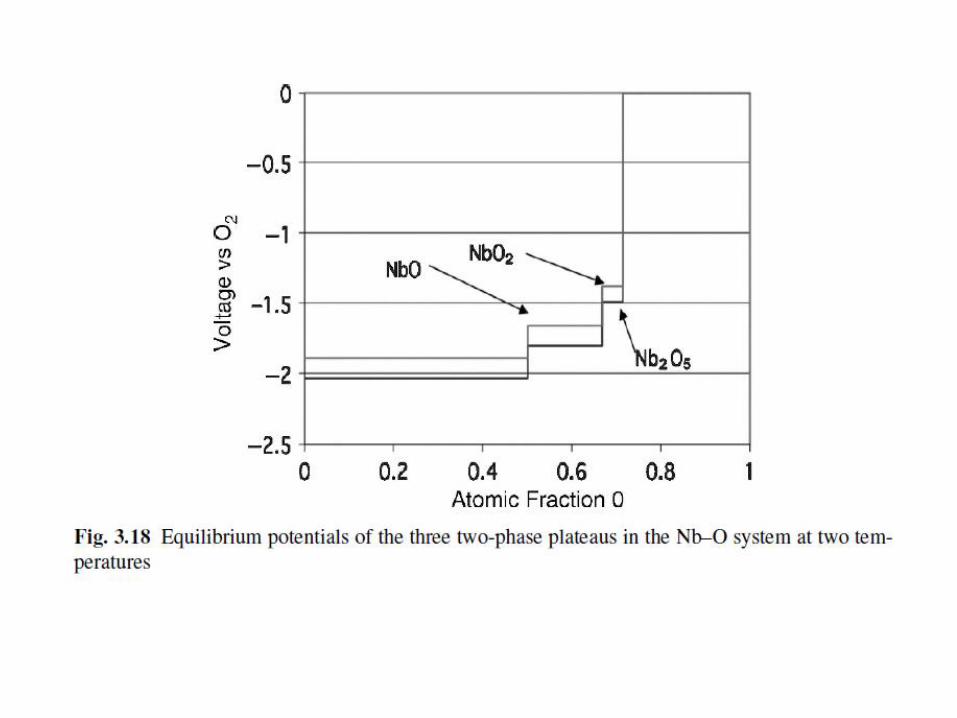
5. Application to oxides and similar materials –
metal-oxygen system
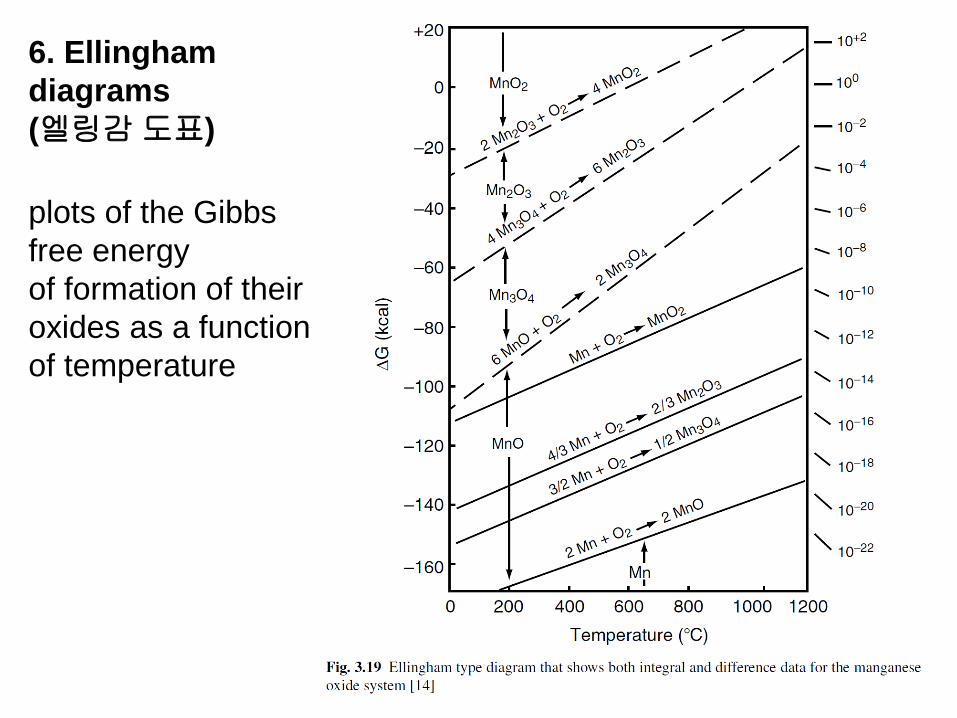
6. Ellingham
diagrams
(엘링감도표)
plots of the Gibbs
free energy
of formation of their
oxides as a function
of temperature
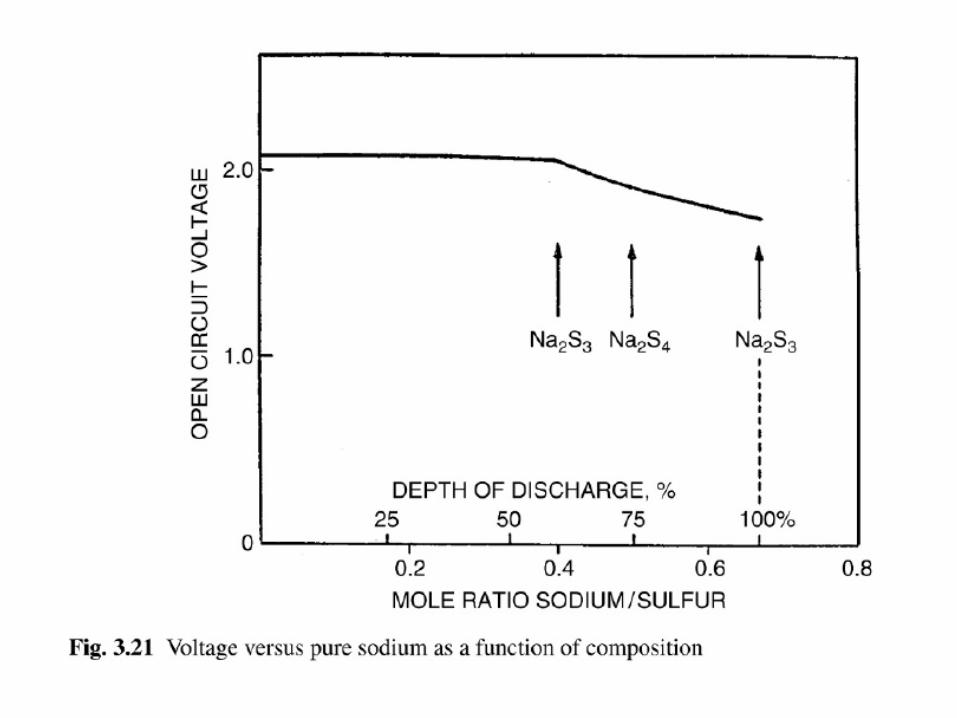
7. Liquid binary electrode
Na-S battery at 300℃Both electrodes are liquid (molten sodium, liquid sulfur)
Electrolyte : sodium beta alumina (solid Li electrolyte)
L/S/L system
xNa + S = NaxS
Two phase → single phase