3 chemical industry and value chain characteristics · 3 chemical industry and value chain...
TRANSCRIPT

3 Chemical Industry and Value Chain Characteristics
The chemical industry is the application field for the study and the devel-opment of a global value chain planning model. General characteristics of the chemical industry as application field are described in this chapter. Par-ticularities of chemical commodities are described in more detail being relevant for the considered case.
The considered global commodity value chain is specified applying a value chain typology. The typology is used also to define the work scope and to derive the value chain planning requirements.
3.1 Chemical Industry Characteristics
The chemical industry is presented in an overview with chemical value chain structures, industry specifics, market structures and trends before fo-cusing on commodities.
3.1.1 Chemical Industry Overview
The chemical industry is one of the key global industries with chemical product sales of € 1,776 billion globally in 2004 (CEFIC 2005, p. 3). In-dustries can be classified as mainly process, discrete or service industries between natural resources and the final end consumer need as shown in fig. 25.
The chemical industry is a sub-industry of the process industry. The process industry is characterized by production in processes that can be convergent as well as divergent. The process industry consists of firms that "add value by mixing, separating, forming and/or chemical reactions by either batch of continuous mode" (Wallace 1992 reviewed by Den-nis/Meredith 2000, p. 683). Products in process industries can be interme-diates and finished products at the same time sold or used for others prod-ucts. Other sub-industries in the process industries are oil and gas, steel and metals, pulp and paper or pharmaceuticals as well as parts of consumer goods such as food production.

64 3 Chemical Industry and Value Chain Characteristics
• Aerospace & defense
• Automotive• Consumer goods
(discrete)• Engineering &
construction• High tech
• Communication• Education & research• Financial services• Healthcare• Media• Public services• Retail • Transportation &
logistics
• Chemicals• Consumer goods
(process)• Mill & mining• Oil & gas• Pharmaceuticals • Pulp & paper• Utilities
• Organic resources
• Inorganicresources
• Clothing• Communication• Education• Health• Housing• Leisure• Mobility• Nutrition• Security
Naturalresources
Process industries
Discreteindustries
Serviceindustries
End consumerneeds
Fig. 25 The chemical industry as part of the process industry
The manufacturing pendant to process industry is the discrete industry e.g. automotive or engineering industry, where discrete products are assembled using other discrete components. Here, production is convergent, since multiple input components are assembled to one produced product result-ing e.g. in built-to-order planning problems in the automotive industry (Meyr 2004a).
Thirdly, the service sector covering multiple services is characterized by intangible services not requiring a physical production. Industries and spe-cific companies are often not fully classifiable into these categories if mixed business model exist.
The chemical industry as part of the process industry sector can be per-ceived as a raw material supplier for other process as well as discrete in-dustries.
The term chemistry has roots in the Greek term khumeia meaning pour-ing together- , the Egypt term khemein meaning preparation of black pow-der and the Arabic term al-kimia leading to alchemy as the art of transfor-mation. Chemistry developed over ca. 1.300 years driven by key discoveries and innovations, which can be structured in three periods: the ancient period (until 7th century) characterized by trial and error, the mid-dle age (7th- 17th century) characterized by the alchemists and the modern times (after 17th) characterized by scientific chemical research (N.N. 2006g; N.N. 2006h; N.N. 2006i).
The current structure of the chemical industry can be characterized by the different products starting at with oil and gas and with further refine-ments on the following steps with petrochemicals, basis chemicals, poly-mers, specialties and active ingredients as shown in fig. 26.

3.1 Chemical Industry Characteristics 65
Productcategories
Applications
Polyolefines
Industrial gases
Oil & Gas Petro-chemicals
Basic Chemicals Polymers Specialties Active
Ingredients
• Ethylene• Propylene• Butadien
• PE• PP
• Butanediol• THF• HMDA
• Polycarbonate• ABS/SAN• PMMA
• Ammonia • Pigments• Dispersions• Coatings
• Additives
• Pharma intermediates• Vitamins• Flavors & Fragrances
• Foils• Refrigerants
• Fertilizer• Coolants
• Plastic bottles
• Plexiglass
• Light stabilizer• "Lotus effect"
coatings
• Herbicides• Food &
nutrition
Olefins
Inter-mediates
Inorganics
Performancepolymers
Performancechemicals
Finechemicals
Specialtychemicals
Agro-chemicals
Abbreviations: PE: Polyethylene; PP: Polypropylene; THF: Tetrahydrofuran; HMDA: Hexamethylenediamine; ABS: Acrylonitrile Butadiene Styrene; SAN: Styrene Acrilonitrile; PMMA: Polymethyl Methacrylate
Fig. 26 Chemical products in the chemical industry value chain
These products are used in multiple applications cross-industries e.g. in packaging, cooling, coatings, as well as food and nutrition. Product life cy-cles are often longer compared to other industries and products, e.g. semi-conductors posing different requirements on forecasting semiconductor demand (Mallik/Harker 2004). Products developed decades ago are still important raw materials sold to the market today. The chemical industry serves many other industries as raw material supplier and often serves as a good indicator for the overall economic development. The chemical indus-try has some specifics to be detailed in the following:
• The chemical product tree and the “Verbund” production • Every product is a finished product • Commodity products vs. specialty products • Batch, campaign and continuous production processes • Global vs. regional vs. local markets
The Chemical Product Tree and the “Verbund” Production
The chemical value chain shown in fig. 26 results into a product tree over multiple steps: starting from the oil refinery and a steam-cracker, chemical products are processed over multiple steps with increasing variety and complexity by adding further substances or additives. The chemical prod-uct tree is often reflected in the production structure of chemical produc-

66 3 Chemical Industry and Value Chain Characteristics
tion plants also called “Verbund” production: neighbored products are ar-ranged in factories at the same site linked by pipelines leading to highly in-tegrated production sites as shown illustratively in fig. 27:
1. Step 2. Step 3. Step n. Step Distribution network
Custom
ers
Steam-Cracker
Oil refinery
Fig. 27 Multi-stage structure of chemical industry production
Managing and planning these complex networks including production, ma-terial flows, inventories but also procurement and sales is a challenging task.
Every Product is a Finished Product
As illustrated in fig. 27, products produced in a chemical production net-work are by default “finished” products, meaning they can be sold to cus-tomers instead of being used as intermediate products in the next produc-tion step. This principle leads to additional complexity since production demand for a product is composed of secondary demand caused by the subsequent production step as well as market demand or sales opportuni-ties for this product. On the other hand, this also provides the opportunity to better utilize production assets by pushing excess production quantity to the market if the price is sufficiently attractive.

3.1 Chemical Industry Characteristics 67
Commodities vs. Specialties
A key product classification scheme in the chemical industry is the differ-entiation of specialty and commodity products. Kline (1976) provides a segmentation of the chemical industry into commodities, specialties and fine chemicals shown in fig. 28.
Specialty chemicals
Fine chemicals
Pseudo commodities
True commodities
Specialty chemicals
Fine chemicals
Pseudo commodities
True commoditiesHigh
LowProd
uctio
n vo
lum
e
Degree of differentiation
Low High
Fig. 28 Chemical industry segmentation example
This classification correlates with the chemical value chain and the product tree. Products produced in early stages of the product value chain are rather commodity-type products, while products produced in the very late stage of the value chain are rather specialty-type products. Commodity and specialty classification is often not straight-forward and can depend on a set of characteristics as shown in table 6:
Table 6 Differentiating characteristics of commodities vs. specialties
Characteristics Commodity Specialty Product type Standard Special Product lifecycle Mature Early stages Product variants Few Many Main buying criterion Price Unique Product Properties Volumes High (bulk) Small (bags) Unit value Low High Unit margins Low High

68 3 Chemical Industry and Value Chain Characteristics
Commodity vs. specialty is not only related to product properties from a company-internal perspective but also to the business associated with this product. The management of commodities is less focused on product com-plexity as in the case of specialties, e.g. related to product variants, pack-aging and small volumes. It is more related to manage large volumes and values as well as prices. Consequently, the differentiation of commodities and specialties impacts the management of the value chain significantly.
Continuous, Campaign and Batch Production Processes
Chemical production is a further area of characteristics and specifics in the chemical industry. Chemical products are produced in production proc-esses including a reaction of chemicals. These production processes can be differentiated in continuous, campaign and batch production processes as illustrated in fig. 29.
minP2P1
P2P1P1
timetimetime
throughput [t/h] throughput [t/h] throughput [t/h]
Continuous Campaign Batch
maxmax max
min min
Legend: production processes P1 and P2
Fig. 29 Production process types
Production processes differ with respect to production time and through-put. Continuous processes have a variable production time and variable throughput during the process. Continuous processes run on single-purpose assets with one product continuously produced not requiring regular change-over decisions.
Campaign processes have also variable production time. Different to continuous production, campaign production is related to multi-purpose assets, where different processes and products can run on the same produc-tion resource and change-over decisions between campaigns need to be taken. Finally, batch processes have a defined lot size, start and end time of production as well as throughput.
Batch production is also related to multi-purpose resources. The integra-tion of batch schedules across resources for related products is one of the most challenging production scheduling tasks. Commodity products are rather produced in continuous and campaign production mode with high

3.1 Chemical Industry Characteristics 69
volumes, while specialty products are rather produced in campaign and batch mode with smaller lot sizes and overall lower volumes.
Global vs. Regional vs. Local Markets
A third overview characteristic for the chemical industry is the geographi-cal orientation differentiated into global, regional and local as shown in fig. 30.
Fig. 30 Global, regional and local networks
Global networks are designed to serve a global market structured by the different continents. World-scale assets at the globally-oriented production sites are designed to serve global demand. The management of global ma-terial flows specifically based on container shipment is a key task and of-ten organized in global business units. Secondly, regional network are de-signed for separated regions such as NAFTA, EMEA and Asia. Similar production structures are located in the respective region and designed to serve this region. The value chain management for these businesses is also often structured into regional business units. Thirdly, local networks are designed around a specific site in an area of hundreds of kilometers mean-ing with distances. Local networks focus on integrated site management including partners and material flows. The geographical network orienta-tion has a significant influence on value chain management.
The chemical market with respective players, trends and products are described in the following as basis for a better understanding of the spe-cific application field.
3.1.2 Chemical Market and Development
Chemical market characteristics and development is important to under-stand requirements and drivers of this industry to be addressed by research and practitioners. The market overview is structured in different topics:

70 3 Chemical Industry and Value Chain Characteristics
• Chemical market overview: provide understanding for market structure and development by products, applications, regions and market players
• Chemical industry trends: provide overview on current trends and chal-lenges in the industry
Chemical Market Overview
The chemical industry is one of the largest global industries with an annual sales value of € 1,776 billion in 2005. The chemical industry in Europe counts for 2.5% within 24.5% overall industry contribution to the total GDP in the EU 15. Traditionally important markets for the chemical indus-try are Europe and the United States counting for 60% of global sales value in 2004 as shown in fig. 31 (CEFIC 2005).
Total Chemical Sales € 1,776 Bil. = 100%
559
2770
415
186
137
183
10098
EU-151)
Asia29%
EU-102)
US23%
Europe37%
Rest of Asia
Japan
China
LatinAmer.
Other11%
Other4)
United States1) First 15 countries of European Union2) New 10 countries joined European Union3) Other European countries e.g. Switzerland, Norway
and other in Centeral & Eastern Europe4) incl. Canada, Mexico, Africa & OceaniaSource: CEFIC (2005)
Global Chemical Sales by Regions- 2004, in Bil. € -
Rest of Europe3)
Fig. 31 Global chemical market by regions
However, Europe and the US face lower growth rates close to GDP growth while Asia is growing dynamically and already count for 29% of global chemical sales. Chemical companies operating in these markets face the situation that large part of the production capacities are located in the tradi-tional markets of North America and Europe, while the demand and growth opportunities are shifting to Asia.
This in-balance between demand and supply is reflected in the increase of global trade driven by globalization. Expansion of world trade for

3.1 Chemical Industry Characteristics 71
chemicals is driven by opening of markets with less protectionism and lowering of trade barriers such as import tariffs or restrictions on the regu-latory side but also by significant decline of transportation costs thanks to standardized container shipment. Considering the global balance of sales, imports and exports in 2004, Europe reached the highest level of trade im-port and export volumes compared to its sales within the region and com-pared to trade in other regions (COMTRADE 2005, p. 23) as shown in fig. 32.
Size of bubble corresponds to 2004 sales in billion Euro; arrows equal 2004 trade flows in billion Euro**) Including EU-25, Switzerland, Norway, other Central and Eastern European countries***) Including Canada, Mexico, Oceania & AfricaSource: ACC, CEFIC Analysis
415
United States
100
Latin America
656
EUROPE
Japan
186
Other Asia
183
137
China
98Rest of World***)
ASIA
NORTH AMERICA
LATIN AMERICA
Europe **)
Import: 15.6 Export: 7.7
Import: 106.6 Export: 88.3
Import: 131.4
Export: 423.6
Export: 104.7
Import: 357.8
Fig. 32 Global sales and value flows in the chemical industry
Globalization in the chemical industry is characterized by regional growth differences. High growth rates exist in emerging markets in Asia and East-ern Europe and lower growth rates in traditional mature markets such as the EU and NAFTA, where the majority of the chemical industry capaci-ties are located. These differences will drive further trade between tradi-tional producing regions and emerging demanding regions. This constella-tion is a key driver for global trade between these regions and would foster new investments and increase in capacities in the growing markets such as Asia with the core countries China, Japan, as well as Korea.
Along with globalization, the industry has generated large corporations of significant size acting around the global. The global top 50 chemical producers in 2004 had sales of 587 billion dollars with a profit margin of 8.1% and research and development spending of 2.1% both against sales (Short 2005). Still, the chemical industry is a very fragmented industry not much consolidated: the first three companies count for only estimated 5%

72 3 Chemical Industry and Value Chain Characteristics
global market share, the Top-50 companies count for 27% market share as shown in fig. 33.
Source: Short (2005), CEFIC (2005)
5.069USCelanese50
..
7.095USBOC30
..
16.274JPMitsubishi Chemical10
16.730CNChina Petroleum & Chemical9
18.088EUBayer8
21.209USBP7
24.928EUTotal6
27.781USExxonMobile5
29.497EURoyal Dutch/Shell4
30.130USDuPont3
38.189EUBASF2
US
Region
40.161
RevenueMil. $, 2004 Estimated Market Share in %
1
Rank
Dow Chemical
Company
12%
27%
21%
5%
Fig. 33 Company ranking in the chemical industry
Deans et al. (2002) confirm that the chemical industry is still in the second of four phases in industry consolidation phases towards an industry end-game with few very large corporations. Further global consolidation driven by internal organic growth as well as by external growths using mergers and acquisitions is expected.
Chemical Industry Trends
With the beginning of the 21st century, the chemical industry changes driven by several trends (see for example Staudigl 2004):
• Globalization: as shown increase of world trade driven by emerging markets especially in Asia is a main trend not only in the chemical in-dustry (Laudicina 2004). Besides managing global material flows, com-panies face new markets with suppliers, customers, but also new com-petitors from emerging markets.
• Consolidation: as shown further consolidation of the industry leads will drive the occurrence of increasingly large and complex corporations that needs to be managed (Deans et al. 2002, pp. 13-17)

3.1 Chemical Industry Characteristics 73
• Commoditization and margin pressure: product portfolios former being specialties are confronted with commoditization, standardization leading to margin pressure. 121 process industry managers reported in 2002 that cost reductions e.g. by restructuring, outsourcing and optimization of production networks have highest priority in 2003 (A.T. Kearney 2003).
• Innovation: recently several innovation areas emerged such as biotech-nology, nanotechnology, energy technologies as gene technology leav-ing the research laboratories; new products are expected to be using these basis technologies for new applications as well as substituting for-mer products.
• Legislation: specifically EU legislation targets to ensure health of con-sumers controlling toxic impact of chemicals; corporations are con-fronted with precise documentation and test procedures requiring sys-tems support to handle complexity. Globally, trade policies of the GATT and WTO has well as compatibility of standards and compli-ances are further conditions to be considered (Delfmann/Albers 2000, pp. 18)
• Sustainability: overall objective for human beings formulated by the United Nations in the 1990s is to ensure sustainable development for fu-ture generations; chemical companies have already started to translate this objective into their industry practice with respects to products de-veloped and sold, energy and natural resource efficiency in their proc-esses, climate protection, corporate social responsibility for the work-force as well as stakeholders in production and consuming areas; sustainability as an objective also already inspired operations research and supply chain literature (see for example Zhou et al. 2000; Al-Sharrah et al. 2002)
Budde et al. (2002) conclude that the chemical industry companies have to address globalization, increasing raw material prices and increased competition by focusing on core competencies, regional and global con-solidation but also on better pricing e.g. using an industry pricing strategy (Budde et al. 2002).
In addition to overall industry trends, the chemical industry has some specific value chain and supply chain requirements (Grunow/Günther 2001, Poesche 2001, A.D. Little 2003, Nienhaus et al. 2003, Shah 2005). The economic importance of supply chain and value chain management is significant since supply chain costs can represent as 60%-80% of a typical chemical manufacturer’s costs (Gibson 1998 reviewed by Garcia-Flores/Wang 2002). Moreover, value chain management addresses the overall improvement of the value-add between turnover and procurement

74 3 Chemical Industry and Value Chain Characteristics
costs. Therefore, some chemical industry-specific requirements for supply chain management are
• decrease supply chain costs by better using “economies of scale” spe-cifically in production by running longer campaigns and avoiding change-overs (A.D. Little 2003),
• decrease inventories and capital employed; for the related pharmaceuti-cal industry inventory value in global operating companies can reach up to 20-40% of turnover (Boeken/Kotlik 2001)
Hence, value chain management and specifically global value chain planning of commodities plays an important role for chemical companies due to the direct relation to globalization, consolidation as well as com-moditization. Specifics of chemical commodities are presented in the fol-lowing.
3.1.3 Specifics of Chemical Commodities
Commodity as a term is derived from the French term commodité meaning convenience in terms of quality and service based on the former Latin word commoditas meaning the appropriate measure of something (N.N. 2006j).
Commodities are mass products produced and sold in high volumes with standardized quality and few variants. Primary commodities such as natu-ral resources can be defined as “materials in their natural state” (Baker 1992) produced in large volumes and available from many sources (Champion/Fearne 2000).
The price is typically the key buying criterion for customers since ser-vice and product properties are of standardized quality and a less differen-tiating buying factor for customers.
Commodities are originally subject to economic research and financial market analysis (Meadows 1970; Labys 1973; Labys 1975; Hallwood 1979; Guvenen 1988). Natural resource commodities such as metals, agri-cultural products or oil and gas are subjects to research with the focus on effective and efficient market mechanisms from a macro-economic and fi-nancial market perspective. These commodities are mainly traded on many-to-many exchanges with double auction pricing mechanisms clear-ing offer and demand bids to determine market prices (Bourbeau et al. 2005; Xia et al. 2005). Market price transparency allows to analyze and trying to predict future prices using statistical models, e.g. as demonstrated for copper by Nielsen/Schwartz (2004). Compared to natural resource commodities, industry commodities markets are less perfect, little many-

3.1 Chemical Industry Characteristics 75
to-many exchange exists, mainly single-sided auctions or bilateral negotia-tions are applied as market pricing mechanisms.
Chemical commodity products are typically produced and sold in high volumes at low unit value to mass markets in comparison to specialties sold in lower volumes at higher unit value to specialized markets. Typical product categories with commodity character in the chemical industry are petrochemicals, basis chemicals and parts of polymers, while agriculture or nutrition products are rather specialties. However, also specialty products exist within commodity product categories, since value-adding substances can be attached to a commodity product to modify the material’s properties required by applications like color, inflammability, flexibility or resistance against hot or cold temperatures to name a few. Finished commodity prod-ucts sold to the market mainly require commodity products as key raw ma-terials that are produced on earlier stages of the chemical product tree. Naturally, every commodity product used to be a specialty when it was launched initially. Hence, commodity products and the respective markets are often more mature and exist for quite some time compared to specialty products. In case of overcapacities, commodity products can become sub-ject to aggressive price competition and suppliers try to improve their cost position e.g. by optimizing the production network (Ferdinand/Haeger 2001).
The production network for commodity products are often multi-level involving multiple steps, where on each step products flow into the subse-quent steps or they are sold to the market. Petrochemicals, e.g. as shown in fig. 34 with an example of Kuwait’s petrochemical industry, are a good example (Al-Sharrah et al. 2001, pp. 2110). The relation between oil and gas-near products on the left side and further processed products such as plastics like polystyrene get transparent. A main task is to plan these net-works and also look for simplification in material flows (Al-Sharrah et al. 2003). These chemicals are produced in large volumes in continuous or campaign production modes with certain flexibility in throughput and utilization between a minimum and maximum output level. Polystyrene is an example for a chemical material used for end user application e.g. in re-frigerators, packaging or consumer electronics (Franke 2005).

76 3 Chemical Industry and Value Chain Characteristics
Styrene
Benzene
Chem.gr. Propyl.
Butadiene
Isopropanol
Acetaldehyde
Hydrogen cyanideMethane
Ammonia
C-4 fraction
HCL Acrylonitrile
Toluene
Refinery gr. Propylene
SodiumHydroxide
Pentane
EthaneAcetylene
Ethylbenzene
Ethylene
Vinyl chloride
VAM
PVC
PolystyreneI.G.
PolystyreneE.B.
PolystyreneC.G.
Phenol
Cumene
ABS
Acrylic fiber
Acetone
Acetic acid
Abbreviations: HCL: Hydrochloric Acid; ABS: Acrylonitrile Butadiene Styrene; PVC: Polyvinyl Chloride; VAM: Vinyl Acetate Monomer
Fig. 34 Petrochemical industry example from Kuwait
Production processes for chemical commodities exist often already for decades and are continuously enhanced as shown in the following example from the 1970s. Commodity production processes this time already have been rather complex composed by multiple reactions and interim steps as shown in the following example of Caprolactam production, an intermedi-ate product for Polyamide (Sittig 1972, p. 139) in fig. 35.

3.1 Chemical Industry Characteristics 77
Continuous Production Process for Caprolactam Production via Nitrocyclohexanone and Aminocaproic Acid
Patent: Sheehan, D.; Vellturo, A.F.; Gay, W.A.; Hegarty, W.P.; Threlkeld, D.D.; US Patent 3,562,254, February 9, 1971
Fig. 35 Example of a chemical commodity production process
Commodity production planning requires to aggregate the process-internal units such as reactors, dryers or tanks into a an aggregate asset planned as a whole with dedicated interfaces of raw material input and production output as shown in the left and right part of the process example.
Typical management problems given volatile raw material and sales prices are driven by bottleneck steps in the network: e.g. Styrene is an ex-ample in the network shown in fig. 34 for a product used in multiple sub-sequent products. In this case, value chain planning across multiple steps from sales to raw material is required to decide the optimal use of Styrene on the subsequent steps not only considering this relation but the entire value chain network including raw material volumes and prices required to produce Styrene.
Prices for chemical commodities are volatile and can change regularly as shown in a further example for two polymers in fig. 36.

78 3 Chemical Industry and Value Chain Characteristics
Weeks1.500
2.000
2.500
3.000
3.500
Polymer 1 (natural) Polymer 2 (natural)
Price [€/t]
Source: Plastics Information Europe
Price Development for Polymer Examples - 1993-2004, €/t -
Fig. 36 Example of chemical commodity price development
Main price driver for chemical commodities is the development of oil prices influenced by many parameters as shown in the fig. 37 (s. Al-Sharrah et al. 2003, p. 4680). Not only direct demand and supply for crude-oil but also the development of substitutes such as natural gas or other energy forms such as nuclear power can have an influence on oil prices according to Al-Sharrah et al. as shown in fig. 37.
Slowing World Economic GrowthRising World (excluding OPEC) Oil Production
Natural Gas Substitution for OilOil Conservation
OPEC Capacity AdditionsOPEC Downstream Discounting to Gain Market Share
Accelerating World Economic GrowthOPEC Ability to Limit Production
Decline in the Use of Nuclear PowerDecrease in Oil Exports from the Former Soviet Union
Decline in U.S. Oil Production Environmental Restrictions Limiting Oil Exploration
and Coal Use
Oil prices
Fig. 37 Selected variables determining oil prices in the short range

3.1 Chemical Industry Characteristics 79
Since many influences exist, oil prices are volatile in a short range that price management of commodity chemicals dependent on crude oil require regular attention. Several authors investigate the relationship between crude oil prices and the prices of subsequent products such as Kerosene and Naphtha (Asche et al. 2003) as well as discuss optimal markup pricing strategies for petroleum refining (Considine 2001).
Chemical commodity prices are also analyzed regularly and published e.g. in journals and papers. For most of chemical products, no many-to-many exchanges as for natural commodities exist. Prices are rather negoti-ated bilaterally between supplier and customer based on contracts or spot business. Spot and contract pricing is mainly done bilaterally with some specific instruments established such as the ”European Contract Price” (ECP) in Europe where market participants can agree on a quarterly con-tract that is oriented in general at the price of the two leading suppliers in the respective industry (Rainer/Jammernegg, 2000, pp. 118). The right bal-ance between spot and contract has impact on the profit variability as shown by Seifert et al. (2002).
Prices are analyzed in regular market surveys where producers, consum-ers and merchants across a region are contacted to gather current price level. Results are published in magazines as shown in the following exam-ple from the ECN magazine (Todd 2004) or in web-based analysis ser-vices. Here, the typical differentiation in spot and contract gets transparent as shown in fig. 38.
Fig. 38 Bulk chemical price examples
80 3 Chemical Industry and Value Chain Characteristics
Commodity markets are also characterized by more intense competition in supply and demand with multiple offering suppliers and multiple demand-ing customers. This causes the fact that a customer can change to a differ-ent supplier and a supplier can supply alternative customers more easily compared to specialty markets. Specialty markets are also often character-ized by close cooperation between customer and supplier e.g. using just-in-time delivery in the automotive industry requiring a close integration and collaboration.
Concluding, due to price and volume volatility, margins and profitabil-ity are also volatile as already shown in fig. 1. Hence, managing chemical commodity value chains limited to volume management is not enough to ensure profitability (also Franke 2005). This also holds true increasingly for subsequent industries buying chemical commodities e.g. in the molding industry: here volatile raw material prices for polymers such as PE and PP impacts directly profitability of the molders (Hofmann 2004).
Chemical Commodity Characteristics Relevant for Value Chain Management
Initial characteristics relevant for chemical commodity value chain man-agement are:
• Raw material prices are volatile e.g. on a daily, weekly or monthly basis if not contractually fixed
• Raw material volumes are volatile depending on available supply and on the companies’ consumption rates in production, which can be stable but also dynamic, e.g. if higher production utilization requires more raw material
• Production and distribution quantities can vary from a minimum utiliza-tion to full capacity utilization
• Sales prices can change frequently e.g. on a daily, weekly or monthly basis if not contractually fixed
• Sales volumes vary driven by changing demand, but the company also has a certain flexibility to cut or push sales quantities compared to cus-tomer demand, for example if customer demand exceeds available com-pany supply.
This overview is further detailed and structured in the following sub-chapter, where the characteristics of a global commodity value chain as well as the model scope is defined.

3.2 Global Commodity Value Chain in the Chemical Industry 81
3.2 Global Commodity Value Chain in the Chemical Industry
A global commodity value chain can be characterized by a multiple set of attributes in a typology to formalize the planning problem. Purpose of this subchapter
• is to provide a typology to formally describe a value chain network • to apply the typology to specify the scope of the work
The defined scope determines the applicability of developed planning requirements and the planning model limited to the selected attributes. For example, the value chain for commodity production is focused on cam-paign and continuous production modes; batch production is out of the scope that planning requirements and consequently, planning model are not developed for batch production problems.
3.2.1 Global Value Chain Network Overview
The global value chain network for commodities in the chemical industry is composed by locations, resources and transportation lanes as illustrated in fig. 39
salesprocurement
production / secondary demand
production / secondary demand
transport sent & received quantities
= global procurement and sales location = global production location= transfer point= transport lane = resource
Region 1
Region 2
Region 3
Region 1
Region 2
Region 3
inventory
= group of distribution locations
Fig. 39 Global value chain network structures

82 3 Chemical Industry and Value Chain Characteristics
The value chain network consists of procurement, production, distribution and sales locations connected by transportation lanes. These locations be-long to the global region they are located in. Transports between global re-gions can take more than one month. The structuring of value chain net-works into locations and lanes can be found in APS as well as case-specific literature (Siprelle et al. 2003; Dickersbach 2004).
Sales locations cluster one or multiple customers or marketplaces based on geographical or market segmentation criteria.
Distribution locations are single or groups of storage facilities, ware-houses, distribution centers or logical inventory management points e.g. for modal split between transportation means (container terminals, cross-docking-stations, rail-truck-terminals, etc.). Transfer point (TP) as a char-acteristic name for global distribution locations is chosen in order to in-clude also distribution locations with modal split of different transportation modes. The transfer points are also a decoupling point between sales and production holding inventories (Lee, 2001, p. 195) according to the de-fined distribution strategy and business rules e.g. make-to-stock (MTS), make-to-order (MTO), etc.
A production location comprises one or multiple production plants where production resources are located. Production resources are single units or groups of production units aggregated to production lines or as-sets. Having the structure of chemical commodity value chain network as a network of chemical production processes in mind presented in fig. 34 (Al-Sharrah et al. 2001), production locations include respective resources and transportation lanes between production locations to model relations in chemical “Verbund” structures.
Procurement locations, finally, comprise one or multiple suppliers or marketplaces, products are procured from.
Transportation lanes represent the global highways to manage material flows between all locations in the network.
The specific value chain network is characterized in the following based on a value chain typology. Several authors developed typologies and char-acteristics to classify industrial value chains with focus on supply chain and production (Loos 1997; Delfmann/Albers 2000; Zeier 2002; Schaub/Zeier 2003, Meyr/Stadtler 2004).
Existing typologies are extended towards a value chain typology also considering aspects of sales and procurement value characteristics. The ty-pology classifies the value chain by overall network as illustrated in fig. 40:

3.2 Global Commodity Value Chain in the Chemical Industry 83
SalesDistributionProductionProcurement
• Product- type- lifecycle- number- customization- perishability
• Market- constellation- price mechanism
• Supplier- number- type- relation
• Offer- certainty- volatility- elasticity- flexibility
• Procurement- flexibility
• Resource- purpose- mode- throughput
• Process- method- factors- change-overs
• Output products- number- factors
• Input products- number- factors
• Distribution- sourcing- stages
• Transport- routes- modes- lead times
• Product- type- lifecycle- number- customization- perishability
• Market- constellation- pricing mechanism
• Customer- number- type- relation
• Demand- certainty- volatility- elasticity- flexibility
• Sales- flexibility- service
Network Characteristics
• Value creation focus• Value creation steps
• Geographical topography• Legal position
• Geographical configuration• Spatial dispersion
Fig. 40 Value chain typology
The characteristics are introduced now in detail and used to define the problem scope.
3.2.2 Network Characteristics
The value chain network can be characterized by the criteria listed in table 7. Attributes within work’s scope are underlined and explained in table 7.
Table 7 Network characteristics
Characteristics Attributes Geographical topography global, regional, local Legal position intercompany, intracompany Geographical configuration multinational, international, classic global, com-
plex global Spatial dispersion concentrated, host-market, specialized, vertical in-
tegration Value creation focus production, distribution Value creation steps single-step, multi-stage

84 3 Chemical Industry and Value Chain Characteristics
The network’s geographical topography can be global, regional or local as already illustrated in fig. 30. A global network with global distribution lo-cations in procurement, production, distribution and sales is considered leading to specifics like currency differences or long lead times between continents to name a few.
The legal position in the network distinguishes between intercompany and intracompany networks. Intracompany networks combine value chain networks of multiple companies and focus on cross-company optimization. Delfmann/Albers propose supply chain perspective as alternative time (Delfmann/Albers 2000, p. 35) differentiating between focal company and bird’s eye as shown in fig. 41:
“Focal company” “Bird’s eye”
intercompany perspective intracompany perspective
Fig. 41 Intercompany vs. intracompany perspective
Here, the scope is on an intercompany value chain network for one focal company that can make central planning decisions for its own facilities and tries to optimize the internal global value chain network with clear inter-faces to multiple customers and multiple suppliers.
Delfmann and Albers (2000) discuss further specifics of global supply chain management and network characteristics. They review characteris-tics such as geographical configuration and production spatial dispersion in global supply chains developed by Dicken (1998).
The geographical configuration classifies global networks into four categories (Delfmann/Albers 2000, pp. 19-20)
• multinational: a decentralized federation with many key assets and de-centralized decisions
• international: a coordinated federation with many decisions and respon-sibilities decentralized but controlled by the central headquarter
• classic global: centralized hub with centralized assets and decisions

3.2 Global Commodity Value Chain in the Chemical Industry 85
• complex global: distributed network of specialized resources and capa-bilities with a complex coordination and cooperation environment and decision making
The considered scope is focused on the classic global with mainly cen-tralized assets and decisions, since also considered production resources are treated as virtually global sources.
Besides, the production spatial dispersion distinguishes four cases illus-trated in fig. 42 (Dicken 1998 reviewed by Delfmann/Albers 2000, pp. 44-45).
(a)Globally concentrated
production
(b)Host-market production
(c)Product specialization for
a global or regional market
(d)Transnational
vertical integration
Fig. 42 Production unit spatial dispersion
• Production at single location; all products are produced and exported to world market
• Each production unit produces for its home regions all demanded prod-ucts, no export to other regions
• Each production unit in each region specialized only on one product to serve the world market and to reach economies of scale
• Each production unit performs a separate operation in production and ships its output to a final assembly plant in another region or according to a chain like sequence.
86 3 Chemical Industry and Value Chain Characteristics
In the considered case, each production is managed as a global source, Therefore, production is globally concentrated and there is lack of rela-tionship between the production site and the region where it is located.
The network’s value creation focus can lay on production and/or distri-bution. Retailers and traders have pure distribution focus. Manufacturing companies create value in production and distribution, which is the scope in this case.
Finally, the value chain network can have a single value-creation step or multiple value-creation steps in production and distribution where raw ma-terials are processed through several production and distribution steps be-fore being sold to the market. In the work, a multi-stage value chain net-work is considered.
3.2.3 Sales Characteristics
First parts of the sales characteristics are listed in table 8, attributes in the scope are underlined.
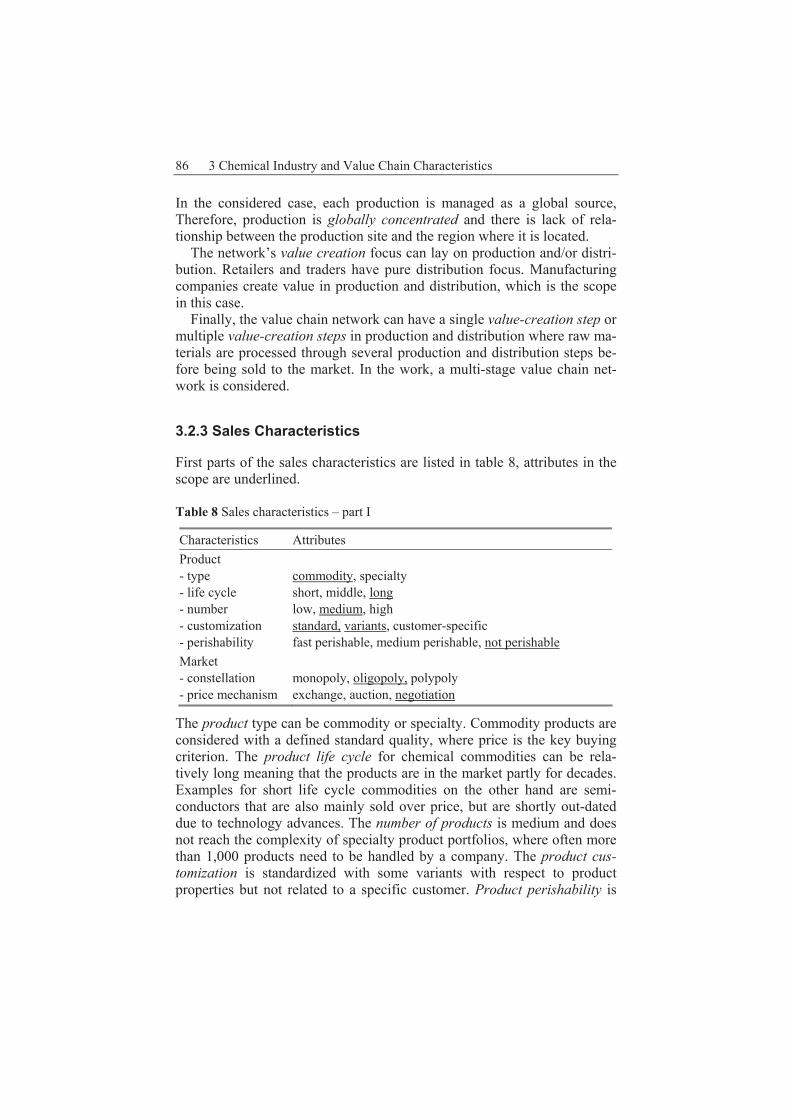
Table 8 Sales characteristics – part I
Characteristics Attributes Product - type - life cycle - number - customization - perishability
commodity, specialty short, middle, long low, medium, high standard, variants, customer-specific fast perishable, medium perishable, not perishable
Market - constellation - price mechanism
monopoly, oligopoly, polypoly exchange, auction, negotiation
The product type can be commodity or specialty. Commodity products are considered with a defined standard quality, where price is the key buying criterion. The product life cycle for chemical commodities can be rela-tively long meaning that the products are in the market partly for decades. Examples for short life cycle commodities on the other hand are semi-conductors that are also mainly sold over price, but are shortly out-dated due to technology advances. The number of products is medium and does not reach the complexity of specialty product portfolios, where often more than 1,000 products need to be handled by a company. The product cus-tomization is standardized with some variants with respect to product properties but not related to a specific customer. Product perishability is

3.2 Global Commodity Value Chain in the Chemical Industry 87
not a constraint for most of chemical commodities different to specialties such as food additives or fresh food production requiring incorporating shelf live in planning and systems (Günther et al. 2005).
The sales market constellation for these commodities is relatively ma-ture leading to an oligopoly constellation with few customers and few sup-pliers. Price mechanisms are bilateral negotiations between customers and suppliers; no formal exchanges or single-sided auctions are considered from the selling company perspective. The second part of the sales charac-teristics is shown in table 9.
Table 9 Sales characteristics – part II
Characteristics Attributes
Customer - number - type - relation
single, few, many internal, external contract, spot
Demand - certainty - volatility - elasticity
forecasted, stochastic, unknown stable quantity, volatile quantity, stable price, volatile price inelastic (0), relatively inelastic (<1), unitary elastic (=1), rela-tively elastic (>1)
Sales - flexibility - service
flexible quantity, fixed quantity, flexible price, fixed price standard, differentiating
The customer number is few mainly smaller than 500 customers compared to mass business with often more than 1 million customers or consumers. Customer types are external and company-internal customers buying on basis of transfer price agreements that are delivered with priority. There-fore, the customer relation is spot and contract-based with sales flexibility for a spot relation and fixed sales for contract relations. Customers can also have mixed spot and contract agreements depending on the product.
With respect to demand certainty, demand is forecasted with bid charac-ter and is not stochastic following for example a normal distribution pat-tern, since demand is influenced by the price development. With respect to demand volatility, demand prices and quantities are not stable but monthly volatile. The total demand elasticity is smaller or equal to 1 with respect to average prices. That means that average prices for total demand can change, if more or less sales quantity is sold in the market.
Consequently, sales flexibility exists with respect to total sales quantities and average prices for spot sales, while contract sales quantities and prices

88 3 Chemical Industry and Value Chain Characteristics
are fixed. Sales-related services such as technical services − e.g. applica-tion or product introduction support − or commercial services − e.g. sales force support or customer service support − or logistics services − e.g. de-livery services − or product-related services − e.g. brochures or product in-formation − can be standard and/or differentiating. Standards means that service level meet the market standards and customer expectations that sales-related services have no additional influence on the customer deci-sion and/or prices. Differentiating means that sales-related services pro-vided with the product are influencing the buying decision and/or prices e.g. services are charged separately. In this work, sales-related services are considered as standard having no influence on sales volumes or prices.
3.2.4 Distribution Characteristics
Distribution characteristics are related to inventory and transportation and are listed and underlined in table 10.
Table 10 Distribution characteristics
Characteristics Attributes Inventory - sourcing - stages
single-sourcing, multi-sourcing single-stage, multi-stage
Transportation - routes - modes - lead times
standard routes, variable routes single, multiple dedicated, multiple alternatively single-period, multi-period
Inventory sources in the global value chain network are multiple and it can be supplied from multiple distribution locations. Also, single-sourcing constellation exists. With respect to inventory stages, the global network includes multi-stage distribution locations resulting in multi-echelon in-ventory planning problems for example in the origin region and again in the destination region. The special case of single-stage inventory holding does also apply.
Transportation routes are standard routes predefined in the value chain strategy. Transportation modes are related to the means of transportation such as truck, rail, ship or air freight. Transportation mode can be single dedicated, meaning only one transport mode such as standard truck is used for the entire value chain network. Alternatively, multiple transportation modes are used e.g. standard truck, dangerous good truck, rail, ship or air freight either dedicated or alternatively by transportation lane and/or prod-
3.2 Global Commodity Value Chain in the Chemical Industry 89
uct. Dedicated means that each transportation lane has a dedicated trans-portation mode. Alternatively, means that multiple transportation modes are used for the same transportation lane. In a global network, multiple transportation modes are used e.g. ships for transcontinental shipments and truck and/or rail for ground transportation. In this work, the mode is clearly dedicated by transportation lane. Transportation lead times are multi-period for transcontinental shipments and single-period for local or regional transportation.
3.2.5 Production Characteristics
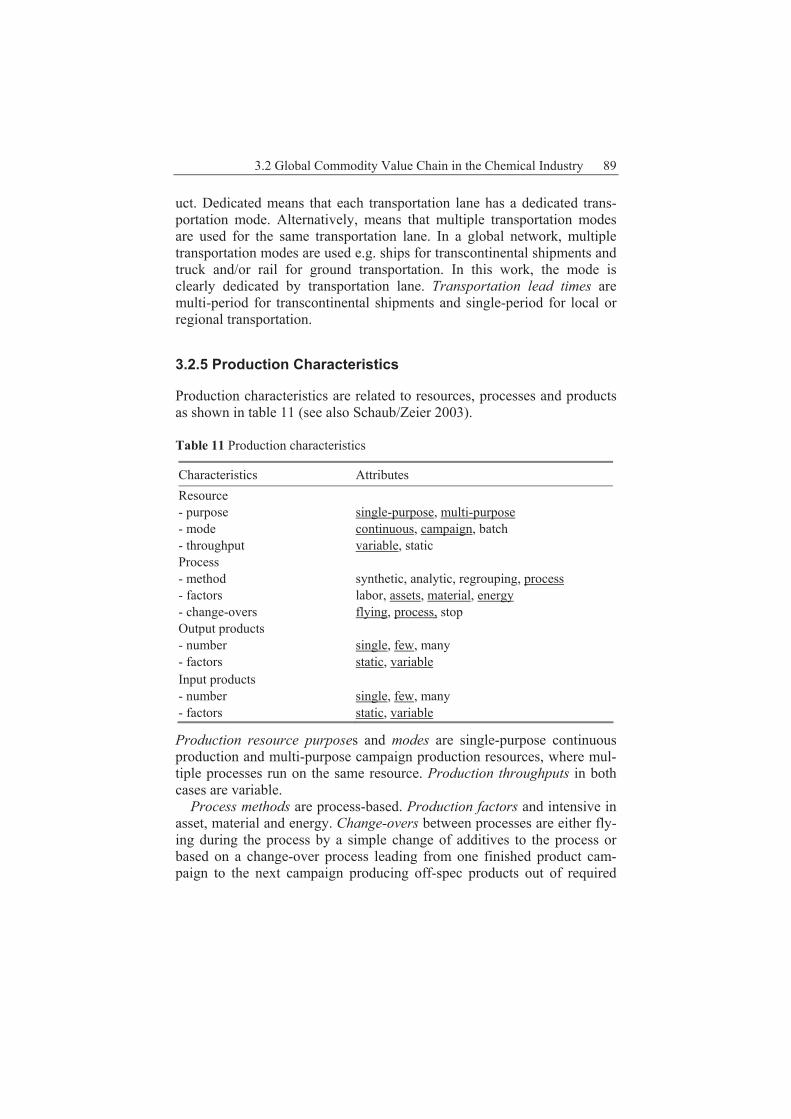
Production characteristics are related to resources, processes and products as shown in table 11 (see also Schaub/Zeier 2003).
Table 11 Production characteristics
Characteristics Attributes Resource - purpose - mode - throughput
single-purpose, multi-purpose continuous, campaign, batch variable, static
Process - method - factors - change-overs
synthetic, analytic, regrouping, process labor, assets, material, energy flying, process, stop
Output products - number - factors
single, few, many static, variable
Input products - number - factors
single, few, many static, variable
Production resource purposes and modes are single-purpose continuous production and multi-purpose campaign production resources, where mul-tiple processes run on the same resource. Production throughputs in both cases are variable.
Process methods are process-based. Production factors and intensive in asset, material and energy. Change-overs between processes are either fly-ing during the process by a simple change of additives to the process or based on a change-over process leading from one finished product cam-paign to the next campaign producing off-spec products out of required

90 3 Chemical Industry and Value Chain Characteristics
quality specifications. A complete stop of the resource is not required for a change-over between campaigns.
Output products can be one or multiple. Output factors are mainly static; some cases exist where output share relations of output products are variable meaning that the relation between multiple output products pro-duced in the same process can be varied within certain boundaries.
Input products are single to few and factors are mainly stable. Input fac-tors are reflected in the recipe. Recipe in the chemical industry is a syno-nym for the bill-of-material in discrete parts manufacturing and includes all input products with their respective input fraction required to produce one unit of one or several output products in a production process. In chemical production, the degree of raw material consumption rates and hence the recipe factors can depend on the processing mode of the equip-ment, which can be employed at different utilization or throughput levels. In this case, the recipe is not composed of static input factors but of recipe functions, which express the relationship between the input consumption and the process quantity produced.
3.2.6 Procurement Characteristics
Procurement characteristics structure is a mirror of the sales characteristics except the sales-related services provided to customers (s. table 12).
Table 12 Procurement characteristics
Characteristics Attributes Product - type - life cycle - number - customization - perishability
commodity, specialty short, middle, long low, medium, high standard, variants, customer-specific fast perishable, medium perishable, not perishable
Market - constellation - price mechanism
monopoly, oligopoly, polypoly exchange, auction, negotiation

3.2 Global Commodity Value Chain in the Chemical Industry 91
Table 12 (continued) Procurement characteristics
Characteristics Attributes
Supplier - structure - type - relation
single, few, many internal, external contract, spot
Offer - certainty - volatility - elasticity
forecasted, stochastic, unknown stable quantity, volatile quantity, stable price, volatile price inelastic (0), relatively inelastic (<1), unitary elastic (=1), relatively elastic (>1)
Procurement - flexibility
Flexible quantity, fixed quantity, flexible price, fixed price
Procured products are also commodities with a long life cycle; the number of products is relatively small compared to the number of finished prod-ucts. Customization is limited to standard raw materials. Raw materials considered are not perishable.
Market constellation is also an oligopoly with few suppliers and few buyers. Price mechanisms considered are also bilateral negotiations.
With respect to supplier structure and type, few suppliers are used and suppliers are internal and external; business relations with suppliers are spot and contract.
With respect to offer certainty and volatility, the offer is forecasted and volatile by quantity and price. With respect to elasticity, the offer is inelas-tic meaning that the price does not change if the company’s procurement quantity differs from the offer quantity.
Procurement flexibility exists for spot quantities, while contract quanti-ties are fixed. Prices are fixed in both cases.
3.3 Conclusions
Relevant characteristics of the chemical industry and the considered global value chain network have been presented in more detail. Results can be summarized:
• The chemical industry has a significant importance with respect to vol-umes and economic values. Value chain planning methods applied on this basis can have significant influence and lead to respective im-provements.

92 3 Chemical Industry and Value Chain Characteristics
• The globalization is a key trend in the chemical industry especially be-tween traditional industry markets in Europe and NAFTA and emerging markets in Asia. Planning and managing these flows is a further area, where value chain planning can provide significant decision support to overall volume and value optimization.
• Price and quantity volatility of commodities in procurement and sales require integrated volume and value decisions to ensure profitability.
• Planning the considered global value chain network has to address equally specifics in sales, distribution, production and procurement to reach a global optimum. A typology extending so far supply-focused ty-pologies by procurement and sales characteristics has been presented as a holistic basis for the value chain planning problem.