3 computation and interpretation of drought indicators · percent of normal 76 –100 51 –75 26...
TRANSCRIPT

27/03/2018
1
Computation and interpretation of different drought indicators
Dr. C.S. MurthyHead, Agricultural Sciences and ApplicationsNational Remote Sensing Centre, Hyderabad
[email protected], [email protected]
SATELLITE MONITORING OF AGRICULTURAL DROUGHT
Ground water Storage
Surface Storage
Runoff
Rain
Infiltration &Percolation
Satellite Sensors
Evapo transpiration
Biophysical Parameters
Vegetation Indices
AgriculturalDrought
MeteorologicalDrought
HydrologicalDrought
Runoff
27/03/2018
2
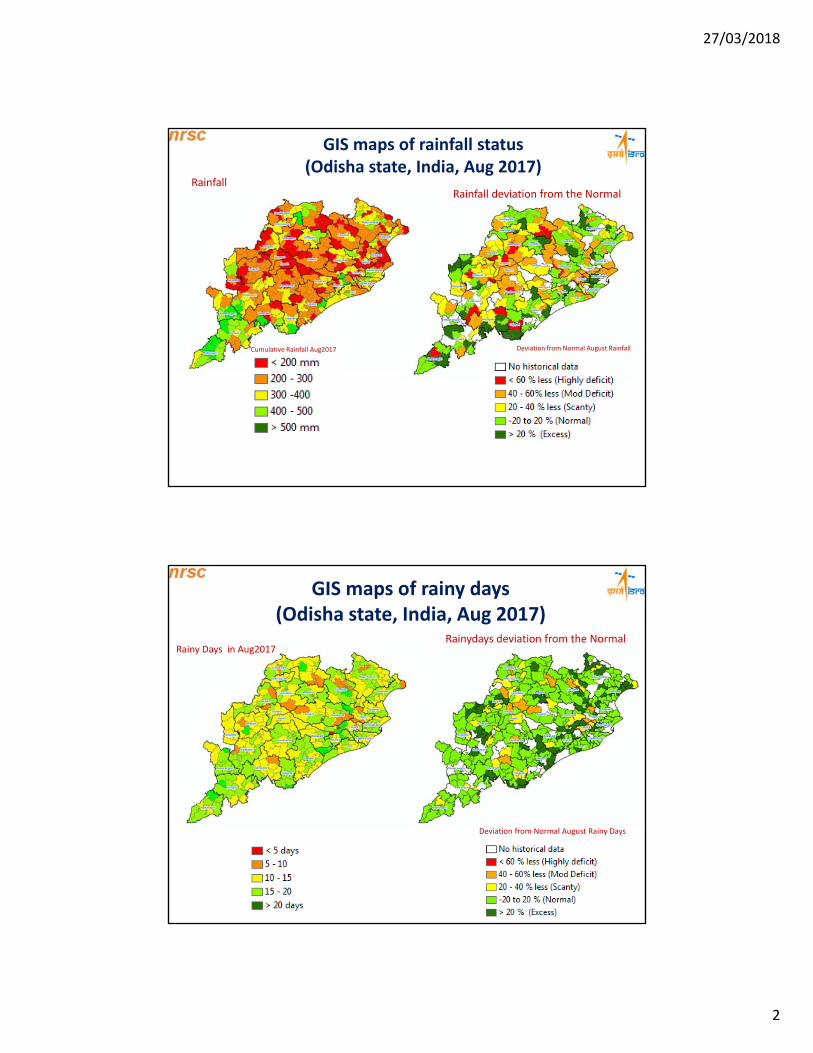
GIS maps of rainfall status(Odisha state, India, Aug 2017)
RainfallRainfall deviation from the Normal
Cumulative Rainfall Aug2017 Deviation from Normal August Rainfall
GIS maps of rainy days(Odisha state, India, Aug 2017)
Rainydays deviation from the NormalRainy Days in Aug2017
Deviation from Normal August Rainy Days
27/03/2018
3
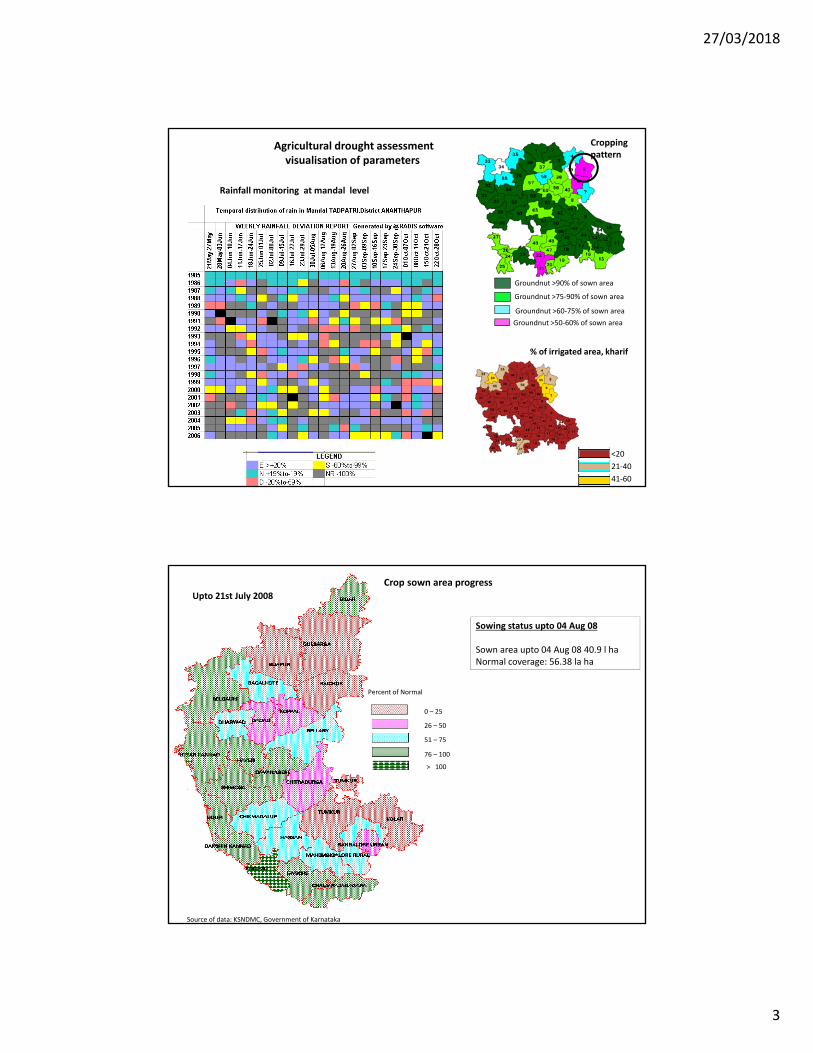
Groundnut >90% of sown area
Groundnut >75‐90% of sown area
Groundnut >50‐60% of sown area
Groundnut >60‐75% of sown area
% of irrigated area, kharif
<20
21‐40
41‐60
Agricultural drought assessmentvisualisation of parameters
Cropping pattern
Rainfall monitoring at mandal level
Percent of Normal
76 – 100
51 – 75
26 – 50
0 – 25
> 100
Source of data: KSNDMC, Government of Karnataka
Crop sown area progressUpto 21st July 2008
Sowing status upto 04 Aug 08
Sown area upto 04 Aug 08 40.9 l haNormal coverage: 56.38 la ha
27/03/2018
4
0
0.1
0.2
0.3
0.4
0.5
0.6
0.7
0
20
40
60
80
100
JUNE JULY AUG SEP OCT
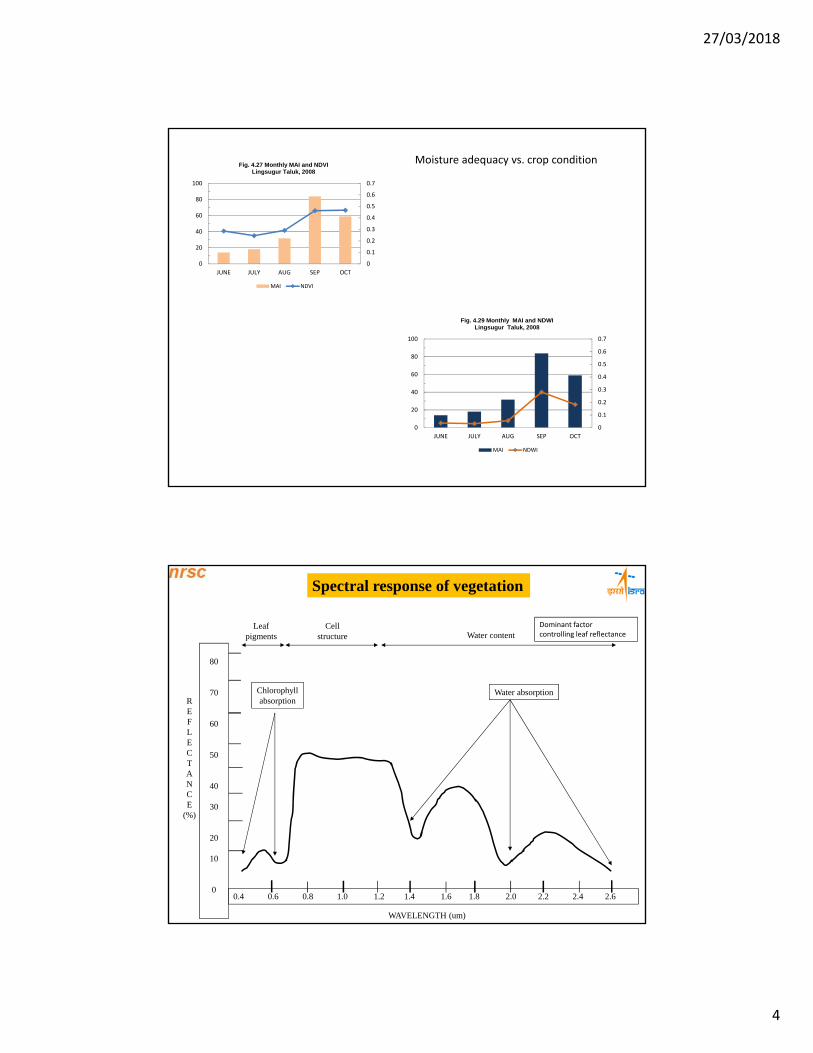
Fig. 4.27 Monthly MAI and NDVI Lingsugur Taluk, 2008
MAI NDVI
0
0.1
0.2
0.3
0.4
0.5
0.6
0.7
0
20
40
60
80
100
JUNE JULY AUG SEP OCT
Fig. 4.29 Monthly MAI and NDWILingsugur Taluk, 2008
MAI NDWI
Moisture adequacy vs. crop condition
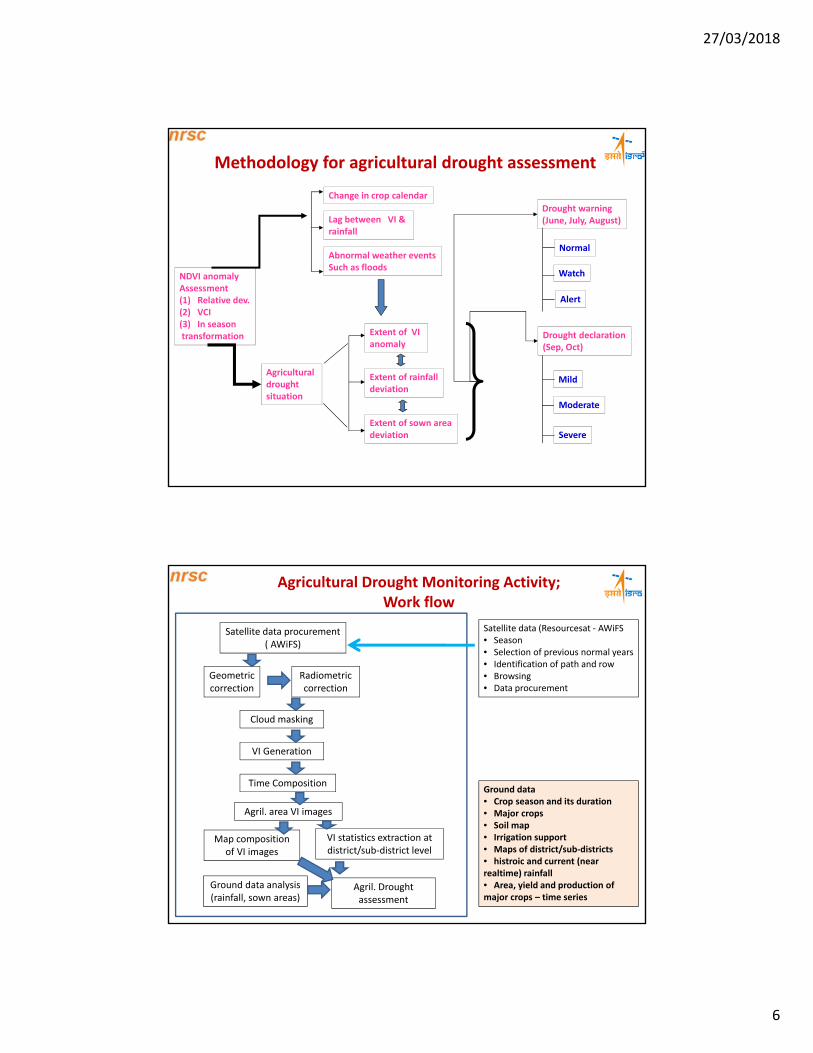
Cellstructure
Leafpigments
Chlorophyllabsorption
Water content
Water absorptionREFLECTANCE
(%)
WAVELENGTH (um)
0.4 0.6 0.8 1.0 1.2 1.4 1.6 1.8 2.0 2.2 2.4 2.6
80
70
60
50
40
30
20
10
0
Spectral response of vegetation
Dominant factorcontrolling leaf reflectance

27/03/2018
5
Wavelength range (µm) 0.62 – 0.67 (red)0.841 – 0.876 (NIR) Spatial Resolution 250m Swath 2330 kms
IRS‐WiFS IRS P6 AWiFS
Spatial resolution
56 metres
Wave lengths 4 bands
(green, red, NIR and MIR)
Swath : 700 kms.
Terra Modis NOAA AVHRR
Spatial resolution
188 metres
Wave lengths 3 bands
(green, red and NIR )
Swath : 700 kms.
Wavelength range (µm) 0.58 – 0.68 (red) 0.725 – 1.1 (NIR)3.55 – 3.93 (MIR)10.3 – 11.3 (TIR)11.5 ‐ 12.5 (TIR) Spatial Resolution 1.1 Km
Data from multiple satellites/sensors NATIONAL STATE DISTRICT
Spectral response of vegetationRed – more absorption due to chlorophyllNear Infra red – more reflection due to leaf structure
Normalized Difference Vegetation Index (NDVI)NIR – Red / NIR+RedReflected radiation in Near infrared and red bands.NDVI ranges from ‐1 to +1Water – negative NDVIClouds – zero NDVIVegetation – positive NDVI represents density, vigor
National Agricultural Drought Assessment & Monitoring System
District level
Sub‐district level
NADAMSOperational serviceSeason : kharifObjective: prevalence, intensity and persistence of agricultural drought at district/sub‐district level
Coverage : 13 states
• Meteorological drought: reduced rainfall
• Hydrological drought: reduced surface water
• Agricultural drought: reduced soil moisture
Satellite/ Sensor Indices Relevant Parameter
Resourcesat AWiFS(60m)
NDVI, NDWI Crop condition, surface wetness
NOAA AVHRR (1km) NDVI Crop condition
Oceansat 2‐ OCM (360m) NDVI, ARVI Crop condition
Terra MODIS (500 m) SASI, NDWI Surface wetness/sown area discrimination
Terra AMSRE )25 km) Soil moisture Surface wetness/ sown area discrimination
INSAT 3A CCD (1 km) NDVI Crop condition
AWiFS NDVIFCC of R2 AWiFS
NDWI
AMSR E
Soil moisture
OCM 2 NDVI
SASI
27/03/2018
6
NDVI anomaly Assessment(1) Relative dev.(2) VCI(3) In seasontransformation
Agricultural drought situation
Change in crop calendar
Lag between VI & rainfall
Abnormal weather eventsSuch as floods
Extent of VI anomaly
Extent of rainfalldeviation
Extent of sown areadeviation
Methodology for agricultural drought assessment
Normal
Watch
Alert
Drought warning(June, July, August)
Drought declaration(Sep, Oct)
Mild
Moderate
Severe
Agricultural Drought Monitoring Activity;Work flow
Satellite data procurement( AWiFS)
Geometric correction
Radiometric correction
Cloud masking
VI Generation
Time Composition
Map composition of VI images
VI statistics extraction at district/sub‐district level
Agril. area VI images
Ground data analysis (rainfall, sown areas)
Agril. Drought assessment
Satellite data (Resourcesat ‐ AWiFS• Season• Selection of previous normal years• Identification of path and row• Browsing• Data procurement
Ground data• Crop season and its duration• Major crops• Soil map• Irrigation support• Maps of district/sub‐districts• histroic and current (near realtime) rainfall• Area, yield and production of major crops – time series

27/03/2018
7
04 AUG 11 AUG
12 AUG
Time composition of NDVI
Maximum value compositing (MVC)procedure
Data generation – cloud cover problem
04 AUG NDVI 11 AUG NDVI
12 AUG NDVI Time composite NDVI
27/03/2018
8
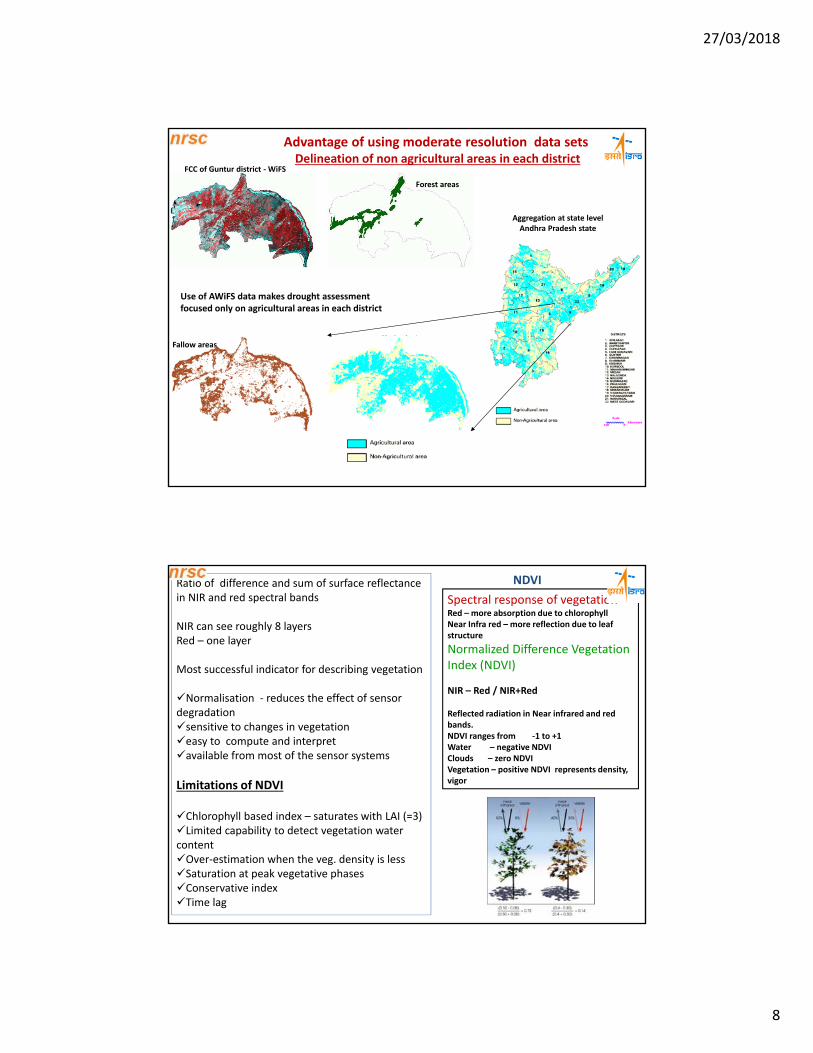
Advantage of using moderate resolution data sets Delineation of non agricultural areas in each district
FCC of Guntur district ‐WiFS
Use of AWiFS data makes drought assessment focused only on agricultural areas in each district
Forest areas
Fallow areas
Aggregation at state levelAndhra Pradesh state
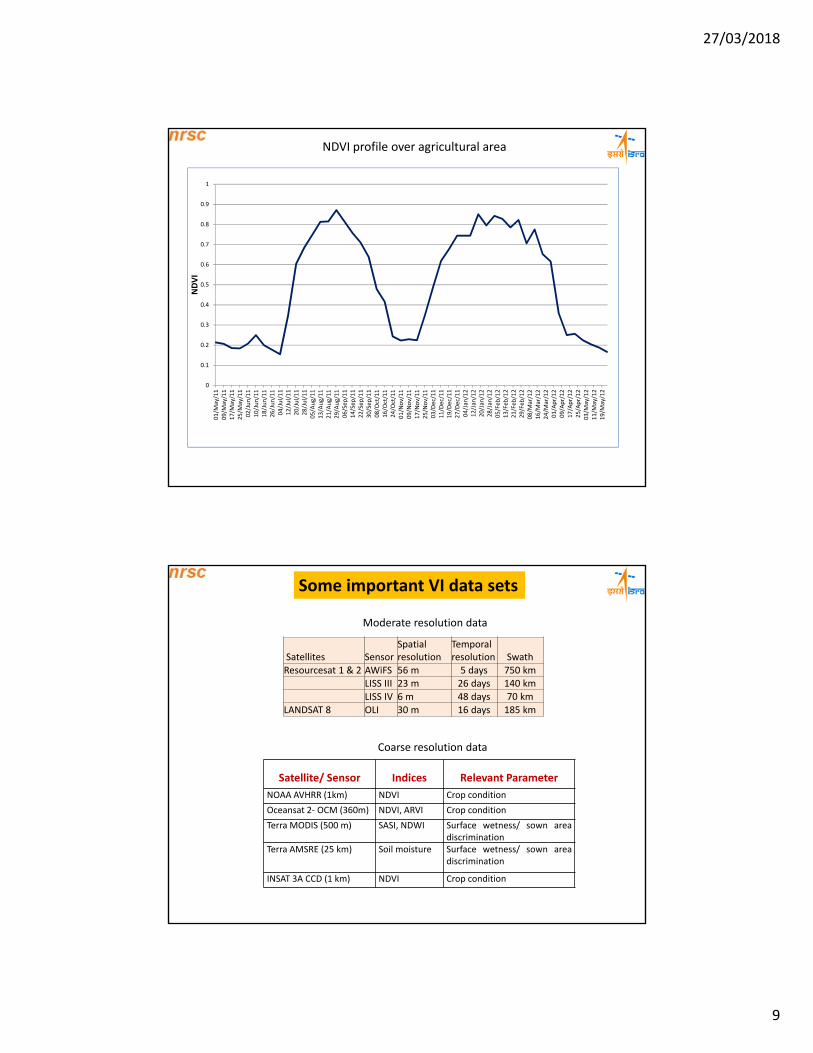
NDVIRatio of difference and sum of surface reflectance in NIR and red spectral bands
NIR can see roughly 8 layersRed – one layer
Most successful indicator for describing vegetation
Normalisation ‐ reduces the effect of sensor degradation sensitive to changes in vegetationeasy to compute and interpretavailable from most of the sensor systems
Limitations of NDVI
Chlorophyll based index – saturates with LAI (=3)Limited capability to detect vegetation water contentOver‐estimation when the veg. density is lessSaturation at peak vegetative phasesConservative indexTime lag
Spectral response of vegetationRed – more absorption due to chlorophyllNear Infra red – more reflection due to leaf structure
Normalized Difference Vegetation Index (NDVI)
NIR – Red / NIR+Red
Reflected radiation in Near infrared and red bands.NDVI ranges from ‐1 to +1Water – negative NDVIClouds – zero NDVIVegetation – positive NDVI represents density, vigor
27/03/2018
9
0
0.1
0.2
0.3
0.4
0.5
0.6
0.7
0.8
0.9
1
01/M
ay/11
09/M
ay/11
17/M
ay/11
25/M
ay/11
02/Jun/11
10/Jun/11
18/Jun/11
26/Jun/11
04/Jul/11
12/Jul/11
20/Jul/11
28/Jul/11
05/Aug/11
13/Aug/11
21/Aug/11
29/Aug/11
06/Sep
/11
14/Sep
/11
22/Sep
/11
30/Sep
/11
08/O
ct/11
16/O
ct/11
24/O
ct/11
01/N
ov/11
09/N
ov/11
17/N
ov/11
25/N
ov/11
03/Dec/11
11/Dec/11
19/Dec/11
27/Dec/11
04/Jan/12
12/Jan/12
20/Jan/12
28/Jan/12
05/Feb
/12
13/Feb
/12
21/Feb
/12
29/Feb
/12
08/M
ar/12
16/M
ar/12
24/M
ar/12
01/Apr/12
09/Apr/12
17/Apr/12
25/Apr/12
03/M
ay/12
11/M
ay/12
19/M
ay/12
NDVI
NDVI profile over agricultural area
Satellite/ Sensor Indices Relevant Parameter
NOAA AVHRR (1km) NDVI Crop condition
Oceansat 2‐ OCM (360m) NDVI, ARVI Crop condition
Terra MODIS (500 m) SASI, NDWI Surface wetness/ sown areadiscrimination
Terra AMSRE (25 km) Soil moisture Surface wetness/ sown areadiscrimination
INSAT 3A CCD (1 km) NDVI Crop condition
Satellites SensorSpatial resolution
Temporal resolution Swath
Resourcesat 1 & 2 AWiFS 56 m 5 days 750 kmLISS III 23 m 26 days 140 kmLISS IV 6 m 48 days 70 km
LANDSAT 8 OLI 30 m 16 days 185 km
Some important VI data sets
Coarse resolution data
Moderate resolution data
27/03/2018
10
.
-100
-50
0
50
100
150
200
250
300
.
12/6 19/6 6/6 3/710/7 17/7 24/7 31/7 7/8 14/8 21/8 28/8 4/9 11/9 18/9 25/9
% d
evi
atio
n
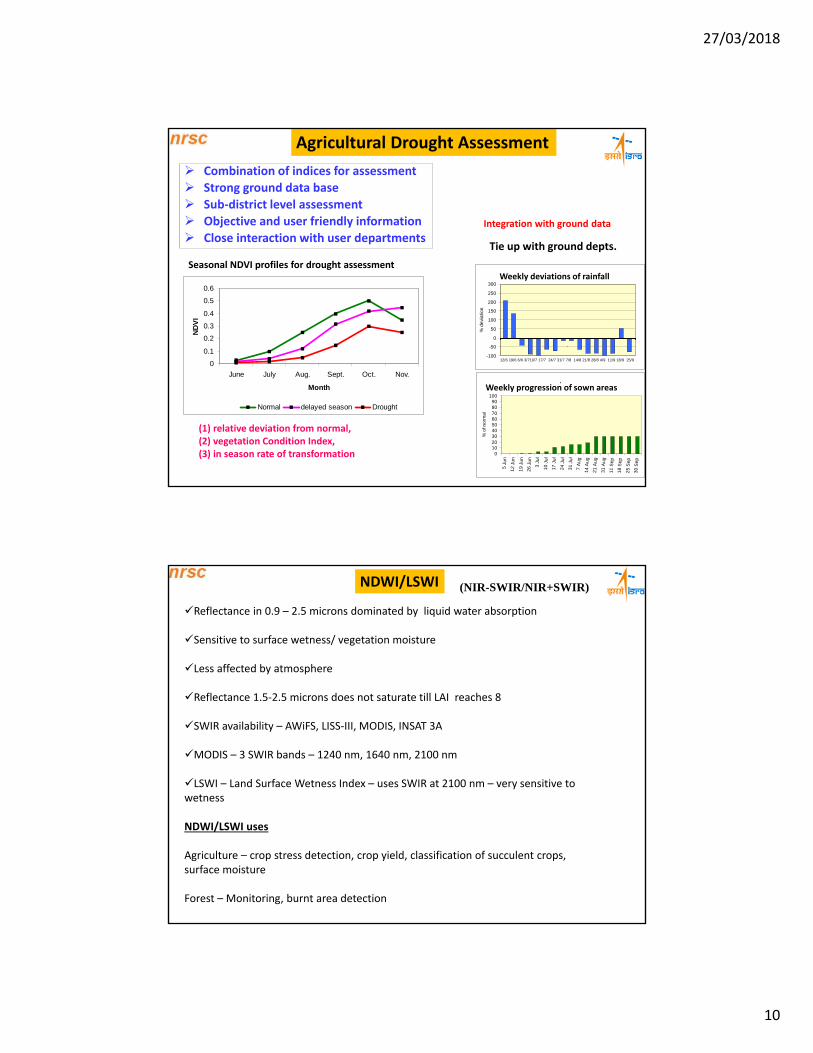
Agricultural Drought Assessment
Combination of indices for assessment
Strong ground data base
Sub‐district level assessment
Objective and user friendly information
Close interaction with user departments
0
0.1
0.2
0.3
0.4
0.5
0.6
June July Aug. Sept. Oct. Nov.
Month
ND
VI
Normal delayed season Drought
(1) relative deviation from normal, (2) vegetation Condition Index, (3) in season rate of transformation
Integration with ground data
.
0102030405060708090
100
5 J
un
12
Ju
n
19
Ju
n
26
Ju
n
3 J
ul
10
Ju
l
17
Ju
l
24
Ju
l
31
Ju
l
7 A
ug
14
Au
g
21
Au
g
31
Au
g
11
Se
p
18
Se
p
25
Se
p
30
Se
p
% o
f no
rma
l
Seasonal NDVI profiles for drought assessmentWeekly deviations of rainfall
Weekly progression of sown areas
Tie up with ground depts.
NDWI/LSWI
Reflectance in 0.9 – 2.5 microns dominated by liquid water absorption
Sensitive to surface wetness/ vegetation moisture
Less affected by atmosphere
Reflectance 1.5‐2.5 microns does not saturate till LAI reaches 8
SWIR availability – AWiFS, LISS‐III, MODIS, INSAT 3A
MODIS – 3 SWIR bands – 1240 nm, 1640 nm, 2100 nm
LSWI – Land Surface Wetness Index – uses SWIR at 2100 nm – very sensitive to wetness
NDWI/LSWI uses
Agriculture – crop stress detection, crop yield, classification of succulent crops, surface moisture
Forest – Monitoring, burnt area detection
(NIR-SWIR/NIR+SWIR)
27/03/2018
11
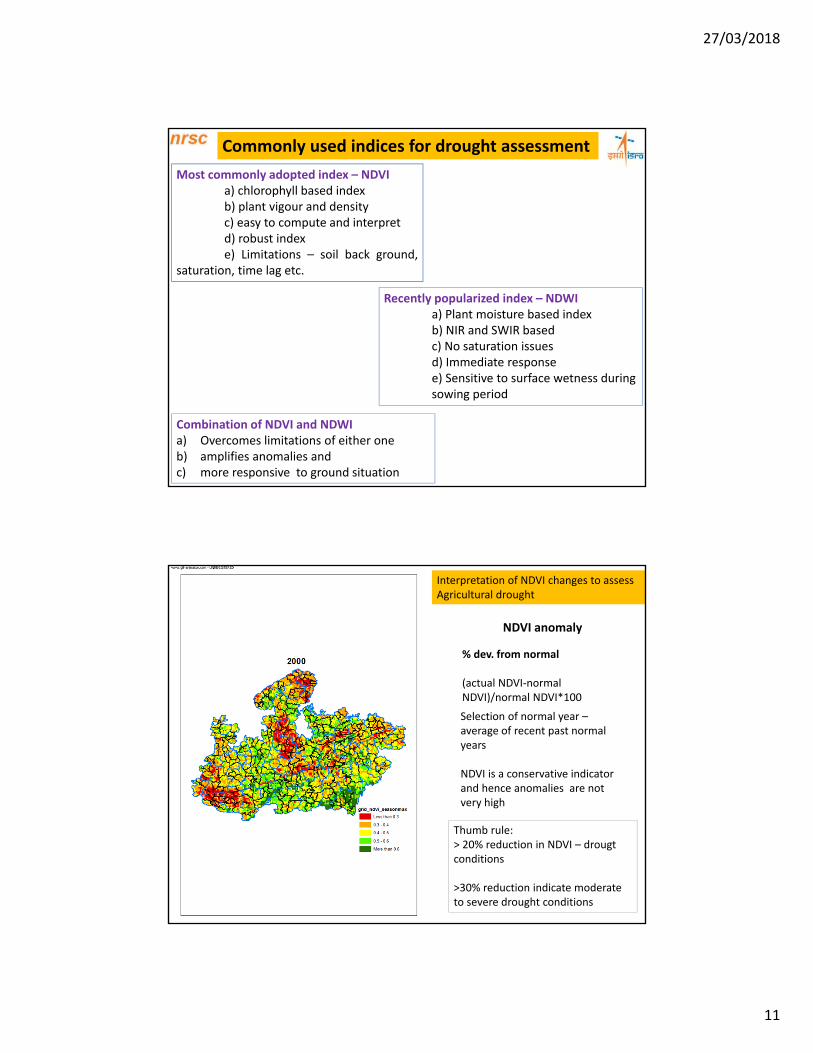
Most commonly adopted index – NDVIa) chlorophyll based indexb) plant vigour and densityc) easy to compute and interpretd) robust indexe) Limitations – soil back ground,
saturation, time lag etc.
Commonly used indices for drought assessment
Recently popularized index – NDWIa) Plant moisture based indexb) NIR and SWIR basedc) No saturation issuesd) Immediate responsee) Sensitive to surface wetness during sowing period
Combination of NDVI and NDWIa) Overcomes limitations of either oneb) amplifies anomalies andc) more responsive to ground situation
NDVI anomaly
% dev. from normal
(actual NDVI‐normal NDVI)/normal NDVI*100
Selection of normal year –average of recent past normal years
NDVI is a conservative indicator and hence anomalies are not very high
Thumb rule:> 20% reduction in NDVI – drougtconditions
>30% reduction indicate moderate to severe drought conditions
Interpretation of NDVI changes to assess Agricultural drought

27/03/2018
12
• Derivative of NDVI• Substitute to NDVI deviation
VCI = NDVI‐ NDVImin /(NDVImax –
NDVImin) *100
Range 0‐100%
<=25% severe drought25‐50 Moderate drought50‐75 Mild to moderate>75 Normal
Vegetation Condition Index (VCI)
Interpretation of NDVI changes to assess Agricultural drought
Vegetation Condition Index (VCI)
Computation
Septemberyear NDVI VCI
2000 0.5 8
2001 0.55 502002 0.6 922004 0.52 252005 0.55 50
2006 0.51 172007 0.49 02008 0.59 832009 0.61 100
2010 0.54 422011 0.51 17
Mean 0.54
Min 0.49Max 0.61diff 0.12
Some critical issues
Time series data base(at least 10‐12 years)
Differences due to cropping pattern, crop calendar to be normalised
VCI = NDVI‐ NDVImin /(NDVImax – NDVImin)
*100
27/03/2018
13
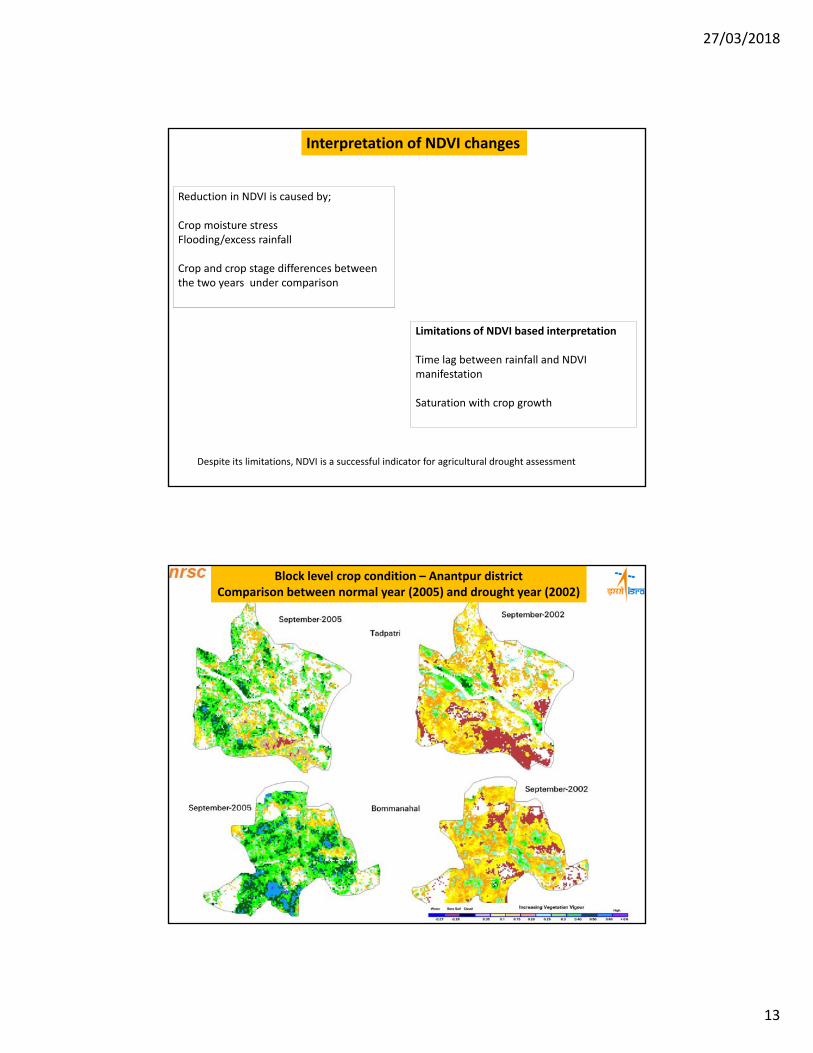
Interpretation of NDVI changes
Reduction in NDVI is caused by;
Crop moisture stressFlooding/excess rainfall
Crop and crop stage differences between the two years under comparison
Limitations of NDVI based interpretation
Time lag between rainfall and NDVI manifestation
Saturation with crop growth
Despite its limitations, NDVI is a successful indicator for agricultural drought assessment
Block level crop condition – Anantpur districtComparison between normal year (2005) and drought year (2002)

27/03/2018
14
Tadipatri mandal - Anantpur (Groundnut)
-0.100
-0.050
0.000
0.050
0.100
0.150
0.200
0.250
0.300
0.350
June July August Sep October
ND
VI
2005 2002
Pamidi mandal - Anantpur (Paddy)
-0.050
0.000
0.050
0.100
0.150
0.200
0.250
0.300
0.350
0.400
0.450
June July August Sep October
ND
VI
2005 2002
Impact of 2002 drought at mandal level Anantpur district
Mudigubba mandal - Anantpur districtgroundnut
-0.100
-0.050
0.000
0.050
0.100
0.150
0.200
0.250
0.300
0.350
0.400
0.450
June July August Sep October
ND
VI
2005 2002
Kanekal mandal - Anantpur districtgroundnut + paddy
-0.100
-0.050
0.000
0.050
0.100
0.150
0.200
0.250
0.300
0.350
0.400
June July August Sep OctoberN
DV
I
2005 2002
Crop area affected by drought in kharif 2015, West Bengal
5
17
40
29
81
0
10
20
30
40
50
< 10 %10‐20%
20‐30%
30‐40%
40‐50%
< 50 %
Agriltural area Affected
(%)
% of reduction in crop condition
Normal
Mild Moderate
Severe
Normal
Mild Moderate
Severe
10
26
47
15
2 00
10
20
30
40
50
< 10 %10‐20 %20‐30 %30‐40 %40‐50 %< 50 %
Agriltural area Affected
(%)
% of reduction in crop condition
Normal
Mild Moderate
Severe
23
3931
61 0
0
10
20
30
40
50
Agriltural area Affected (%)
% of reduction in crop condition
Purulia district Bankura district West Midnapur district

27/03/2018
15
AWiFS derived crop condition anomalies showing agricultural drought situation in Andhra Pradesh, kharif 2011
Sep 2011 Sep 2010 NDVI anomaly Sep 2011
NDWI anomalyOct 2011
0.00
0.10
0.20
0.30
0.40
0.50
FN1‐SEP FN2‐SEP FN1‐OCTFN2‐OCT Nov
NDVI
2010 2011
0.00
0.05
0.10
0.15
0.20
0.25
0.30
0.35
F1SEP F2SEP F1OCT F2OCT F1NOV
NDWI
2011 2010
NDWI ‐ Roddam mandal, AnantpurNDVI ‐ Roddam mandal, Anantpur
164 mandals394 mandals
562 mandals
Assessment atsub‐district level
Resourcesat AWiFS – A work‐horse for monitoring Agriculture
AWiFS NDVIOct. 2010 (Drought year)
AWiFS NDVIOct. 2008 (Normal year)
1. Pas. Champaran2. Pur. Champaran3. Sheohar4. Sitamarhi5. Madhubani6. Supal7. Ararai8. Kishanganj9. Purnia10. Madhepura11. Saharsa12. Darbhanga13. Muzaffarpur14. Gopalganj15. Siwan16. Saran17.Vaishali18. Samastipur19. Begusarai
20. Khagaria21. Katihar22. Bhagalpur23. Banka24. Munger25. Lackeesarai26. Sheikhpura27. Nalanda28. Patna29. Bhojpur30. Buxar31. Bhabua32. Rhotas33. Aurangabad34. Jahanabad35. Gaya36. Nawada37. Jamui
‐60
‐40
‐20
0
Jamui
Gaya
Jahana…
Buxar
Aurang…
Samasti…
Bhojpur
Nalan
da
Patna
Bhagalp…
% deviation from
norm
al
Rainfall deficiency
0
50
100
Jamui
Gaya
Jahana…
Buxar
Aurang…
Samasti…
Bhojpur
Nalan
da
Patna
Bhagal…% of norm
al
Crop sown area status
Crop areas affected by agriculturaldrought situation are showing lower NDVIcompared to normal, in kharif 2010 inBihar state.
Agricultural drought assessment(based on multiple indices; NDVI, NDWI, SASI)
Moderate (103)Severe (55)
Moderate (103)Severe (55)
Satellite derived Area Favourable for Crop Sowing/Crop Sown Area (AFCS) , Lakh ha.
Kharif Nromal Area
AFCS AFCS Unfavourable
Jul‐10 Aug‐10 area
37 19 23 14
27/03/2018
16
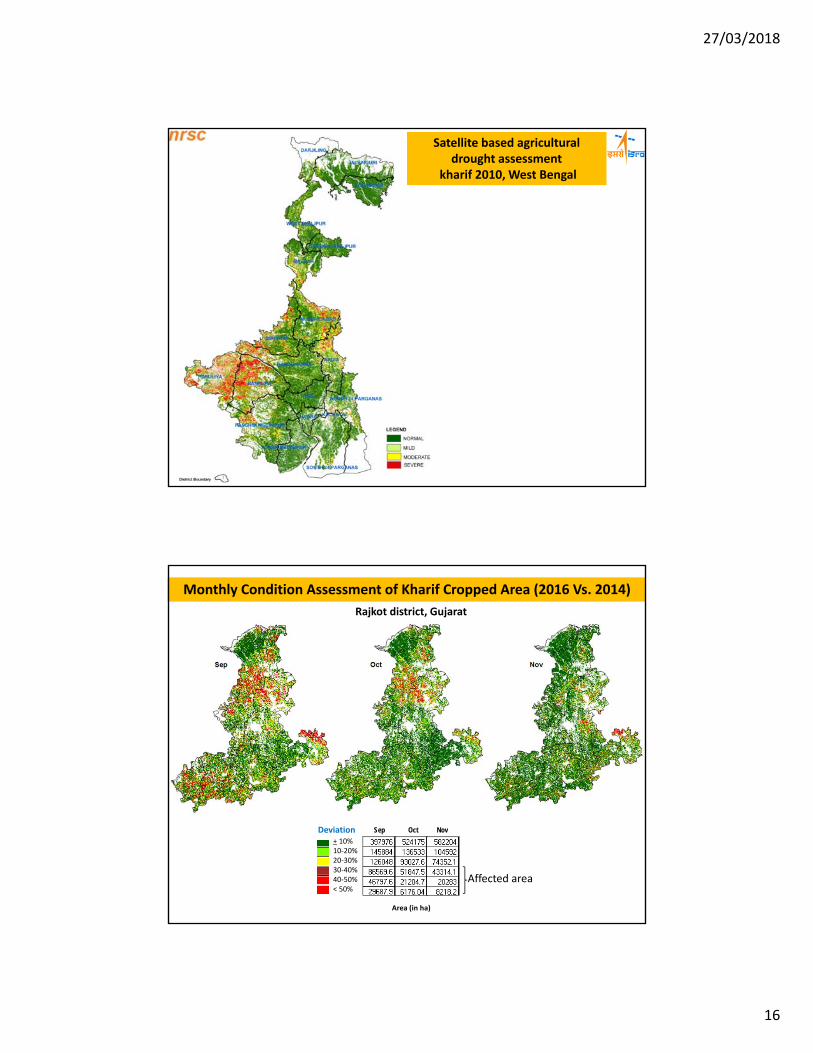
Satellite based agricultural drought assessment
kharif 2010, West Bengal
Monthly Condition Assessment of Kharif Cropped Area (2016 Vs. 2014)
+ 10% 10‐20%20‐30%30‐40%40‐50%< 50%
Sep Oct NovDeviation
Area (in ha)
Affected area
Rajkot district, Gujarat
27/03/2018
17
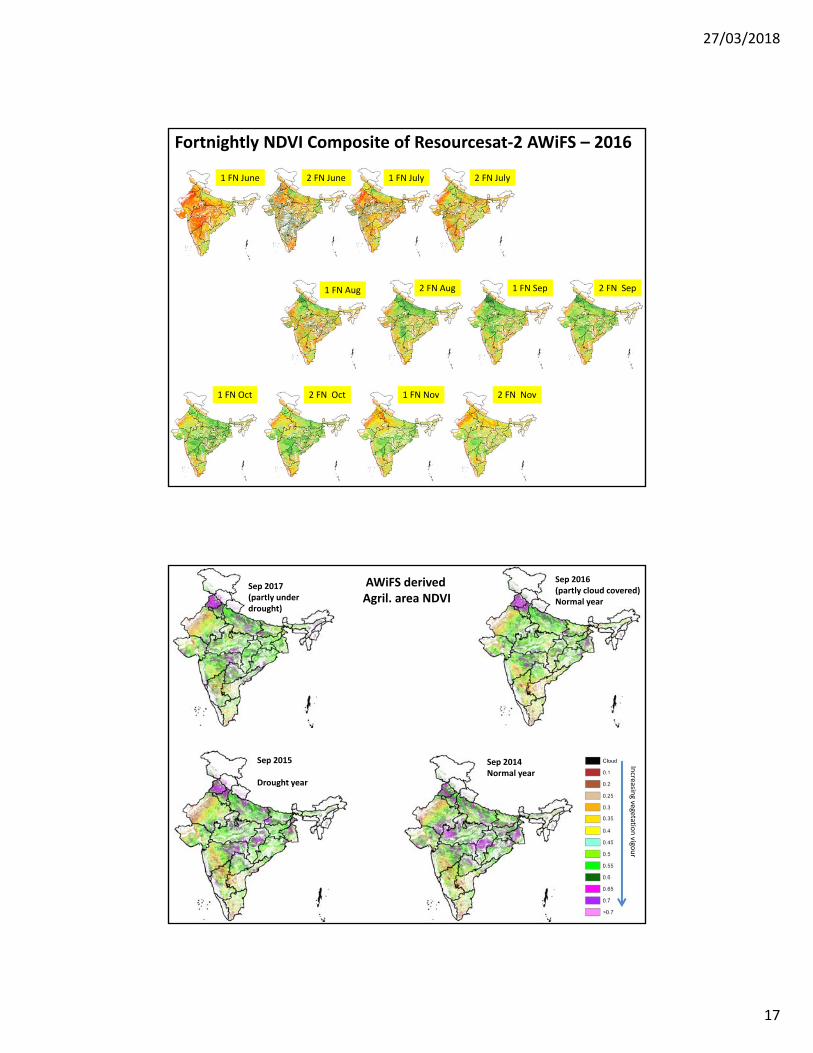
Fortnightly NDVI Composite of Resourcesat‐2 AWiFS – 2016
1 FN June 2 FN June 1 FN July 2 FN July
1 FN Aug 2 FN Aug 1 FN Sep 2 FN Sep
1 FN Oct 2 FN Oct 1 FN Nov 2 FN Nov
Increasin
g vegetatio
n vigo
ur
Sep 2017(partly under drought)
Sep 2016(partly cloud covered)Normal year
Sep 2015
Drought year
Sep 2014Normal year
AWiFS derived Agril. area NDVI

27/03/2018
18
Drought
conditions
AWiFS NDVI anomaly indicating agricultural drought conditions in parts of the country
Sep 2017 vs. Sep 2014
Source: MNCFC
Meteorological drought in the current year

27/03/2018
19
0
100
200
300
400
500
-0.20
-0.15
-0.10
-0.05
0.00
0.05
0.10
0.15
0.20
09 Jun
25 Jun
11 Jul
27 Jul
12 A
ug
28 A
ug
13 S
ep
29 S
ep
So
wn
are
a 00
0’ h
a
SA
SI
Weeks
SASI Sown area
Response of SASI to crop sown area
Features SASI valueDry vegetation low negativeMoist veg. high negative
Shortwave Angle Slope Index (SASI)
βSWIR1 = cos-1 [ (a2 + b2 - c2) /(2*a*b) ]Slope = (SWIR2 − NIR)SASI = βSWIR1 * Slope (radians)
where a, b and c are Euclidiandistances between vertices NIRand SWIR1, SWIR1 and SWIR2,and NIR and SWIR2, respectively
Chronological synchronization between(a) Decrease in SASI(b) Increase in rainfall(c) Increase in sown area
NADAMS projectConceptually and computationally simpleprocedures to discriminate the crop sowingfavorable areas at state level
Features SASI value
Dry soil highly positiveWet soil low positive
‐0.30
‐0.25
‐0.20
‐0.15
‐0.10
‐0.05
0.00
0.05
0.10
0.15
0.20
09 June
17 June
25 June
3 July
11 July
19 July
27 July
04 Aug
12 Aug
20 Aug
28 Aug
05 Sep
13 Sep
21 Sep
29 Sep
SASI values
2002 2006 2009
Seasonal dynamics of SASI
Before crop sowing
Crop growing and maturity
Commencement of crop sowing

27/03/2018
20
‐1
‐0.8
‐0.6
‐0.4
‐0.2
0
0.2
0.4
01/M
ay/11
09/M
ay/11
17/M
ay/11
25/M
ay/11
02/Jun/11
10/Jun/11
18/Jun/11
26/Jun/11
04/Jul/11
12/Jul/11
20/Jul/11
28/Jul/11
05/Aug/11
13/Aug/11
21/Aug/11
29/Aug/11
06/Sep
/11
14/Sep
/11
22/Sep
/11
30/Sep
/11
08/O
ct/11
16/O
ct/11
24/O
ct/11
01/N
ov/11
09/N
ov/11
17/N
ov/11
25/N
ov/11
03/Dec/11
11/Dec/11
19/Dec/11
27/Dec/11
04/Jan/12
12/Jan/12
20/Jan/12
28/Jan/12
05/Feb
/12
13/Feb
/12
21/Feb
/12
29/Feb
/12
08/M
ar/12
16/M
ar/12
24/M
ar/12
01/Apr/12
09/Apr/12
17/Apr/12
25/Apr/12
03/M
ay/12
11/M
ay/12
19/M
ay/12
SASI
Seasonal SASI profile
Area Favourable for Crop Sowing/Crop Sowan Area (AFCS)
Geospatial product on Area Favourable for Crop Sowing (AFCS)using multi-criteria approach
Soil Texture
Rice area mask
Kharif areamask
SASIModelledsoil moisture
Input datasets

27/03/2018
21
SeptemberAugust
JulyJune State Kharif
normal
AFCS M ha. Unfavorablearea
state June July Aug Sep
Andhra Pradesh 7.8 2.0 6.8 6.9 7.3 0.4
Bihar 3.7 0.7 3.6 3.7 3.7 0
Chhattisgarh 4.8 3.2 4.8 4.8 4.8 0
Gujarat 8.7 1.3 5.0 5.8 8.1 0.6
Haryana 2.8 0.6 1.6 2.8 2.8 0
Jharkhand 2.5 0.3 2.4 2.5 2.5 0
Karnataka 7.5 3.5 6.0 6.0 7.0 0.5
Madhya Pradesh 10.4 0.7 9.7 10.3 10.4 0
Maharashtra 14.0 5.5 13.2 13.8 13.8 0.2
Odisha 6.3 3.9 6.1 6.2 6.3 0
Rajasthan 14.3 0.2 4.4 11.7 13.6 0.8
Tamil nadu 2.4 1.1 1.8 2.0 2.0 0.4
Uttar Pradesh 9.3 2.8 8.7 9.2 9.3 0
Sub‐Total 94.5 25.8 74.2 85.7 91.7 2.9
All India 108.6 34.2 87.0 97.7 105.5 3.1
Area Favourable for Crop Sowing (AFCS) derived from SASI and water balance methodology, Kharif 2012
Soil moisture
Satellite based• Large area, daily coverage• 25‐50 km resolution• Increasing popularity Several microwave sensors• SMRR – 1978‐1987• TRMM – TMI since 1997• Scatterometer – ERS 1 & 2• ASCAT – MetopA• AMSRE – 2002‐2011• SMOS – 2009• SMAP ‐ 2015Retrieval algorithms from passive systems• NASA• LPRM• PRI
Soil moisture important data for hydrology, agriculture, environment, climate system etc.
Sources of soil moisture data
I. Insitu measurements non‐spatial dataManual• accurate• inadequate coverageAutomatic systems• calibration related issues• large area coverage is
expensive
Spatial dataNon‐spatial data
Hydrological models
• Mass balance approach• Profile level moisture• Parameterisation of
models – challenge
Soil moisture products from NRSC
• VIC hydrological models – daily soil moisture images
• AMSR 2 LPRM soil moisture 25 km, 2 day frequency

27/03/2018
22
4_11 JUNE 12_18 JUNE 19_25 JUNE 26_2 JULY 3_9 JULY 10_16 JULY
Tracking the drought conditions of 2014 using LPRM Soil Moisture datasets of NRSC
17_23 JULY 24_30 JULY 31_06 AUGUST17_23 JULY
Soil moisture deviations from normal in 2014
0.000.050.100.150.200.250.300.350.40
01 jun
05 Jun
09 Jun
13 Jun
17 Jun
21 Jun
25 Jun
29 Jun
03 Jul
07 Jul
11 Jul
15 Jul
19 Jul
23 Jul
27 Jul
31 Jul
04 Aug
08 Aug
12 Aug
Soil moisture (m3/m
3)
LPRM_SM 2014 LPRM_SM 2013
Drought frequency in the sowing period
SOIL MOISTURE -Time Series dataSOIL MOISTURE -Time Series data
1991 1992 1993 1994 1995 1996 1997 1998 1999 2000
2001 2002 2003 2004 2005 2006 2007 2008 2009 2010
CV_20
Mean
Drought_Years
CV Frequency of SM reduction

27/03/2018
23
Weather based indices
Rainfall deviationStandardised Precipitation IndexMoisture Adequacy Index
Hydrological indicators
Reservoir Storage IndexGround water index
Weather and hydrology indicators
nrscOperational Web-based National Hydrological Modeling System
Hydrological Modeling Framework
Temperature
Rainfall
Elevation
Soil
Land use
Output Products
Soil Moisture
Evapotranspiration
Runoff
Input dataset
Variable Infiltration Capacity Hydrological Model
Open source; Grid-wise water and energy balance
Sub-grid heterogeneity of Land cover
Soil depth-wise hydrological response
Vegetation phenological changes
Daily / sub-daily time step
Geo-spatial data
Terrain - Topographic, Soil (NBSSLUP), LULC (NRC-250k), LAI, Albedo
Meteorological – Rainfall, Temperature, … (IMD & CPC)
Hydrological - River discharge, Reservoir Storage/Releases, GW levels, …
9 min (~16.5km), 3 min (~ 5.5km) Grid-wise data base
27/03/2018
24
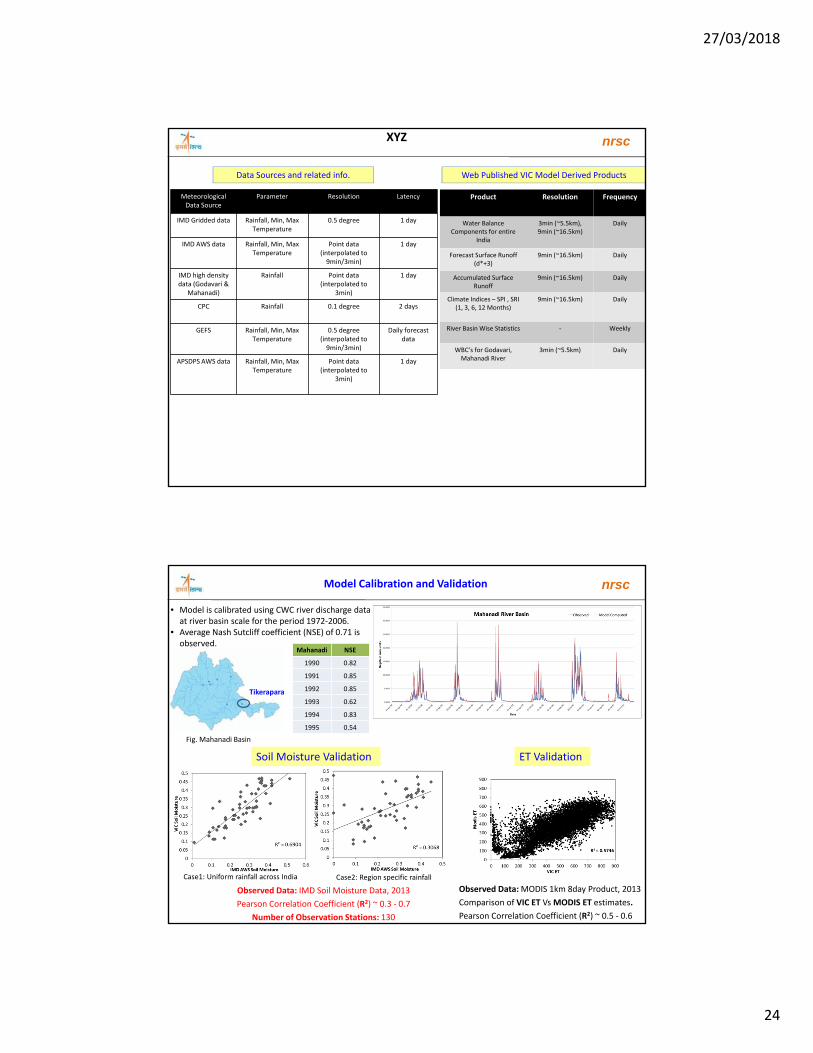
nrscXYZ
Meteorological Data Source
Parameter Resolution Latency
IMD Gridded data Rainfall, Min, Max Temperature
0.5 degree 1 day
IMD AWS data Rainfall, Min, Max Temperature
Point data (interpolated to 9min/3min)
1 day
IMD high density data (Godavari &
Mahanadi)
Rainfall Point data (interpolated to
3min)
1 day
CPC Rainfall 0.1 degree 2 days
GEFS Rainfall, Min, Max Temperature
0.5 degree (interpolated to 9min/3min)
Daily forecastdata
APSDPS AWS data Rainfall, Min, Max Temperature
Point data (interpolated to
3min)
1 day
Data Sources and related info.
Product Resolution Frequency
Water BalanceComponents for entire
India
3min (~5.5km), 9min (~16.5km)
Daily
Forecast Surface Runoff(d*+3)
9min (~16.5km) Daily
Accumulated Surface Runoff
9min (~16.5km) Daily
Climate Indices – SPI , SRI (1, 3, 6, 12 Months)
9min (~16.5km) Daily
River Basin Wise Statistics ‐ Weekly
WBC’s for Godavari, Mahanadi River
3min (~5.5km) Daily
Web Published VIC Model Derived Products
Tikerapara
Fig. Mahanadi Basin
nrscModel Calibration and Validation
Mahanadi NSE
1990 0.82
1991 0.85
1992 0.85
1993 0.62
1994 0.83
1995 0.54
• Model is calibrated using CWC river discharge data at river basin scale for the period 1972‐2006.
• Average Nash Sutcliff coefficient (NSE) of 0.71 is observed.
Case1: Uniform rainfall across India Case2: Region specific rainfall
Soil Moisture Validation
Observed Data: IMD Soil Moisture Data, 2013
Pearson Correlation Coefficient (R2) ~ 0.3 ‐ 0.7
Number of Observation Stations: 130
ET Validation
Observed Data: MODIS 1km 8day Product, 2013
Comparison of VIC ET VsMODIS ET estimates.
Pearson Correlation Coefficient (R2) ~ 0.5 ‐ 0.6

27/03/2018
25
nrscSeasonal Water Balance Components Estimation
Jun‐Oct, 2016
RunoffRainfall Evapotranspiration
Daily Mean (India) Water Balance Components
nrscSeasonal Water Balance Components Estimation
Jun‐Oct, 2017
RunoffRainfall Evapotranspiration
Daily Mean (India) Water Balance Components
27/03/2018
26
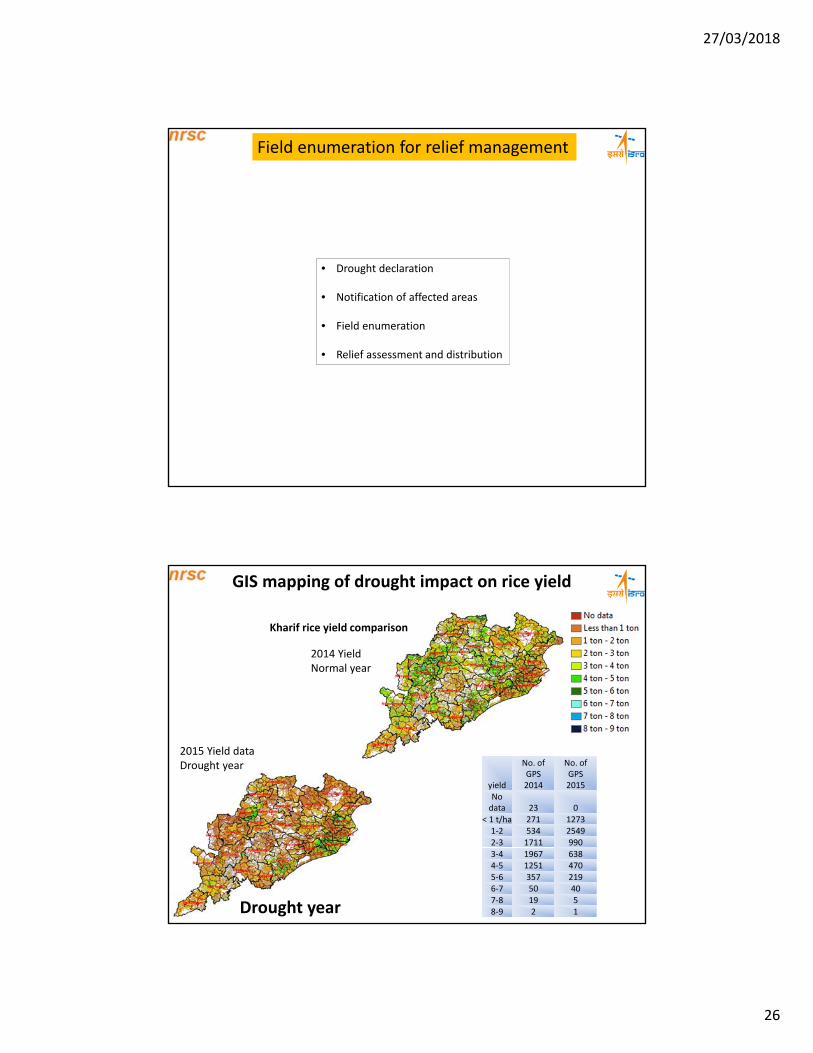
Field enumeration for relief management
• Drought declaration
• Notification of affected areas
• Field enumeration
• Relief assessment and distribution
2015 Yield dataDrought year
2014 YieldNormal year
yield
No. of GPS2014
No. of GPS2015
No data 23 0
< 1 t/ha 271 12731‐2 534 25492‐3 1711 9903‐4 1967 6384‐5 1251 4705‐6 357 2196‐7 50 407‐8 19 58‐9 2 1
Kharif rice yield comparison
GIS mapping of drought impact on rice yield
Drought year

27/03/2018
27
0
500
1000
1500
2000
2500
3000
3500
4000
4500
5000
<0.4 0.4‐<0.5 0.5‐<0.55 0.55‐<0.6 0.6‐<0.65 =/>0.65
GP average rice yield (kg/ha)
Season's max. NDVI of rice crop (GP average)
Paddy yield Vs. NDVI – kharif 2016, Odisha
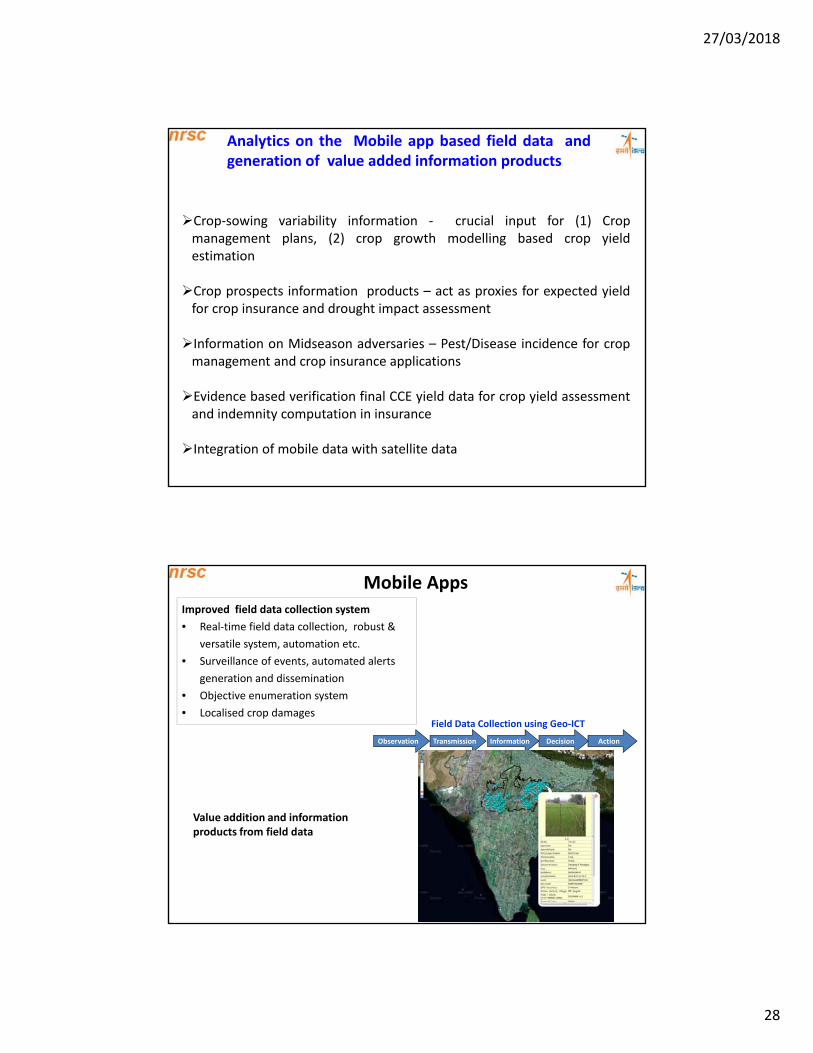
Mobile Apps for crop field data collection
Improved field data collection system
• Real‐time field data collection,
robust & versatile system,
automation etc.
• Surveillance of events, automated
alerts generation and dissemination
• Objective enumeration system
• Localised crop damages
Field Data Collection using Geo‐ICT
Observation TransmissionInformation Decision Action
Value addition and information products from field data
27/03/2018
28
Crop‐sowing variability information ‐ crucial input for (1) Cropmanagement plans, (2) crop growth modelling based crop yieldestimation
Crop prospects information products – act as proxies for expected yieldfor crop insurance and drought impact assessment
Information on Midseason adversaries – Pest/Disease incidence for cropmanagement and crop insurance applications
Evidence based verification final CCE yield data for crop yield assessmentand indemnity computation in insurance
Integration of mobile data with satellite data
Analytics on the Mobile app based field data andgeneration of value added information products
Mobile AppsImproved field data collection system
• Real‐time field data collection, robust &
versatile system, automation etc.
• Surveillance of events, automated alerts
generation and dissemination
• Objective enumeration system
• Localised crop damagesField Data Collection using Geo‐ICT
Observation Transmission Information Decision Action
Value addition and information products from field data

27/03/2018
29
Details of International Systems for drought monitoring
US Drought Monitor Five Parameters
Palmer drought index
CPC Soil Moisture Model
Standardized Precipitation Index (SPI)
Satellite Vegetation Health Index
VEG DRI – Drought response modelling with data
mining techniques
FEWS NET NOAA NDVI Meteosat Rainfall
IWMI Drought Monitor
MODIS NDVI differences
FAO Drought MonitoringARTEMIS/GIEWS
• NDVI Difference between Current Decade and Average (SPOT 4)• Cold Cloud Duration
China Drought Monitoring
NDVI deviation from coarse resolution data,LST
Global Scenario
Harmonization of data & Unified index – A Classic example
• Multi disciplinary • Involvement of multiple organizations(about 150 scientists are involved)
• Comprehensive drought assessment• It is not a forecasting/early warning system
Drought monitor is atclimatic division averaged.
Not good for local leveldecision making
Drought Monitoring ‐ Global Scenario

27/03/2018
30
Criteria in US Drought monitor
Category Palmer drought index
CPC soil moisture model
Stream flows
SPI Satellite Vegetation health index
Normal -1 to -1.9
21-30 21-30 -.5 to -.7
36-45
Moderate drought
-2 to -2.9
11-20 11-20 -.8 to -1.2
26-35
Severe drought
-3 to -3.9
6-10 6-10 -1.3 to -1.5
16-25
Extreme drought
-4 to -4.9
3-5 3-5 -1.6 to -1.9
6-15
Exceptional drought
-5 or less
0-2 0-2 -2 or less
1-5