3. consumer brand adoption process in services an empirical study on retail banking-2.pdf
TRANSCRIPT
CONSUMER BRAND ADOPTION PROCESS IN SERVICES: AN EMPIRICAL STUDY ON RETAIL
BANKING
Dr. Ritesh K. Patel
Assistant Professor,
Nirma University (Institute of Law)
ABSTRACT
Keywords: Brand Adoption Process, Consumer Adoption, Adoption in Services, Retail Banking, Brand
Adoption in Banks, Services Adoption.
Introduction:
Adoption is an individual’s decision to become a regular user of a product. It is sequence of events
beginning with consumer awareness of a new product leading to trial usage and culminating in full and regular
use of the new product. Over time the adoption process resembles a bell curve formed by innovators, early
adopters, and the majority of consumers, late adopters, and laggards.
An innovation is any good, service, or idea that is perceived by someone as new. The idea may
have a long history, but it is an innovation to the person who sees it as new. Innovations take time to spread
through the social system.
The consumer-adoption process focuses on the mental process through which an individual passes
from first hearing about an innovation to final adoption. Adopters of new products have been observed to
move through five stages:
1. Awareness -The consumer becomes aware of the innovation but lacks information about it.
2. Interest-The consumer is stimulated to seek information about the innovation.
3. Evaluation -The consumer considers whether to try the innovation.
4. Trial-The consumer tries the innovation to improve his or her estimate of its value.
5. Adoption -The consumer decides to make full and regular use of the innovation.
The new-product marketer should facilitate movement through these stages. A portable electric-
dishwasher manufacturer might discover that many consumers are stuck in the interest stage; they do not buy
because of their uncertainty and the large investment cost. But these same consumers would be willing to use
an electric-dishwasher on a trial basis for a small monthly fee. The manufacturer should consider offering a
trial-use plan with option to buy.
Factors Influencing the Adoption Process Adoption according to Rogers and Shoemaker (1971) is the decision to use and accept an innovation
in the form of a new idea, product or service. People differ in their approach towards change. Some differ in
adopting new fashion, some in adopting new appliances, some doctors are hesitant to apply new medicines
and still some farmers do not apply new implements. This is called adoption culture. After the early adoption,
they increase the use and then others follow. Others are late adopters by nature. Let us categorize these
customers into three units:
One who are early adopters. They are very quick in their response. These people are venture some and
willing to try new ideas. In fact they are innovators in life and early adopters.
Adoption is an individual’s decision to become a regular user of a product. How do potential
customers learn about new products, try them, and adopt or reject them? The consumer adoption
process is later followed by the consumer loyalty process, which is the concern of the established
producer. Years ago, new product marketers used a mass market approach to launch products. This
approach had two main drawbacks: It called for heavy marketing expenditures, and it involved many
wasted exposures. These drawbacks led to a second approach, heavy user target marketing. This
approach makes sense, provided that heavy users are identifiable and are early adopters. However,
even within the heavy user group, many heavy users are loyal to existing brands. New product
marketers now aim at consumers who are early adopters. In the current research the researcher has
tried to study the consumer brand adoption process in the context of retail banking environment
Secondly Early Majority. They are very careful people and take time to adopt things. They tend to
collect information about the change or the product, study carefully and then adopt on the basis of their
merits.
The third ones are late majority and traditionalists. They are the ones who adopt late and then use the
product1.
As marketing managers, we must study the demographics, the psychographics and media
characteristics of the product and also keep the theme of advertising message on these lines. We must find the
innovators of the product and also opinion leaders and keeping in view the financial stature of the consumers
and their category. Then there are certain areas where product change is imminent and quicker while some
areas change or innovation in the product is least desired or welcomed
Personal Influence Plays A Key Role
In case of some of the products, depending to which category they belong to , personal influence and
selling is very important. Demonstrations, experimentation, and even free use is given to influence the change
in product or its innovation. Cosmetic items, food items and items in use of household are subject to personal
selling.
Characteristics Of The Innovation Affects The Rate Of Adoption Some products are quick in innovation, such as fashion items or the ones that bring a direct change in
our status etc. Some product takes long to adoption like technical products or automobiles etc.
Internal Brand adoption is seen seriously in services organization because brand adoption (also
referred to as alignment or engagement) is about making sure the employees (and close stakeholders, such as
franchise staff, call centres or intermediaries) of an organization completely understand the organization’s
brand, and what it stands for — and how it connects to their daily job responsibilities. Brand Adoption
programs are undertaken with employees to make sure their activities on a day to day basis are contributing to
a consistent customer experience based upon the attributes (see definition) of the brand.
Literature Review Brand equity in general is defined as “a set of brand assets and liabilities linked to brand, its name or
symbol that add to or subtract from the value provided by a product or service to a firm and/or the firm’s
customers” (Aaker, 1991, p.15). However, consumer based brand equity is defined as consumer’s different
response between a focal brand, and an unbranded product when both have the same level of marketing
stimuli and product attributes (Yoo and Donthu, 2001). Conceptualizing brand equity from a consumer
perspective is worth examining as it offers specific guidelines for marketing strategies and tactics (Aaker and
Keller, 1993). Though the concept of brand equity has many definitions and forms, the construct collectively
consists of four dimensions such as brand loyalty, brand awareness, perceived quality of brand and brand
associations (Aaker, 1991 and Aaker and Keller, 1993). There is empirical evidence from the existing
literature that these our dimensions substantially measure brand. Therefore, in the present study an attempt has
been made to explore the outcomes of the consumer behavior in relation to brand equity incorporating four
dimensions.
Brand Loyalty is defined as “attachment that a consumer has to a brand” (Aaker 1991, p. 39). The
concept of brand loyalty usually denotes a favorable attitude towards a brand resulting in the repeat purchases
o the same brand over a period of time (Rossiter and Percy, 1987). Based on the attitude perspective, brand
loyalty is defined as ‘the tendency to be loyal to focal brand, which is demonstrated with an intention to buy
the brand as a primary choice” (Yoo and Donthu, 2001, p.3). Very few studies focused on the aspect of brand
equity and its relation to the selection of bank.
H0_01: Customer’s Loyalty and customer’s decision to recommend the bank to others are not
independent to each other.
H1_01: Customer’s loyalty and customer’s decision to recommend the bank to others are dependent
on each other.
Brand awareness is defined as “the ability of a buyer to recognize or recall that a brand is member of
a certain product category” (Aaker, 1991, p.61). It often represents the consumer’s ability to identify or
recognize the brand (Rossiter and Percy, 1987). Brand awareness in conceptualized as an output of both brand
recognition and brand recall (Keller, 2004).
Brand recognition related to consumer’s ability to confirm a prior exposure to the brand when it is
given as a cue (Keller, 2004).
Brand recall relates to the consumer’s ability to retrieve the brand when the product category or some
other type of product is given as a cue (Keller, 2004). In general, consumers tend to adopt a decision rule to
buy only familiar and well-established brands.

H0_02: Level of ‘Brand Awareness’ of bank does not lead to consumer’s readiness to use future
products/services of the bank.
H1_02: Level of ‘Brand Awareness’ of bank leads to consumer’s readiness to use future
products/services of the bank.
Brand perceived quality is the “consumer’s judgment about a product’s overall excellence or
superiority” (Zeithaml, 1988, p.3). It is therefore the consumer’s subjective evaluation of the product quality
thus differentiating a particular brand from other competing brands. Brand name is a key quality indicator,
which enhances the brand’s perceived quality (Balaji and Supriya 2006).
H0_03: Bank’s service quality and consumer’s loyalty are not correlated.
H1_03: Bank’s service quality and consumer’s loyalty are correlated.
Brand associations are often referred to as “anything linked in memory to a brand” (Aaker, 1991,
p.109). A brand association depicts a level of strength, and that the linked to a brand from the association will
be stronger when it is based on many experiences or exposure to communications, and when a network of
other links supports it (Aaker, 1991). From the consumer’s perspective, brand association adds value to the
consumer by providing a reason for consumers to adopt the brand and by creating positive attitude among the
consumers (Aaker, 1991).
H0_04: Bank’s ‘Brand Association’ does not influence on customer satisfaction.
H1_04: Bank’s ‘Brand Association’ does influence on customer satisfaction.
Consumers’ overall evaluation of a brand depends upon the attitudes they form towards that brand,
often referred as brand attitudes (Wilkie, 1986). Attitudes are important as they form the basis or the consumer
behavior. Attitudes are viewed as a function of the salient belies that a consumer has about the brand with
certain attributes and the evaluative judgment of those beliefs (Fisbein and Ajzen, 1975). Therefore, a
consumer’s brand loyalty depends on attitude towards a bank brand. Attitude is defined as an individual’s
evaluative effect about performing a target behavior (Fishbein and Ajzen, 1975). The attitudinal belie towards
adoption can be measured by five perceived attributes such as relative advantage, compatibility, complexity,
trialability and result demonstrability (Taylor and Todd, 1995). These attributes are proposed originally in the
diffusion of innovations framework (Rogers, 1983). A Conceptual framework of current study for the brand
adoption in Retail Banking is presented below (see Figure 1).
Figure 1: Conceptual Framework of Brand Adoption in Retail Banking
Attitude Factors:
Relative advantage is referred to as the degree to which an innovation s perceived as being better than
the ‘idea’ it supersedes (Roger, 1995). The perception of an innovation as advantageous by an individual is
Brand Equity Factors:
Brand Loyalty Brand Awareness Perceived Quality Brand
Association
Attitude Factors:
Relative Advantage Compatibility Complexity Trialability Result
Demonstrability
Brand Adoption in Retail Banking
more important that the objective advantage of the innovation itself (Rogers, 1995 and Gregor and Jones,
1999). In determining the adoption patterns, relative advantage has been identified as a key determinant in
extant literature. The degree of relative advantage is often measured in economic terms. However, Social
prestige, convenience and satisfaction are also considered to be important factors (Rogers, 1995). Therefore, it
has been found that the brand adopters invariably perceive relative advantage in terms of the economic
benefits that accrue and improvements that are afforded to their social status and convenience (Gregor and
Jones, 1999). In general, the greater the perceived relative advantage of an adoption, the more rapid will be its
rate of adoption and customer satisfaction (Agarwal and Prasad, 1998 and Gregor and Jones, 1999). Thus the
present study postulates that the more individual perceives the advantage of adopting a bank brand, the greater
the customer satisfaction.
H0_05: ‘Relative Advantage’ perceived in a bank brand does not influence customer’s response to
competitive moves by competitors.
H1_05: ‘Relative Advantage’ perceived in a bank brand influence customer’s response to competitive
moves by competitors.
Compatibility is the degree to which an innovation is perceived as being consistent with the existing
values, past experiences and the needs of the potential adopters (Rogers, 1995). An innovation is more likely
to be adopted when it is compatible with the individual’s professional responsibilities and value system.
Innovations that are compatible with the prevalent values and norms of a social system will be adopted more
rapidly than those that are incompatible (Rogers and Shoemaker, 1971 and Gregor and Jones, 1999). If an
individual perceives that the bank brand is compatible with the existing values, the likelihood of his
satisfaction is going to increase.
H0_06: The compatibility of a bank brand is not related to satisfaction of the customer.
H1_06: The compatibility of a bank brand is related to satisfaction of the customer.
Complexity is the degree to which an innovation is perceived as difficult to understand and use
(Roger, 1995). From the extant studies, it is evident that consumers readily adopt those which require less
technical skills and operational efforts (Cooper and Zmud, 1990). It is evident from the existing literature that
new ideas are adopted readily if they are simple, than those innovations that require the adopter to develop
new skills and understanding (Ndubisi and Chukwunonso, 2005). The above discussion leads to following
hypothesis:
H0_07: Complexity level of operating a bank account and customer satisfaction with a bank brand is
not correlated.
H1_07 Complexity level of operating a bank account and customer satisfaction with a bank brand are
correlated.
Trialability is the degree to which and innovation may be experimented with on a limited basis
(Rogers, 1995). If potential adopters are allowed to experiment, it results in rapid adoption by increasing the
‘comfortability’ level of the individuals. An adoption that is trialable denotes less uncertainty for an individual
to adopt (Ndubisi and Chukwunonso, 2005). Therefore, the ability to experiment or try with the global brands
before actual purchase would enhance its rate of adoption.
H0_08: The trialable nature of the bank brand does not affect the customer’s future purchase
intentions.
H1_08: The trialable nature of the bank brand does affect the customer’s future purchase intentions.
Result Demonstrability is the degree to which the results of an innovation are visible to others
(Rogers, 1995). The perception of an innovation that the benefits offered by its actual adoption are clearly
visible to others would enhance its likelihood of its adoption quickly. Thus the more the perception of the
consumers that brand would offer more communicable benefits to others members of a social system; the
rapid is its rate of adoption.
H0_09: The result demonstrability of a bank brand and satisfaction level of the customers is
independent with each other.
H1_09: Result Demonstrability of a bank brand and Satisfaction level of the customers are
correlated.
Research Design
The researchers have used exploratory research design to find out the determinants of corporate brand
image in banking industry. The researchers have used non-probability based convenience sampling method to
draw samples from the population of banks. The market surveys were conducted in six major cities of Gujarat,
Ahmedabad, Vadodara, Surat, Rajkot, Jamnagar and Bhavnagar. Seven major bank brands in Gujarat from
public, private and foreign banking sector, i.e., ICICI, HDFC, AXIS, Bank of Baroda (BOB), State Bank of
India (SBI), CITI and HSBC banks were selected as subjects of current study. The researcher has approached
1050 customers of these banks for filling out the survey forms. Most of the questions were constructed using
likert scale techniques to measure the customer’s angriness towards current practices of their bank brand.
Data Analysis & Interpretations
Here we will study each instrument of the two dimensions i.e. Brand Equity Factors and
Brand Attitude Factors separately one by and will find out its effect on the brand adoption in retail banks. Let us
find out the answers one by one:
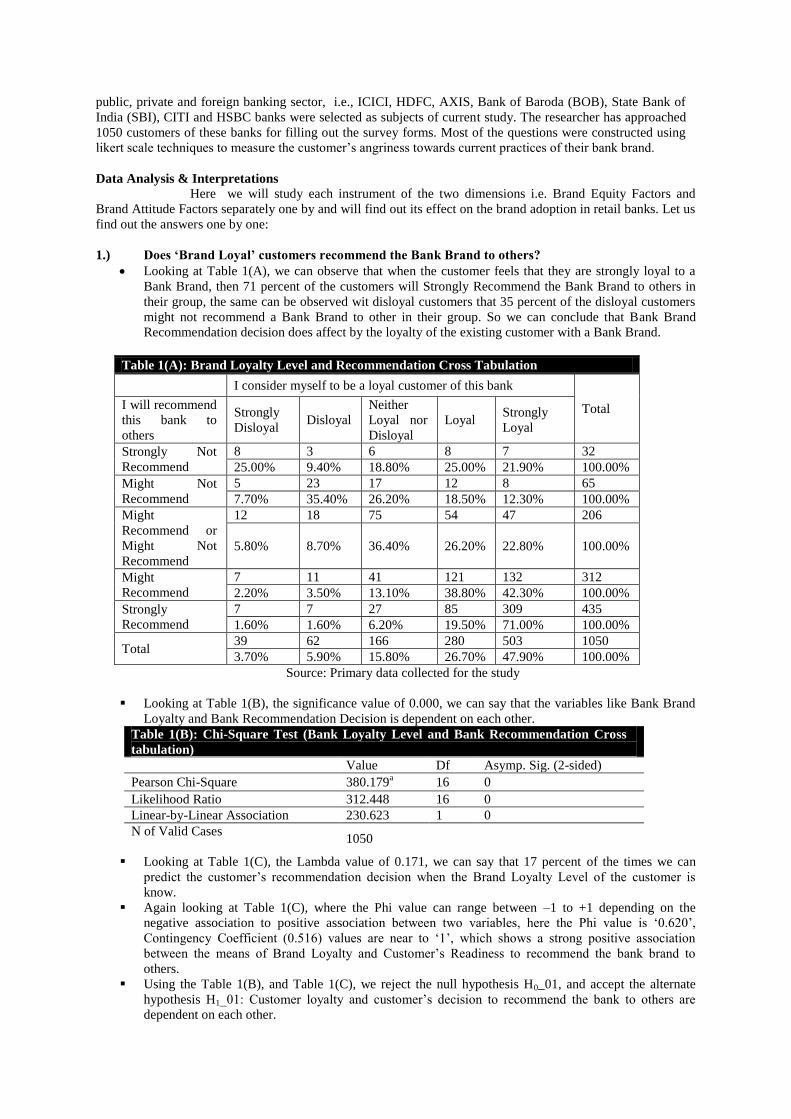
1.) Does ‘Brand Loyal’ customers recommend the Bank Brand to others?
Looking at Table 1(A), we can observe that when the customer feels that they are strongly loyal to a
Bank Brand, then 71 percent of the customers will Strongly Recommend the Bank Brand to others in
their group, the same can be observed wit disloyal customers that 35 percent of the disloyal customers
might not recommend a Bank Brand to other in their group. So we can conclude that Bank Brand
Recommendation decision does affect by the loyalty of the existing customer with a Bank Brand.
Table 1(A): Brand Loyalty Level and Recommendation Cross Tabulation
I consider myself to be a loyal customer of this bank
Total I will recommend
this bank to
others
Strongly
Disloyal Disloyal
Neither
Loyal nor
Disloyal
Loyal Strongly
Loyal
Strongly Not
Recommend
8 3 6 8 7 32
25.00% 9.40% 18.80% 25.00% 21.90% 100.00%
Might Not
Recommend
5 23 17 12 8 65
7.70% 35.40% 26.20% 18.50% 12.30% 100.00%
Might
Recommend or
Might Not
Recommend
12 18 75 54 47 206
5.80% 8.70% 36.40% 26.20% 22.80% 100.00%
Might
Recommend
7 11 41 121 132 312
2.20% 3.50% 13.10% 38.80% 42.30% 100.00%
Strongly
Recommend
7 7 27 85 309 435
1.60% 1.60% 6.20% 19.50% 71.00% 100.00%
Total 39 62 166 280 503 1050
3.70% 5.90% 15.80% 26.70% 47.90% 100.00%
Source: Primary data collected for the study
Looking at Table 1(B), the significance value of 0.000, we can say that the variables like Bank Brand
Loyalty and Bank Recommendation Decision is dependent on each other.
Table 1(B): Chi-Square Test (Bank Loyalty Level and Bank Recommendation Cross
tabulation)
Value Df Asymp. Sig. (2-sided)
Pearson Chi-Square 380.179a 16 0
Likelihood Ratio 312.448 16 0
Linear-by-Linear Association 230.623 1 0
N of Valid Cases
1050
Looking at Table 1(C), the Lambda value of 0.171, we can say that 17 percent of the times we can
predict the customer’s recommendation decision when the Brand Loyalty Level of the customer is
know.
Again looking at Table 1(C), where the Phi value can range between –1 to +1 depending on the
negative association to positive association between two variables, here the Phi value is ‘0.620’,
Contingency Coefficient (0.516) values are near to ‘1’, which shows a strong positive association
between the means of Brand Loyalty and Customer’s Readiness to recommend the bank brand to
others.
Using the Table 1(B), and Table 1(C), we reject the null hypothesis H0_01, and accept the alternate
hypothesis H1_01: Customer loyalty and customer’s decision to recommend the bank to others are
dependent on each other.
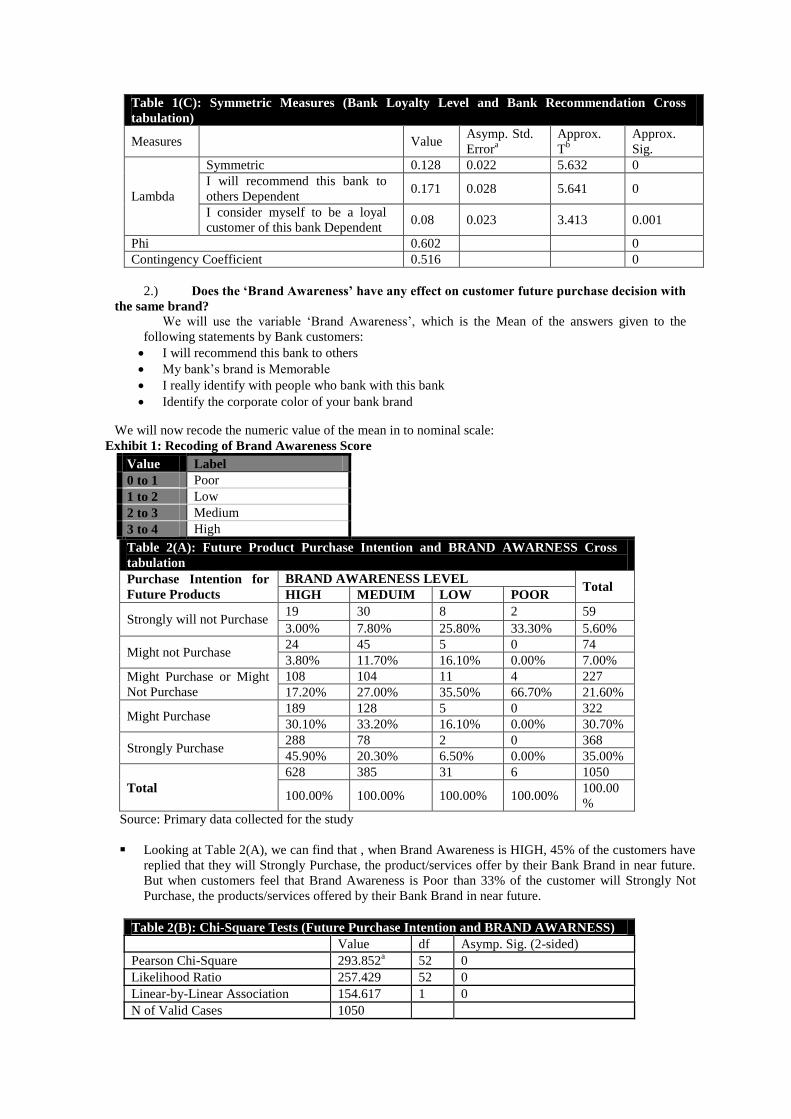
Table 1(C): Symmetric Measures (Bank Loyalty Level and Bank Recommendation Cross
tabulation)
Measures Value Asymp. Std.
Errora
Approx.
Tb
Approx.
Sig.
Lambda
Symmetric 0.128 0.022 5.632 0
I will recommend this bank to
others Dependent 0.171 0.028 5.641 0
I consider myself to be a loyal
customer of this bank Dependent 0.08 0.023 3.413 0.001
Phi 0.602 0
Contingency Coefficient 0.516 0
2.) Does the ‘Brand Awareness’ have any effect on customer future purchase decision with
the same brand? We will use the variable ‘Brand Awareness’, which is the Mean of the answers given to the
following statements by Bank customers:
I will recommend this bank to others
My bank’s brand is Memorable
I really identify with people who bank with this bank
Identify the corporate color of your bank brand
We will now recode the numeric value of the mean in to nominal scale:
Exhibit 1: Recoding of Brand Awareness Score
Value Label
0 to 1 Poor
1 to 2 Low
2 to 3 Medium
3 to 4 High
Table 2(A): Future Product Purchase Intention and BRAND AWARNESS Cross
tabulation
Purchase Intention for
Future Products
BRAND AWARENESS LEVEL Total
HIGH MEDUIM LOW POOR
Strongly will not Purchase 19 30 8 2 59
3.00% 7.80% 25.80% 33.30% 5.60%
Might not Purchase 24 45 5 0 74
3.80% 11.70% 16.10% 0.00% 7.00%
Might Purchase or Might
Not Purchase
108 104 11 4 227
17.20% 27.00% 35.50% 66.70% 21.60%
Might Purchase 189 128 5 0 322
30.10% 33.20% 16.10% 0.00% 30.70%
Strongly Purchase 288 78 2 0 368
45.90% 20.30% 6.50% 0.00% 35.00%
Total
628 385 31 6 1050
100.00% 100.00% 100.00% 100.00% 100.00
%
Source: Primary data collected for the study
Looking at Table 2(A), we can find that , when Brand Awareness is HIGH, 45% of the customers have
replied that they will Strongly Purchase, the product/services offer by their Bank Brand in near future.
But when customers feel that Brand Awareness is Poor than 33% of the customer will Strongly Not
Purchase, the products/services offered by their Bank Brand in near future.
Table 2(B): Chi-Square Tests (Future Purchase Intention and BRAND AWARNESS)
Value df Asymp. Sig. (2-sided)
Pearson Chi-Square 293.852a 52 0
Likelihood Ratio 257.429 52 0
Linear-by-Linear Association 154.617 1 0
N of Valid Cases 1050
a. 28 cells (40.0%) have expected count less than 5. The minimum expected count is .11.
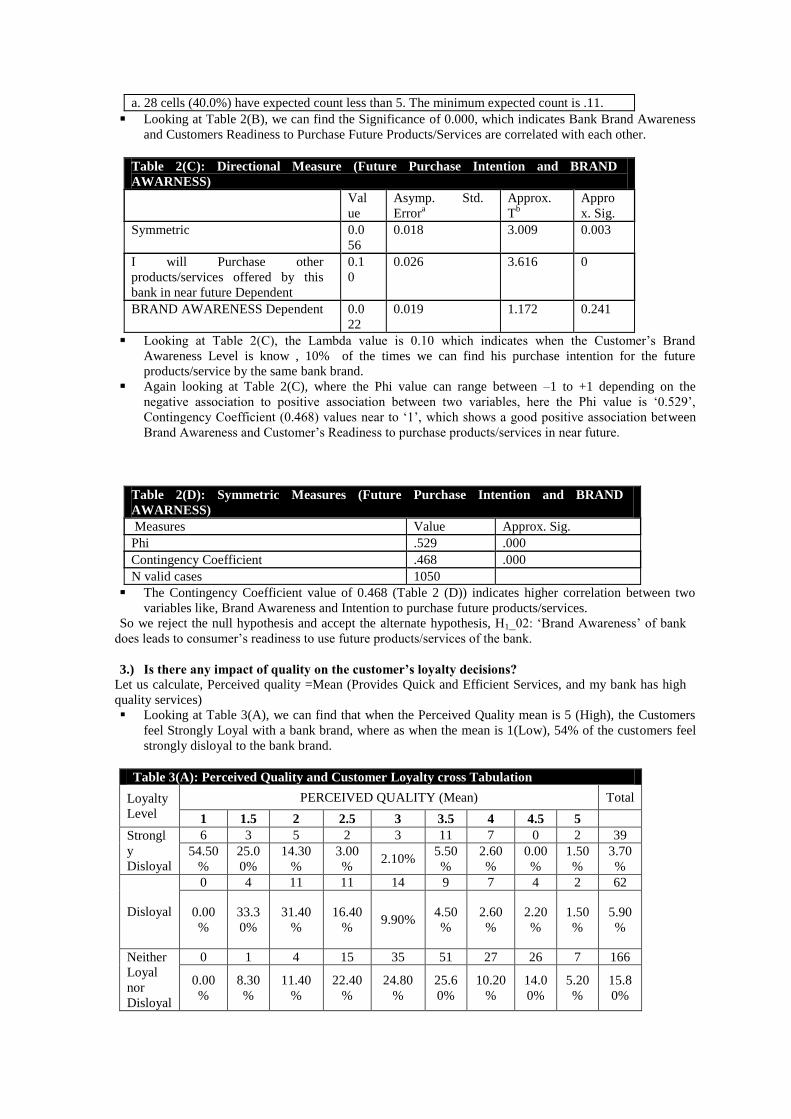
Looking at Table 2(B), we can find the Significance of 0.000, which indicates Bank Brand Awareness
and Customers Readiness to Purchase Future Products/Services are correlated with each other.
Table 2(C): Directional Measure (Future Purchase Intention and BRAND
AWARNESS)
Val
ue
Asymp. Std.
Errora
Approx.
Tb
Appro
x. Sig.
Symmetric 0.0
56
0.018 3.009 0.003
I will Purchase other
products/services offered by this
bank in near future Dependent
0.1
0
0.026 3.616 0
BRAND AWARENESS Dependent 0.0
22
0.019 1.172 0.241
Looking at Table 2(C), the Lambda value is 0.10 which indicates when the Customer’s Brand
Awareness Level is know , 10% of the times we can find his purchase intention for the future
products/service by the same bank brand.
Again looking at Table 2(C), where the Phi value can range between –1 to +1 depending on the
negative association to positive association between two variables, here the Phi value is ‘0.529’,
Contingency Coefficient (0.468) values near to ‘1’, which shows a good positive association between
Brand Awareness and Customer’s Readiness to purchase products/services in near future.
Table 2(D): Symmetric Measures (Future Purchase Intention and BRAND
AWARNESS)
Measures Value Approx. Sig.
Phi .529 .000
Contingency Coefficient .468 .000
N valid cases 1050
The Contingency Coefficient value of 0.468 (Table 2 (D)) indicates higher correlation between two
variables like, Brand Awareness and Intention to purchase future products/services.
So we reject the null hypothesis and accept the alternate hypothesis, H1_02: ‘Brand Awareness’ of bank
does leads to consumer’s readiness to use future products/services of the bank.
3.) Is there any impact of quality on the customer’s loyalty decisions?
Let us calculate, Perceived quality =Mean (Provides Quick and Efficient Services, and my bank has high
quality services)
Looking at Table 3(A), we can find that when the Perceived Quality mean is 5 (High), the Customers
feel Strongly Loyal with a bank brand, where as when the mean is 1(Low), 54% of the customers feel
strongly disloyal to the bank brand.
Table 3(A): Perceived Quality and Customer Loyalty cross Tabulation
Loyalty
Level
PERCEIVED QUALITY (Mean) Total
1 1.5 2 2.5 3 3.5 4 4.5 5
Strongl
y
Disloyal
6 3 5 2 3 11 7 0 2 39
54.50
%
25.0
0%
14.30
%
3.00
% 2.10%
5.50
%
2.60
%
0.00
%
1.50
%
3.70
%
Disloyal
0 4 11 11 14 9 7 4 2 62
0.00
%
33.3
0%
31.40
%
16.40
% 9.90%
4.50
%
2.60
%
2.20
%
1.50
%
5.90
%
Neither
Loyal
nor
Disloyal
0 1 4 15 35 51 27 26 7 166
0.00
%
8.30
%
11.40
%
22.40
%
24.80
%
25.6
0%
10.20
%
14.0
0%
5.20
%
15.8
0%
Loyal
3 1 11 14 39 50 88 55 19 280
27.30
%
8.30
%
31.40
%
20.90
%
27.70
%
25.1
0%
33.20
%
29.6
0%
14.2
0%
26.7
0%
Strongl
y Loyal
2 3 4 25 50 78 136 101 104 503
18.20
%
25.0
0%
11.40
%
37.30
%
35.50
%
39.2
0%
51.30
%
54.3
0%
77.6
0%
47.9
0%
Total 11 12 35 67 141 199 265 186 134 1050
100.0
0%
100.
00%
100.00
%
100.0
0%
100.00
%
100.
00%
100.0
0%
100.
00%
100.
00%
100.
00%
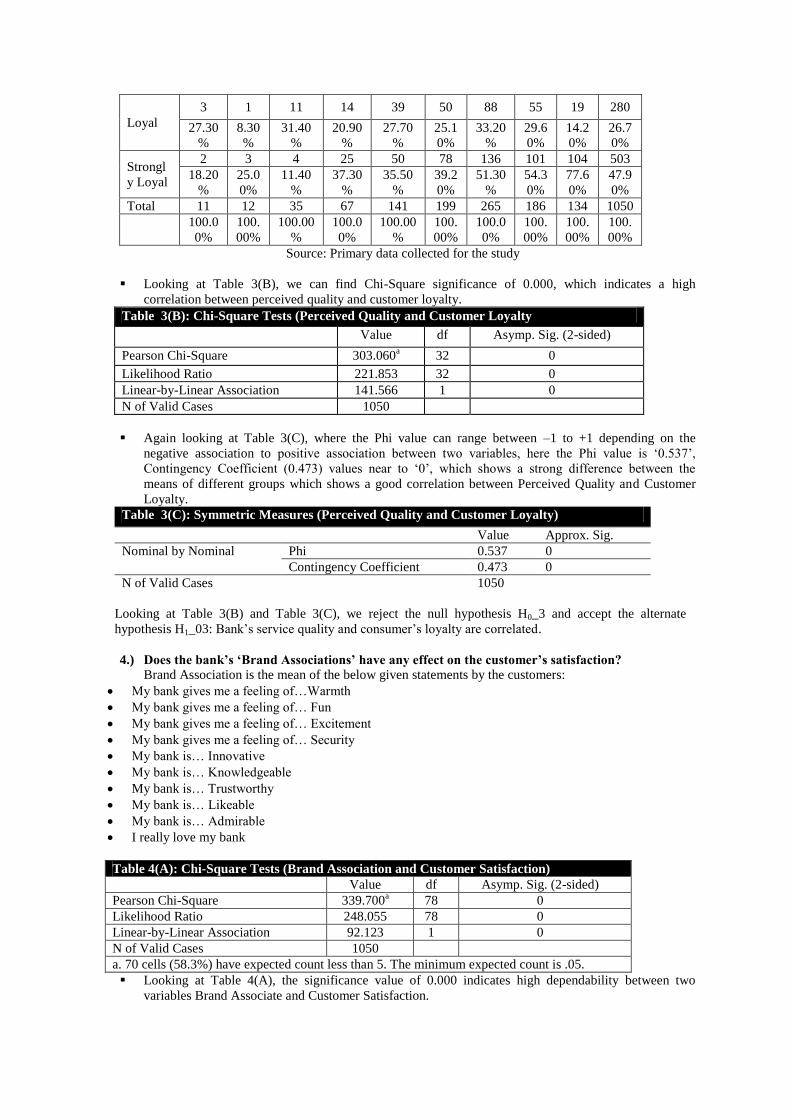
Source: Primary data collected for the study
Looking at Table 3(B), we can find Chi-Square significance of 0.000, which indicates a high
correlation between perceived quality and customer loyalty.
Table 3(B): Chi-Square Tests (Perceived Quality and Customer Loyalty)
Value df Asymp. Sig. (2-sided)
Pearson Chi-Square 303.060a 32 0
Likelihood Ratio 221.853 32 0
Linear-by-Linear Association 141.566 1 0
N of Valid Cases 1050
Again looking at Table 3(C), where the Phi value can range between –1 to +1 depending on the
negative association to positive association between two variables, here the Phi value is ‘0.537’,
Contingency Coefficient (0.473) values near to ‘0’, which shows a strong difference between the
means of different groups which shows a good correlation between Perceived Quality and Customer
Loyalty.
Table 3(C): Symmetric Measures (Perceived Quality and Customer Loyalty)
Value Approx. Sig.
Nominal by Nominal Phi 0.537 0
Contingency Coefficient 0.473 0
N of Valid Cases 1050
Looking at Table 3(B) and Table 3(C), we reject the null hypothesis H0_3 and accept the alternate
hypothesis H1_03: Bank’s service quality and consumer’s loyalty are correlated.
4.) Does the bank’s ‘Brand Associations’ have any effect on the customer’s satisfaction?
Brand Association is the mean of the below given statements by the customers:
My bank gives me a feeling of…Warmth
My bank gives me a feeling of… Fun
My bank gives me a feeling of… Excitement
My bank gives me a feeling of… Security
My bank is… Innovative
My bank is… Knowledgeable
My bank is… Trustworthy
My bank is… Likeable
My bank is… Admirable
I really love my bank
Table 4(A): Chi-Square Tests (Brand Association and Customer Satisfaction)
Value df Asymp. Sig. (2-sided)
Pearson Chi-Square 339.700a 78 0
Likelihood Ratio 248.055 78 0
Linear-by-Linear Association 92.123 1 0
N of Valid Cases 1050
a. 70 cells (58.3%) have expected count less than 5. The minimum expected count is .05.
Looking at Table 4(A), the significance value of 0.000 indicates high dependability between two
variables Brand Associate and Customer Satisfaction.
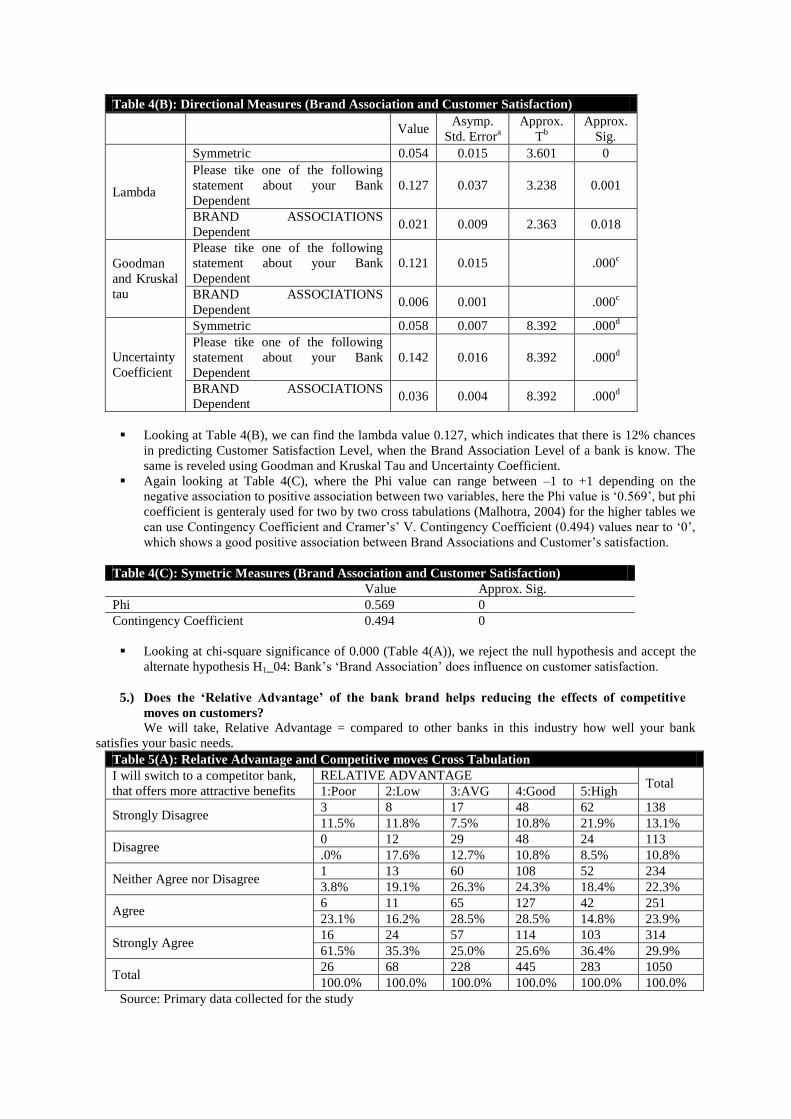
Table 4(B): Directional Measures (Brand Association and Customer Satisfaction)
Value Asymp.
Std. Errora
Approx.
Tb
Approx.
Sig.
Lambda
Symmetric 0.054 0.015 3.601 0
Please tike one of the following
statement about your Bank
Dependent
0.127 0.037 3.238 0.001
BRAND ASSOCIATIONS
Dependent 0.021 0.009 2.363 0.018
Goodman
and Kruskal
tau
Please tike one of the following
statement about your Bank
Dependent
0.121 0.015 .000c
BRAND ASSOCIATIONS
Dependent 0.006 0.001 .000
c
Uncertainty
Coefficient
Symmetric 0.058 0.007 8.392 .000d
Please tike one of the following
statement about your Bank
Dependent
0.142 0.016 8.392 .000d
BRAND ASSOCIATIONS
Dependent 0.036 0.004 8.392 .000
d
Looking at Table 4(B), we can find the lambda value 0.127, which indicates that there is 12% chances
in predicting Customer Satisfaction Level, when the Brand Association Level of a bank is know. The
same is reveled using Goodman and Kruskal Tau and Uncertainty Coefficient.
Again looking at Table 4(C), where the Phi value can range between –1 to +1 depending on the
negative association to positive association between two variables, here the Phi value is ‘0.569’, but phi
coefficient is genteraly used for two by two cross tabulations (Malhotra, 2004) for the higher tables we
can use Contingency Coefficient and Cramer’s’ V. Contingency Coefficient (0.494) values near to ‘0’,
which shows a good positive association between Brand Associations and Customer’s satisfaction.
Table 4(C): Symetric Measures (Brand Association and Customer Satisfaction)
Value Approx. Sig.
Phi 0.569 0
Contingency Coefficient 0.494 0
Looking at chi-square significance of 0.000 (Table 4(A)), we reject the null hypothesis and accept the
alternate hypothesis H1_04: Bank’s ‘Brand Association’ does influence on customer satisfaction.
5.) Does the ‘Relative Advantage’ of the bank brand helps reducing the effects of competitive
moves on customers?
We will take, Relative Advantage = compared to other banks in this industry how well your bank
satisfies your basic needs.
Table 5(A): Relative Advantage and Competitive moves Cross Tabulation
I will switch to a competitor bank,
that offers more attractive benefits
RELATIVE ADVANTAGE Total
1:Poor 2:Low 3:AVG 4:Good 5:High
Strongly Disagree 3 8 17 48 62 138
11.5% 11.8% 7.5% 10.8% 21.9% 13.1%
Disagree 0 12 29 48 24 113
.0% 17.6% 12.7% 10.8% 8.5% 10.8%
Neither Agree nor Disagree 1 13 60 108 52 234
3.8% 19.1% 26.3% 24.3% 18.4% 22.3%
Agree 6 11 65 127 42 251
23.1% 16.2% 28.5% 28.5% 14.8% 23.9%
Strongly Agree 16 24 57 114 103 314
61.5% 35.3% 25.0% 25.6% 36.4% 29.9%
Total 26 68 228 445 283 1050
100.0% 100.0% 100.0% 100.0% 100.0% 100.0%
Source: Primary data collected for the study
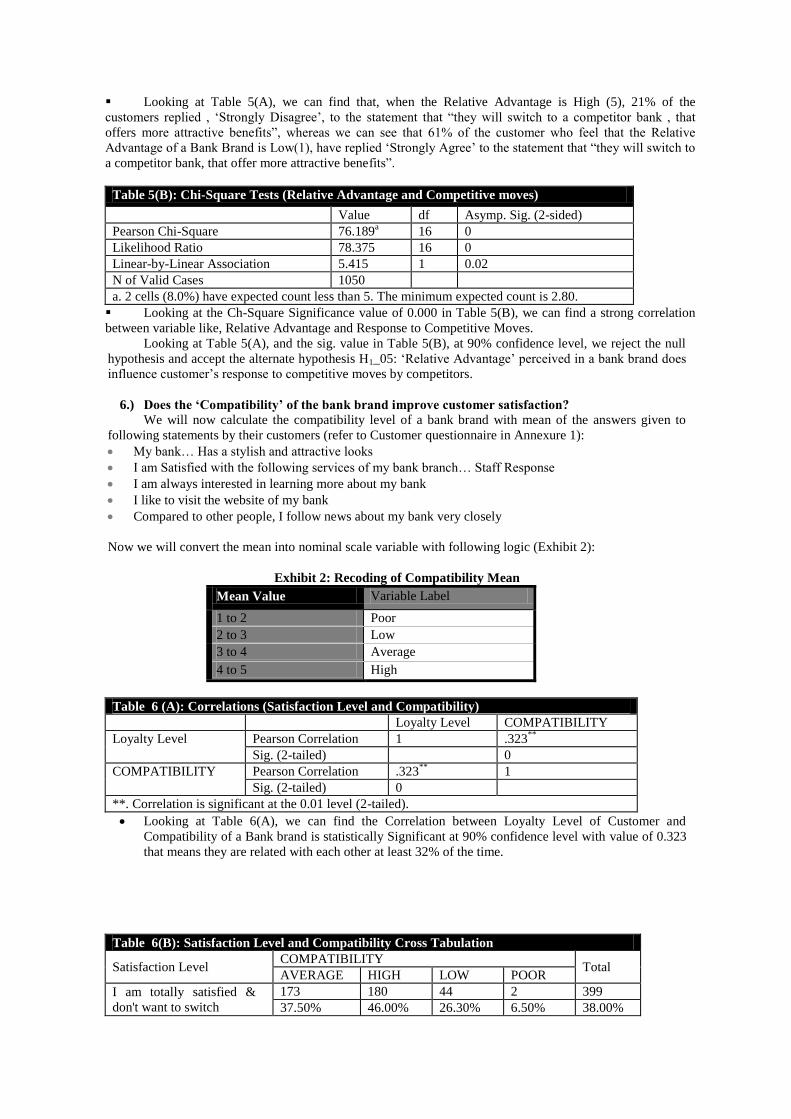
Looking at Table 5(A), we can find that, when the Relative Advantage is High (5), 21% of the
customers replied , ‘Strongly Disagree’, to the statement that “they will switch to a competitor bank , that
offers more attractive benefits”, whereas we can see that 61% of the customer who feel that the Relative
Advantage of a Bank Brand is Low(1), have replied ‘Strongly Agree’ to the statement that “they will switch to
a competitor bank, that offer more attractive benefits”.
Table 5(B): Chi-Square Tests (Relative Advantage and Competitive moves)
Value df Asymp. Sig. (2-sided)
Pearson Chi-Square 76.189a 16 0
Likelihood Ratio 78.375 16 0
Linear-by-Linear Association 5.415 1 0.02
N of Valid Cases 1050
a. 2 cells (8.0%) have expected count less than 5. The minimum expected count is 2.80.
Looking at the Ch-Square Significance value of 0.000 in Table 5(B), we can find a strong correlation
between variable like, Relative Advantage and Response to Competitive Moves.
Looking at Table 5(A), and the sig. value in Table 5(B), at 90% confidence level, we reject the null
hypothesis and accept the alternate hypothesis H1_05: ‘Relative Advantage’ perceived in a bank brand does
influence customer’s response to competitive moves by competitors.
6.) Does the ‘Compatibility’ of the bank brand improve customer satisfaction?
We will now calculate the compatibility level of a bank brand with mean of the answers given to
following statements by their customers (refer to Customer questionnaire in Annexure 1):
My bank… Has a stylish and attractive looks
I am Satisfied with the following services of my bank branch… Staff Response
I am always interested in learning more about my bank
I like to visit the website of my bank
Compared to other people, I follow news about my bank very closely
Now we will convert the mean into nominal scale variable with following logic (Exhibit 2):
Exhibit 2: Recoding of Compatibility Mean
Mean Value Variable Label
1 to 2 Poor
2 to 3 Low
3 to 4 Average
4 to 5 High
Table 6 (A): Correlations (Satisfaction Level and Compatibility)
Loyalty Level COMPATIBILITY
Loyalty Level Pearson Correlation 1 .323**
Sig. (2-tailed) 0
COMPATIBILITY Pearson Correlation .323**
1
Sig. (2-tailed) 0
**. Correlation is significant at the 0.01 level (2-tailed).
Looking at Table 6(A), we can find the Correlation between Loyalty Level of Customer and
Compatibility of a Bank brand is statistically Significant at 90% confidence level with value of 0.323
that means they are related with each other at least 32% of the time.
Table 6(B): Satisfaction Level and Compatibility Cross Tabulation
Satisfaction Level COMPATIBILITY
Total AVERAGE HIGH LOW POOR
I am totally satisfied &
don't want to switch
173 180 44 2 399
37.50% 46.00% 26.30% 6.50% 38.00%
I am satisfied but expect
more improvements in
service
275 204 105 16 600
59.70% 52.20% 62.90% 51.60% 57.10%
I am totally dissatisfied
and want to switch over
13 7 18 13 51
2.80% 1.80% 10.80% 41.90% 4.90%
Total
461 391 167 31 1050
100.00% 100.00% 100.00% 100.00% 100.00
%
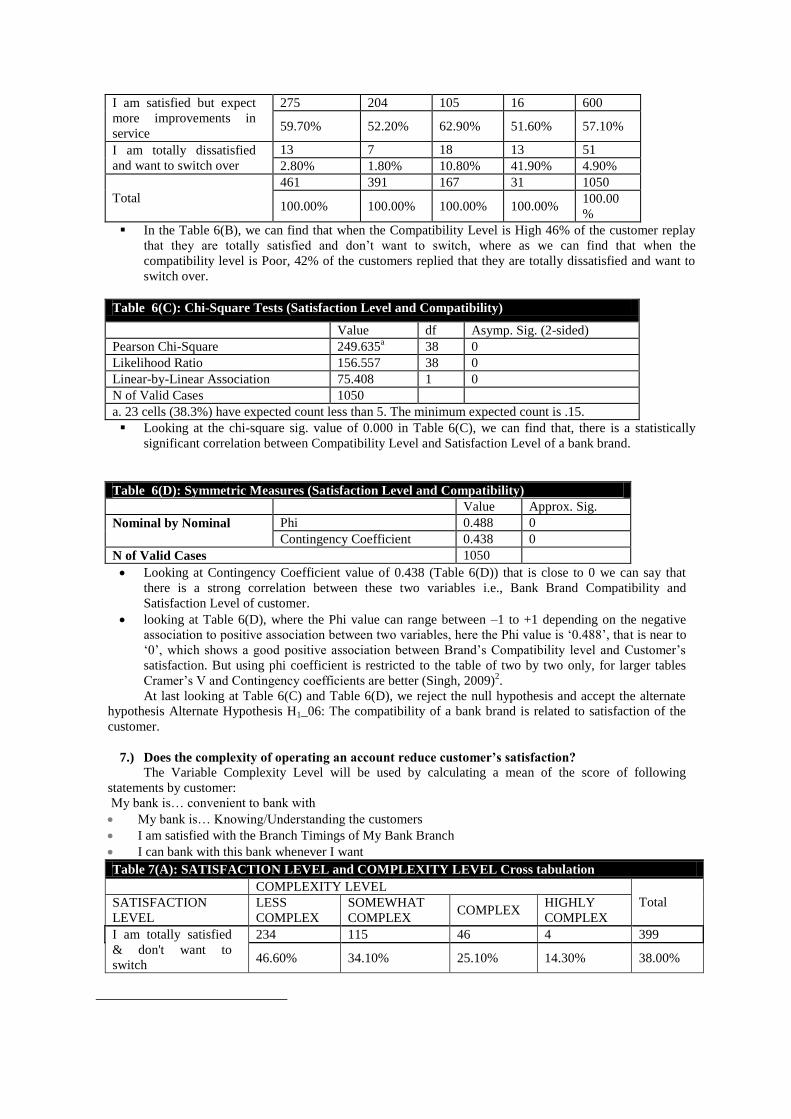
In the Table 6(B), we can find that when the Compatibility Level is High 46% of the customer replay
that they are totally satisfied and don’t want to switch, where as we can find that when the
compatibility level is Poor, 42% of the customers replied that they are totally dissatisfied and want to
switch over.
Table 6(C): Chi-Square Tests (Satisfaction Level and Compatibility)
Value df Asymp. Sig. (2-sided)
Pearson Chi-Square 249.635a 38 0
Likelihood Ratio 156.557 38 0
Linear-by-Linear Association 75.408 1 0
N of Valid Cases 1050
a. 23 cells (38.3%) have expected count less than 5. The minimum expected count is .15.
Looking at the chi-square sig. value of 0.000 in Table 6(C), we can find that, there is a statistically
significant correlation between Compatibility Level and Satisfaction Level of a bank brand.
Table 6(D): Symmetric Measures (Satisfaction Level and Compatibility)
Value Approx. Sig.
Nominal by Nominal Phi 0.488 0
Contingency Coefficient 0.438 0
N of Valid Cases 1050
Looking at Contingency Coefficient value of 0.438 (Table 6(D)) that is close to 0 we can say that
there is a strong correlation between these two variables i.e., Bank Brand Compatibility and
Satisfaction Level of customer.
looking at Table 6(D), where the Phi value can range between –1 to +1 depending on the negative
association to positive association between two variables, here the Phi value is ‘0.488’, that is near to
‘0’, which shows a good positive association between Brand’s Compatibility level and Customer’s
satisfaction. But using phi coefficient is restricted to the table of two by two only, for larger tables
Cramer’s V and Contingency coefficients are better (Singh, 2009)2.
At last looking at Table 6(C) and Table 6(D), we reject the null hypothesis and accept the alternate
hypothesis Alternate Hypothesis H1_06: The compatibility of a bank brand is related to satisfaction of the
customer.
7.) Does the complexity of operating an account reduce customer’s satisfaction?
The Variable Complexity Level will be used by calculating a mean of the score of following
statements by customer:
My bank is… convenient to bank with
My bank is… Knowing/Understanding the customers
I am satisfied with the Branch Timings of My Bank Branch
I can bank with this bank whenever I want
Table 7(A): SATISFACTION LEVEL and COMPLEXITY LEVEL Cross tabulation
COMPLEXITY LEVEL
Total SATISFACTION
LEVEL
LESS
COMPLEX
SOMEWHAT
COMPLEX COMPLEX
HIGHLY
COMPLEX
I am totally satisfied
& don't want to
switch
234 115 46 4 399
46.60% 34.10% 25.10% 14.30% 38.00%
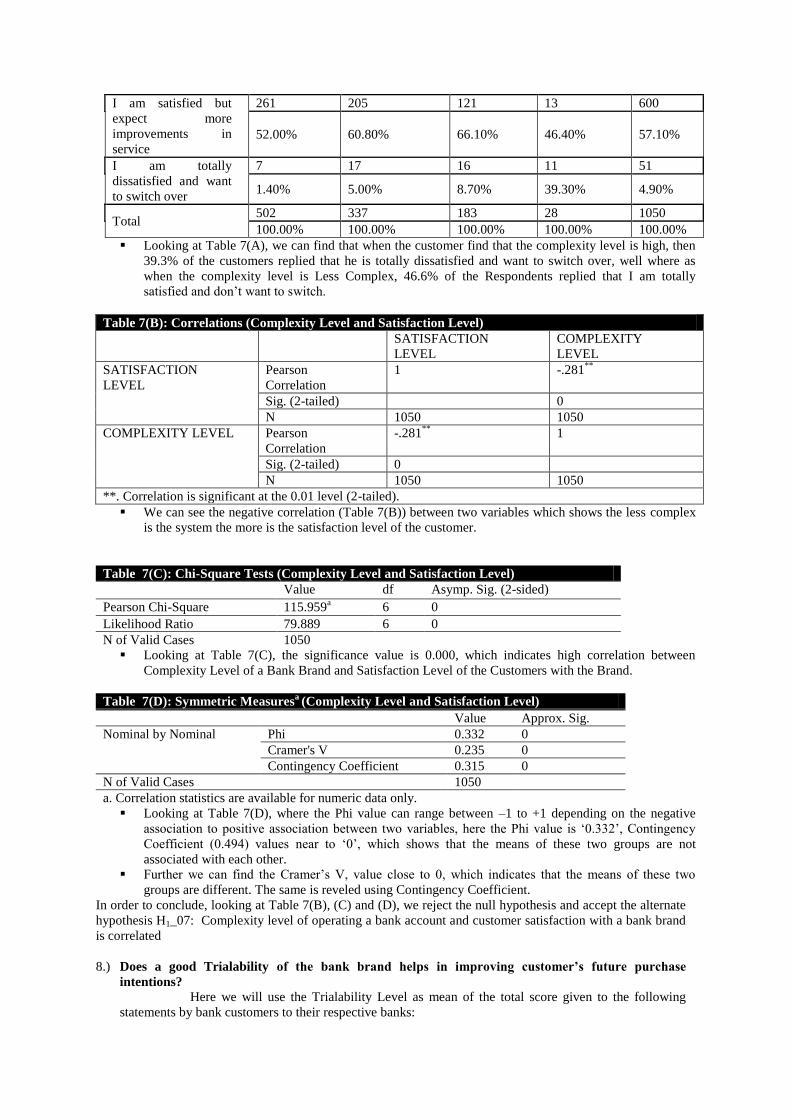
I am satisfied but
expect more
improvements in
service
261 205 121 13 600
52.00% 60.80% 66.10% 46.40% 57.10%
I am totally
dissatisfied and want
to switch over
7 17 16 11 51
1.40% 5.00% 8.70% 39.30% 4.90%
Total 502 337 183 28 1050
100.00% 100.00% 100.00% 100.00% 100.00%
Looking at Table 7(A), we can find that when the customer find that the complexity level is high, then
39.3% of the customers replied that he is totally dissatisfied and want to switch over, well where as
when the complexity level is Less Complex, 46.6% of the Respondents replied that I am totally
satisfied and don’t want to switch.
Table 7(B): Correlations (Complexity Level and Satisfaction Level)
SATISFACTION
LEVEL
COMPLEXITY
LEVEL
SATISFACTION
LEVEL
Pearson
Correlation
1 -.281**
Sig. (2-tailed) 0
N 1050 1050
COMPLEXITY LEVEL Pearson
Correlation
-.281**
1
Sig. (2-tailed) 0
N 1050 1050
**. Correlation is significant at the 0.01 level (2-tailed).
We can see the negative correlation (Table 7(B)) between two variables which shows the less complex
is the system the more is the satisfaction level of the customer.
Table 7(C): Chi-Square Tests (Complexity Level and Satisfaction Level)
Value df Asymp. Sig. (2-sided)
Pearson Chi-Square 115.959a 6 0
Likelihood Ratio 79.889 6 0
N of Valid Cases 1050
Looking at Table 7(C), the significance value is 0.000, which indicates high correlation between
Complexity Level of a Bank Brand and Satisfaction Level of the Customers with the Brand.
Table 7(D): Symmetric Measuresa (Complexity Level and Satisfaction Level)
Value Approx. Sig.
Nominal by Nominal Phi 0.332 0
Cramer's V 0.235 0
Contingency Coefficient 0.315 0
N of Valid Cases 1050
a. Correlation statistics are available for numeric data only.
Looking at Table 7(D), where the Phi value can range between –1 to +1 depending on the negative
association to positive association between two variables, here the Phi value is ‘0.332’, Contingency
Coefficient (0.494) values near to ‘0’, which shows that the means of these two groups are not
associated with each other.
Further we can find the Cramer’s V, value close to 0, which indicates that the means of these two
groups are different. The same is reveled using Contingency Coefficient.
In order to conclude, looking at Table 7(B), (C) and (D), we reject the null hypothesis and accept the alternate
hypothesis H1_07: Complexity level of operating a bank account and customer satisfaction with a bank brand
is correlated
8.) Does a good Trialability of the bank brand helps in improving customer’s future purchase
intentions? Here we will use the Trialability Level as mean of the total score given to the following
statements by bank customers to their respective banks:

My bank brand is… Adaptable (Q11.d)
My bank Branch is… Easily Reachable (Q14.a)
Table 8(A): Purchase Intention for Future Products/Services and TRIALABILITY LEVEL Cross
tabulation
Purchase Intention for
Future Products/Services
TRIALABILITY LEVEL Total
1 1.5 2 2.5 3 3.5 4 4.5 5
Strongly will not Purchase 2 3 4 12 6 4 15 10 3 59
15% 21% 13% 24% 5% 3% 6% 4% 2% 6%
Might not Purchase 0 1 2 1 15 15 16 20 4 74
0% 7% 6% 2% 12% 12% 7% 8% 2% 7%
Might Purchase or Might
Not Purchase
8 4 11 4 42 31 56 46 25 227
62% 29% 34% 8% 32% 26% 24% 18% 13% 22%
Might Purchase 2 0 6 21 28 44 101 70 50 322
15% 0% 19% 41% 22% 36% 43% 27% 26% 31%
Strongly Purchase 1 6 9 13 39 27 48 114 111 368
8% 43% 28% 25% 30% 22% 20% 44% 58% 35%
Total 13 14 32 51 130 121 236 260 193 1050
100% 100% 100% 100% 100% 100% 100% 100% 100% 100%
Looking at Table 8(A), we can find that as the Trialability Level of the Bank Brand increases, the
satisfaction level of the customer is also increases. For the Trialability Level of 5, 55% of the
customers responded that they will strongly purchase the products/services offered by the same bank
brand in near future.
Table 8(B): Chi-Square Tests: (Purchase Intention for Future Products/Services and
TRIALABILITY LEVEL)
Value df Asymp. Sig. (2-sided)
Pearson Chi-Square 187.768a 32 0
Likelihood Ratio 178.09 32 0
Linear-by-Linear Association 63.402 1 0
N of Valid Cases 1050
Looking at the chi-square significance of 0.000 (Table 8(B)), we can conclude that the relationship
between the Trialability Level of a bank brand and the customer satisfaction with the same bank brand
is significant.
Table 8(C): Directional Measures (Purchase Intention for Future Products/Services and
TRIALABILITY LEVEL)
Lambda Value Asymp. Std.
Errora
Approx. Tb Approx. Sig.
Symmetric .092 .019 4.675 .000
Future Purchase Intention
Dependent
.132 .026 4.768 .000
TRIALABILITY Dependent .058 .021 2.674 .008
Looking at Table 8(C), lambda value of 0.132, we can say that 13% of the times we can predict
customers Future Purchase Intention when the Trialability Level of a Bank Brand is known. Also the
Contingency Coefficient value close to 1 shows better correlation between these two variables.
Table 8(D): Symmetric Measures (Purchase Intention for Future Products/Services and
TRIALABILITY LEVEL)
Value Asymp. Std.
Errora
Approx.
Tb
Approx.
Sig.
Nominal by
Nominal
Phi 0.423 0
Cramer's V 0.211 0
Contingency
Coefficient 0.389 0
Interval by
Interval Pearson's R 0.246 0.031 8.211 .000
c
Ordinal by
Ordinal
Spearman
Correlation 0.267 0.03 8.969 .000
c
N of Valid Cases 1050
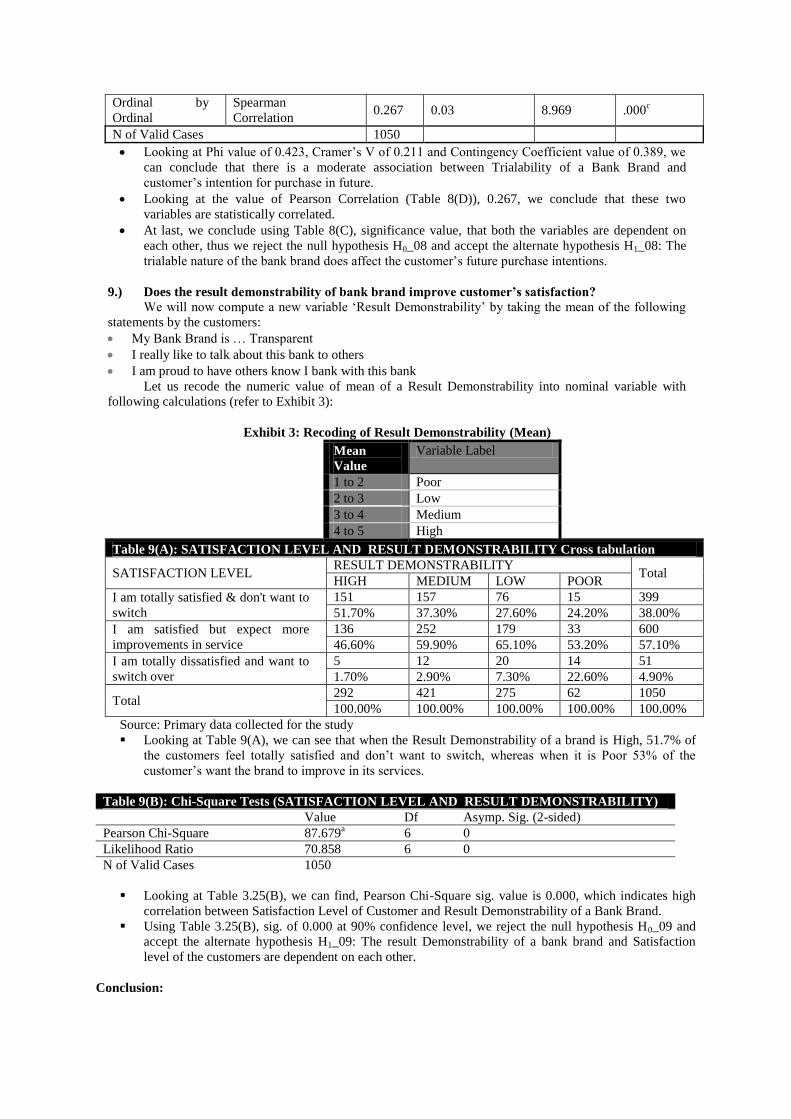
Looking at Phi value of 0.423, Cramer’s V of 0.211 and Contingency Coefficient value of 0.389, we
can conclude that there is a moderate association between Trialability of a Bank Brand and
customer’s intention for purchase in future.
Looking at the value of Pearson Correlation (Table 8(D)), 0.267, we conclude that these two
variables are statistically correlated.
At last, we conclude using Table 8(C), significance value, that both the variables are dependent on
each other, thus we reject the null hypothesis H0_08 and accept the alternate hypothesis H1_08: The
trialable nature of the bank brand does affect the customer’s future purchase intentions.
9.) Does the result demonstrability of bank brand improve customer’s satisfaction?
We will now compute a new variable ‘Result Demonstrability’ by taking the mean of the following
statements by the customers:
My Bank Brand is … Transparent
I really like to talk about this bank to others
I am proud to have others know I bank with this bank
Let us recode the numeric value of mean of a Result Demonstrability into nominal variable with
following calculations (refer to Exhibit 3):
Exhibit 3: Recoding of Result Demonstrability (Mean)
Mean
Value
Variable Label
1 to 2 Poor
2 to 3 Low
3 to 4 Medium
4 to 5 High
Table 9(A): SATISFACTION LEVEL AND RESULT DEMONSTRABILITY Cross tabulation
SATISFACTION LEVEL RESULT DEMONSTRABILITY
Total HIGH MEDIUM LOW POOR
I am totally satisfied & don't want to
switch
151 157 76 15 399
51.70% 37.30% 27.60% 24.20% 38.00%
I am satisfied but expect more
improvements in service
136 252 179 33 600
46.60% 59.90% 65.10% 53.20% 57.10%
I am totally dissatisfied and want to
switch over
5 12 20 14 51
1.70% 2.90% 7.30% 22.60% 4.90%
Total 292 421 275 62 1050
100.00% 100.00% 100.00% 100.00% 100.00%
Source: Primary data collected for the study
Looking at Table 9(A), we can see that when the Result Demonstrability of a brand is High, 51.7% of
the customers feel totally satisfied and don’t want to switch, whereas when it is Poor 53% of the
customer’s want the brand to improve in its services.
Table 9(B): Chi-Square Tests (SATISFACTION LEVEL AND RESULT DEMONSTRABILITY)
Value Df Asymp. Sig. (2-sided)
Pearson Chi-Square 87.679a 6 0
Likelihood Ratio 70.858 6 0
N of Valid Cases 1050
Looking at Table 3.25(B), we can find, Pearson Chi-Square sig. value is 0.000, which indicates high
correlation between Satisfaction Level of Customer and Result Demonstrability of a Bank Brand.
Using Table 3.25(B), sig. of 0.000 at 90% confidence level, we reject the null hypothesis H0_09 and
accept the alternate hypothesis H1_09: The result Demonstrability of a bank brand and Satisfaction
level of the customers are dependent on each other.
Conclusion:
Looking at the data analysis, we can conclude that dimensions like Brand Equity Factors (Brand
Loyalty, Brand Awareness, Perceived Quality, Brand Association) and Attitude Factors (Relative Advantage,
Compatibility, Complexity, Trialability, Result Demonstrability) plays an import role in the adoption of bank
brands in retail banking. Hence bank marketers shall focus more and more on these two dimensions while
designing their marketing strategies. Markets can follow the conceptual model of this study to design their
marketing strategies for retail banking customers (Refer Figure 1: Conceptual Framework of Brand Adoption
in Retail banking).The bank markers can focus on each of the instrument separately and shall draw their
market offering to satisfy these instruments separately. Say for example AXIS bank offers priority banking
services to those customers who maintain an average quarterly balance of 100000 Rs. and provides them
separate and unique facilities such as home banking solutions, separate customer help desk for priority
customers, etc. The banks shall try to improve on the attitude factors such as complexity and Trialability of
their banking products. Say for example banks can create simple processes to open an account or to open a
fixed deposits account, etc. off course banks cannot provide trial facilities looking at the nature of the product
but they can provide free demonstration of their internet banking, mobile banking and phone banking services
on Saturday and Sundays after banking hours in order to improve the Trialability of these services among
consumers of banks.
The academic implications of the study are still need to be proved by working on the validity of the
model by future research. The future researchers can use this model to test the validity of the same model on
other related services industry such as Airlines, Hotels, Hospitals, Insurance, Tourism, etc.
References:
1. Aaker David A (1991), Managing Brand Equity, Free Press, New York
2. Aaker David (2000), Brand Leadership, The Free Press, New York.
3. Aaker David A and Keller Kevin L (1993), “Interpreting Cross-Cultural Replications of Brand
Extension Research”, International Journal of Research in Marketing, Vol. 10, No. 1, pp. 55-59.
4. Agarwal R and Prasad J (1998), “A Conceptual and Operational Definition of Personal
Innovativeness in the Domain of Information Technology”, Information Systems Research, Vol. 9,
No. 2, pp. 204-215.
5. Auken Van (2007), Branding, Jaico Publishing House, Mumbai.
6. Balaji M and Supriya M (2006), "Understanding Corporate Brands and Corporate Branding",
Marketing Mastermind, Dec., India.
7. Cooper R B and Zmud R W (1990), “Information Technology Implementation Research: A
Technological Diffusion Approach ”, Management Science, Vol. 36, No. 2, pp. 123-39.
8. Day George S, Shocker Allan D and Srivastava Rajendra (1979), “Customer-Oriented Approaches
to Identify Product Markets”, Journal of Marketing, Vol. 43, May, pp. 8-19.
9. Fishbein M and Ajzen I (1975), Belief, Attitude, Intention and Behavior: An Introduction to
Theory and Research, Addison-Wesley, New York.
10. Gregor S and Jones K (1999), “Beef Selling Online: Diffusion Theory Applied”, Information
Technology and People, Vo. 12, No.1, pp. 71-85.
11. Keller Kevin (2004), “Building, Measuring, and Managing Brand Equity.” Pearson Education,
Delhi.
12. Kothari C R (2004), Research Methodology – Methods & Techniques, New Age International
Pvt. Ltd., New Delhi.
13. Kotler Phillp (2003), Marketing Management, Pearson Education, Mumbai, India.
14. Malhotra Naresh K (2004), Marketing Research, Pearson Education, Delhi.
15. Nargundkar Rajendra (2008), Marketing Research – Text and Cases, Tata McGraw-Hill,Delhi.
16. Ndubisi N O and Chukwunonso N C (2005), “Diffusion of Landscaping services: A Two Nation
Study of Determinant Factors”, Management of Environmental Quality: An International Journal,
Vol. 16, No. 4, pp. 143-154.
17. Rao Rama M (2005), Services Marketing, Pearson Education, Delhi.
18. Rogers E M (1983), Diffusion of Innovations, 3rd Ed., Free Press, New York.
19. Rogers E M (1995), Diffusion of Innovations, 4th Ed., Free Press, New York
20. Rogers E M and Shoemaker F F (1971), Communication of Innovations, Free Press, New York.
21. Rossister J R and Percy L (1987), Advertising and Promotion Management, McGraw-Hill, New
York.
22. Taylor S and Todd P (1995), “Understanding Information Technology Usage: A Test of
Competing Models”, Information Systems Research, Vol. 6, No. 2, pp. 144-176.
23. Yoo B and Donthu N (2001), “Developing and validating a Multidimensional Consumer-Based
Brand Equity Scale”, Journal of Business Research, Vol.52, No.1, pp. 1-14.
24. Wilkie W (1986), Consumer Behavior, John Wiley & Sons Inc., New York.

25. Zeithaml V A (1988), “Consumer Perceptions of Price, Quality and Value: A Means-End Model
and synthesis of Evidence”, Journal of Marketing, Vol. 52, No.7, pp. 2-22