3-d flood risk visualization beth norton december 21, 2011
TRANSCRIPT

3-D Flood Risk VisualizationBeth NortonDecember 21, 2011

2
Background
Floods are one of the most common hazards in the US FEMA provides flood risk data to community officials
through flood mapping products Participating communities in the NFIP regulate and
enforce the flood maps

3
Problem Risky decisions are made
• Communities allowing development in the floodplain• Developers buying land and building homes in the floodplain
The impacts of these decisions aren’t borne by those making them• Homeowners purchase the risk• Federal government insures the risk• First responders risk their lives to rescue people at risk
Flood maps are 2-D and don’t portray immediate risk• The forces of flood damage can’t be shown on a 2-D map.
Homeowners and potential homebuyers need tailored information

4
2-D Flood Map

5
Flooding Damage Forces Hydrodynamic Forces
• Moving water• The faster the water, the greater the pressure and erosion.
Hydrostatic Forces• Standing water• The deeper the water, the more it weighs and greater the pressure.• 3 feet of standing water can collapse a standard frame house
Debris• Ice floes• Large objects• Sediment
Soaking• Damages building materials and household goods
*Source: FEMA: Managing Floodplain Development through the NFIP, 2/15/2010

6
Proposal (Solution)
500 year
100 year
50 year

7
Proposal (Solution)
500 year
100 year
50 year

8
Process Software
• Sketch Up 3-D Buildings
• 3D Analyst 3-D flood hazard data
• ArcScene Visualization

9
Data Provided by the NCFMP Base Data
• 2010 Orthoimagery• Street Centerlines• Streams• Tax Assessor Data• LiDAR
Built-Environment Data• Digitized Building Footprints• Building Photos
Raster Datasets• Water Surface Elevation (WSEL) and Depth Rasters (Multi-Return
Periods) 10, 25, 50, 100, and 500 years

10
Data (cont) Risk Data
• Building Footprints attributed with First Floor Elevations Lowest and Highest Adjacent Grade Number of stories Estimated building and content loss Flood Depths Flood Elevations Annualized Damages
Regulatory Data• FIRM• FIS• Database

11
Project Area Tarboro, Edgecombe County, NC*
• Population – 13,121• Land Area – 9.8 square miles• Flood History
July 1919 flood Exceeded the 100-year flood
Hurricane Floyd, 1999 Exceeded the 500-year flood $5 Billion in damages to NC
Hurricane Irene, 2011
* Source: 11/3/2004 FEMA Flood Insurance Study, Edgecombe County, NC
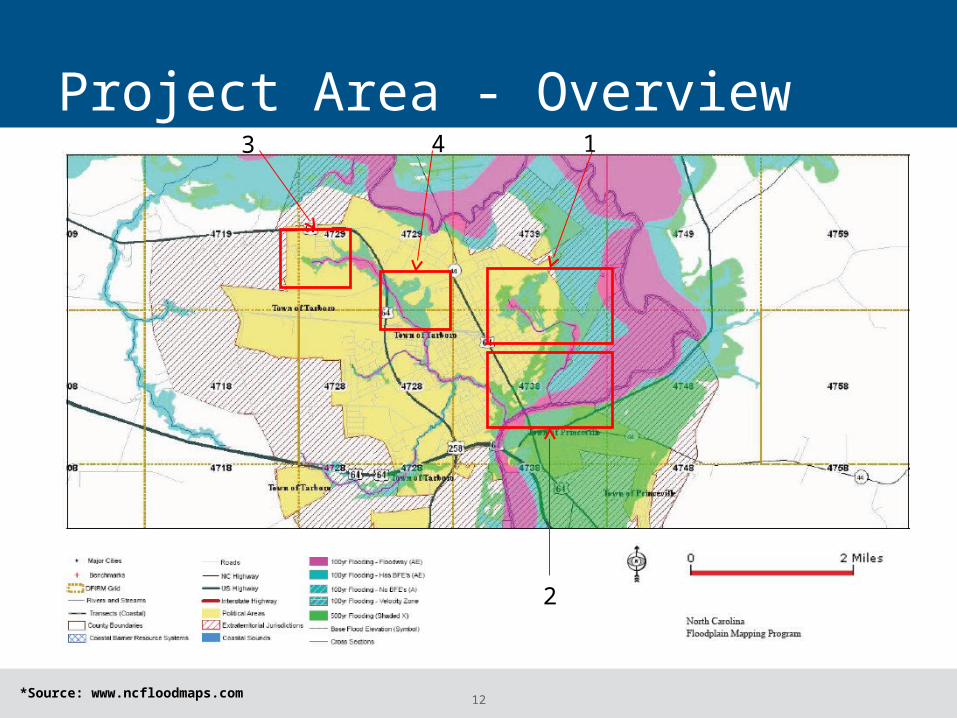
12
Project Area - Overview1
2
3 4
*Source: www.ncfloodmaps.com

13
Project Area - Residential
*Source: www.ncfloodmaps.com
14
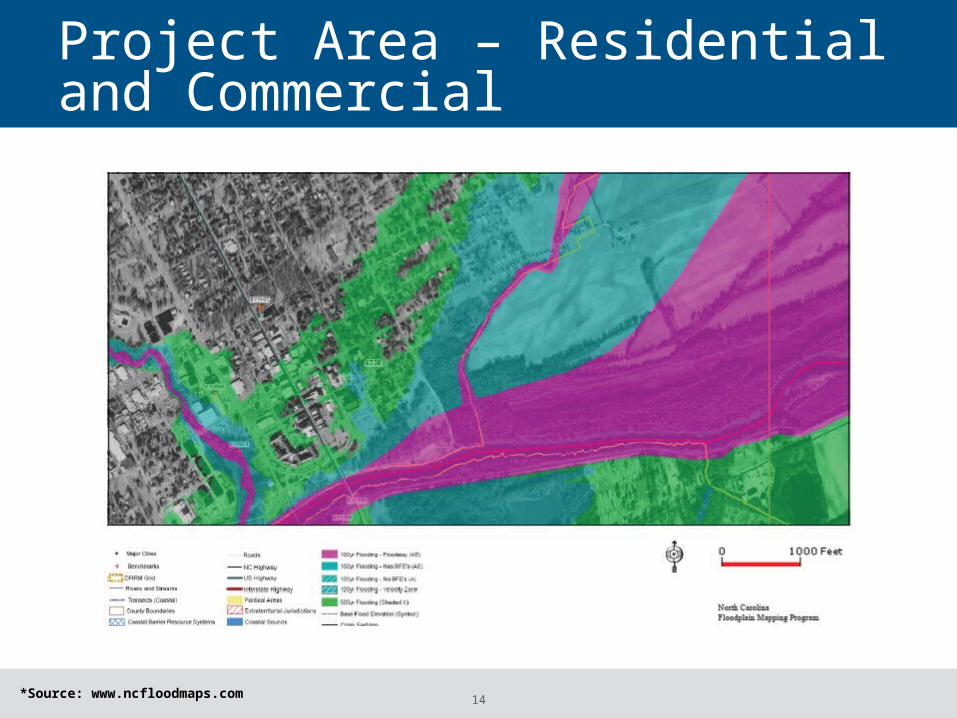
Project Area – Residential and Commercial
*Source: www.ncfloodmaps.com

15
Project Area – Lower Residential
*Source: www.ncfloodmaps.com

16
Project Area - Undeveloped
*Source: www.ncfloodmaps.com

17
Questions
????