3-d modeling of a reef-fault block structure - crewes · 3-d modelling of a reef-fault block...
TRANSCRIPT
3-D Modellinqof a Reef-FaultBlockStructure
3-D modelling of a reef-fault block structure
Darran J. Edwards
ABSTRACT
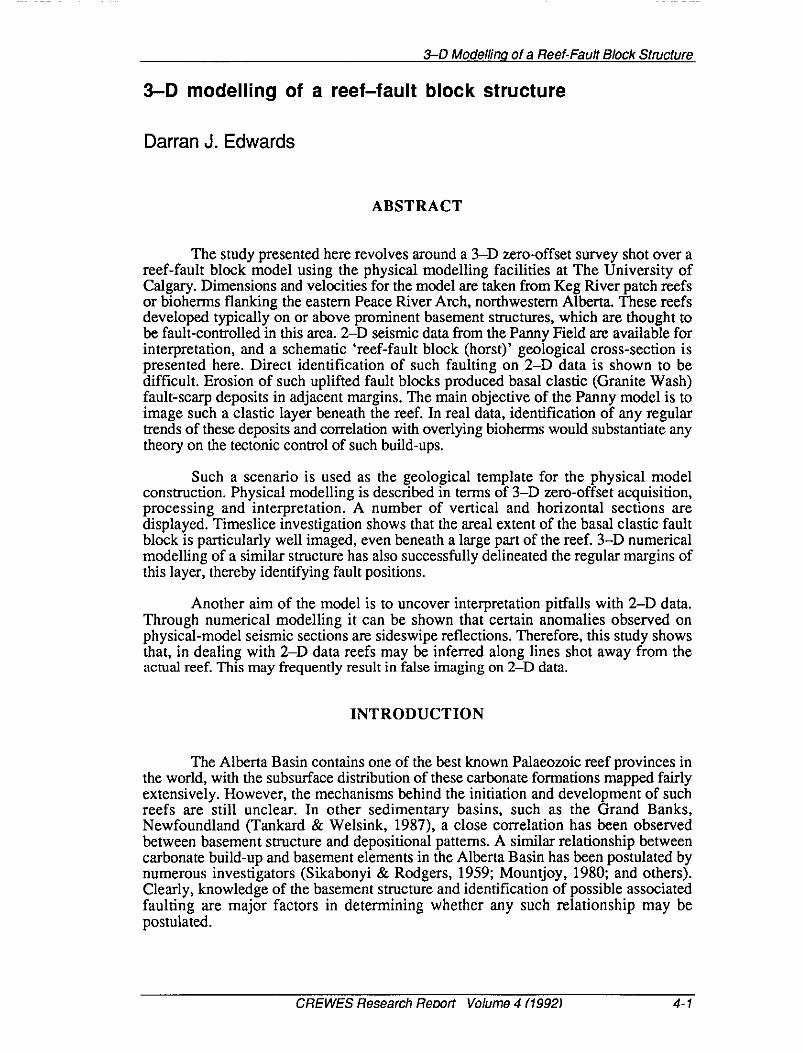
The study presented here revolves around a 3-D zero-offset survey shot over areef-fault block model using the physical modelling facilities at The University ofCalgary. Dimensions and velocities for the model are taken from Keg River patch reefsor bioherms flanking the eastern Peace River Arch, northwestern Alberta. These reefsdeveloped typically on or above prominent basement structures, which are thought tobe fault-controlled in this area. 2-D seismic data from the Panny Field are available forinterpretation, and a schematic 'reef-fault block (horst)' geological cross-section ispresented here. Direct identification of such faulting on 2-D data is shown to bedifficult. Erosion of such uplifted fault blocks produced basal clastic (Granite Wash)fault-scarp deposits in adjacent margins. The main objective of the Panny model is toimage such a clastic layer beneath the reef. In real data, identification of any regulartrends of these deposits and correlation with overlying bioherms would substantiate anytheory on the tectonic control of such build-ups.
Such a scenario is used as the geological template for the physical modelconstruction. Physical modelling is described in terms of 3-D zero-offset acquisition,processing and interpretation. A number of vertical and horizontal sections aredisplayed. Timeslice investigation shows that the areal extent of the basal clastic faultblock is particularly well imaged, even beneath a large part of the reef. 3-I) numericalmodelling of a similar structure has also successfully delineated the regular margins ofthis layer, thereby identifying fault positions.
Another aim of the model is to uncover interpretation pitfalls with 2-D data.Through numerical modelling it can be shown that certain anomalies observed onphysical-model seismic sections are sideswipe reflections. Therefore, this study showsthat, in dealing with 2-D data reefs may be inferred along lines shot away from theactual reef. This may frequently result in false imaging on 2-1) data.
INTRODUCTION
The Alberta Basin contains one of the best known Palaeozoic reef provinces inthe world, with the subsurface distribution of these carbonate formations mapped fairlyextensively. However, the mechanisms behind the initiation and development of suchreefs are still unclear. In other sedimentary basins, such as the Grand Banks,Newfoundland (Tankard & Welsink, 1987), a close correlation has been observedbetween basement structure and depositional patterns. A similar relationship betweencarbonate build-up and basement elements in the Alberta Basin has been postulated bynumerous investigators (Sikabonyi & Rodgers, 1959; Mountjoy, 1980; and others).Clearly, knowledge of the basement structure and identification of possible associatedfaulting are major factors in determining whether any such relationship may bepostulated.
CREWESResearchReoort Volumo4 (1992J 4-1

Darran J. Edwards
_ NORTHWEST TERRITORIES
5 I /=la mv_ _M_t_ I
:
/ \/ \\
! \! \
/ \\/ \
115000 ' I , 114o45 ,
•_'.. _...! ,"lid,," *
_'...L ;__,,_;,:.._;_,
tl,,
• * . _.- ° " ' " " 1-3-_-6W$ i,'.
t..," +L-" ,_,,.. 57°15'
_" T95LinePa-1J,'.
R6W5M R5 I
O tch0t location I
I.(p- (ab_"idoned) Well location
FIG. 1. Location of Panny (River) area wih 2-D seismic sections used in study.
4-2 CREWESResearchReoort Volume4 (1992)

3-D Modellinq of a Reef-Fault Block Structure
-115.40 -tl5,20 -115.00 -I t4.50 -114.60 -114.40 -tt4.20 -1t4.00 -113.80
I I • I I I •q I * • i f I
57.70 ........ _.... 57.70
57.50 --T--"_:_---I =,\'_,_-_'-r"----'_._"<;-,-:--/,_C-"X_._ 57.so
57,10 57.t0
,,'-'.I I P
5_,o f\' , , {:f...-T-,._L.___,.-"'_\_t_• ', \_ _-- '_ 55_o--115.40 --115.2Q --115.00 -114.80 14.60 -114.40 --114,20 -114.00 --115.80
//
/ . well position/ C.L20m
/-114.95 -I 14.SrO -I 14.85 -11'SO (Latitude and longitude In degrees)
57.40
FIG. 2. KB depth to Precambrian in the eastern Peace River Arch
(using available well data)
CREWES ResearchReoort Volume4 (19921 4-3

DarranJ. Edwards
_tll iJiii i Lill iii lll,ii iiii Lil_ll ,:_oo
i Precambrian structure map
(after Cant, 1988);note 90 degree 'block'
71 faulting (throws>4Om)
AG=axial graben
-I I I I _=1"1 i [ i i i Ii i i i i [ i ; i i T [ ; i i i i r _]T_t Tl_h __0 6thMet, 20 tO
SP.¢¢LASTIC
_;_r;__.,,.,,-°"- "_i_:,_,"_'_-_--!i:::.......::::::::::":;il
Cross-section of the Keg River to Precambrian interval in thePeace River Arch area as viewed from the northwest (Campbell., 1987).Note location of Upper Keg River reefs over Precambrian horst.
FIG. 3. Geological setting for physical model: eastern Peace River Arch area
4-4 CREWES Research Report Volume4 (1992)

3-D Modeltinqof a Reef-FaultBlockStructure
The study presented here revolves around a 3-D seismic model constructedusing the geology of the east Peace River Arch, northern Alberta as a template.Velocities and depths from the Panny (River) Field were used from Anderson et al.(1988). The Keg River Formation, where structurally draped or closed acrossunderlying Precambrian highs, is the principal reservoir facies in this area. Keg RiverFormation patch reefs or bioherms developed typically on or above prominent basementstructures (Campbell, 1987). Basal clastic or Granite Wash deposits are frequentlyassociated with these Precambrian highs. Erosion of Peace River Arch uplifted faultedblocks produced the coarse-grained clastic deposits in adjacent fault-bounded margins.
The primary purpose of the Panny River Model was to analyze the seismicresponse of lower-velocity basal clastic deposits underlying Keg River patch reefs in anattempt to delineate any basement faulting. Identification of regular trends ororientations through detailed mapping of these deposits by timeslice investigation, andcorrelation with overlying carbonate bioherms would substantiate the theory behindtectonic development of such build-ups. Direct detection of such faulting on 2-Dseismic data is normally difficult because of the limited offset and vertical or sub-vertical nature of the basement displacement. Furthermore, this faulting is also thoughtto have a strong horizontal, strike-slip component to it. Mitchell (1987) concludes(from an oral presentation) that "3-D seismic has been an effective tool in locatingPrecambrian highs and their trends (in this area), even when their seismic expression issubtle". The model's secondary purpose was to uncover interpretation pitfalls in 2-Ddata (particularly those associated with sideswipe), and to illustrate the advantages of3-D seismic data.
The first section of this paper describes the field acquisition, processing andinterpretation of two 2-D seismic sections shot over part of the Panny Field. The twosections intersect at a well drilled into the flank of a patch reef draped over one suchPrecambrian high. The second section outlines the 3-D physical seismic modelling of a'reef-fault block' at The University of Calgary in terms of model construction, 3-D dataacquisition, processing and interpretation. Finally, 3-D numerical modelling of acorresponding structure is discussed, with particular attention given to the effects ofsideswipe.
GEOLOGICAL FIELD SETTING
Since the discovery of oil at Amoco's 2/3-11-96-6W5 test well at Panny in1983, the eastern Peace River Arch in northern Alberta (Figure 1) has been an activeexploration area. An estimated 55 million bbl (8.7 x 10⁶ m3) of recoverable oil hasalready been discovered. The Keg River Formation is the principal reservoir facies andis typically productive where structurally closed across Precambrian highs. It iscommonly considered to be a structural trap as these sediments are productive onlywhere draped across underlying basement structures and the Upper Keg River ReefMember, respectively. Although porosity and permeability within these latter two unitsare stratigraphically controlled, the off-structure facies generally being tighter, theseeffects are considered as secondary to the drape resulting from differential compaction.The reservoir facies is capped by the basal anhydrite unit of the Muskeg Formation.
The Precambrian surface consists of anomalous structural highs prevalentthroughout the area, with relief typically ranging from 10 to 100m. Generally, such
CREWESResearchRenort Volume4 (19921 4-5

DarranJ.Edwards
structures have been mapped from the available seismic and well data as being areallyclosed, a pattern consistent with the idea of a surface fractured by conjugate pairsets offaults oriented in NW-SE and SW-NE directions. There is evidence, both geologicaland geophysical (Anderson et al., 1988; Cant, 1988), of renewed faulting since KegRiver time, either on new surfaces or as reactivations of former faults. The firstdocumented episode of reactivated normal faulting affecting the Arch occurred duringdeposition of the Elk Point Group in the mid-Devonian. Conglomeratic Granite Washdetritus or basal elastics (and related elastics such as the Gilwood Formation) areeroded from upfanlted blocks and interbedded with Elk Point sediments indicatingepisodes of tectonism. It is thought that basement relief influenced the locations ofbioherms in onlapping carbonate units (Cant, 1988). The Slave Point and Keg Riverreefs occur on upfaulted blocks near the eastern edge of the Arch, for example at SlaveField (Dunham et al., 1983). A schematic cross-section of the east Peace River Archarea is displayed in figure 3.
Panny River example: 2-D seismic sections
The Keg River Formation is the principal reservoir facies of the Panny Field,the basal Palaeozoic clastics being a secondary target. Figure 1 shows part of the PannyField with the approximate orientation of the two 2-D seismic lines, PA-1 and PA-6,and wells used in this study. Wells 1-3-96-6W5 and 3-11-96-6W5 both producefrom the Keg River Formation.
The seismic data were acquired by Enertec Geophysical Services Ltd. in March1984 using a 1000m - 60m * 60m - 1000m, 96-trace, spread, with source andreceiver intervals of 40m and 20m respectively. A hydrapulse source with 18 pops persource point was used. Data acquired using hydrapulse sources typically have poorpenetration below 800-1000ms with an abundancy of lower frequencies. This wouldseem to present a problem since it is the aim of this paper to image basement faulting,and its subsequent effects.
The data were processed up to stack by Geo-X Systems Ltd. using thefollowing processing parameters:
Demultiplex
Amplitude Recovery
Phase Compensation
Spiking Deconvolution (80 ms operator, 1% prewhitening)
Elevation and Refraction Statics
Initial Velocity Analysis
Statics (Surface Stack Residual)
Velocity AnalysisNormal Moveout
Mean Scaling (400-1200ms)
Mute
Trace Gather (24 fold)
4-6 CREWESResearchReport Volume4 (1992)

3-D Modellinq of a Reef-Fault Block Structure
0 4000mI !
S.P. 2801 3001 32010.5
-.I
PA-1 m
1.2
{projectedIocatlccl)1-3-96-6W5 3-11.96-6W5
+ ÷S,P. 3121 2921 UnePA-1 2721
0.5
-t
m_PA-6
1.2
FIG. 4. Condensed scale displays of lines PA-I and PA-6
CREWESResearch Reoort Volume4 (1992) 4-7

Darran J. Edwards
S.P. 2921 2871 2821
sec
Beaverhill
Slave Point m
Muskeg Fm
FIG. 5. WELL 03-11-096-06-W5
Synthetic Seismogram tie with line Pa-6
4-8 CREWES Research Report Volume 4 (1992)

3-D Modellinqof a Reef-FaultBlockStructure
CDP Cross-correlation
Stack
Post-stack processing was undertaken on ITA's INSIGHT software using thefollowing modules:
Karhunen-Loeve Stack (SNR enhancement)
FK Filter (20-80 Hz)
GappedPredictive Deconvolution (operator lOOms, gap 50ms)
2-D interpretation
Figure 4 consists of condensed scale seismic displays of lines PA-1 and PA-6in order to illustrate the subtle undulatory nature of the Precambrian basement on suchsections, together with the draping of overlying formations over topographic highs.Well 3-11-96-5W5 is found at the point of intersection of these two lines and is usedto tie well depths to the seismic data. The synthetic and field data directly correlate at thePrecambrian, Keg River, Muskeg, Slave Point, and Beaverhill Lake events (Figure 5).Throughout this paper, such expressions as 'the Keg River reflection event' refer to thetop of the named unit.
Well 1-3-96--6W5 is found approximately 0.5 km to the south of line PA--6 butwell depths may be projected to intersect it. The synthetic seismogram produced fromthis well corresponds well with the events interpreted from the previous well. Campbell(1987) describes the core from well 1-3-96_W5 at depths of 1224m to 1260m. TheKeg River in this cored sequence consists of a high-energy bioherm rooted directly ontop of Precambrian granite gneiss basement. Overlying the basement rock are a seriesof siliciclastic sands, conglomerates and carbonate interbeds. Bioclastic gravel-stromatoporoid sequences appear to form the bulk of the deposits associated with thebioherm facies. Figures 6 and 7 show the seismic and schematic geological cross-sections surrounding the well. The bioherm or patch reef is interpreted as overlying aPrecambrian basement high and adjacent basal clastic deposits. The Keg RiverFormation is draped across these structural highs, as a result of differential compactionof lower Palaeozoic sediments, producing a reservoir where structurally closed againstthe flank of the underlying high. Vertical or near-vertical faulting has been interpreted inthe Precambrian hut with limited confidence. It would appear these die out below 1 sec(possibly due to the poor resolution of the data). Nevertheless, faults have beenidentified where the basal clastic unit, thought to be a fault-scarp deposit, is known toexist through well data.
Such a 'reef-fauh block (horst)' scenario is used as the geological template forthe physical model construction. However, this situation is simplified in the model bythe fact that the Keg River interval is only represented by an elongate patch reef withsloping flanks; whereas in reality the reefal facies and adjacent off-reef sediment arenormally of similar velocity. Indeed, sometimes the reefal facies is of slightly lowervelocity. Hence, the patch reef top and flanks are frequently difficult to image onseismic data shot this area.
CREWESResearchReoort Volume4 (1992) 4-9

1-3-96-6W5(projected location)
0 800 rn _LI m 1p-
S.P. 3051 3001 29610.75
Muskeg Fm _¢o_
KegRIL,UrF_
Keg
Precambrian
1.00c_
m
-% 1.25
FIG. 6. Enlarged seismic section of line PA_ around well 1-3-96_W5

3-D Modellinq of a Reef-Fault Block Structure
_.L-
S.P. 601 1-3-96..6W5 "_- 501
0.85
TopKegRiverFm
_ Top Precambrian
1.05
0 800mI I
1-3-96-6W5
I
1261 m
FIG. 7. Geological interpretation of patch reef around well 1-3-96-6W5
CREWES Research Reoort Volume4 (1992) 4-11

DarranJ.Edwards
PHYSICAL MODELLING
Physical seismic modelling involves the generation of seismic responses overscaled geological models in the laboratory. The success of physical modelling isdirectly dependent on the choice of modelling materials and scaling factors used for thesimulation. The materials used must have acoustic velocities appropriate for scaling andmust be readily formable into complex shapes. Scale factors are chosen for the modelexperiments such that the value of a model parameter multiplied by the appropriate scalefactor results in the dimensions of the field prototype. In this study, the physicalseismic modelling method was employed to study the seismic response of an reefpartially overlying a set of vertical faults.
Reef-fault block (horst) physical model
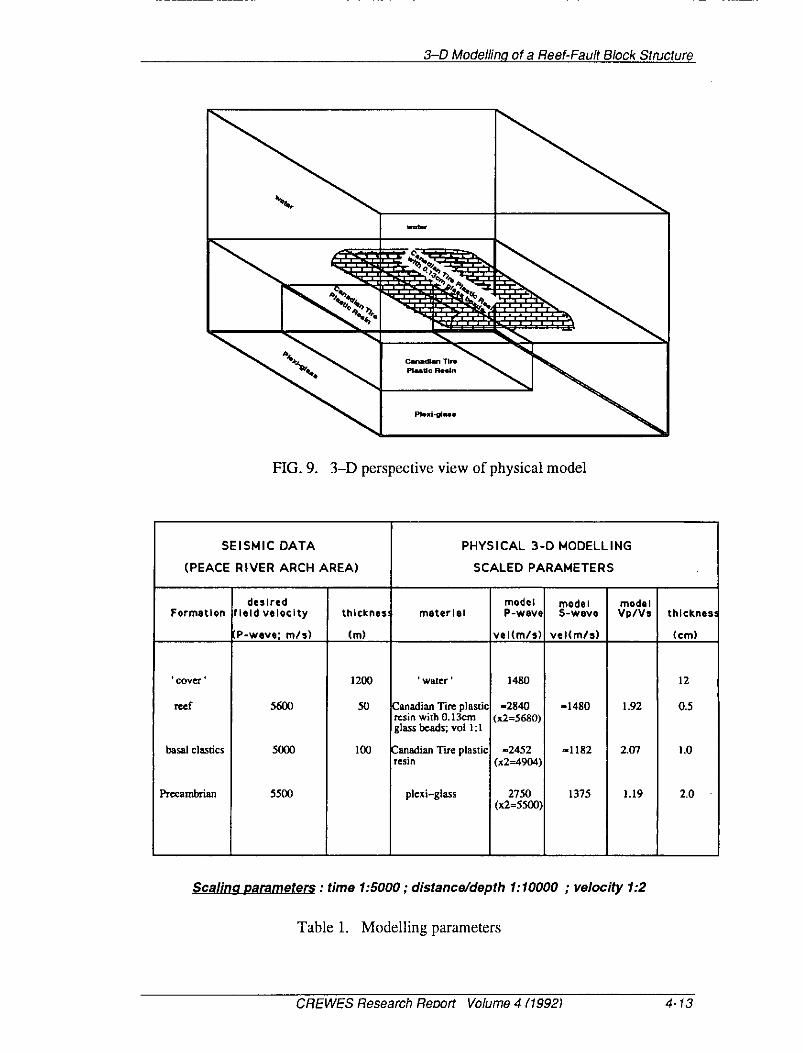
The geometry of the model is shown in plan view, cross-section, andperspective 3-D outline in figures 8 and 9 respectively. Scaling factors for velocity of1:2, for depth and distance of 1:10,000, and for time of 1:5,000 were all used such thatthe model parameters multiplied by the scale factor resulted in the dimensions of thefield prototype. The dimensions for the Keg River reef were taken from Anderson et al.(1988) and are typically elongate, around 1000 m by 500 m and 50 m thick (10 cm x 5cm x 0.5 cm scaled). Such reef are found at a depth of 1200m (12cm scaled) within thePanny and Trout Fields associated with the eastern Peace River Arch. A characteristicmaximum throw for the observed normal faulting can be estimated from the contouredPrecambrian surface (Figure 2) at approximately 100 m (lcm scaled).
The materials used for model construction were those that had velocitiesappropriate for scaling with respect to the field velocities observed in the Peace RiverArch area. The stratigraphy and velocity structure is contained in Table 1. Using avelocity scaling factor of 1:2, a suitable model substance for the reefs was found to beCanadian Tire Plastic resin with 50 micron diameter glass beads (at a volume of 1:1)with a model P-wave velocity of 2840 m/s, giving an unscaled velocity of 5680 m/s(compared to 5600 m/s field value). The basal clastic or Granite Wash unit wasconstructed from only the Canadian Tire plastic resin, having a P-wave velocity of2452 m/s scaled (4904 m/s unscaled, compared to the field prototype of 5000 m/s).Finally, the base (Precambrian) was cut out of a Plexiglas sheet with an unscaled modelvalue of 2750 m/s (both unscaled and field P-wave velocities are 5000m/s).
Physical modelling system
The physical modelling system at the University of Calgary was developed byCheadle et al. (1985). The major components of the system are: a water-filled tank (3 mwide, 4 m long, and 2 m high); two perpendicular beams containing motorizedcarriages; two spherical ITC-1089C ultrasonic piezoelectric transducers; a pre-amplifier;a pulse generator; an IBM-XT PC; and a digital storage oscilloscope.
During operation, the reef-fault block model is submerged in the tank on alevelled platform for the experiment. The two transducers act as source and receiver andare moved across the model on the motorized carriages. The acquisition geometry of thesurvey is programmed using a PB 386/25 which controls the positions of thetransducers. A zero-phase signal is obtained by the summation of three wave trainsgenerated from the pulse generator. The received signal is digitized by a high speedstorage oscilloscope. A direct link between the oscilloscope and a Perkin-Elmer allowsthe transfer of the seismic trace, containing a maximum of 4096 samples plus the trace
4-12 CREWESResearchReport Volume4 (1992)
3-D Modelfin,qof a Reef-Fault Block Structure
FIG. 9. 3-D perspective view of physical model
SEISMIC DATA PHYSICAL 3-D MODELLING
(PEACE RIVER ARCH AREA) SCALED PARAMETERS
desired model model modelFormation field velocity thlcknes,, moterlol P-wove S-wave Vp/Vs thlcknas_
IP-wove; m/s) (m) vel(m/s) vel(m/s) (¢m)
' cover' 1200 ' water ' 1480 12
reef 5600 50 3anadian Tire plastic -2840 -1480 1.92 0.5resin with 0.13cm (x2=5680)glass beads; vol 1:1
basal cl_tics 50(X) 100 2anadian Th'c plastic -2452 ,,1182 2.07 1,0resin x2=4904)
Preeambrian 5500 plexi-glass 2750 1375 1.19 2,0(x2=5500
Scalino parameters : time 1:5000 ; distancedepth 1:10000 ; velocity 1:2
Table 1. Modelling parameters
CREWES ResearchReDort Volume4 (19921 4-13


3-D Modellinqof a Reef-FaultBlockStructure
header, onto magnetic tape in SEG-Y format. At this stage, the raw data can beprocessed using ITA's Insight 3-D software.
Acquisition parameters
A 3-D zero-offset survey was carried out over a scaled area of 25 cm by 20 cm(2500 m x 2000 m unscaled). 3-D zero-offset surveys have a 'stacked' trace at thecentre of every bin, and for this survey 5 stacks per trace were used. The surveyconsisted of 100 lines and 80 shots per line (100 inlines, 80 crosslines). The scaled binspacing used was 0.25 cm or 25 m unscaled (line, shot, and receiver spacingconsistent). The inlines were shot parallel to the short side of the reef (shootingdirection). The nearest offset possible was 100 m because of the spatial nature of thesource and receiver transducers. A sample rate of lms was used over a record length of2 seconds.
3-D processing
Following acquisition, the raw 3-D zero-offset data is loaded onto ITA'sINSIGHT system for 3-D processing. The 3-D zero-offset processing flow for thereef-fauh block model is summarized in figure i0. 3-D geometry in the form ofobserver and survey note files are then generated and the dataset is updated. The datawere muted from 0 to 700 ms in order to remove the direct arrivals which are of a veryhigh amplitude nature. This is directly related to the small source-receiver offset of 100m. Effects due to water reverberations are also removed.
The 3-D data volume is sorted on the basis of full 3-D composite CDP number(combined line and station number). This sort map is used to pad the 3-D dataset to afull regular 3-D cube. Data records corresponding to either inline or crossline (station)data segments can then be easily extracted from the data cube.
Inline 50 (reef and fault block) was extracted from the padded 3-D dataset for2-D migration testing. A frequency band range of 15 to 100 Hz was obtained for inputinto the migration from analysis of the Fourier spectra (Figure 11). RMS velocitiesneeded for the migration were computed from the known interval velocities of themodel using the following equation:
v.,,= ,.,61
where Vi and ti are the known velocity and travel time through the ith layer.
Confirmation of these velocities was provided through migration, with theinterval velocities recalculated from the RMS velocities using the Dix equatio n. Figures11 and 12 illustrate the unmigrated and 2-D migrated inline 50 respectively.
A one-pass 3-D phase-shift depth migration was applied to the entire 3-Ddataset, using downward continuation with the two-way wave equation. Time-RMSvelocity pairs input into the migration correspond to known interval velocities over thecentral part of the reef model, since the main aim of the migration is to collapse the
CREWESResearchReoort Volume4 (1992) 4-15

Darran J. Edwards
RAW 3-D ZERO-OFFSET DATA1(physical modelling tank)
(3-D GEOMETRY_ ,_==-_,,_,,ITA SEG-Y format data _verticnl/timaslice axtraction)J _uslng Landmark '3-.0 Plus'.)
_-setup end analysie J
3--0 MUTE )data muted 0 to 700ms |
J
I _OSORTMAP)data sorted on the basie of full 3-D |
composite CDP number |
(combined line and station number))
(,nline50extracted)_. ( 3-D DATACUBE _ j Outputdetaset padded to full 3-D cube
_for 2-D migration tasting) J-_selected inlines / croaslinas )
' 1(Analysis of Fourier -J Spectra
L(for max I min frequencies)
1(from known interval one-pass 3-D phase-shift using Landmark '3-D Plue' •velocities) depth migration
t
2-D MIGRATION I _Online5o)
_( out.ut
Lsalectadinlinee/croesline_ I
FIG. I0. 3-D zero-offset processing flow for reef-fault block model
4-16 CREWES Research Reoort Volume4 (1992)

1.00
_E
__ o.50x_
"=8" o.2s
0.11 ,25 50 75 100 125r_ Frequency (Hz)
Trace 10 20 30 40 50 60 70 80
1.0
i
1.1
FIG. 1l. ]nlinc50 with frequencyrangefor2-D migrationtesting

CDP 10 CDP 32
T[ME V-RMS V-|NT TIME V-RMS V-INT CDP 50 COP 70
|O 1460 |480 IO 1480 1480 TIME V-flMS Y-INT TIME V-R"S V-|NT
840 1480 1480 800 14110 1480 I0 1480 1480 10 1480 1480910 1988 5000 840 1892 5600 _ 1480 1400
LOlO 2559 5508 810 2286 50QQ _0 1892 5600 840 1480 1480
|OtO 2776 5SQO 1010 2041 5500 lOtO _28 55_I
Trace 10 20 30 40 50 60 70 80
!
0.7i
-I 0.8 ,_,_3 -'--• rt--
0.9 ,_--r..4--.
.i
10 :=
i
1.1 "=
FIG. 12. Test 2-D migration of inline 50 (with RMS velocities used)

3-D Modellinqof a Reef-FaultBlockStructure
diffractions associated with the reef flanks and vertical faults. This is because only oneset of velocities can be input into this 'fast' depth-migration process. The time-frequency band definition used for the 2-D migration is also included in this 3-Dversion.
3-D INTERPRETATION
Both the raw and migrated 3-D zero-offset datasets were interpreted usingoutput from ITA's Insight system and '3-D Plus" on the Landmark workstation. Twotypes of seismic display were produced on both systems: vertical sections; andhorizontal or timeslice sections.
Vertical seismic sections
Figures 13 and 14 illustrate representative inline sections from the unmigrated andmigrated datasets respectively. They represent situations where :
- only the faulted platform is present
- both the reef and faulted platform are evident
- the reef overlying a simple platform
- a simple unfaulted platform.
A number of events can be picked on the recorded data in a quantitative mannerbecause we know the model geometry and velocity. Top of the reef, platform and basalclastic unit reflectors can all be readily identified due to their high amplitude, continuousnature. The base of the model is also evident, just below 1000 ms. The highestamplitude visible appears to correspond with the top reef event at 810 ms, which is tobe expected since the velocity and density contrast between the two media is greatest(water 1480 rn/s and reef 5680 m/s - unscaled velocities). On sections such as inline70, the platform is imaged beneath the reef. Slight pull-up can be identified due to thehigh- velocity nature of the Canadian Tire plastic resin/glass bead material (reef) withrespect to the surrounding water. The reflections from the platform under the reef bodyarrive earlier than those to the side. A basal clastic event is distinguishable at around900ms from u'aces 1 to 40 on lines where the fault block is present (inlines 10 and 40).At first glance it may be possible to correlate this with an adjacent lower-amplitudeevent at the same time. This is particularly evident on inline 10 where a continuousevent could be interpreted. This lower-amplitude arrival is thought to be the result of abond in the Plexiglas (platform) layer. The reflector that represents the model baseappears to vary in amplitude and arrival time. On lines where the reef is present (inlines40, 70), it is possible that pull-up can be identified for this arrival. Where the faultblock is present (inlines 10, 40), a push- or pull-down effect can be recognised beneaththe lower-velocity basal clastic unit with respect to the platform. The reflections fromthis part of the model base therefore arrive later than those adjacent.
On the unmigrated sections, a number of diffractions may be inferred: thoseassociated with the edge of the reef (with a variation in diffraction curvature); and lessprominent curves delineating the vertical fault. The later would appear to have phasereversals from branch to branch of the curve. However, no phase reversal is apparent
CREWESResearchReoort Volume4 (1992_ 4-19

Darran J. Edwards
Trace 10 20 30 40 50 60 70 80
._)-t_t .t.)-:_-t_-t-_-H -_.t-H-t .t._*.½.],-}-_-t.t .i .),+H. t .i.,I-t-_*._4-_-_4 _.V)_._
0,8 _::_,"_"__ _ -*.___:;_:_::::-_-,':-,-_
0,9 ........... '_'--_:-'-'-_-:-"-_-_._:.:-_-'--'.e__
,= 1.o1.1 .......
Inline 10 (fault-block)
__._/Pf.._-r_¢ ..... _,- -H-_ ............ =====================................ ::::::::::::::: ............. _-_:11_:I_.::;;;::;:;;:;;+_H-,+,+_+_-
._ ::::::::::::::::::::::::::::::::::::::::::::::::::::::
.._,_-_)_.'p_n_,-,--._.'_-;;.._._._.-.-._-__._-.-.__-:.-_ .... _.-.,.;_-:.-;:'_'-._..................... ._-.n,_._............................. :_,,,,,,,_-6&,.,.-,__*,._-_ --.._--
1.1 --_`_`_`_`_'`_`_`__;;r`:_:_`_-_`_ ...... ,,,,, ...............Inline 40 (reef and fault-block)
===================================...... .:,_....... J.......... ,_0.7
...... :::::::::::::::::::::::::: .... : :_'_)_'_'_:_3:t_:_3_-H-_-_-_ _-_._-_-_-_:t:_d#l:tct=I.- 1 0 ___;.._.;._..._...s_._ -__._-._._._._.__
1 1 =:,.'.:,,.................................... _,_,_,,_.__,._d,,'_t,F_;.......................Inline 70 (reef only)
• ,_;_._...,,,.,,._,,,-_,,_b_,,,_,,,,_"-| ......... I ......... I ......... t ......... I ......... !0.7 ____--r::::: ":: ": : :: "_¥_¥_¥_";";'_'_Y'¥(('Y_'_:_'_Y_Y_'_'_:e_'_:_¥_'_'_'_5_
0.8 _i22__i_'_"_'_'L:'"_'_'_.':._._.._-_tt_-_tt-t_t_t-t__
1.1 -_,-_-,-_:-_-:.:._.;.;4_.:.:-:.:.:-:-_.__:.:.:-:.___ _ ___ _ __ -Inline 90 (no reef nor fault block)
FIG. 13. Representative unmigrated sections
4-20 CREWES Research ReDort Volume4 (1992)

3-D Modelfinq of a Reef-Fault Block Structure
Trace 10 20 30 40 50 60 70 80......... _......... i ......... t.:. ...... i ..... ;;;! ....... ::!:::::::::! ......... I::::::::::::::::::::::::::::::::::::::::::::: ..................................
0.7 _.-..__},:_--_-----_:-_:-----.:=--L._._._ ::::::::::::::::::::::::::::::::::............ ::.-::::::7::::7:: ................ : = : : : : : :.- _ £_ _: : : : : : :..-- (£,_ / ([ f i i i¢_E
.... _.E'_j._.gE._ ....... . . , . =_=_:>__ .__._._._ H '+ --kkl._kkkkd_k.kkLkk ......... kk_k.k:,.--(_'.......................... 3r---:_v_. ,, ,,,,,,
E p_)_._:_:; .... _,_>_;;;._ ___1.0 :::-.-._-_.;_-_'_';.':_=_- "..................
Inline 10 (fault-block)
0.7 _l-_J_-'-" ;_"_"'" "_"___.:_:,_:,'}_HH __ }i_ i H _iH i __ __
- ,'+,'++"-+÷_,_,"_ ff=lff:t__ ._.._._._. .-%_.<-_ ....................................
0.8 ...;:,;;;::;:----: ........... -.-,..... If ..............
+ o.8---- " " " - _,m__+_ ......... _._ . -_- - _ .... _._.d.?,._.,..,+_,._.__
_:_,__.-:: - ---_- -- :_,k_i_.._._-_-_ ".-_
1.1 ...............................................................Inline 40 (reef and fault-block)
......... I ......... I ......... I ......... I ......... I ......... I ....... ..I ......... I
....... _-_'_ H _Hiiiiit,.'iii H _ _ _'_ii!!iii_'_ _
::::_:_:_::_/:::/_:._/._/:_::::::::::::_._::_:`:._:_.!_2:_!_!!_::_/_..:_.i._:_t.._..
--_t-<-_-._.p_. . .. ._._c-.:#£_-.. . ._x:_T.-.#£F£..-£.-,.--f_ f.......... . ........ . ... . . . .. . . . . . . . . ._,_<_. _._-_._-._.e_-_-._.-< _.__ _
Inline 70 (reef only)
......... I ......... I ......... I ......... I ..... "r.,.I ......... I ......... I ..........
0.7 _-.h'._?; _??_?_my..?Y:Y_iY+__.-?.--i-.---.:____ ii _-i_ _i_ _ _i_????i_0.8 i i J ; ; ; _;_U_U`;_;_;_:_:3_`_:'`L:_:_L_'``_:,`_.L:_':_:_:_L_':,`:_:_```V:_:_:_:_:_:_:_:_;_;_;_:_:_:_:_:_:_:_:_:_:_:_:_;_:``"_
Inline 90 (no reef nor fault-block)
FIG. 14. Representative migrated sections
CREWES Research Reoort Volume4 (1992) 4-21

Darran J. Edwards
on the reef edge diffraction with the steeper, narrower curvature and shorter 'tail'. Suchdiffraction curves should be removed by migration. The migrated sections (Figure 14)illustrate that those associated with the fault and the diffraction with the wider curvatureboth disappear; but the so-called 'diffractor' with the shorter tail and no evidence ofphase reversal still remains. This feature is not a diffraction but is a reflection from theflank of the reef, probably because of the zero-offset nature of the survey. Thereflection has a steeper dip than the diffraction. This can be further illustrated bynumerical modelling of such a reef, using the Sierra modelling system, which does notcompute diffractions. Yet, after Sierramodelling, this feature is still present - indicatingits origin as a reflection. Unmigrated _nd migrated timeslices further illustrate the arealextent of these distinct diffractions and reflections
An apparent 'diffraction' may also be inferred on unmigrated inline 90 (Figure13) with the curve apex at, or just below, the platform event. Here, no irregularity nordiffraction source is present. This feature can be interpreted to be a sideswipe reflectionfrom the flank of the reef. A sideswipe reflection is one whose reflection points lieoutside the plane of the seismic section. It may be shown through numerical modellingthat this is an out-of-plane reflection (Figure 21). If a reflector has a component of dip(reef flank) in the direction normal to the plane of the seismic section, the dip will giverise to sideswipe. Without this understanding, it would not be possible to properlycorrelate a reflection through a 2-13 grid and produce a correct interpretation.
Timeslice displays
One aim of this paper has been to test the usefulness of timeslice sections ininterpreting the reef-fault block model. Four characteristic pairs of unmigrated andmigrated timeslices are presented in this paper (Figures 15 to 19), illustratingparticularly well the nature of the fault-block arrival amplitudes and propagation ofdiffraction curves and reef-flank reflections with time and distance.
Above the platform, the extent of the reef outline is well imaged on the timeslicefor time 820 ms (Figure 15), with surrounding water having a zero amplitude. Thefocussing effects seen on the reef flank comers of the unmigrated data are not presentwhen migrated.
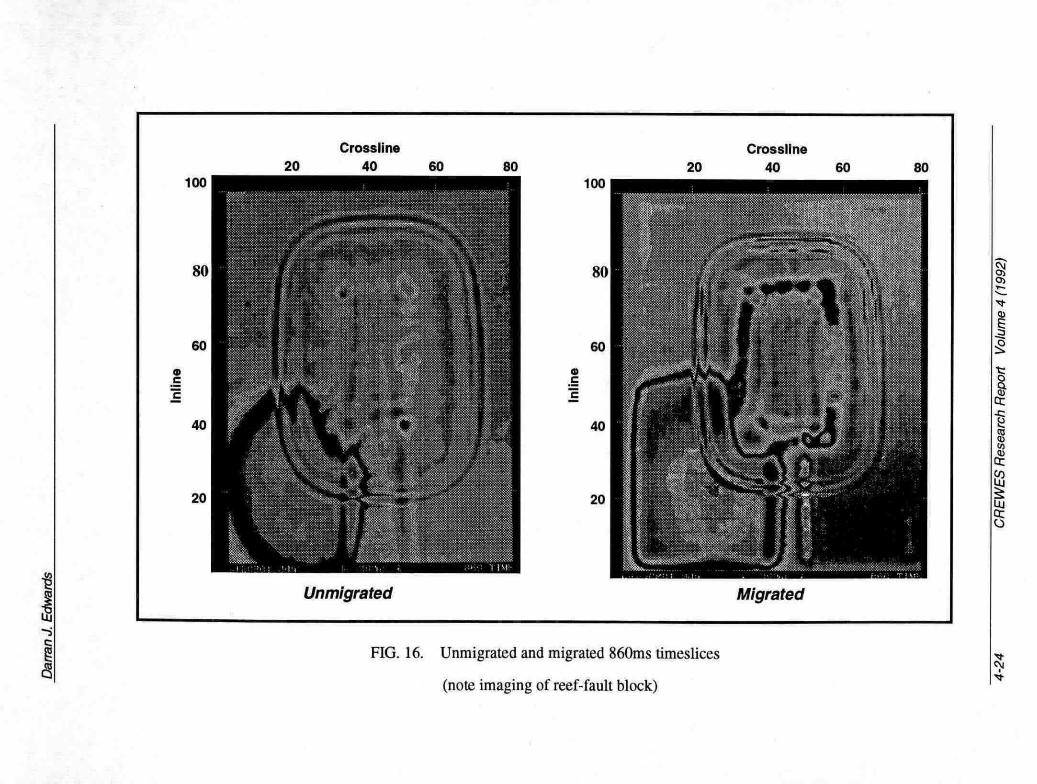
Timeslice 860 ms (Figure 16) provides a good example of the areal extent of thebasal clastic fault block. The regularity if the fault block margin is particularly wellimaged in the migrated timeslice. The Canadian Tire plastic resin (basal clastics)-Plexiglas (platform) interface shows up as a marked positive amplitude anomaly. Theamplitude decreases significantly toward the centre of the reef where it becomes maskedby transmission losses due to the high amplitude top reef event. Also on this timeslice,a small amount of pull-up may be inferred by the presence of anomalous amplitudevalues around the projected position of the reef, whilst elsewhere values are essentiallynegligible.
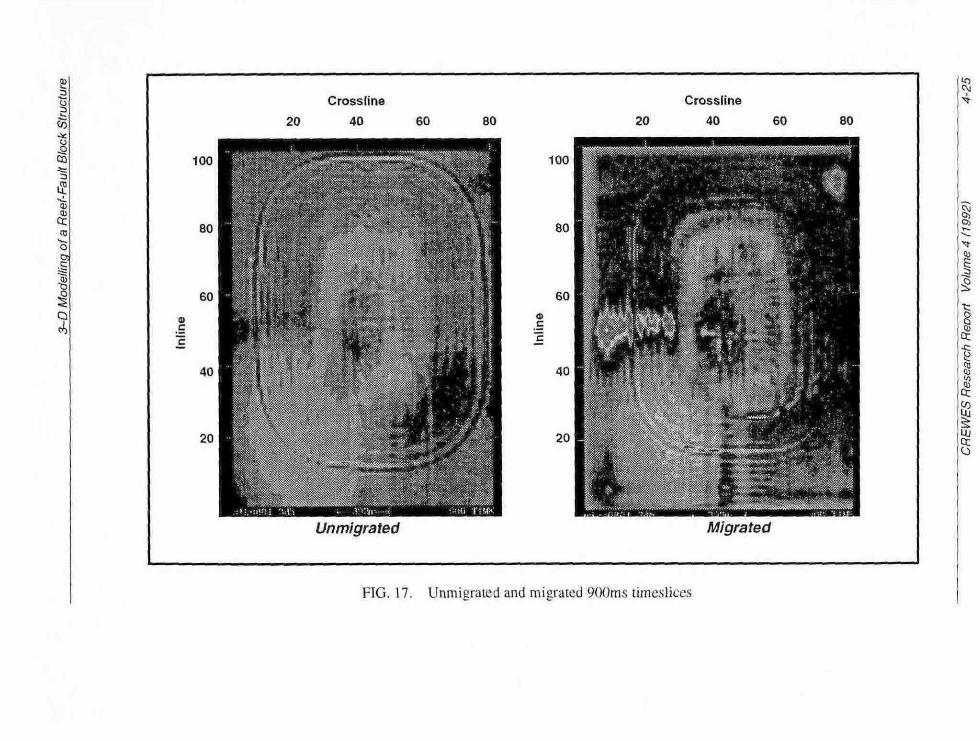
In the 900 ms and 1000 ms timeslices (Figures 17 and 18 respectively), bothpull-up and push-down are encountered. As mentioned earlier, pull-up is locatedbeneath the reef and push-down effects are associated with the lower velocity faultedlayer. The effect of the push-down is again to successfully delineate the faultedmargins.
On timeslices beneath the top-platform event, the diffraction wavefront from thereef flank can be observed to propagate laterally away with time. These diffractioncurves are removed when migrated, leaving a (zero-offset) flank reflection which has
4-22 CREWESResearchReport Volume4 (1992)

100
40
20
100
Cross line
20 40 60
40
20
80
Unmigrated Migrated
FIG. 15. Unmigrated and migrated timeslices for time 820ms, imaging the reef outline
100
20
Unmigrated3
100
20
Migrated
FIG. 16. Unmigrated and migrated 860ms timeslices
(note imaging of reef-fault block)
CO
oD:
Q
100
40
20
Cross line20 40 60 80
100
80
60
40
20
Crossline20 40 60 80
Unmigrated Migrated
FIG. 17. Unmigrated and migrated 9Mms timeslices

100
20
Crossline
20 40 60
Unmigrated
100
20
Migrated
PlG. 18. Unmigrated and migrated 1000ms timeslicesto4

3-D Modellin.qof a Reef-FaultBlockStructure
similar concentric pattern but is of less width (reflection has steeper dip thandiffraction).
NUMERICAL MODELLING
Sierra's 3-D ray-tracing software was used to shoot a similar 3-D zero-offsetsurvey over a reef-fault block. The only difference in model design is that vertical faultsare not allowed in the Sierra software. However, the spread length is sufficiently smallfor any effect to be negligible. An example of an inline and perspective 3-D view of thereef-fault block model is shown in figure 19. By using 3-D ray tracing seismicmodelling, it is possible to confn-m theories established during physical modelling.Diffraction computation is not possible using this software, thereby confirming thezero-offset reflection origin of the reef flank anomalies imaged beneath the platform inselected inlines (Figure 20). Timeslices (Figure 21) were produced through numericalmodelling showing the areal extent of these reef-edge reflections. Timeslices below theplatform event again successfully delineate the regular margins of the basal clastic layer,thus identifying the fault.
By examination of such timeslices, it is evident that a line located away from thereef is going to contain these reef edge reflections - constituting sideswipe or out-of-plane reflections. Figure 22 illustrates this with the raypaths for crossline 15superimposed on a contour map and 3-D perspective plot. Due to sideswipe, ananomaly is present on the unmigrated seismic section . Therefore, 3-D ray-tracemodelling also shows that reefs are detected by seismic sections shot off the buildup. Insuch cases, 2-D migration may then result in the false imaging of a buildup along a linewhere none occurs.
CONCLUSIONS
In this study, a 3-D zero-offset survey shot over a reef-fault block model wascarried out using the physical modelling system at The University of Calgary.Dimensions and velocities for the model were taken from Keg River patch reefs orbioherms flanking the eastern Peace River Arch, northwest Alberta. These reefsdeveloped typically on or above prominent basement structures (Campbell, 1987).Such Precambrian relief is thought to be controlled by normal block faulting. However,the vertical and limited offset associated with such faulting makes their directidentification on 2-D seismic sections somewhat difficult. The situation may also becomplicated by pull-up or push-down effects associated with the reefal facies and off-reef sediment. Erosion of uplifted, faulted blocks produced basal clastic (Granite Wash)or fault-scarp deposits in adjacent margins. The base of such a lower-velocity basalclasfic layer can be interpreted to a certain degree on the inline sections of the 3-D zero-offset physical model survey. Nevertheless, identifying the layer directly beneath thereef still remains a problem.
Investigation of timeslices through the 3-D physical model dataset show that theareal extent of the basal clastic fault block is particularly well imaged, even beneathmost of the overlying higher velocity reef. 3-D numerical modelling of a similar reef-fault block also successfully delineated the regular margins of the basal clastic layer,
CREWESResearchReoort Volume4 (1992) 4-27

Darran J. Edwards
400DISTANCE: METERS
BOO 1200 1600VELOCITY M/SEC
1475. Ill
5000.
5500.
5600.
FIG. 19. 3-d perspective view and cross-section of input to numerical modelling
4-28 CREWES Research Report Volume 4 (1992)

3-D Modellinq of a Reef-Fault Block Structure
._l.J-lJJ-J.Jl_J_J.J.l-J.JJJ_-_J_J._JJJJlJJJlJJJJJJJIlllllllllllillll-II/11/ll/1111I.ll}/}lll///IlllI/l/I]IIllIl/IlllI/l//lllllI/IIlIl
_-II__II_II_.IIIIIIIIIII_I.IIIIIIIIIII_II_IIIIIII_III_IIIIIIIIIIIIIIIIIII_I_II_IIII__Inline 10 (fault-block)
i-lillll]llllilllITlllrll'_"iil_l_rlii_l'Hiirl/TrillliTllllillllTllll__/llllllllllllll]lllliJ_lllllllllllllllll/ll=--1_111111t__1///111_-i-II/l/ll/////lil/llllllllllllllllllllllllllllllllllllllll/l/lll/llll
__________________________________________________________________________________Inline 30 (reef and fault-block)
:-_l_il'___..III'T. l]._l_lirlllITlllrilllrrlllll_ ll__Jllllllllllllllllll
i-l_lllll{lll/tt{/////////1_l-IllIIllIIlIIlIl/IlIlllllllllllllllllllltlilllllllllllllllllllllllllllllllIllll
_-____I____I___i_Ii____iI___________I__I__I_I___I______________II_I_____i_____iI_I__Inline 70 (reef only)
__ /llllllI/I'/lI/1]]lIllllllI- II-lllll-lllIllllll,,,,,,,,,,Inline 85 (simple platform)
- note sideswipe effects
FIG. 20. Selected inlines from the numerical modelling of reef-fault block
CREWESResearch Reoort Volume4 (1992_ 4-29

Da/ran J. Edwards
CMP NUMBER10 20 3O 40 50 60 7O 8O 90 100
BO
Timeslice at 1650ms (unsealed)• note imaging of basal clastic layer
CMP NUMBER10 20 30 40 50 60 7O 80 9O 1OO
70-
60
50 +II
4Oi
30--
20-
Timeslice at 1580ms (unsealed)- note imaging of reef outline
FIG. 21. Selected timeslices from the numerical modelling
of reef-fault block model
4-30 CREWES Research Report Volume 4 (1992)

1200 ICOO
3-D perspective of ray-tracing for line Contour map of ray-tracing for line
.PROFILE ALOMO LINE NO,
I IX 1> *O X* U 33 »• -U) 4-4
1
Seismic section of crossline 15illustrating sideswipe
FIG. 22. Numerical modelling of crossline 15 illustrating sideswipe effects

Darran J. Edwards
thus identifying the approximate fault positions. It is therefore possible to infer thepresence of a fault bounded layer (basal clastics) beneath a patch reef. This hassignificant implications for real data around the Peace River Arch area in terms of thepossible tectonic development of Keg River patch reefs.
The model's secondary purpose was to uncover possible interpretation pitfallsin 2-D data and to illustrate the advantages of 3-D seismic data. 3-D ray-tracemodelling confirmed that certain anomalies identified on the physical-model verticalsections and timeslices constituted sideswipe or out-of-plane reflections. It becameapparent that lines located off-reef contained reef-edge or flank reflections. Therefore,numerical modelling shows that in dealing with 2-D data such reefs may be inferredalong lines shot away from the actual reel This may frequently result in the falseimaging of a reef on 2-D seismic sections.
ACKNOWLEDGMENTS
I am grateful for the valuable suggestions of Dr's R. James Brown and DonLawton, particularly in the early stages of this study. The generous donation of the 2-DPanny River data by Mr. Barry Korchinski of Sigma Explorations is sincerelyacknowledged. Mr. Eric Gallant is thanked for his technical assistance in the physicalmodel building. Thanks also to Kelly Hrabi for his help in 3-D processing. Finally, Iwould like to thank the sponsors of the CREWES project for their continued support.
FUTURE WORK
In continuing the study of determing whether tectonic control on carbonatemorphology is viable, a next step would be to look at both regional and local structuralelements in reefal facies areas. Lithoprobe has recently acquired deep seismic profiles(down to 22 seconds) across the Rimbey-Leduc trend of central Alberta, as part of theAlberta Basement Transect program. It is anticipated that this data, together with data tobe shot in the Peace River Arch area will be reprocessed and interpreted with thisbasement control objective in mind. Deep seismic data across the nearby Swan Hillsarea are also available for this study..
REFERENCES
Anderson, N.L., Brown, R.J., and Hinds, R.C., 1988, A seismic perspective on the Panny and TroutFields of North-Central Alberta: Can. J. Expl. Geo.,24,54-165
Campbell, C.V., 1987, Su'atigraphy and facies of the Upper Elk Point Subgroup, northern Alberta: inKrause, F.F., and Burrows, O.G. (Eds.), Devonian Lithofacies and reservoir styles in Alberta,Second Intemat. Symp. Devon. Syst., Calgary, 243-286.
Cant, DJ., 1988, Regional Structure and Development of the Peace River Arch, Alberta: A Palaeozoicfailed-rift system? Bull. Can. Petr. Geol., 36, 284-295.
Cheadle, S.P., Bertram, M.B., and Lawton, D.C., 1985, Development of a physical seismic modellingsystem, University of Calgary, In: Current Research, Part A, Geol. Surv. Can., Pt 85-1A,499-504.
Dunham, J.B., Crawford, G.A., Panasiuk, W., 1983, Sedimentology of the Slave Point Formation(Devonian) at Slave Field, Lubicon Lake, Alberta, In: Harris, P.M. (Ed.), CarbonateBuildups-A Core Workshop, No. 4, 73-111.
4-32 CREWES Research Report Volume4 (1992)

3-D Modellinq of a Reef-Fault Block Structure
Mitchell, K.I., 1987, A random walk through a Keg River carbonate shoal using 3-D seismic toexamine a typical anomaly in the Kidney/Panny area (Abstract): Can. J. Expl. Geo., 24, 89.
Mountjoy, E.W., 1980, Some questions about the devlopment of Upper Devonian carbonate buildups(reefs), Western Canada Basin: Bull. Can. Pet. Geol., 315-344.
Sikabonyi, L.A., and Rodgers, J., 1959, Palaeozoic Tectonics and Sedimentation in the northern halfof the West Canadian Basin: Jnl. Alba. Soc. Pet. Geol., 193-216.
Tankard, A.J., and Welsink, H.J., 1987, extensional tectonics and stratigraphy of Hibernia oilfield,Grand Banks, Newfoundland: A.A.P.G. Bull, 71, 1210-1232.
CREWES Research Reoort Volume 4 (1992_ 4-33