3 introduction 6 4 terminology and … · 16/7/2004 · institution of building services engineers,...
TRANSCRIPT

Consultants’ Performance Indicator Report – Contents CONTENTS PART 1 – BACKGROUND AND INTRODUCTION 1 FOREWORD 4 The case for benchmarking 4 2 ACKNOWLEDGEMENTS 5 3 INTRODUCTION 6 Construction industry KPIs 6 Hierarchy of KPIs for the construction industry 6 Further information 7 4 TERMINOLOGY AND ABBREVATIONS 8 5 BACKGROUND TO CONSULTANTS PERFORMANCE INDICATORS 9 Why benchmark? 9 Introduction 9 2001 survey and report 9 2002 survey and report 10 2003 report and report 10 6 METHODOLOGY 11 2004 Survey 11 Client survey 11 Consultants survey 12 Reliability of results 12 PART 2 – PERFORMANCE INDICATORS 7 GENERAL 13 Presentation of results 13 Indicators selected 13 8 HOW TO USE THE PERFORMANCE INDICATORS 32 Gathering data to benchmark performance 32 Measuring the consultancy benchmark score 32 Worked example 329 USING PERFORMANCE INDICATORS 34 8 When to use KPIs and APIs 34 Teamwork and transparency 34 How to implement a KPI programme 35 How to improve performance 35 Using a radar chart to show overall performance 36
2

Consultants’ Performance Indicator Report – Contents PART 3 – OTHER SURVEY RESULTS 10 COMPARISON OF RESULTS WITH PREVIOUS SURVEYS 37 General 37 Key Performance Indicators 37 Additional Performance Indicators 38 11 RESULTS BY CONSTRUCTION CONSULTANT TYPE 40 Client satisfaction 40 Negotiated commissions 42 Use of management systems 42 12 RESULTS BY TYPE OF ENGINEER 43 Comparison between types of engineer 43 13 FINANCIAL BREAKDOWN BY SIZE OF COMPANY 44 Profitability 44 Productivity 45 14 ANALYSIS OF CLIENT RETURNS 46 Type of clients surveyed 46 Type of projects surveyed 46 Procurement arrangements 47 15 ANALYSIS OF CONSULTANT RETURNS 49 Estimated internal costs of commission 49 Estimated time to complete commission 49 PART 4 – INFORMATION AND ANNEXES 16 USEFUL SOURCES OF INFORMATION 51 ANNEX 1 Consultant clients questionnaire 2004 53 ANNEX 2 Consultants questionnaire 2004 56
3

Consultants’ Performance Indicator Report – Part 1: Background and Introduction 1. FOREWORD The case for benchmarking Benchmarking, the measurement of a company’s performance against the best performers in the sector using an agreed set of indicators, has been shown to be instrumental, if not crucial, in improving performance. By measuring factors which are critical to success, companies can check where they stand against their competitors, against the best in the industry sector and against their own expectations. Measuring, comparing and benchmarking performance is not simply about filling in charts or plotting lines on a graph. It can be a decisive factor in separating the best from the rest. Those companies who can demonstrate that they are constantly checking and improving their performance are more attractive to their clients who can see that they are working in partnership with an organisation that is keen to learn and willing to improve. Such a learning culture also benefits the staff of a benchmarking company. They can see that they are working in an atmosphere of continuous improvement, which leads to better working methods and greater efficiency. Properly applied, benchmarking is an invaluable business tool for every company. Consultants in the UK enjoy a worldwide reputation for excellence. Many construction consultants across the professions have been at the forefront of innovation and change. The Association of Consulting Engineers, the Chartered Institute of Building, the Chartered Institution of Building Services Engineers, the Department of Trade and Industry, the Institution of Civil Engineers, the Royal Institute of British Architects and the Royal Institution of Chartered Surveyors have joined together in a project to develop a set of performance measures against which consultancies can benchmark their performance and set in place a program of continuous improvement . Surveys of consultants and their clients are carried out each year and the results are published in performance graphs to show the national level of construction consultant’s performance. Eight Key Performance Indicators are published on a Construction Consultants KPI Wallchart and these together with the remaining Additional Performance Indicators and some in depth analysis are published in this handbook. Like any businesses, all consultancies can be better. The project partners firmly believe that the KPIs provide the means to assess and improve your organisation in its drive for business excellence as interest in performance measurement increases over coming years.
4

Consultants’ Performance Indicator Report – Part 1: Background and Introduction 2. ACKNOWLEDGEMENTS This year’s consultant’s Key Performance Indicator project could not have been undertaken without the financial and strategic contributions of the project partners: The Association of Consulting Engineers (ACE) The Chartered Institute of Building (CIOB) The Chartered Institution of Building Services Engineers (CIBSE) The Department of Trade and Industry (DTI) The Institution of Civil Engineers (ICE) The Royal Institute of British Architects (RIBA) and The Royal Institution of Chartered Surveyors (RICS) The project partners organised the consultants survey and would like to acknowledge the assistance of the Building Cost Information Service (BCIS), the Building Services Research and Information Association (BSRIA), Constructing Excellence (CE) and the KPI Consortium who organised the client survey, analysed the consultant and client results, published the KPI Wallchart and produced this handbook. The project partners would also like to acknowledge the following individuals who gave their valuable time and support as members of the project team steering group: Martin Print – KPI Consortium Bob Packham – KPI Consortium Susan White – KPI Consortium Joe Martin – Building Cost Information Service Theresa Burrows – Building Cost Information Service Gerry Samuelsson-Brown – Building Services Research and Information Association Robert Osborne – Association of Consulting Engineers Ian Norris – Chartered Institute of Building Richard Howard – Chartered Institution of Building Services Engineers Peter Fry – Institution of Civil Engineers Adam Williamson – Royal Institute of British Architects Emma Howlett – Royal Institution of Chartered Surveyors The project partners, in response to requests by KPI users, have set up a Consultants KPI Review Group. The findings of the review group will be manifested in the 2005 Consultants KPIs and consequently the 2004 Consultants KPI Wallchart and Handbook are merely an update of those published in 2003. The project partners would like to acknowledge the support given by those individuals volunteering to sit on the review group.
5

Consultants’ Performance Indicator Report – Part 1: Background and Introduction 3. INTRODUCTION In 2000, following the publication of the first Construction Industry KPIs, which were felt not to be wholly relevant to them, the Association of Consulting Engineers joined forces with the Royal Institute of British Architects and the Royal Institution of Chartered Surveyors in a project to collect data from members of each organisation to produce a set of KPIs specifically for the consultancy sector. The project secured endorsement and financial support from UK government and the Institution of Civil Engineers. In 2004, the Chartered Institute of Building and the Chartered Institution of Building Services Engineers lent their support by becoming project partners. Construction Industry KPIs Since their first publication in 1999, the Construction Industry KPIs have become a standard method of measuring and benchmarking performance. Clients and their suppliers have used them to analyse and benchmark performance and set targets for improvement. All sectors in the industry have demonstrated that by linking their KPIs to modern methods of partnership and working with their suppliers they can achieve significant performance gains - to the advantage of themselves and the supply-chain on whom they depend. For instance, they have been used to show that the construction techniques used in the demonstration projects promoted by Constructing Excellence provide a superior set of results to that of the rest of the industry. Following the success of these first Construction Industry KPIs, specialised sectors of the construction industry have started to develop performance measures that are specific to their sector. These include M&E contractors, the construction products industry and three years ago, construction consultants. In addition industry-wide KPIs have been developed for Respect for People and for the, Environment. Hierarchy of KPIs for the construction industry A hierarchy of KPIs for the construction Industry has thus been developed with the general theme of sustainability. The Construction Industry KPIs form the economic strand, the Respect for People KPIs form the social strand and the Environment KPIs form the environmental strand. Beneath these are the sector KPIs - consultants, M&E contractors and construction products. Finally there are sector toolkits, and clubs for housing, local authorities, highways and Respect for People. On the following page is a chart showing how they are all linked together.
6
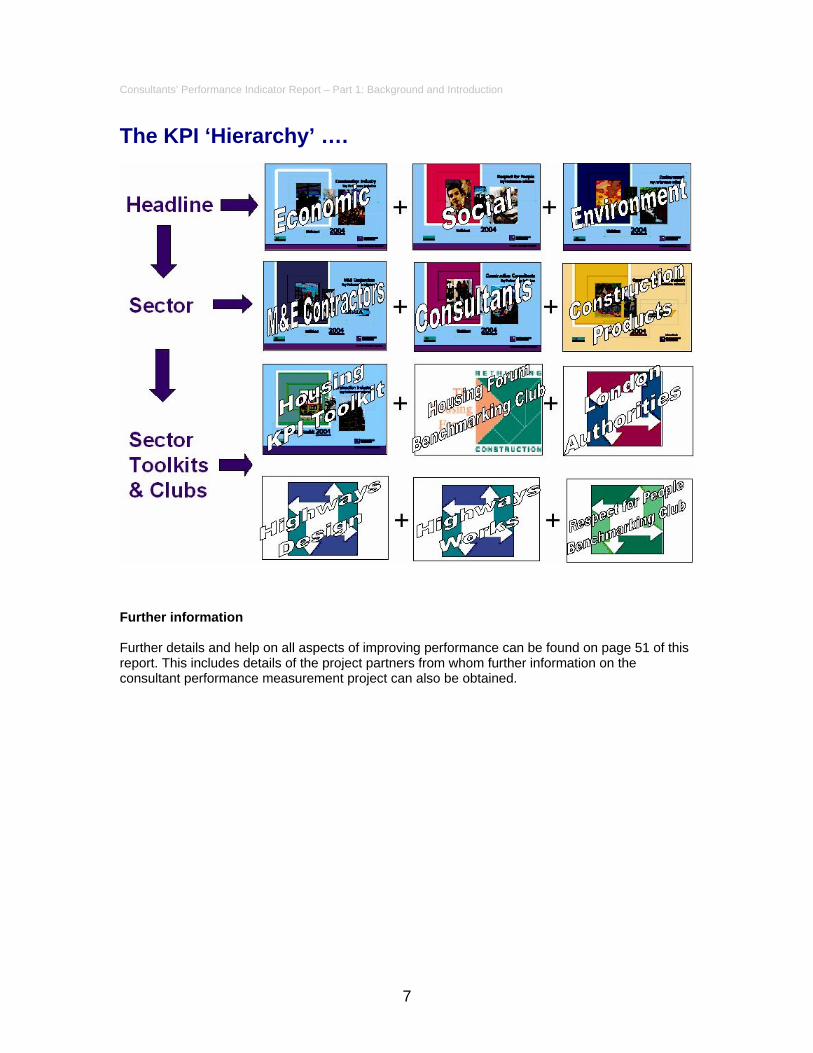
Consultants’ Performance Indicator Report – Part 1: Background and Introduction The KPI ‘Hierarchy’ ….
Further information Further details and help on all aspects of improving performance can be found on page 51 of this report. This includes details of the project partners from whom further information on the consultant performance measurement project can also be obtained.
7

Consultants’ Performance Indicator Report – Part 1: Background and Introduction 4. TERMINOLOGY AND ABBREVIATIONS Key Performance Indicator (KPI) A measure of a factor that is critical to success Additional Performance Indicator (API) A measure of a factor that is useful (but not
critical) to success Benchmark The best performance achieved in practice Benchmarking Comparing your performance to the best, and
then taking action to improve Full-Time Equivalent (FTE) The number of people employed in a company
adjusted to allow for those that work part time. For example, two employees each working half a day a week equal one full-time equivalent
CE Constructing Excellence DETR Department of the Environment, Transport and
the Regions
DTI Department of Trade and Industry
8

Consultants’ Performance Indicator Report – Part 1: Background and Introduction 5. BACKGROUND TO CONSULTANTS PERFORMANCE INDICATORS Why benchmark? The benefits of benchmarking are numerous. Leading businesses regularly compare products, services and business processes against the best from within or outside their industry, discovering and applying best practice from a range of sources. By measuring performance on a variety of business activities and focusing on the improvement of those considered to be the most critical to success, organisations can use benchmarking to increase client satisfaction and improve the delivery of their products and services. Introduction While informal benchmarking clubs have existed for some time, there has been no standard set of indicators for consultants. The Construction Industry KPIs, which were first published in 1999, addressed the performance of the projects on which consultants worked. However, they did not address the performance of consultants as individual companies. The project partners felt that there were additional matters of their performance as companies that could usefully be measured. Responding to this situation, the project partners, ACE, RIBA, RICS, ICE and DTI (previously DETR) joined forces to develop a set of performance indicators specifically relevant to consultants companies. A steering group was established in 2000 to develop a survey, oversee the collection of data, and develop performance indicators appropriate to construction consultants. This initial steering group comprised of construction consultants from all the project partners. 2001 survey and report Under the guidance of the steering group, two sets of indicators were identified, Key Performance Indicators (KPIs) which focus on the headline issues and Additional Performance Indicators (APIs). These were divided into those based on client satisfaction and those that are unique to the company itself. A survey of a representative sample of members of ACE, RIBA and RICS was carried out. Each survey requested data on the firm, details of specific projects (each firm was asked for information on three projects) and feedback from clients, rating the consultant on a 1-10 scale across a range of client-specific issues. A report was produced in June 2001, Striving for Business Excellence, which presented the results of the first survey of the project. The report also demonstrated how to use the indicators and suggested actions that needed to be taken to improve performance The response rates varied across the three groups of participants and although small, the sample was checked and found to be representative of the consultancy sector. The Steering Group therefore agreed to publish the results with the aim of increasing both the sample size and range of KPIs in future years. Additional data was provided by DTI from surveys carried out for the Construction Industry KPIs.
9

Consultants’ Performance Indicator Report – Part 1: Background and Introduction 2002 survey and report The 2002 survey was organised by a smaller steering group, comprising the project partners, on the basis that the survey questions had not changed drastically and that further input was not therefore required. The industry partners distributed approximately 5,000 questionnaires and the response rate was considerably better than that achieved in 2001, when there were a total of 82 replies. The 2002 survey produced 181 results (architectural practices increased their response from 31 to 61, engineering practices 27 to 74 and surveying practices 24 to 46). During the early deliberations of the steering group, it was felt that the results in the 2001 survey for customer satisfaction might contain some subjective opinion as the results were completed by the consultants’ perception of their client’s satisfaction. Accordingly in 2002 a completely independent survey of client satisfaction with consultants was carried out by BSRIA. In excess of 4,000 construction clients were surveyed. There were 301 replies (100 from those who employed an architect, 108 who had employed an engineer and 93 a surveyor). All the consultants’ clients were asked the same questions as the consultants themselves and therefore it is possible to correlate the answers for comparison with the previous year. A report was produced in June 2002, Achieving Business Excellence, which provided details of the methodology used and all the results. As in the past, a wallchart was also produced which gave the results of the Key Performance Indicators for Consultants. In both the wallchart and the report, the results were presented as a series of graphs from which it is easy for a company to benchmark its performance against others. For instance, if an organisation has a benchmark score of 75%, it means that 75% of consultants have a performance that is equal, or worse, than that organisation, and 25% have a better performance in the area being measured. 2003 survey and report The 2003 survey was organised in the same way as the 2002 survey distributing a similar number of client questionnaires. The industry partners distributed approximately 5,000 consultant questionnaires which produced 135 results (architectural practices 36, engineering practices 77 and surveying practices 22). This was disappointingly less than the 181 results in 2002. BSRIA distributed in excess of 4,000 construction clients’ questionnaires which produced 373 results (119 from those who employed an architect, 152 who had employed an engineer and 102 who had employed a surveyor). This was a welcome improvement on the 301 results in 2002 As both questionnaires were unchanged from 2002, it was possible to correlate the answers for comparison with the previous year. A report was produced in June 2003, Performance Indicators for Construction Consultants, which provided details of the methodology used, all the results and analysis. As in the past, a KPI wallchart was also produced which gave the results of the Key Performance Indicators for Consultants.
10

Consultants’ Performance Indicator Report – Part 1: Background and Introduction 6. METHODOLOGY 2004 survey The 2004 survey was organised in the same way as the 2003 survey distributing a similar number of client questionnaires but increasing the number of consultant questionnaires to include the members of the new industry partners (CIOB and CIBSE). Client survey The survey of construction consultants’ clients was organised on the partners’ behalf by BSRIA who sent out in excess of 4,000 survey forms to clients of construction consultants. For a copy of this questionnaire see Annex 1 on page 53. The response rate was about the same as last year.
Architects Engineers Surveyors TOTAL 2002 100 108 93 301 2003 119 152 102 373 2004 110 157 109 376
Number of client responses
0
50
100
150
200
250
300
350
400
Architects Engineers Surveyors TOTAL
Num
ber
2002 2003 2004
Of the engineers who responded, 23% were civil engineers, 41% structural engineers and 36% building services engineers.
11

Consultants’ Performance Indicator Report – Part 1: Background and Introduction Consultants’ survey The consultants’ survey was organised by the industry partners, who between them distributed approximately 8,000 questionnaires. For a copy of this questionnaire see Annex 2 on page 56. The response rate was a significant improvement due largely to the additional questionnaires sent out to project partners from CIOB and CIBSE.
Architects Engineers Surveyors TOTAL 2001 31 27 24 82 2002 61 74 46 181 2003 36 77 22 135 2004 87 46 77 210
Number of consultant responses
0
20
40
60
80
100
120
140
160
180
200
220
240
Architects Engineers Surveyors TOTAL
Num
ber
2001 2002 2003 2004
Reliability of the results This is the fourth year of consultant KPI data and although sample sizes used to compile the graphs are still relatively small, they are considered to be representative of the consultancy sector as a whole. However, the results should be used with caution and as an aid, not as a substitute for professional judgement.
12

Consultants’ Performance Indicator Report – Part 2: Performance Indicators 7. PERFORMANCE INDICATORS Presentation of the results As before, the results are presented as series of graphs from which it is easy for a company to benchmark its performance against others. For instance, a benchmark score of 75% means that 75% of consultants in the sector have a performance in the area being measured that is equal, or worse, than the consultant and 25% are performing better. Indicators selected Two sets of indicators were identified as being of importance to consultants. The first were those which relate to the client’s satisfaction with the consultant’s performance in a number of areas (Client Satisfaction Indicators). Others relate to the performance of the company or project itself (Company Indicators). Within each set there are two types of indicator:-
Key Performance Indicators (KPIs) – a measure of a factor that is critical to success
Additional Performance Indicators (APIs) – a measure of a factor that is useful but not critical to success
The full definitions of each of the indicators are given with each graph. All Client Satisfaction indicators have a common objective and measurement scale as follows:- Objective: All the Client Satisfaction KPIs and APIs are to determine the overall level of client satisfaction with the commissioned consultant in the various activities. Measurement scale: All the Client Satisfaction KPIs and APIs use a client rating scale of 1-10 where:
1 = Totally Dissatisfied. 5/6 = Neither Satisfied nor Dissatisfied. 10 = Totally Satisfied.
13

Consultants’ Performance Indicator Report – Part 2: Performance Indicators Client Satisfaction – Overall Performance KPI Definition: How satisfied the client was with the consultant’s overall performance on completed commissions.
Client Satisfaction - Overall Performance
1
2
3
4
5
6
7
8
9
10
0% 10% 20% 30% 40% 50% 60% 70% 80% 90% 100%
Benchmark Score
Clie
nt R
atin
g
Method: On completion of each commission, carry out a survey with the client to determine how satisfied they were with the consultant’s overall performance on the completed commission, using the 1-10 scale. From the Client Satisfaction - Overall Performance graph, measure the benchmark score. Example: On completion of a commission, the client rated overall performance of the consultant at 9 out of 10. Using the above graph, a client rating of 9 out of 10 equates to a benchmark score of 93%. This indicates that 93% of consultants have a performance that is equal or lower and 7% have a performance that is higher than the example consultancy.
14
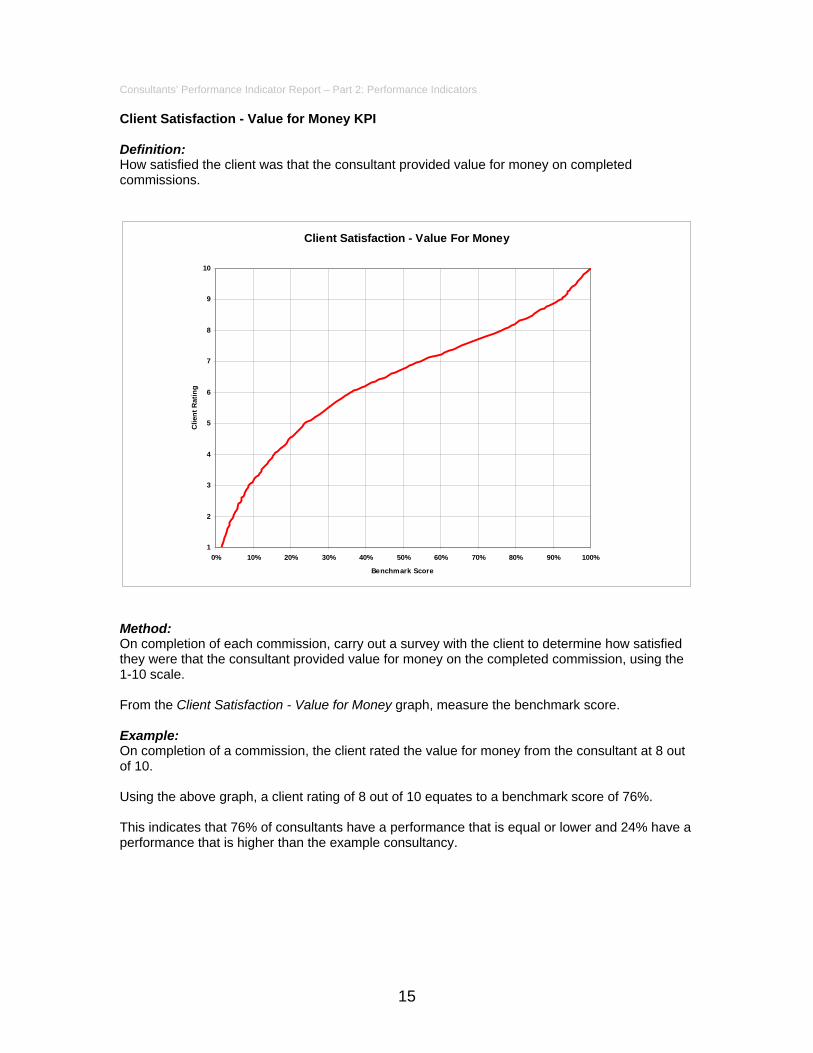
Consultants’ Performance Indicator Report – Part 2: Performance Indicators Client Satisfaction - Value for Money KPI Definition: How satisfied the client was that the consultant provided value for money on completed commissions.
Client Satisfaction - Value For Money
1
2
3
4
5
6
7
8
9
10
0% 10% 20% 30% 40% 50% 60% 70% 80% 90% 100%
Benchmark Score
Clie
nt R
atin
g
Method: On completion of each commission, carry out a survey with the client to determine how satisfied they were that the consultant provided value for money on the completed commission, using the 1-10 scale. From the Client Satisfaction - Value for Money graph, measure the benchmark score. Example: On completion of a commission, the client rated the value for money from the consultant at 8 out of 10. Using the above graph, a client rating of 8 out of 10 equates to a benchmark score of 76%. This indicates that 76% of consultants have a performance that is equal or lower and 24% have a performance that is higher than the example consultancy.
15

Consultants’ Performance Indicator Report – Part 2: Performance Indicators Client Satisfaction – Quality of Service KPI Definition: How satisfied the client was that the consultant provided a quality service on completed commissions.
Client Satisfaction - Quality of Service
1
2
3
4
5
6
7
8
9
10
0% 10% 20% 30% 40% 50% 60% 70% 80% 90% 100%
Benchmark Score
Clie
nt R
atin
g
Method: On completion of each commission, carry out a survey with the client to determine how satisfied they were that the consultant provided a quality service on the completed commission, using a 1-10 scale. From the Client Satisfaction - Quality of Service graph, measure the benchmark score. Example: On completion of a commission, the client rated the quality of service by the consultant at 9 out of 10. Using the above graph, a client rating of 9 out of 10 equates to a benchmark score of 94%. This indicates that 94% of consultants have a performance that is equal or lower and 6% have a performance that is higher than the example consultancy.
16

Consultants’ Performance Indicator Report – Part 2: Performance Indicators Client Satisfaction - Timely Delivery KPI Definition: How satisfied the client was that the consultant provided a timely delivery of the service on completed commissions.
Client Satisfaction - Timely Delivery
1
2
3
4
5
6
7
8
9
10
0% 10% 20% 30% 40% 50% 60% 70% 80% 90% 100%
Benchmark Score
Clie
nt R
atin
g
Method: On completion of each commission, carry out a survey with the client to determine how satisfied they were that the consultant provided a timely delivery on the completed commission, using a 1-10 scale. From the Client Satisfaction – Timely Delivery graph, measure the benchmark score. Example: On completion of a commission, the client rated timely delivery by the consultant at 9 out of 10 Using the above graph, a client rating of 9 out of 10 equates to a benchmark score of 93%. This indicates that 93% of consultants have a performance that is equal or lower and 7% have a performance that is higher than the example consultancy.
17
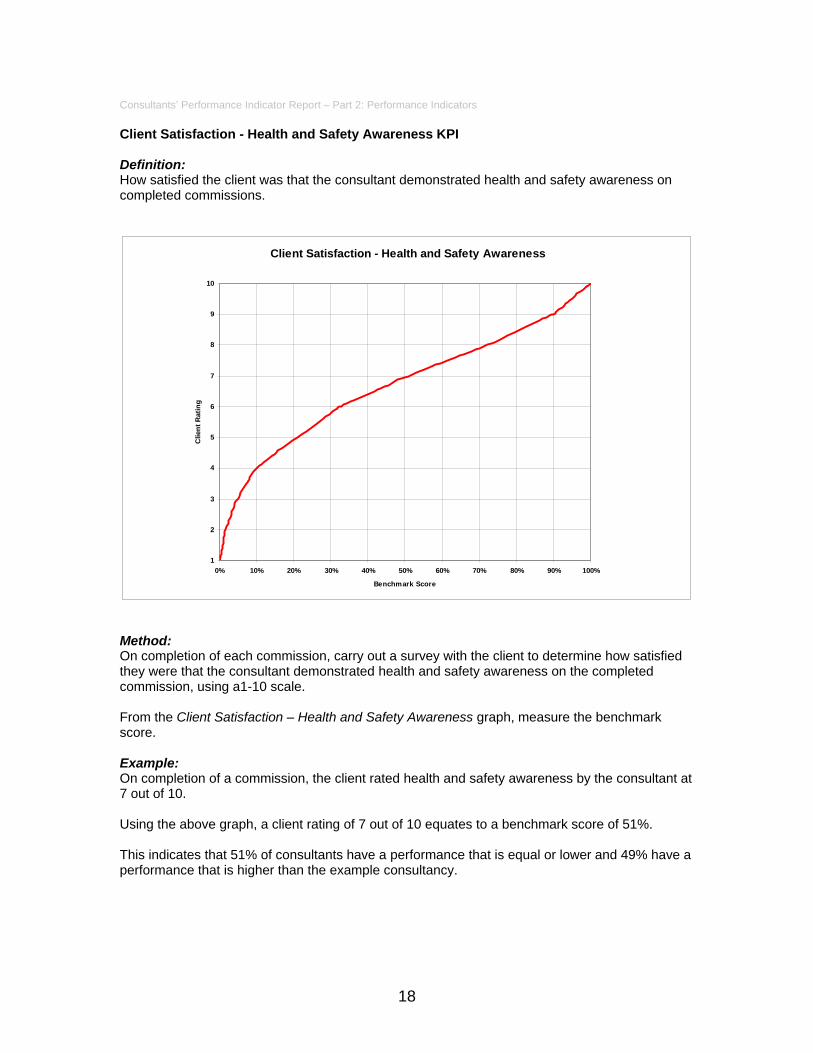
Consultants’ Performance Indicator Report – Part 2: Performance Indicators Client Satisfaction - Health and Safety Awareness KPI Definition: How satisfied the client was that the consultant demonstrated health and safety awareness on completed commissions.
Client Satisfaction - Health and Safety Awareness
1
2
3
4
5
6
7
8
9
10
0% 10% 20% 30% 40% 50% 60% 70% 80% 90% 100%
Benchmark Score
Clie
nt R
atin
g
Method: On completion of each commission, carry out a survey with the client to determine how satisfied they were that the consultant demonstrated health and safety awareness on the completed commission, using a1-10 scale. From the Client Satisfaction – Health and Safety Awareness graph, measure the benchmark score. Example: On completion of a commission, the client rated health and safety awareness by the consultant at 7 out of 10. Using the above graph, a client rating of 7 out of 10 equates to a benchmark score of 51%. This indicates that 51% of consultants have a performance that is equal or lower and 49% have a performance that is higher than the example consultancy.
18

Consultants’ Performance Indicator Report – Part 2: Performance Indicators Client Satisfaction – Ability to Innovate API Definition: How satisfied the client was with the consultant’s ability to innovate when carrying out the service.
Client Satisfaction - Ability to Innovate
1
2
3
4
5
6
7
8
9
10
0% 10% 20% 30% 40% 50% 60% 70% 80% 90% 100%
Benchmark Score
Clie
nt R
atin
g
Method: On completion of each commission, carry out a survey with the client to determine how satisfied they were with the consultant’s use of ability to innovate when carrying out the service, using a 1-10 scale. From the Client Satisfaction – Ability to Innovate graph, measure the benchmark score. Example: On completion of a commission, the client rated the ability to innovate of the consultant at 7 out of 10. Using the above graph, a client rating of 7 out of 10 equates to a benchmark score of 60%. This indicates that 60% of consultants have a performance that is equal or lower and 40% have a performance that is higher than the example consultancy.
19

Consultants’ Performance Indicator Report – Part 2: Performance Indicators Client Satisfaction - Understanding Client Needs API Definition: How satisfied the client was that the consultant fully understood their needs when carrying out the service.
Client Satisfaction - Understand Client Needs
1
2
3
4
5
6
7
8
9
10
0% 10% 20% 30% 40% 50% 60% 70% 80% 90% 100%
Benchmark Score
Clie
nt R
atin
g
Method: On completion of each commission, carry out a survey with the client to determine how satisfied the client was that the consultant fully understood their needs when carrying out the service, using a 1-10 scale. From the Client Satisfaction – Understanding Client Needs graph, measure the benchmark score. Example: On completion of a commission, the client rated the understanding of their needs by the consultant at 8 out of 10. Using the above graph, a client rating of 8 out of 10 equates to a benchmark score of 73%. This indicates that 73% of consultants have a performance that is equal or lower and 27% have a performance that is higher than the example consultancy.
20

Consultants’ Performance Indicator Report – Part 2: Performance Indicators Client Satisfaction – Problem Solving API * Definition: How satisfied the client was that the consultant was able to identify and solve problems during the carrying out of the service.
Client Satisfaction - Problem Solving
1
2
3
4
5
6
7
8
9
10
0% 10% 20% 30% 40% 50% 60% 70% 80% 90% 100%
Benchmark Score
Clie
nt R
atin
g
Method: On completion of each commission, carry out a survey with the client to determine how satisfied the client was that the consultant was able to identify and solve problems during the carrying out of the service, using a 1-10 scale. From the Client Satisfaction – Problem Solving API graph, measure the benchmark score. Example: On completion of a commission, the client rated the ability to identify and solve problems by the consultant at 8 out of 10. Using the above graph, a client rating of 8 out of 10 equates to a benchmark score of 75%. This indicates that 75% of consultants have a performance that is equal or lower and 25% have a performance that is higher than the example consultancy. * It should be noted that in the 2002 survey, this API was called Client Satisfaction -Identification of Problems. This was felt to be somewhat ambiguous, as a satisfactory measure of the identification of problems may not indicate how well the problem was resolved. Accordingly the indicator has been changed to Client Satisfaction - Problem Solving, which was felt to be a better indicator of the performance of the consultant.
21

Consultants’ Performance Indicator Report – Part 2: Performance Indicators Client Satisfaction - Whole Life Performance API Definition: How satisfied the client was that whole-life performance issues had been taken into account by the consultant in the finished product.
Client Satisfaction - Whole Life Performance
1
2
3
4
5
6
7
8
9
10
0% 10% 20% 30% 40% 50% 60% 70% 80% 90% 100%
Benchmark Score
Clie
nt R
atin
g
Method: On completion of each commission, carry out a survey with the client to determine how satisfied the client was that whole-life performance issues had been taken into account by the consultant in the finished product, using a 1-10 scale. From the Client Satisfaction – Whole Life Performance API graph, measure the benchmark score. Example: On completion of a commission, the client rated the consideration of whole life performance by the consultant at 8 out of 10. Using the above graph, a client rating of 8 out of 10 equates to a benchmark score of 91%. This indicates that 91% of consultants have a performance that is equal or lower and 9% have a performance that is higher than the example consultancy.
22
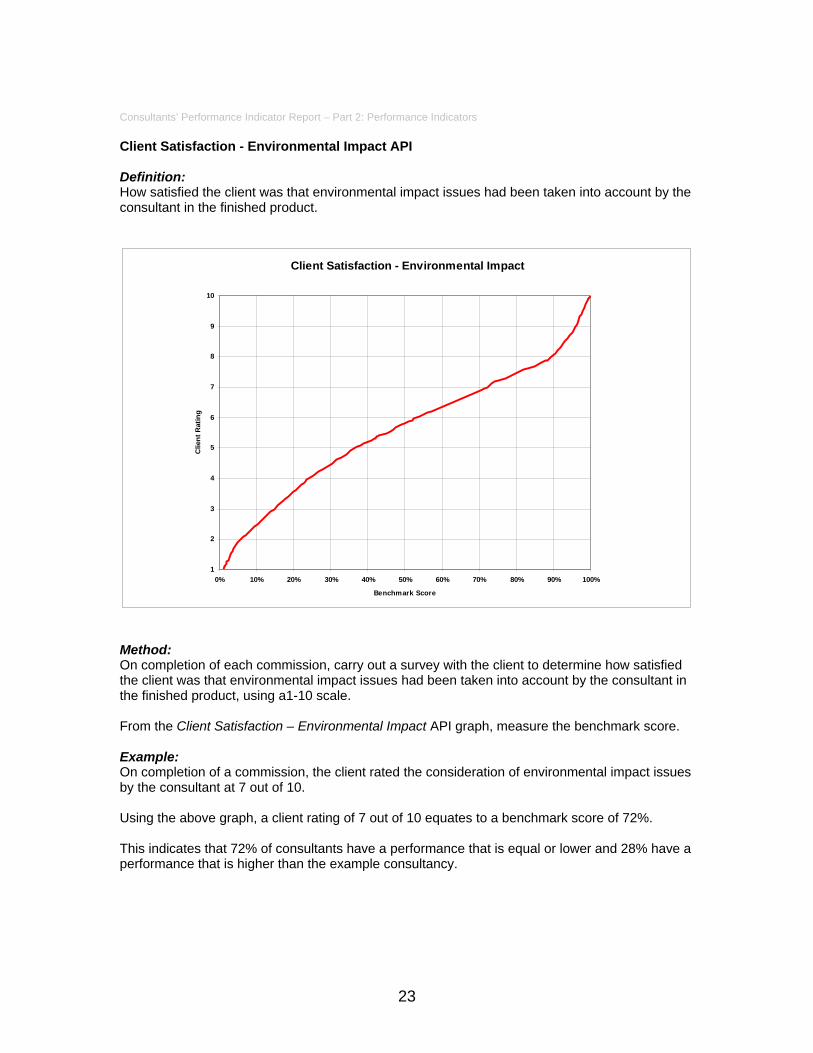
Consultants’ Performance Indicator Report – Part 2: Performance Indicators Client Satisfaction - Environmental Impact API Definition: How satisfied the client was that environmental impact issues had been taken into account by the consultant in the finished product.
Client Satisfaction - Environmental Impact
1
2
3
4
5
6
7
8
9
10
0% 10% 20% 30% 40% 50% 60% 70% 80% 90% 100%
Benchmark Score
Clie
nt R
atin
g
Method: On completion of each commission, carry out a survey with the client to determine how satisfied the client was that environmental impact issues had been taken into account by the consultant in the finished product, using a1-10 scale. From the Client Satisfaction – Environmental Impact API graph, measure the benchmark score. Example: On completion of a commission, the client rated the consideration of environmental impact issues by the consultant at 7 out of 10. Using the above graph, a client rating of 7 out of 10 equates to a benchmark score of 72%. This indicates that 72% of consultants have a performance that is equal or lower and 28% have a performance that is higher than the example consultancy.
23

Consultants’ Performance Indicator Report – Part 2: Performance Indicators Company Indicator - Training KPI Objective: To measure the total number of days of training provided per UK full-time equivalent (FTE) employee within the consultancy. Definition: The number of days of training per employee expressed as full-time equivalent employees (includes all UK employees, partners and directors).
Consultants - Training
0
1
2
3
4
5
6
7
8
9
10
0% 10% 20% 30% 40% 50% 60% 70% 80% 90% 100%Benchmark Score
Trai
ning
Day
s pe
r FTE
Method: Take the total number of days in the year spent on training, and divide by the number of UK FTE employees (including all UK staff partners and directors). From the Training KPI graph, measure the benchmark score. Example: Number of days spent on training - 240 Number of FTE staff - 80 Training Days per FTE = 240 ÷ 80 Number of days spent on training/Number of FTE staff = 3.0 Days Using the above graph, 3.0 days equates to a benchmark score of 49%. This indicates that 49% of consultants have a performance that is equal or lower and 51% have a performance that is higher than the example consultancy.
24
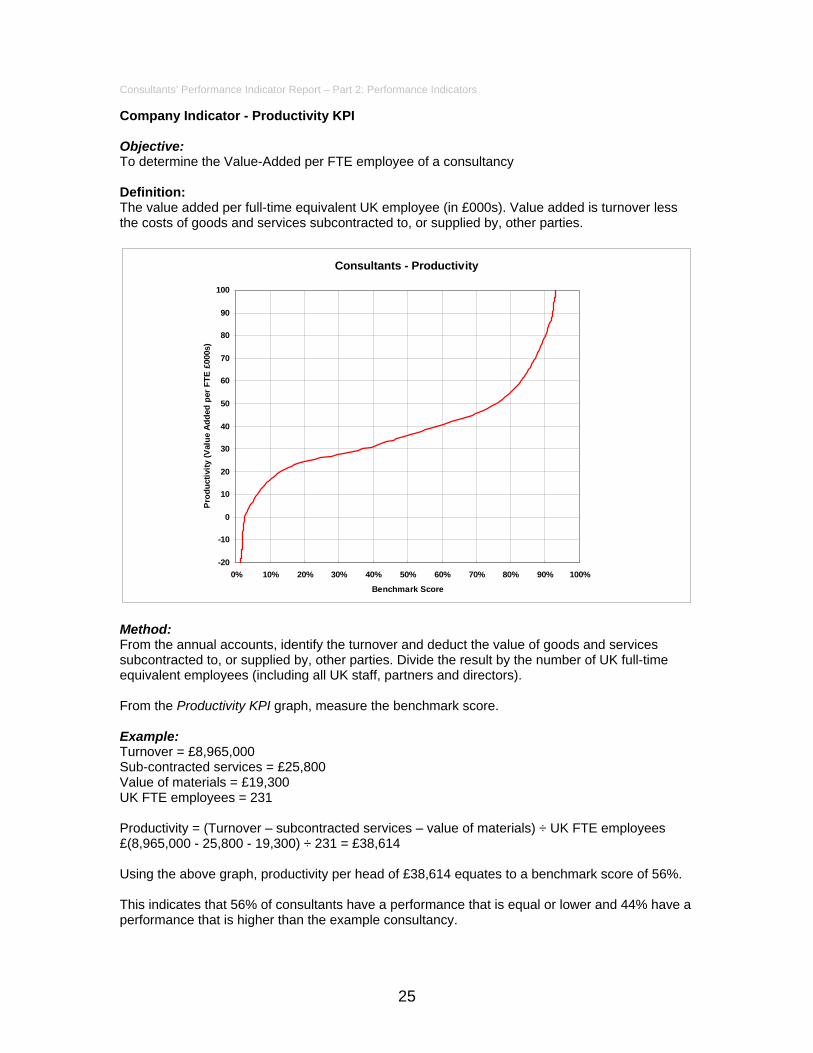
Consultants’ Performance Indicator Report – Part 2: Performance Indicators Company Indicator - Productivity KPI Objective: To determine the Value-Added per FTE employee of a consultancy Definition: The value added per full-time equivalent UK employee (in £000s). Value added is turnover less the costs of goods and services subcontracted to, or supplied by, other parties.
Consultants - Productivity
-20
-10
0
10
20
30
40
50
60
70
80
90
100
0% 10% 20% 30% 40% 50% 60% 70% 80% 90% 100%
Benchmark Score
Prod
uctiv
ity (V
alue
Add
ed p
er F
TE £
000s
)
Method: From the annual accounts, identify the turnover and deduct the value of goods and services subcontracted to, or supplied by, other parties. Divide the result by the number of UK full-time equivalent employees (including all UK staff, partners and directors). From the Productivity KPI graph, measure the benchmark score. Example: Turnover = £8,965,000 Sub-contracted services = £25,800 Value of materials = £19,300 UK FTE employees = 231 Productivity = (Turnover – subcontracted services – value of materials) ÷ UK FTE employees £(8,965,000 - 25,800 - 19,300) ÷ 231 = £38,614 Using the above graph, productivity per head of £38,614 equates to a benchmark score of 56%. This indicates that 56% of consultants have a performance that is equal or lower and 44% have a performance that is higher than the example consultancy.
25

Consultants’ Performance Indicator Report – Part 2: Performance Indicators Company Indicator - Profitability KPI Objective: To measure the profitability of a consultancy before tax and interest. Definition: The profit before tax and interest as a percentage of sales (or turnover).
Consultants - Profitability
-20%
-10%
0%
10%
20%
30%
40%
50%
60%
0% 10% 20% 30% 40% 50% 60% 70% 80% 90% 100%
Benchmark Score
Prof
itabi
lity
(Bef
ore
Tax
and
Inte
rest
)
Method: Take the value of profit before tax and interest published in the annual accounts and express it as a percentage of the value of turnover. From the Profitability graph, measure the benchmark score. Example: Turnover = £8,965,000 Profit before interest and tax = £1,165,450 Profitability (%) = Profit before interest and tax x 100 ÷ Turnover £1,165,450 x 100 ÷ £8,965,000 = 13% Using the above graph, a profitability of 13% equates to a benchmark score of 54%. This indicates that 54% of consultants have a performance that is equal or lower and 46% have a performance that is higher than the example consultancy.
26

Consultants’ Performance Indicator Report – Part 2: Performance Indicators Company Indicator - Successful Fees Proposals API Objective: To determine the level of successful fee proposals made by a consultant during the last 12 month period. Definition: The total number of commissions gained in the last 12 months, expressed as a percentage of fee proposals made in the same period.
Consultants - Successful Fee Proposals
0%
10%
20%
30%
40%
50%
60%
70%
80%
90%
100%
0% 10% 20% 30% 40% 50% 60% 70% 80% 90% 100%
Benchmark Score
erce
ntag
e of
Suc
cess
ful F
ee P
prop
osal
s
Method: Identify the number of commissions won during the period and express them as a percentage of fee proposals for which a definitive answer, either yes or no, has been received during the same period. From the API Successful Proposals graph, measure the benchmark score. Example: Number of commissions decided = 43 Number of commissions won = 26. Successful fee proposals (%) = Number of commissions won x 100 ÷ number of commissions decided 26 x 100 ÷ 43 X 100 = 61% Using the above graph, a performance of 61% equates to a benchmark score of 46%. This indicates that 46% of consultants have a performance that is equal or lower and 54% have a performance that is higher than the example consultancy.
27
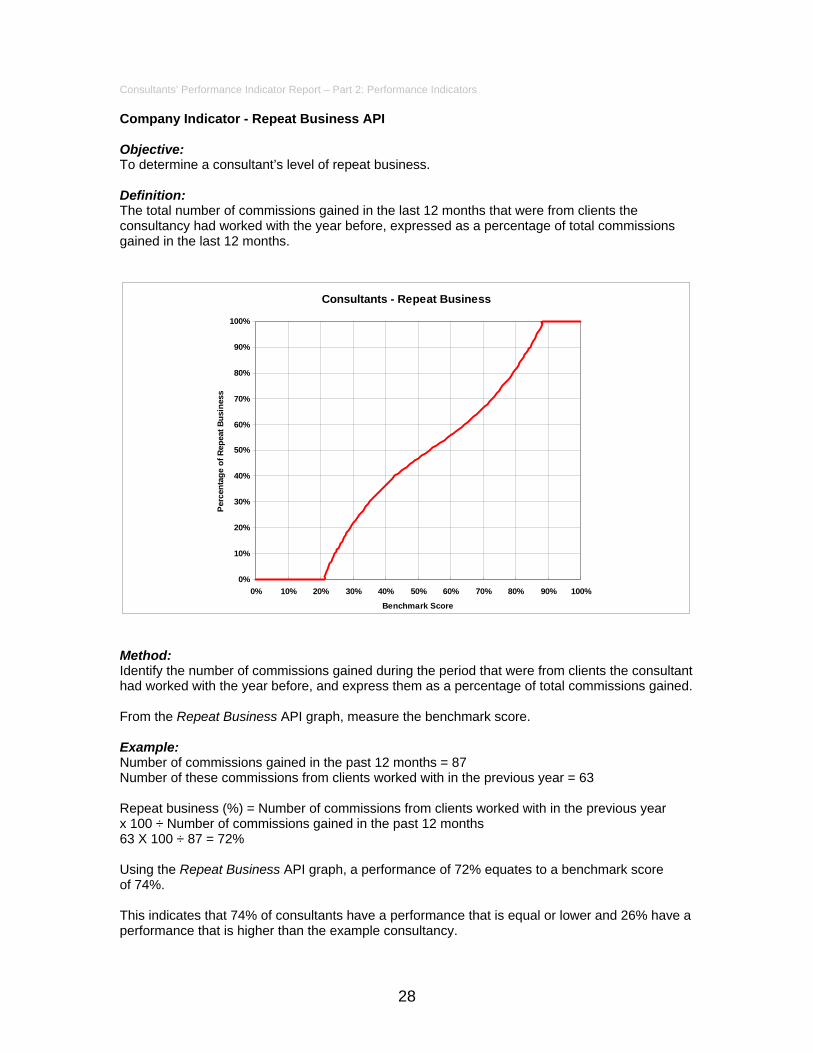
Consultants’ Performance Indicator Report – Part 2: Performance Indicators Company Indicator - Repeat Business API Objective: To determine a consultant’s level of repeat business. Definition: The total number of commissions gained in the last 12 months that were from clients the consultancy had worked with the year before, expressed as a percentage of total commissions gained in the last 12 months.
Consultants - Repeat Business
0%
10%
20%
30%
40%
50%
60%
70%
80%
90%
100%
0% 10% 20% 30% 40% 50% 60% 70% 80% 90% 100%
Benchmark Score
Perc
enta
ge o
f Rep
eat B
usin
ess
Method: Identify the number of commissions gained during the period that were from clients the consultant had worked with the year before, and express them as a percentage of total commissions gained. From the Repeat Business API graph, measure the benchmark score. Example: Number of commissions gained in the past 12 months = 87 Number of these commissions from clients worked with in the previous year = 63 Repeat business (%) = Number of commissions from clients worked with in the previous year x 100 ÷ Number of commissions gained in the past 12 months 63 X 100 ÷ 87 = 72% Using the Repeat Business API graph, a performance of 72% equates to a benchmark score of 74%. This indicates that 74% of consultants have a performance that is equal or lower and 26% have a performance that is higher than the example consultancy.
28

Consultants’ Performance Indicator Report – Part 2: Performance Indicators Company Indicator - Performance Measurement Systems API Objective: To determine a consultant’s use of performance measurement systems Definition: The amount of use made of measurement systems implemented to improve overall performance. These systems will include the measurement of client satisfaction, productivity, financial management, training and development and investment in R&D.
Performance Measurement Systems
1
2
3
4
5
6
7
8
9
10
0% 10% 20% 30% 40% 50% 60% 70% 80% 90% 100%
Benchmark Score
Con
sulta
nt R
atin
g
Method: Identify the number of different measurement systems being used to monitor performance. These could include having a system to measure client satisfaction, productivity, financial management, training and development and investment in R & D, using a 1-10 scale, where 1 equates to having none and 10 to where all systems are in place and actively used. From the Performance Measurement System API graph, measure the benchmark score. Example: The total number of measurement systems in place was found to be 2 with two others in various stages of implementation. The rating was felt therefore to be 7. Using the Performance Measurement System API graph, a rating of 7 out of 10 equates to a benchmark score of 68%. This indicates that 68% of consultants have a performance that is equal or lower and 32% have a performance that is higher than the example consultancy.
29

Consultants’ Performance Indicator Report – Part 2: Performance Indicators Company Indicator - Risk Management Systems API Objective: To determine a consultant’s use of risk management systems Definition: The amount of use made of risk management audits and systems to identify and manage risk in all projects and commissions.
Consultants - Risk Management Systems
1
2
3
4
5
6
7
8
9
10
0% 10% 20% 30% 40% 50% 60% 70% 80% 90% 100%
Benchmark Score
Con
sulta
nt R
atin
g
Method: Identify the attitude taken to dealing with risk and the implementation of a risk management system, using a 1-10 scale, where 1 equates to having none and 10 to having a risk management system implemented in all projects. From the Risk Management System API graph, measure the benchmark score. Example: Risk audits are carried out occasionally and a risk management system is being developed for some projects. The rating was felt therefore to be 7. Using the Risk Management System graph, a rating of 7 out of 10 equates to a benchmark score of 61%. This indicates that 61% of consultants have a performance that is equal or lower and 39% have a performance that is higher than the example consultancy.
30
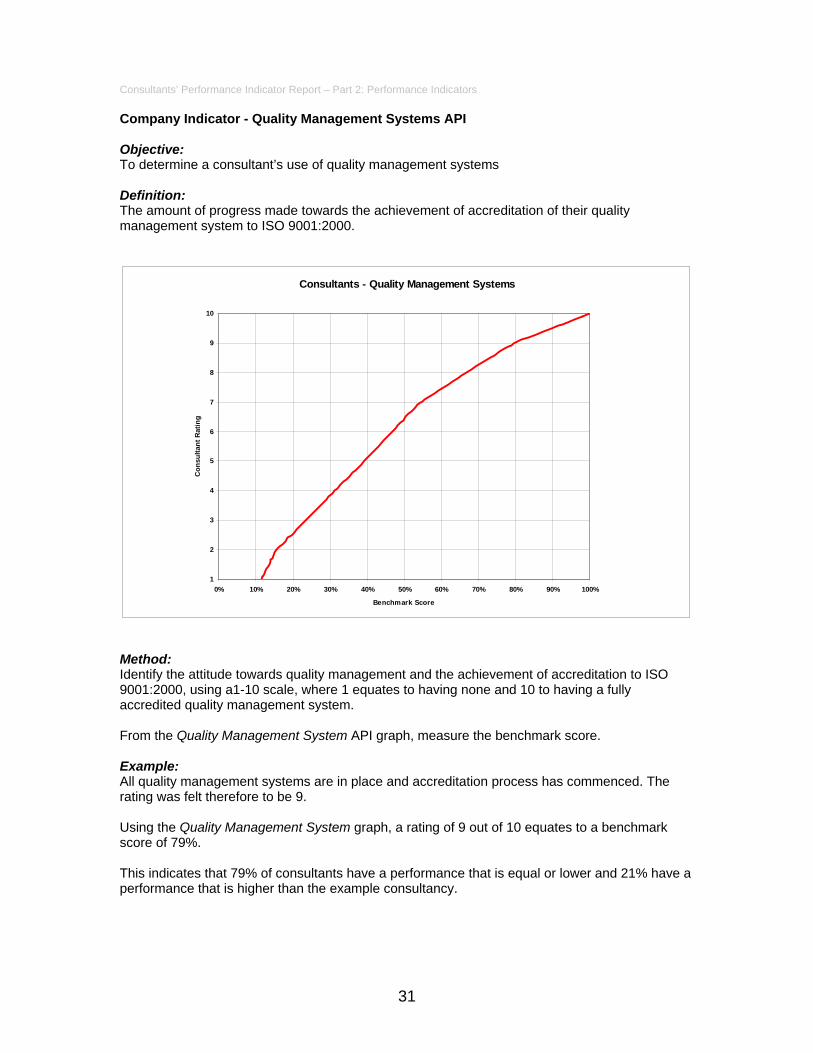
Consultants’ Performance Indicator Report – Part 2: Performance Indicators Company Indicator - Quality Management Systems API Objective: To determine a consultant’s use of quality management systems Definition: The amount of progress made towards the achievement of accreditation of their quality management system to ISO 9001:2000.
Consultants - Quality Management Systems
1
2
3
4
5
6
7
8
9
10
0% 10% 20% 30% 40% 50% 60% 70% 80% 90% 100%
Benchmark Score
Con
sulta
nt R
atin
g
Method: Identify the attitude towards quality management and the achievement of accreditation to ISO 9001:2000, using a1-10 scale, where 1 equates to having none and 10 to having a fully accredited quality management system. From the Quality Management System API graph, measure the benchmark score. Example: All quality management systems are in place and accreditation process has commenced. The rating was felt therefore to be 9. Using the Quality Management System graph, a rating of 9 out of 10 equates to a benchmark score of 79%. This indicates that 79% of consultants have a performance that is equal or lower and 21% have a performance that is higher than the example consultancy.
31

Consultants’ Performance Indicator Report – Part 2: Performance Indicators 8 HOW TO USE THE PERFORMANCE INDICATOR GRAPHS Gathering data to benchmark performance In order to use the graphs, an organisation will need to collect data on its performance for each indicator to be measured. The resulting performance is then calculated. This can be carried out by hand calculation or by the use of proprietary software. Information on software can be obtained from Constructing Excellence, whose details appear on page 52. Measuring the consultancy benchmark score Having identified the performance of the consultancy for each of the KPIs and APIs, the measured performance for each is plotted on the vertical axis of the appropriate graph. Read across to the graph line. (If the graph line is intersected at a ‘flat’ zone where the graph line runs horizontally, follow the graph line to the last point of contact.) Read down to the horizontal axis and obtain the benchmark score. The benchmark score reveals the percentage of results equal or worse than the performance of the measured company. Worked example The example below uses the Productivity KPI of a consultancy whose business details are:
Turnover £8,965,000 Total fees paid to sub-consultants £25,800 Value of purchased materials £19,300 Total UK Full-Time Equivalent (FTE) Employees 231
Step 1 - Select the appropriate KPI (i.e. Productivity) Step 2 - Calculate the consultancy's measured performance, i.e., the consultancy’s turnover less the value of goods and services sub-contracted to or supplied by other parties, expressed per UK FTE employee. That is (£8,965,000 - £25,800 - £19,300) ÷ 231 which equals £38,614. Step 3 - Plot the measured performance for the consultancy on the vertical axis of the KPI graph. Step 4 - Read across to the performance graph line. Step 5 - At this point, read down to the horizontal axis and read off benchmark score. A productivity performance of £38,614 equates to a benchmark score of 56%. This means that 56% of consultancies have achieved equal or lower productivity and 44% have achieved higher productivity than the example consultancy company.
32

Consultants’ Performance Indicator Report – Part 2: Performance Indicators
For details on how KPIs and APIs are used to improve performance see pages 34-36. These pages also show how to identify the areas that need improvement by the use of a radar chart.
33

Consultants’ Performance Indicator Report – Part 2: Performance Indicators 9 USING PERFORMANCE INDICATORS KPIs and APIs are used to help manage a business by comparing its performance with its competitors and the best in the field. The information is then used to target specific areas for improvement. The aim of the Construction Consultants KPIs is to provide the impetus to alert the business to the areas of performance that need improvement. The KPIs will draw attention to those areas where the business performance is significantly behind that being achieved by others. The business will need to prioritise the weaker areas and take action to tackle the most serious failings first, at the same time ensuring that it has a strategy in place to maintain its strengths. To get the best value from KPIs, they should not be used simply as a one-off exercise, but as an objective tool to give your firm a regular business health examination. Over the long term, businesses should be aiming to improve their performance relative to their peers. Regular measurement and action can only achieve this. It is intended to produce Construction Consultants KPIs each year so that changes taking place in the sector can be monitored. Each business will need to measure regularly to check that it is doing more than just keep pace with the rate of improvement in the sector. KPIs provide some of the information required by all businesses – small, medium-sized or multi-national – to make informed strategic decisions on the efficiency of their organisations. Benchmarking using the Construction Consultants KPIs is an integral part of continuous improvement. When to use KPIs and APIs In addition to individual performance checks, KPIs and APIs can be used in the following circumstances. • Clients can use KPIs as a means to promote continuous improvement in partnership with the consultant. Clients will see the use of KPIs as a consultant’s commitment to continuous performance improvement. However KPIs should not be the sole method of assessing consultants’ performance. • KPIs can be used by all key partners to set performance targets at the start of a project. • Throughout the consultant’s work, project performance can be monitored against these targets. • After the consultant’s work is over, KPIs can be used to measure performance and provide feedback. This can then be used to set targets for improvement in future consultancy work. Teamwork and transparency To carry out successful benchmarking several actions are necessary. Organisations need active commitment from senior management to lead and implement the benchmarking process, and to convince all levels of the team of the benefits of the KPI project by personally getting involved. There must be a fundamental commitment from everyone to learn from and change business practice on the basis of the results. There must also be openness to new ideas and creativity to spark change and a belief in continuous improvement.
34

Consultants’ Performance Indicator Report – Part 2: Performance Indicators All members of the team within the consultancy need to buy into the concept of benchmarking for the performance indicators to work. This is the only way that targets derived from the process can be achieved. If the targets lack legitimacy or relevance they are unlikely to be adhered to. Getting the whole team to sign up to performance measurement will at the very least require information, encouragement and an explanation of what the consultancy is trying to achieve and what the information is going to be used for. It may also require training in the collection, presentation and use of KPI data. After areas for improvement have been identified, action plans developed in consultation with all members of the team are more likely to be successful than actions imposed from above. Getting the team on board will also help ensure that all measurements are open, and fair. There is no point measuring falsely, as it will only cover up problems that need to be addressed. To ensure the integrity of information, it may be necessary to instigate a system of crosschecks and validation. How to implement a KPI programme • Plan Decide which of the KPIs and APIs are most appropriate as the fundamental measures for improvement in your organisation. Bear in mind that there are two perspectives to consider - your customers' interests and your own. Establish how to collect the data relevant to these measures. • Analyse Collate all the data and plot your score using the KPI charts. This provides an indication of your performance relative to your peers in the consultant sector of the industry. This will show up any performance gaps between you and your competitors. Investigate and identify the reasons for the performance difference. • Take Action Having developed the reasons for underperformance; tackle them by developing and applying action plans for improvement using performance targets. • Review Constantly and consistently monitor your performance against the targets. • Repeat Habitually and regularly repeat the process, to improve your performance. How to improve performance By undertaking a benchmarking exercise using the performance indicators, it is possible to gain a good picture of how your organisation is performing against the rest of the sector. It will also identify the areas that need improvement. The radar chart will also give an indication of which areas of your organisation are out of step with the others as the objective would be to attempt to obtain improvement in all areas at the same rate. The next step therefore is to take actions to improve the areas in which your firm is falling behind, or areas in which you want to lead the industry. This can be done a number of ways. One of the best methods of improvement is to work with others in the industry who are likely to know the problems encountered and with whom you are able to share the improvement techniques. They may have perhaps already been through the benchmarking process and made some improvements. Alternatively, they may also be starting out on the benchmarking process and have strengths where you may have weaknesses. The best way of dealing with this is through benchmarking clubs. There are plans to set up a construction consultants benchmarking club which will enable members to make comparisons of performance between themselves and to identify and share best practice in the drive for improvement in the supply chain. Details are still being worked on but it is hoped to get something moving by the end of the year.
35

Consultants’ Performance Indicator Report – Part 2: Performance Indicators Using a radar chart to show overall performance The radar chart gives a rapid picture of the organisation's overall benchmark performance. To complete the radar chart, take the benchmark scores for each KPI, plot each result on the appropriate axis of the radar chart, and join with a line. In general, the nearer the plotted line is to the outer perimeter of the radar chart, the higher the overall performance. An example is given below.
36

Consultants’ Performance Indicator Report – Part 3: Other Survey Results 10 COMPARISON OF RESULTS WITH PREVIOUS SURVEYS General After the first year’s results a number of minor changes were made to the survey form to make the process more user-friendly. These particularly relate to the Client Satisfaction indicators. As a result it was agreed that the 2002 KPIs would be used as the baseline for future comparisons. Before the 2004 Consultants KPI survey, a full review of the indicators was undertaken, with the express intent of confirming that they were providing the information wanted by consultants. It was decided that a full review of all the indicators was needed and that this would be carried out for publication in the 2005 Consultants KPIs. As a result all KPIs and APIs were confirmed for 2004. It should be pointed out that the KPIs do change from year to year because they are based on people's experiences and record over the previous year. They are the result of real data and take into account different people’s reactions. The important factor is that the survey data is robust and reflects the actual feelings of people and organisations. It should be noted that the data for the Productivity and Profitability KPIs is obtained from information reported to Companies House and is obtained as part of the DTI annual KPI survey. It is accepted that this data may not be fully representative of other types of organisational structure, such as partnerships, and these will have to calculate their own score based on the equivalent information for companies that is reported to Companies House. In view of this anomaly, the review to be carried out for the 2005 Consultants KPIs will re-examine how profitability and productivity can be more accurately measured across all types of organisational structures. Key Performance Indicators All the KPIs are published separately, in the form of a wallchart and are analysed together. Copies can be downloaded from www.kpizone.com. In order to provide a meaningful analysis of the results of the Client Satisfaction Key Performance Indicators a score of 8/10 is used to track changes. The percentage of companies scoring this or better are noted for each KPI. An index figure of 100 is given for 2002 (the base year) and the results for 2003 and 2004 are shown compared to this. In order to provide a meaningful analysis of the results of the Company Key Performance Indicators the median performance is used. An index figure of 100 is given for 2002 (the base year) and the results for 2003 and 2004 are shown compared to this.
37

Consultants’ Performance Indicator Report – Part 3: Other Survey Results Key Performance Indicator Graphs
Consultant 2004 KPIs compared with previous years(2002 = 100)
60
70
80
90
100
110
120
130
140
150
160
170
180
Overallperformance
Value for Money Quality ofservice
Timely deliveryof service
H&S awareness Training Productivity Profitability
Key Performance Indicator
Inde
x
2002 2003 2004
On this basis, the results of the five 2004 Client Satisfaction KPIs were very encouraging. All have shown a significant improvement on the previous year and all but one showed a significant improvement over the three years to 2004. This demonstrates that consultants are showing a commitment to their clients. Of the three 2004 Company KPIs, all have shown a significant improvement on the previous year and over the three years to 2004 and are good pointers for the long-term health of consultancies. Training (a KPI that has been measured from 2001) in particular has shown a very healthy increase and, although still with room for improvement, has increased from a median of 1.9 to 3.2 training days per FTE over the last three years. A strong increase in Profitability probably reflects the market, but at least for the time being will enable consultants to make the necessary investment in the future, and thus provide the client with an even better service. Additional Performance Indicators In a similar manner to the KPIs, the percentage of companies scoring 8/10 or better (for Client Satisfaction Indicators) or the median performance score (for Company Indicators) is used to compare the results for each API. An index figure of 100 is given for 2002 (the base year) and the results for 2003 and 2004 are shown compared to this.
38
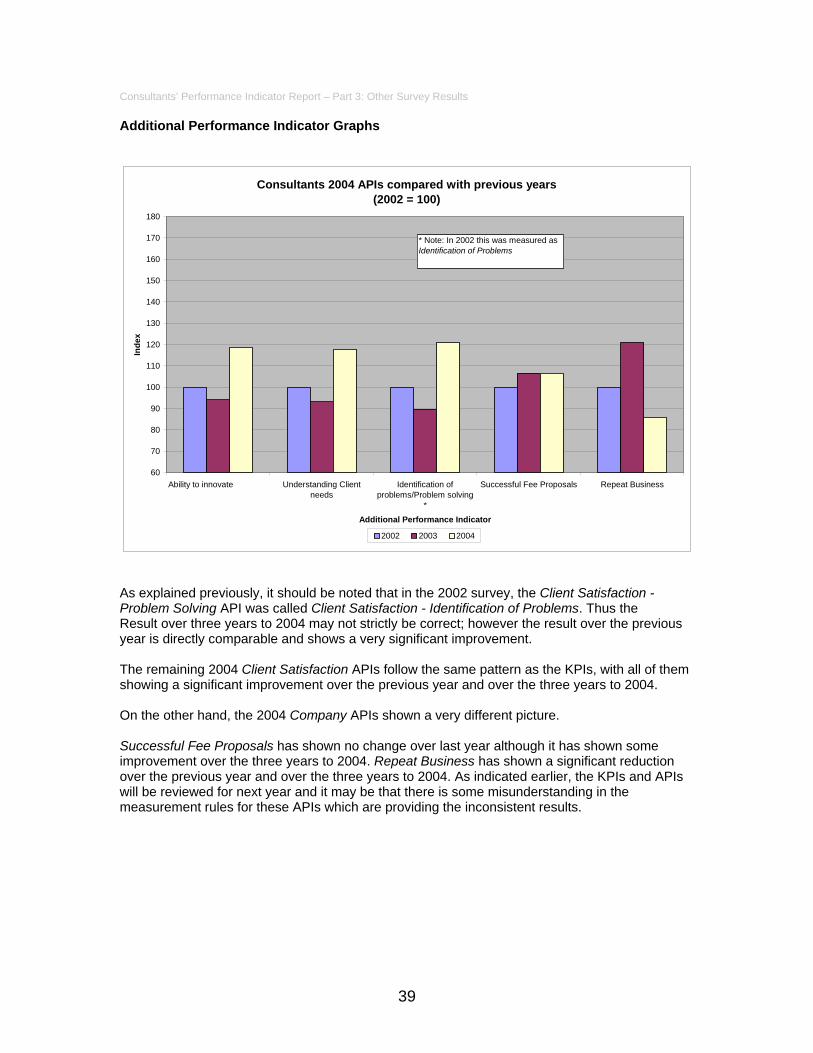
Consultants’ Performance Indicator Report – Part 3: Other Survey Results Additional Performance Indicator Graphs
Consultants 2004 APIs compared with previous years(2002 = 100)
60
70
80
90
100
110
120
130
140
150
160
170
180
Ability to innovate Understanding Clientneeds
Identification ofproblems/Problem solving
*
Successful Fee Proposals Repeat Business
Additional Performance Indicator
Inde
x
2002 2003 2004
* Note: In 2002 this was measured as Identification of Problems
As explained previously, it should be noted that in the 2002 survey, the Client Satisfaction - Problem Solving API was called Client Satisfaction - Identification of Problems. Thus the Result over three years to 2004 may not strictly be correct; however the result over the previous year is directly comparable and shows a very significant improvement. The remaining 2004 Client Satisfaction APIs follow the same pattern as the KPIs, with all of them showing a significant improvement over the previous year and over the three years to 2004. On the other hand, the 2004 Company APIs shown a very different picture. Successful Fee Proposals has shown no change over last year although it has shown some improvement over the three years to 2004. Repeat Business has shown a significant reduction over the previous year and over the three years to 2004. As indicated earlier, the KPIs and APIs will be reviewed for next year and it may be that there is some misunderstanding in the measurement rules for these APIs which are providing the inconsistent results.
39

Consultants’ Performance Indicator Report – Part 3: Other Survey Results 11 RESULTS BY CONSTRUCTION CONSULTANT TYPE Client satisfaction In the three years to 2004, the clients have been asked to rate their satisfaction with the type of consultant used individually for the indicators. The changes between the three sets of data are shown below. Architects have recovered from a poor performance last year and are now making some improvements in four of the indicators but getting steadily worse against Timely Delivery of Service.
Architects
0%
10%
20%
30%
40%
50%
60%
Timely delivery of service H&S awareness Ability to innovate Understanding Clientneeds
Identification ofproblems/Problem solving
*
Client Satisfaction Indicator
Perc
enta
ge >
8/1
0
2002 2003 2004
* Note In 2002 this was measured as Identification of Problems Engineers have recovered from a poor performance last year and are making improvements in all indicators.
40

Consultants’ Performance Indicator Report – Part 3: Other Survey Results
Engineers
0%
10%
20%
30%
40%
50%
60%
Timely delivery of service H&S awareness Ability to innovate Understanding Clientneeds
Identification ofproblems/Problem solving
*
Client Satisfaction Indicator
Perc
enta
ge >
8/1
0
2002 2003 2004
* Note In 2002 this was measured as Identification of Problems Surveyors, continue to build on a good set of results.
Surveyors
0%
10%
20%
30%
40%
50%
60%
Timely delivery of service H&S awareness Ability to innovate Understanding Clientneeds
Identification ofproblems/Problem solving
*
Client Satisfaction Indicator
Perc
enta
ge >
8/1
0
2002 2003 2004
* Note In 2002 this was measured as Identification of Problems
41
Consultants’ Performance Indicator Report – Part 3: Other Survey Results Negotiated commissions In 2003 the consultants were asked to record the number of new commissions arising from direct negotiations. This becomes a stand-alone figure that cannot be exactly compared with other data recorded. However in order to provide some analysis between consultants the table below has been prepared. It should be read with caution in view of the small sample size within the three types of consultants. Negotiated Commissions Projects Completed to end 2003
All Consultants Architects Surveyors Engineers
% of respondents who indicated that the number of directly negotiated commissions was equal to or greater than number of successful bids
42% 38% 36% 63%
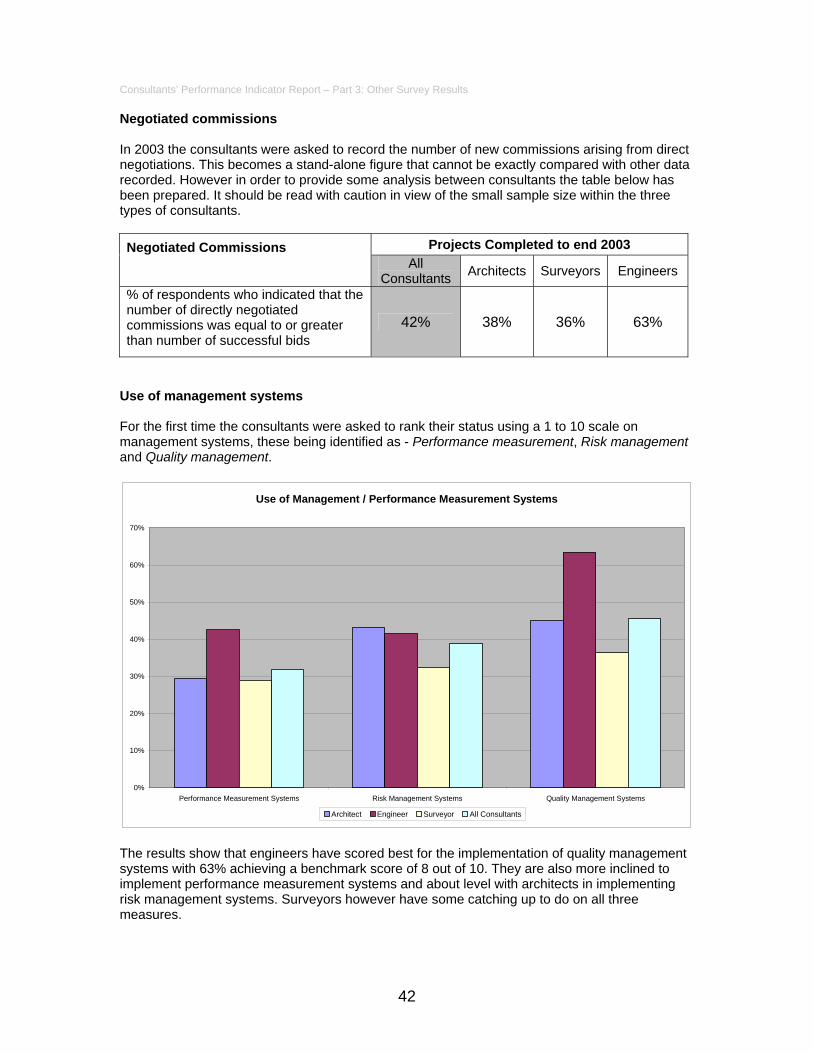
Use of management systems For the first time the consultants were asked to rank their status using a 1 to 10 scale on management systems, these being identified as - Performance measurement, Risk management and Quality management.
Use of Management / Performance Measurement Systems
0%
10%
20%
30%
40%
50%
60%
70%
Performance Measurement Systems Risk Management Systems Quality Management Systems
Architect Engineer Surveyor All Consultants
The results show that engineers have scored best for the implementation of quality management systems with 63% achieving a benchmark score of 8 out of 10. They are also more inclined to implement performance measurement systems and about level with architects in implementing risk management systems. Surveyors however have some catching up to do on all three measures.
42
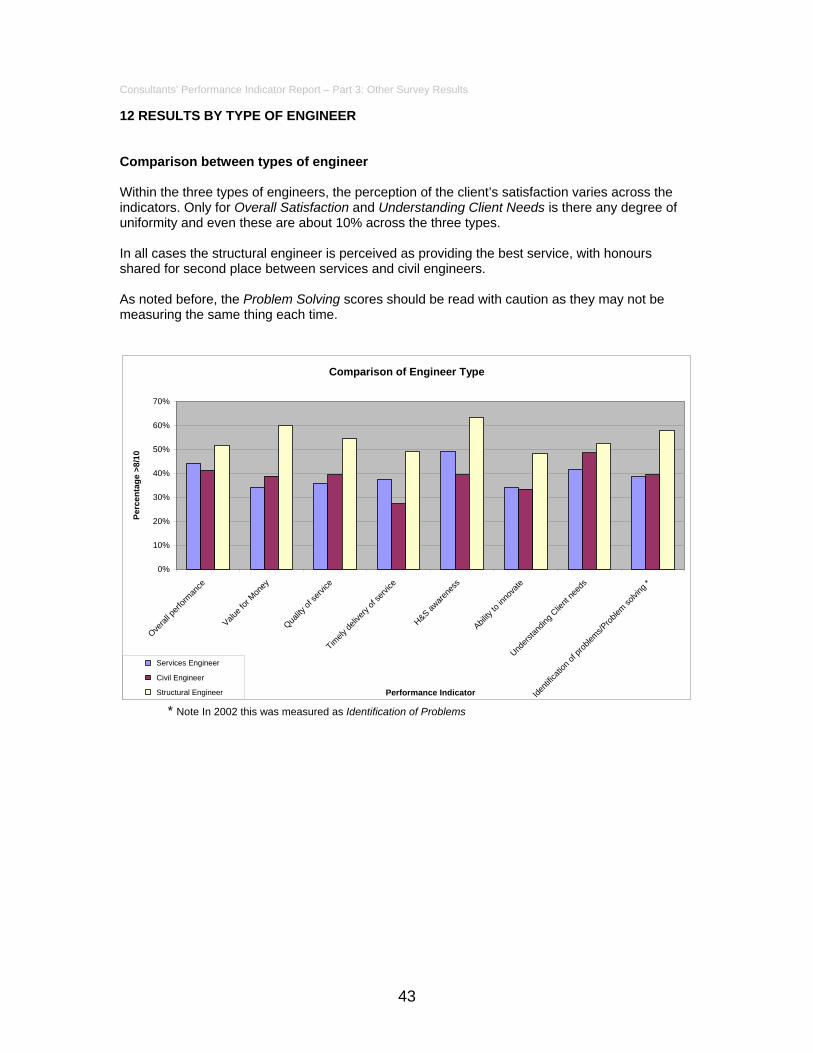
Consultants’ Performance Indicator Report – Part 3: Other Survey Results 12 RESULTS BY TYPE OF ENGINEER Comparison between types of engineer Within the three types of engineers, the perception of the client’s satisfaction varies across the indicators. Only for Overall Satisfaction and Understanding Client Needs is there any degree of uniformity and even these are about 10% across the three types. In all cases the structural engineer is perceived as providing the best service, with honours shared for second place between services and civil engineers. As noted before, the Problem Solving scores should be read with caution as they may not be measuring the same thing each time.
Comparison of Engineer Type
0%
10%
20%
30%
40%
50%
60%
70%
Overal
l perf
orman
ce
Value f
or Mon
ey
Quality
of se
rvice
Timely
delive
ry of
servi
ce
H&S aware
ness
Ability
to in
nova
te
Unders
tandin
g Clie
nt ne
eds
Identi
ficati
on of
prob
lems/P
roblem
solvin
g *
Performance Indicator
Perc
enta
ge >
8/10
Services Engineer
Civil Engineer
Structural Engineer * Note In 2002 this was measured as Identification of Problems
43

Consultants’ Performance Indicator Report – Part 3: Other Survey Results 13 FINANCIAL BREAKDOWN BY SIZE OF COMPANY As with most of the construction Industry, construction consultants vary in size from small and very small (independent sole traders) to very large with multiple offices around the world. These different organisational structures would all have disproportionate overheads and turnover which could skew the data with regard to profitability and productivity. As a result it was decided to analyse the data for three classes of consultant. Those with 1-10 staff, those with 11-100 staff and those with more than 100 staff. The base data for the Profitability and Productivity KPIs is obtained from information reported to Companies House and is obtained as part of the DTI annual KPI survey. Profitability
Consultants - Profitability - By Number of Employees
-20%
-10%
0%
10%
20%
30%
40%
50%
60%
0% 10% 20% 30% 40% 50% 60% 70% 80% 90% 100%
Benchmark Score
Prof
itabi
lity
(Bef
ore
Tax
and
Inte
rest
)
1 - 10 Employed11 - 100 Employed100+ Employed
The median profitability for all consultants was 10.5% (see Profitability KPI on page 26). However, for the smaller consultants the median is much greater about 16%, whereas for the larger firms it is only about 3%. Put another way, a small consultancy firm (with 1-10 employees), with a profitability of 20% achieves a benchmark score of about 54% which means that their profit level is better than or equal to 54% of other small consultancies. However a large consultancy firm (with over 100 employees) also with a profitability of 20% achieves a benchmark score of 93%, meaning that their profitability is equal or better than that of 93% other large consultancies.
44

Consultants’ Performance Indicator Report – Part 3: Other Survey Results Productivity
Consultants - Productivity - By Number of Employees
-20
0
20
40
60
80
100
0% 10% 20% 30% 40% 50% 60% 70% 80% 90% 100%
Benchmark Score
Prod
uctiv
ity (V
alue
Add
e4d
per F
TE £
000s
1 - 10 Employed11 - 100 Employed100+ Employed
The median productivity for all consultants was £35,500 per UK FTE (see Productivity KPI on page 25). However, for small consultants the median is much greater at £41,900, whereas for the larger forms it is about £33,900 per UK FTE In other words 50% of small firms (1-10 Staff) achieve a productivity of around £42,000 per UK FTE, whereas only 30% of medium size companies and 20% of large ones achieve this figure.
45
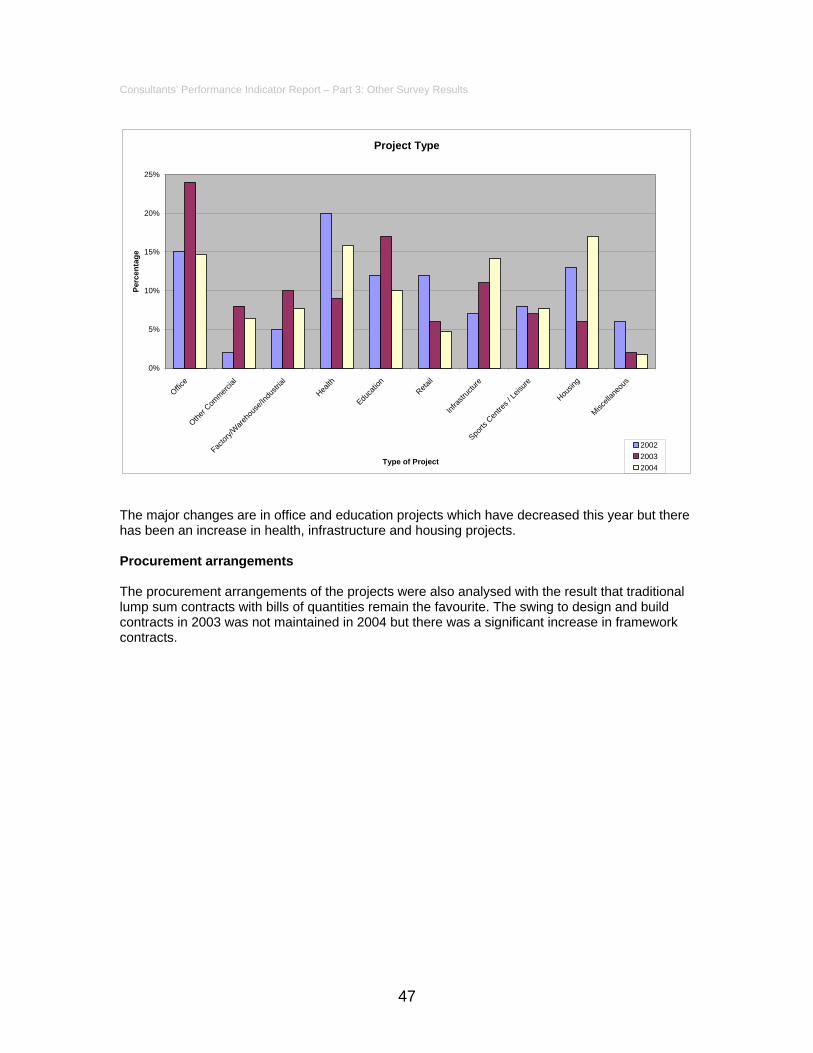
Consultants’ Performance Indicator Report – Part 3: Other Survey Results 14 ANALYSES OF CLIENT RETURNS Type of clients surveyed In addition to questions on their satisfaction with the consultant, all clients were asked to give some information on themselves and the project on which they were scoring. The majority of the responses were from private clients, but local government and other public bodies made up a third of the replies. Returns from central government clients were very few. This ratio was rather more towards private clients than previous year.
Year Private Central
Govt Local Govt Other
Public* 2002 46% 2% 34% 18% 2003 54% 1% 33% 12% 2004 69% 4% 6% 20%
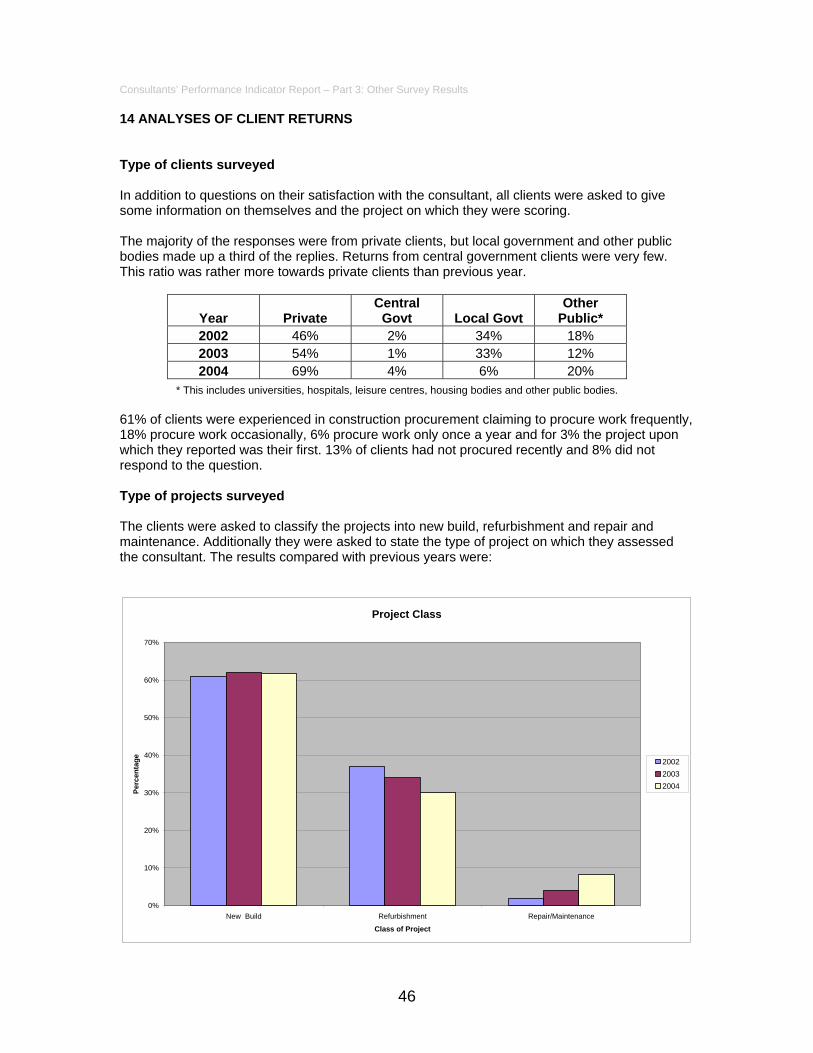
* This includes universities, hospitals, leisure centres, housing bodies and other public bodies. 61% of clients were experienced in construction procurement claiming to procure work frequently, 18% procure work occasionally, 6% procure work only once a year and for 3% the project upon which they reported was their first. 13% of clients had not procured recently and 8% did not respond to the question. Type of projects surveyed The clients were asked to classify the projects into new build, refurbishment and repair and maintenance. Additionally they were asked to state the type of project on which they assessed the consultant. The results compared with previous years were:
Project Class
0%
10%
20%
30%
40%
50%
60%
70%
New Build Refurbishment Repair/Maintenance
Class of Project
Perc
enta
ge 200220032004
46
Consultants’ Performance Indicator Report – Part 3: Other Survey Results
Project Type
0%
5%
10%
15%
20%
25%
Office
Other C
ommerc
ial
Factor
y/Ware
hous
e/Ind
ustria
l
Health
Educa
tion
Retail
Infras
tructu
re
Sports
Cen
tres /
Leisu
re
Housin
g
Miscell
aneo
us
Type of Project
Perc
enta
ge
200220032004
The major changes are in office and education projects which have decreased this year but there has been an increase in health, infrastructure and housing projects. Procurement arrangements The procurement arrangements of the projects were also analysed with the result that traditional lump sum contracts with bills of quantities remain the favourite. The swing to design and build contracts in 2003 was not maintained in 2004 but there was a significant increase in framework contracts.
47

Consultants’ Performance Indicator Report – Part 3: Other Survey Results
Procurement Arrangements
0%
5%
10%
15%
20%
25%
30%
35%
40%
TraditionalLump Sum
with Quantities
TraditionalLump Sum
withoutQuantities
D & B Framework * ManagementContracting
ConstructionManagement
PFI * Design,Manage &Construct
Other
Types of Procurement
Perc
enta
ge
200220032004
* Note: Before 2003 this category was included in Other
Specific partnering projects were not measured in 2002, but those replies listed as “other“ were noted as possible partnering projects; however they cannot be directly compared with other years because partnering could have been used on other types of procurement. In 2004 it appears that 30% of all the projects were considered as partnering projects and 62% of these were for New Build – although the majority of all the New Build projects were not considered partnering projects. Finally, clients were asked to comment on whether they would use the construction consultant again. 83% said they would use the same architect and 88% the same surveyor. However, only 79% said they would use the same engineer.
48

Consultants’ Performance Indicator Report – Part 3: Other Survey Results 15 ANALYSIS OF CONSULTANT RETURNS Each consultant was asked to provide data on a project completed and some indication as to the performance on its completion. Estimated internal costs of commission With regard to the internal costs of the commission, the consultant was asked to identify their original estimated internal costs at the commencement of the project, the actual internal costs and some indication as to why they were different.
Changes in internal Costs of Commission
0%
10%
20%
30%
40%
50%
60%
70%
80%
OVERRUN UNDERRUN ON TARGET
Perc
enta
ge
2003 2004 The findings show the results in 2004 were marginally better than 2003. In particular 4% of the projects were completed to their target price as opposed to 0% in 2003. However the median value of all the results was a 9% cost overrun compared to an 11% in 2003. The consultants were also asked to consider how much of the over-run/under-run in their cost estimates was due to actions beyond their control, such as client changes or issues relating to planning or other factors. The median figure for this was 17% client changes compared to 23% in 2003. Estimated time to complete commission The consultant was asked to identify their original estimated time to complete the work at the commencement of the project, the actual time taken and some indication as to why they were different.
49

Consultants’ Performance Indicator Report – Part 3: Other Survey Results
Changes in estimated time of commission
0%
10%
20%
30%
40%
50%
60%
70%
80%
90%
OVERRUN UNDERRUN ON TARGET
Perc
enta
ge
2003 2004 The findings show the results in 2004 were marginally better than 2003. In particular 17% of the projects were completed on target time as opposed to 9% in 2003. However the median value of all the results was a 17% time overrun compared to an 18% in 2003. The consultants were also asked to consider how much of the over-run/under-run in their time estimates was due to actions beyond their control, such as client changes or issues relating to planning or other factors. The median figure for this was 17% client changes the same result as in 2003.
50

Consultants’ Performance Indicator Report – Part 4 : Information and Annexes 16 USEFUL SOURCES OF INFORMATION Project partners To contact any of the KPIs for Construction Consultants project partners or to make any suggestions about the project please contact any of the organisations listed below. Association of Consulting Engineers Royal Institute of British Architects ACE Alliance House 12 Caxton Street London, SW1H 0QL Tel: 0207 222 6557 Fax: 0207 222 0750 www.acnet.co.uk E-mail: [email protected]
Director of Practice RIBA 66 Portland Pace London, W1B 1AD Tel: 0207 580 5533 Email: [email protected]
Royal Institution of Chartered Surveyors Institution of Civil Engineers Construction Faculty RICS 12 Great George Street London, SW1P 3AD Tel: 0870 333 1600 Email: [email protected]
KPIs Engineering Department, ICE 1 Great George Street London, SW1P 3AA Tel: 020 7222 7722 Email: [email protected]
Chartered Institute of Builders Chartered Institution of Building Services Engineers
CBC/RIA Manager CIOB Englemere, Kings Ride Ascot Berkshire, SL5 7TB Tel: 01344 630743 www.ciob.org.ukEmail: [email protected]
Information Manager CIBSE 222 Balham High Road London, SW12 9BS Tel: 020 8675 5211 www.cibse.org/policyE-mail: [email protected]
Department of Trade and Industry CMI Division IES Directorate DTI, Bay 289 151 Buckingham Palace Road London SW1W 9SS
51

Consultants’ Performance Indicator Report – Part 4 : Information and Annexes Constructing Excellence Constructing Excellence provides support to individuals, companies, organisations and supply chains in the construction industry seeking to improve the way they do business – clients, contractors, specialists, large or small, public or private. Constructing Excellence offers the following support services: • Helpdesk - a direct point of contact to answer initial enquiries about KPIs. • Workshops – an introduction to the benefits and use of the Construction Industry KPIs. Each workshop explores the importance of measuring performance with the help of practical examples and a step guide to their use. • KPI Business Solutions – a 7 step facilitated process to set up a system to measure and analyse KPIs relevant to your business needs. For organisations under pressure to use KPIs but lacking in the full resources to implement successfully. • Pay-As-You-Measure – a simple way to help you benchmark your performance. No additional software to install – you only pay for the scorecards you use. Visit www.constructingexcellence.org.uk, look for Pay-As-You-Measure in the list of services and you will be able to produce professional KPI graphs of your own performance in minutes. • KPIZone – a website dedicated to KPIs. Log in at www.kpizone.com for the latest KPIs and information on benchmarking clubs. • KPI Pack and Housing KPI Toolkit – all the information needed to measure and benchmark against the rest of industry, including Case Studies and Best Practice Guide. To contact Constructing Excellence: 25 Buckingham Palace Road London SW1W 0PP Tel: 0845 605 55 56 Fax: 0207 592 1101 Email: [email protected]: www.constructingexcellence.org.uk
52

ANNEX 1 Consultant Clients’ Questionnaire 2003
Key Performance Indicators (KPIs) for Construction Consultants
BSRIA is undertaking research in collaboration with Construction Consultants and the DTI. This survey will provide the primary data source from which the KPIs for Construction Consultants will be produced. The data collected is essential to ensure that Construction Consultants continue to improve performance in line with clients’ needs. Please help us to better understand the quality of services that you, the client receive, by completing this questionnaire. If any part is not applicable, please leave the question(s) blank and complete the remaining relevant sections. All responses will be treated in strict confidence.
Section 1 - About your company/you, as a client
1.1 Name of organisation 1.2 Type of firm (Main contractor, Health Trust, etc)
1.3 What type of organisation are you? (please tick one box)
Private Central Government Local Government Other public 1.4 Please state your own experience in construction procurement (please circle one score only)
This was my first procurement
1
I have procured work before but not recently
2
I procure work about once/yr
3
I procure work occasionally through the year
4
I procure work frequently
5
Section 2 - Details on the latest completed project in 2003,
irrespective of whether you consider it is representative of a typical roject.
2.1 Type of project (eg hospital, office, housing) 2.2 Date projected was completed
2.3 Project classification (please tick one box)
New build Refurbishment Repair/maintenance
2.4 What was the procurement arrangement? (please tick one box) Traditional lump sum – with quantities Management contracting Design and Build
Traditional lump sum – without quantities
Construction management Design Manage Construct
Framework PFI Other (please specify) _ _ _ _ _ _ _ _ _ _ _ _
2.5a Was this a partnering project (as opposed to a traditionally procured project)? Yes No
2.5b If yes, please tick all disciplines that were included (besides the end user/main contractor/project manager)
Architect Quantity surveyor M&E contractor
Civil engineer Structural engineer Building services engineer
53

ANNEX 1 Consultant Clients’ Questionnaire 2003
Section 3 – Appraisal of Consultants
3.1a To what extent were whole life performance issues taken into account in the finished product by the consultancy team? (please circle one score)
No influence on design
Minor influence on
design
Some influence on design
Major influence on design
Basis of concept design
1 2 3 4 5 6 7 8 9 10 3.1b To what extent were environmental impacts (such as energy use, CO2 emissions, materials
from non-renewable source) taken into account in the finished product by the consultancy team? (please circle one score)
No influence on design
Minor influence on
design
Some influence on design
Major influence on design
Basis of concept design
1 2 3 4 5 6 7 8 9 10 3.2 What was the value and length of the commission?
Architect Quantity Surveyor Consulting Engineer a) Value of commission £ £ £ b) Length of commission weeks weeks weeks 3.3 What was your level of satisfaction with the ARCHITECT’S performance?
(please circle one score in each row) Totally Neither satisfied Totally
dissatisfied or dissatisfied satisfied a) Overall performance 1 2 3 4 5 6 7 8 9 10 b) Value for money 1 2 3 4 5 6 7 8 9 10 c) Quality of service 1 2 3 4 5 6 7 8 9 10 d) Timely delivery of service 1 2 3 4 5 6 7 8 9 10 e) Ability to innovate 1 2 3 4 5 6 7 8 9 10 f) Health & safety awareness 1 2 3 4 5 6 7 8 9 10 g) Understanding of clients’ needs 1 2 3 4 5 6 7 8 9 10 h) Problem solving 1 2 3 4 5 6 7 8 9 10
3.4 What was your level of satisfaction with the QUANTITY SURVEYOR’S performance? (please circle one score in each row)
Totally Neither satisfied Totally dissatisfied or dissatisfied satisfied
a) Overall performance 1 2 3 4 5 6 7 8 9 10 b) Value for money 1 2 3 4 5 6 7 8 9 10 c) Quality of service 1 2 3 4 5 6 7 8 9 10 d) Timely delivery of service 1 2 3 4 5 6 7 8 9 10 e) Ability to innovate 1 2 3 4 5 6 7 8 9 10 f) Health & safety awareness 1 2 3 4 5 6 7 8 9 10 g) Understanding of clients’ needs 1 2 3 4 5 6 7 8 9 10 h) Problem solving 1 2 3 4 5 6 7 8 9 10
3.5 What was your level of satisfaction with the CONSULTING ENGINEER’S performance? (please circle one score in each row)
Totally Neither satisfied Totally dissatisfied or dissatisfied satisfied
a) Overall performance 1 2 3 4 5 6 7 8 9 10 b) Value for money 1 2 3 4 5 6 7 8 9 10 c) Quality of service 1 2 3 4 5 6 7 8 9 10 d) Timely delivery of service 1 2 3 4 5 6 7 8 9 10 e) Ability to innovate 1 2 3 4 5 6 7 8 9 10 f) Health & safety awareness 1 2 3 4 5 6 7 8 9 10 g) Understanding of clients’ needs 1 2 3 4 5 6 7 8 9 10 h) Problem solving 1 2 3 4 5 6 7 8 9 10
54

ANNEX 1 Consultant Clients’ Questionnaire 2003 3.6 Please confirm the type of consulting engineer you have appraised
(please tick one box below)
Civil engineer Structural engineer Building services engineer
3.7 Would you use the particular consultants you have appraised again?
Architect Quantity Surveyor Consulting engineer
Please tick one box for each type of firm Yes No Yes No Yes No
Thank you for completing this questionnaire. All respondents returning their completed questionnaire will be given feedback from the survey.
Please insert your address below, or attach a business card.
Name of respondent: ................................................................................................…….……........…...…... . Name of firm: ........................................................................................….....…........………...……... Address: ...................................................................................................…......……….…..…... . Town: .................................................... County: ...........................…….……..... . Postcode: .................................................... Telephone: ..........................…………....... E-mail address: .....................….........................................................................….........…..……...…...
Please return this questionnaire using the freepost envelope provided to Gerry Samuelsson-Brown BSRIA, FREEPOST WLV 14, Bracknell, Berks, RG12 7GZ or return by fax on 01344 487575.
Please call 01344 426511 if you have any queries or would like more information.
55

ANNEX 2 Consultants’ Questionnaire 2003
Key Performance Indicators (KPIs) for Construction Consultants
ACE, CIBSE, CIOB, RIBA and RICS are collaborating with the DTI to produce the 4th set of Key Performance Indicators for Construction Consultants. This survey will provide the primary data source to produce the KPIs. The data collected will:
enable production of accurate and definitive KPIs for Construction Consultants, which will; enable you to monitor your firm’s performance effectively and demonstrate continuous
improvement. Please help us by completing this questionnaire. If any part is not applicable, please leave the question(s) blank and complete the remaining relevant sections. All responses will be treated in the strictest confidence.
Section 1 – Corporate KPIs – Your firm’s annual performance
1.1 What is the predominant activity of your firm? (please tick one box)
Architecture Engineering Surveying 1.2 What is the total number of full time equivalent staff your firm employs in the UK,
including directors, partners, principals and sole proprietors?
Professional/technical Administration 1.3 How much time did your staff (full time equivalents) spend on training and
development in 2003? Include internal and external courses, including CPD talks and induction training etc. (Please give total of days spent training)
Days 1.4a How many decisions on your competitive bids have you received in the last year?
1.4b Of these, what was the number of successful bids? 1.4c Of these, how many were from new clients? 1.4d How many new commissions have come from direct negotiations rather than bids
in the last year? 1.5 Please indicate your status on Performance Measurement, including the measurement
of client satisfaction, productivity, financial management, training and development, and investment in R & D. (please circle one score)
None
measured One
measured Two
measured Three or four
measured All
measured 1 2 3 4 5 6 7 8 9 10 1.6 Please indicate your status on Risk Management systems? (please circle one score)
Have done nothing
Risk implications have been reviewed
Risk Audits carried out occasionally
Risk Management
systems in use on some projects
Risk Management
system in use on all projects
1 2 3 4 5 6 7 8 9 10
56

ANNEX 2 Consultants’ Questionnaire 2003 1.6 Please indicate your status on Quality Management systems? (please circle one score) Have
done nothing
Quality implications have been reviewed
Quality systems in use, carried out
occasionally
Quality Management
systems in use
Quality Management
system accredited to
ISO 9000 2000 1 2 3 4 5 6 7 8 9 10
Section 2 – Project KPIs Your firm’s performance on the latest commission
Please focus your answers on your last completed commission in 2003. If you are willing to provide feedback on further commissions, please photocopy this form and provide data on the last completed commission in each quarter of 2003. Note that your address details at the end need only be completed on one questionnaire. Please select the last completed commission(s) irrespective of whether you consider it is representative of the performance generally provided by you. 2.1 Job Title 2.2 Date commission was completed
2.3 Commission description
2.4a What was your original estimated internal cost of the commission at appointment? £
2.4b What was your actual internal cost of the commission at completion? £
2.4c If there is a difference, what percentage of that difference is attributable to
planning, client changes or other factors outside your control? (please complete either the + or minus box)
Cost difference
+ % - %
2.5a What was your original estimated internal time for the commission at
appointment?
Weeks 2.5b What was your actual internal time for the commission at completion?
Weeks
57

ANNEX 2 Consultants’ Questionnaire 2003 2.5c If there is a difference, what percentage of that difference is attributable to
planning, client changes or other factors outside your control? (please complete either the + or minus box)
Time difference
+ % - %
Thank you for completing this questionnaire. All respondents returning their completed questionnaire will be given feedback from the survey.
Please insert your address below, or attach a business card.
Name of respondent: ..................................................................................................…........…...……….. Name of firm: ........................................................................................….....….......….....……….. Address: ...................................................................................................….....….....……….. .. Town: .................................................... County: .............................…..…….. .. Postcode: .................................................... Telephone: ............................…...…….. E-mail address: .....................….........................................................................….........…..………..
Please return this questionnaire using the FREEPOST envelope provided to BCIS, FREEPOST LON 17909, London, SW1X 0BR or fax back to BCIS on 020 7695 1501.
If you have a query, please call the number on the accompanying letter.
58