3 r assessment - neosho county, kansas online plan/3 risk assessment_neosho… · hazard in this...
TRANSCRIPT

3 RISK ASSESSMENT
Neosho County DRAFT 3.1 Multi-Hazard Mitigation Plan January 2009
44 CFR Requirement §201.6(c)(2): [The plan shall include] A risk assessment that provides the factual basis for activities proposed in the strategy to reduce losses from identified hazards. Local risk assessments must provide sufficient information to enable the jurisdiction to identify and prioritize appropriate mitigation actions to reduce losses from identified hazards. The risk assessment process identifies and profiles relevant hazards and assesses the exposure of lives, property, and infrastructure to these hazards. The goal of the risk assessment is to estimate the potential loss in Neosho County, including loss of life, personal injury, property damage, and economic loss, from a hazard event. The risk assessment process allows communities in Neosho County to better understand their potential risk from natural hazards and provides a framework for developing and prioritizing mitigation actions to reduce risk from future hazard events.
The risk assessment for Neosho County and its jurisdictions followed the methodology described in the FEMA publication 386-2, Understanding Your Risks: Identifying Hazards and Estimating Losses (2002), which includes a four-step process:
• Identify Hazards • Profile Hazard Events • Inventory Assets • Estimate Losses
This chapter is divided into three parts: hazard identification, hazard profiles, and vulnerability assessment:
• Section 3.1 Hazard Identification identifies the hazards that threaten the planning area and describes why some hazards have been omitted from further consideration.
• Section 3.2 Hazard Profiles discusses the threat to the planning area and describes previous occurrences of hazard events and the probability of future occurrence.
• Section 3.3 Vulnerability Assessment assesses the County’s total exposure to natural hazards, considering critical facilities and other community assets at risk, and assessing growth and development trends. Hazards that vary geographically across the planning area are addressed in greater detail. This section includes steps 3 and 4 from above.
• Section 3.4 Summary of Key Issues provides a summary of the key issues or problems identified in the Risk Assessment.

Neosho County DRAFT 3.2 Multi-Hazard Mitigation Plan January 2009
Multi-Jurisdictional Risk Assessment
For this multi-jurisdictional plan, the risk assessment assesses each jurisdiction’s risks where they deviate from the risks facing the entire planning area. Neosho County is not a large county geographically (578 square miles) and is fairly uniform in terms of climate and topography as well as construction characteristics and development trends. Accordingly, overall hazards and vulnerability do not vary greatly across the planning area for most hazards. Weather-related hazards, such as drought, extreme heat, hailstorm, lightning, tornado, windstorm, and winter storm, affect the entire planning area.
The hazards that do vary across the planning area include dam and levee failure, flood, and wildfire. In Section 3.1, Hazard Identification, Table 3.2 indicates with a checkmark the hazards identified for each participating jurisdiction. In Section 3.2, Hazard Profiles, the Geographic Location section discusses how the hazard varies among jurisdictions across the planning area. The Previous Occurrences section lists the best available data on where past events have occurred and the associated losses to particular jurisdictions. Section 3.2.2, Community Asset Inventory, describes critical facilities and other community assets by jurisdiction. Section 3.3.3, Vulnerability by Hazard, identifies structures and estimates potential losses by jurisdiction where data is available and hazard areas are identified for hazards of moderate and high planning significance. Table 3.24 at the end of Section 3.2 summarizes the planning significance rating for each hazard by jurisdiction.
The previous chapter, Chapter 2 Planning Area Profile and Capabilities, discussed the existing mitigation capabilities of each jurisdiction, such as plans and policies, personnel, and financial resources, which are currently used to reduce hazard losses.
3.1 Hazard Identification
Requirement §201.6(c)(2)(i): [The risk assessment shall include a] description of the type…of all natural hazards that can affect the jurisdiction. 3.1.1 Methodology
The Hazard Mitigation Planning Committee (HMPC) reviewed data and discussed the impacts of each of the hazards suggested by FEMA for consideration, which are listed alphabetically below:
• Avalanche • Coastal Erosion • Coastal Storm • Dam/Levee Failure • Debris Flow • Drought • Earthquake

Neosho County DRAFT 3.3 Multi-Hazard Mitigation Plan January 2009
• Expansive Soils • Extreme Heat • Flood • Hailstorm • Hurricane • Land Subsidence • Landslide • Severe Winter Storm • Tornado • Tsunami • Volcano • Wildfire • Windstorm
In addition to considering the hazards suggested by FEMA for consideration, the HMPC also reviewed data and discussed the impacts of the following natural hazards that were included in the State of Kansas Hazard Mitigation Plan:
• Agricultural Infestation • Fog • Lightning • Major Disease Outbreak • Soil Erosion & Dust • Utility/Infrastructure Failure
Data on the past impacts and future probability of these hazards in the Neosho County planning area was collected from the following sources:
• Kansas Hazard Mitigation Plan (November 2007) • Information on past hazard events from the Spatial Hazard Event and Loss Database
(SHELDUS), a component of the University of South Carolina Hazards Research Lab that compiles county-level hazard data for 18 different natural hazard event types
• Information on past extreme weather and climate events from the National Oceanic and Atmospheric Administration’s (NOAA) National Climatic Data Center
• Federal Disaster Declarations from the Federal Emergency Management Agency (FEMA) • USDA Farm Service Agency Disaster Declarations • Draft Neosho County Mitigation Plan in MitigationPlan.com™, a web-based planning tool
developed by Visual Risk Technologies • Various articles and publications available on the internet (sources are indicated where data
is cited)

Neosho County DRAFT 3.4 Multi-Hazard Mitigation Plan January 2009
The HMPC eliminated some hazards from further profiling because they do not occur in the planning area or their impacts were not considered significant in relation to other hazards. Table 3.1 lists these hazards and provides a brief explanation for their elimination.
Table 3.1 Hazards Not Profiled in the Plan
Hazard Explanation for Omission Avalanche There are no mountains in the planning area. Coastal Erosion Planning area is not near coastal areas. Coastal Storm Planning area is not near coastal areas. Debris Flow There are no mountainous regions in the planning area susceptible to debris flow Hurricane Planning area is not near coastal areas. Fog Although fog does occur in the planning area occasionally, the HMPC determined that the
impacts are restricted primarily to traffic accidents and are difficult to mitigate Landslide This hazard does not occur in the planning area due to the flat topography. Land Subsidence
There are no known subsurface void spaces in Neosho County and no known historical occurrences of this hazard.
Major Disease Outbreak
The Neosho County Health Department maintains plans relating to prevention and response for major disease outbreaks. The HMPC chose not to duplicate those efforts by addressing this hazard in this mitigation plan.
Tsunami Planning area is not near coastal areas. Volcano There are no volcanic mountains in the planning area.
The HMPC identified 15 natural hazards that significantly affect the planning area and organized these hazards to be consistent with the Kansas Hazard Mitigation Plan (2007). These hazards are listed below and profiled in further detail in the next section. The HMPC agreed not to address manmade hazards, which are planned for in other documents such as the emergency operations plan. Table 3.2. Hazards Identified for Each Participating Jurisdiction
Hazard Neosho County Chanute Erie St. Paul Thayer Agricultural Infestation X X X X X Dam and Levee Failure X X X X X Drought X X X X X Earthquake X X X X X Expansive Soils X X X X X Extreme Heat X X X X X Flood X X X X X Hailstorm X X X X X Lightning X X X X X Soil Erosion and Dust X X X X X Utility/Infrastructure Failure X X X X X Tornado X X X X X Wildfire X X X X X Windstorm X X X X X Winter Storm X X X X X

Neosho County DRAFT 3.5 Multi-Hazard Mitigation Plan January 2009
3.1.2 Disaster Declaration History
One method used by the HMPC to identify hazards was to examine events that triggered federal and/or state disaster declarations. Federal and/or state declarations may be granted when the severity and magnitude of an event surpasses the ability of the local government to respond and recover. Disaster assistance is supplemental and sequential. When the local government’s capacity has been surpassed, a state disaster declaration may be issued, allowing for the provision of state assistance. Should the disaster be so severe that both the local and state governments’ capacities are exceeded; a federal emergency or disaster declaration may be issued allowing for the provision of federal assistance.
The federal government may issue a disaster declaration through FEMA, the U.S. Department of Agriculture (USDA), and/or the Small Business Administration. FEMA also issues emergency declarations, which are more limited in scope and do not include the long-term federal recovery programs of major disaster declarations. Determinations for declaration type are based on scale and type of damages and institutions or industrial sectors affected.
A USDA disaster declaration certifies that the affected county has suffered at least a 30 percent loss in one or more crop or livestock areas and provides affected producers with access to low-interest loans and other programs to help mitigate disaster impacts. In accordance with the Consolidated Farm and Rural Development Act, counties neighboring those receiving disaster declarations are named as contiguous disaster counties and are eligible for the same assistance.
Table 3.3 lists federal disaster declarations received by Neosho County. Each of the disaster events affected multiple counties; estimated damages reflect total losses to all counties.
Table 3.3 Disaster Declaration History in Neosho County, 1969-Present
Declaration Number
Declaration Date
Disaster Description Counties Included
Estimated Damage (2008 $)
Major Disaster Declarations
1711 7/2/2007
Severe Storms and Flooding
Allen, Anderson, Bourbon, Butler, Chautauqua, Cherokee, Coffey, Cowley, Crawford, Edwards, Elk, Franklin, Greenwood, Harper, Labette, Linn, Miami, Montgomery, Neosho, Osage, Pawnee, Wilson, Woodson 43,259,800
1600 8/23/2005 Severe Storms and Flooding
Cherokee, Crawford, Neosho
3,655,689 1462 5/6/2003 Severe Storms,
Tornadoes, and Flooding
Allen, Anderson, Cherokee, Crawford, Douglas, Haskell, Labette, Leavenworth, Meade, Miami, Neosho, Osage, Seward, Woodson, Wyandotte
16,848,760

Neosho County DRAFT 3.6 Multi-Hazard Mitigation Plan January 2009
Declaration Number
Declaration Date
Disaster Description Counties Included
Estimated Damage (2008 $)
1402 2/6/2002 Ice Storm Allen, Anderson, Barber, Bourbon, Butler, Chautauqua, Cherokee, Coffey, Comanche, Cowley, Crawford, Douglas, Elk, Franklin, Greenwood, Harper, Jefferson, Johnson, Kingman, Kiowa, Labette, Leavenworth, Linn, Lyon, Miami, Montgomery, Neosho, Osage, Pratt, Sedgwick, Shawnee, Sumner, Wilson, Woodson, Wyandotte 71,015,060
1327 5/3/2000 Severe Storms and Tornadoes
Crawford, Labette, Neosho
3,739,826 1258 11/5/1998 Severe Storms
and Flooding Butler, Chase, Coffey, Cowley, Douglas, Franklin, Greenwood, Harper, Harvey, Johnson, Leavenworth, Lyon, Marion, Neosho, Saline, Sedgwick, Sumner, Wilson, Woodson, Wyandotte
27,122,420 780 10/22/1986 Severe Storms,
Flooding Allen, Bourbon, Chautauqua, Cherokee, Cowley, Elk, Labette, Montgomery, Neosho, Wilson 4,579,850
514 7/13/1976 Severe Storms, High Winds,
Flooding
Butler, Cherokee, Crawford, Cowley, Elk, Greenwood, Labette, Neosho, Montgomery, Wilson 24,001,560
267 7/15/1969 Tornadoes, Severe Storms,
Flooding
Allen, Anderson, Bourbon, Crawford, Dickinson, Douglas, Ellsworth, Franklin, Johnson, Leavenworth, Linn, Lyon, McPherson, Miami, Morris, Neosho, Osage, Saline, Woodson, Wyandotte 4,295,500
Emergency Declarations 3236 9/10/2005 Hurricane Katrina
Evacuation All
0 Source: Federal Emergency Management Agency, www.fema.gov/; Note: Incident dates are in parentheses. Zero values (0) may indicate missing data.
Table 3.4 below lists U.S. Department of Agriculture disaster declarations and their related causes for Neosho County for the period 2005-2007.
Table 3.4. USDA Disaster Declarations in Neosho County 2005-2007
Cause USDA Disaster
Number Start Date Drought Heat Excessive
Moisture High
Winds Severe Storms
Winter Storms
M1711 6/26/2007 X X S2525 4/4/2007 X X S2485 1/1/2006 X X X S2413 1/1/2006 X X X M1600 6/30/2005 X X M1579 1/4/2005 X X Source: USDA Farm Service Agency, www.fsa.usda.gov, http://www.fsa.usda.gov/Internet/FSA_File/2005-2007_elig_co_031208.xls

Neosho County DRAFT 3.7 Multi-Hazard Mitigation Plan January 2009
3.2 Hazard Profiles
Requirement §201.6(c)(2)(i): [The risk assessment shall include a] description of the…location and extent of all natural hazards that can affect the jurisdiction. The plan shall include information on previous occurrences of hazard events and on the probability of future hazard events. 3.2.1 Methodology
Each hazard identified in Section 3.1, Hazard Identification, is profiled individually in this section in alphabetical order for easier reference. The level of information presented in the profiles varies by hazard based on the information available. With each update of this plan, new information will be incorporated to provide for better evaluation and prioritization of the hazards that affect Neosho County.
The sources used to collect information for these profiles include those mentioned in Section 3.1.1 as well as those cited individually in each hazard section. Detailed profiles for each of the identified hazards include information on the following characteristics of the hazard:
Hazard Description
This section consists of a general description of the hazard and the types of impacts it may have on a community. It also includes a ranking to indicate typical warning times and duration of hazard events. Definitions for these rankings are included in Table 3.x.
Geographic Location
This section describes the geographic extent or location of the hazard in the planning area. Where available, maps are utilized to indicate the areas of the planning area that are vulnerable to the subject hazard.
Previous Occurrences
This section includes information on historic incidents and their impacts based upon the sources described in Section 3.1 Hazard Identification and the information provided by the Hazard Mitigation Planning Committee.
Probability of Future Occurrence
The frequency of past events is used to gauge the likelihood of future occurrences. Where possible, the probability or chance of occurrence was calculated based on historical data. Probability was determined by dividing the number of events observed by the number of years and multiplying by 100. This gives the percent chance of the event happening in any given year. An example would be three droughts occurring over a 30-year period, which suggests a 10

Neosho County DRAFT 3.8 Multi-Hazard Mitigation Plan January 2009
percent chance of a drought occurring in any given year. The probability was assigned a rank as defined in Table 3.5.
Magnitude/Severity
The magnitude of the impact of a hazard event (past and perceived) is related directly to the vulnerability of the people, property, and the environment it affects. This is a function of when the event occurs, the location affected, the resilience of the community, and the effectiveness of the emergency response and disaster recovery efforts.
The magnitude of each profiled hazard is classified in the following manner:
• Level 4-Catastrophic—More than 50 percent of property severely damaged; shutdown of facilities for more than 30 days; and/or multiple deaths
• Level 3-Critical—25-50 percent of property severely damaged; shutdown of facilities for at least two weeks; and/or injuries and/or illnesses result in permanent disability
• Level 2-Limited—10-25 percent of property severely damaged; shutdown of facilities for more than a week; and/or injuries/illnesses do not result in permanent disability
• Level 1-Negligible—Less than 10 percent of property severely damaged, shutdown of facilities and services for less than 24 hours; and/or injuries/illnesses treatable with first aid
Hazard Summary
To maintain a consistent reporting format, the Neosho County Hazard Mitigation Planning Committee (HMPC) used the methodology from the MitigationPlan.com™ planning tool to prioritize the hazards. This prioritization was based on a calculated priority risk index (CPRI) that considered four elements of risk: probability, magnitude/severity, warning time, and duration. Table 3.5 defines the rankings for each element of risk. The CPRI for each hazard is provided in Table 3.6.

Neosho County DRAFT 3.9 Multi-Hazard Mitigation Plan January 2009
Table 3.5 Calculated Priority Risk Index (CPRI) Element Definitions
Element/Level Characteristics Probability 4 - Highly Likely Event is probable within the calendar year.
Event has up to 1 in 1 year chance of occurring (1/1=100%) History of events is greater than 33% likely per year. Event is "Highly Likely" to occur
3 – Likely Event is probable within the next three years. Event has up to 1 in 3 years chance of occurring (1/3=33%) History of events is greater than 20% but less than or equal to 33% likely per year Event is "Likely" to occur
2 – Occasional Event is probable within the next five years. Event has up to 1 in 5 years chance of occurring (1/5=20%) History of events is greater than 10% but less than or equal to 20% likely per year Event could "Possibly" occur
1 – Unlikely Event is possible within the next 10 years Event has up to 1 in 10 years chance of occurring (1/10=10%) History of events is less than or equal to 10% likely per year Event is "Unlikely" but is possible of occurring
Magnitude / Severity** 4 - Catastrophic Multiple deaths
Complete shutdown of facilities for 30 or more days More than 50 percent of property is severely damaged
3 – Critical Injuries and/or illnesses result in permanent disability Complete shutdown of critical facilities for at least two weeks 25–50 percent of property is severely damaged
2 – Limited Injuries and/or illnesses do not result in permanent disability Complete shutdown of critical facilities for more than one week 10–25 percent of property is severely damaged
1 – Negligible Injuries and/or illnesses are treatable with first aid Minor quality of life lost Shutdown of critical facilities and services for 24 hours or less Less than 10 percent of property is severely damaged
Warning Time 4 Less Than 6 Hours 3 6-12 Hours 2 12-24 Hours 1 24+ Hours Duration 4 More Than 1 Week 3 Less Than 1 Week 2 Less Than 1 Day 1 Less Than 6 Hours
Source: MitigationPlan.com™ * Based on history, using the definitions given, the likelihood of future events is quantified. ** According to the severity associated with past events or the probable worst case scenario possible in the state.
Using the ranking described in the table above, the formula used to determine each hazard’s CPRI, which includes weighting factors defined by MitigationPlan.com™, was:
(Probability x .45) + (Magnitude/Severity x .30) + (Warning Time x .15) + (Duration x .10) = CPRI

Neosho County DRAFT 3.10 Multi-Hazard Mitigation Plan January 2009
Based on their CPRI scores, the hazards were separated into three categories of planning significance: High (2.5-4.0), Moderate (2.0-2.5), and Low (1.1-1.9).
These terms relate to the level of planning analysis to be given to the particular hazard in the risk assessment process and are not meant to suggest that a hazard would have only limited impact. In order to focus on the most critical hazards, those assigned a level of significant or moderate were given more extensive attention in the remainder of this analysis (e.g., quantitative analysis or loss estimation), while those with a low planning significance were addressed in more general or qualitative ways. Table 3.6 summarizes the results of the completed Hazard Profiles using this methodology.
Table 3.6 Hazard Profile Summary, Neosho County
Hazard Type Probability Magnitude Warning
Time Duration CPRI Planning
Significance Tornado Highly Likely-4 Critical-3 4 1 3.4 High Winter Storm Highly Likely-4 Limited-2 2 3 3.00 High Agricultural Infestation Highly Likely-4 Limited-2 1 4 2.95 Moderate Windstorm Highly Likely-4 Limited-2 2 2 2.90 Moderate Flood Likely-3 Critical-3 2 3 2.85 Moderate Utility / Infrastructure Failure
Likely-3 Limited-2 4 3 2.85 Moderate
Hailstorm Highly Likely-4 Limited-2 2 1 2.80 Moderate Dam and Levee Failure Likely-3 Critical-3 2 1 2.65 Moderate Drought Likely-3 Limited-2 1 4 2.50 Moderate Wildfire Likely-3 Negligible-1 4 2 2.45 Moderate Extreme Heat Likely-3 Limited-2 1 3 2.40 Moderate Lightning Likely-3 Negligible-1 2 1 2.05 Moderate Expansive Soils Occasional-2 Negligible-1 1 4 1.75 Low Soil Erosion & Dust Occasional-2 Negligible-1 1 4 1.75 Low Earthquake Unlikely-1 Negligible-1 4 1 1.45 Low
Source: HMPC Notes: Measures for Probability and Magnitude were determined by the Neosho County HMPC. Warning times and duration for each hazard were obtained from the Kansas Hazard Mitigation Plan, Appendix E.

Neosho County DRAFT 3.11 Multi-Hazard Mitigation Plan January 2009
3.2.2 Agricultural Infestation
Description
Agricultural infestation is a naturally occurring infection of crops or livestock that renders them unfit for consumption or use. Typical causes can include insects, vermin, fungus, or diseases transferable amongst animals. The types and severity of agricultural infestations vary based on many factors, including cycles of heavy rains and drought. Because of the substantial importance of the agricultural industry in Kansas, agricultural infestation poses a risk to the economy of the entire state.
A certain level of agricultural infestation is normal for Kansas farmers and ranchers. The concern is when the level of an infestation escalates suddenly, or a new infestation appears that overwhelms local control efforts. The potential introduction of animal diseases, such as foot and mouth disease and bovine spongiform encephalopathy disease is a key concern. The Kansas Center for Community Economic Development (KCCED) reports that cattle and milk production in Neosho County averaged $16.0 million per year from 2002-2005. The importance of this agricultural sector makes the potential for a contagious disease outbreak in livestock a continuing, significant threat to the economy of the County. Field crops are also subject to various types of infestation. Wheat is susceptible to leaf rust, wheat streak mosaic, barley yellow dwarf virus, strawbreaker, and tan spot. Significant wheat crop losses due to these diseases are well documented in Kansas. Sorghum losses can occur when a crop is infected with sooty stripe early in the growing season. Gray leaf spot is a growing problem for corn crops. The KCCED reports that the average value of crop harvests in Neosho County from 1990-2005 was $19.6 million. The significance of this agricultural sector in the local economy makes crop infestation a serious concern.
Insect infestation can cause major losses to stored grain. The estimated damage to stored grain from the lesser grain borer, rice weevil, red flour beetle, and rusty grain beetle in the United States is approximately $500 million annually. Onset of agricultural infestation can be rapid. Controlling an infestation’s spread is critical to limiting impacts through methods including quarantine, culling, premature harvest and/or crop destruction when necessary. Duration is largely affected by the degree to which the infestation is aggressively controlled, but is generally more than one week. Warning time is typically more than 24 hours. Maximizing warning time is also critical for this hazard, and is most affected by methodical and accurate monitoring and reporting of livestock and crop health and vigor, including both private individuals and responsible agencies.
Warning Time: Level 1—less than 6 hours
Duration: 4—more than one week

Neosho County DRAFT 3.12 Multi-Hazard Mitigation Plan January 2009
Geographic Location
All agricultural areas of the planning area are subject to agricultural infestations, though if a major infestation event were to occur the entire county would be affected. There is 341,000 acres classified as farm land in Neosho County according to the 2006 Kansas Agricultural Statistics Service. This represents 92.5 percent of total land area in the county.
On a statewide basis, annual wheat yield loss in Kansas has averaged 4.0 percent over the previous 20 years according to the Kansas State University Department of Plant Pathology. The western and northeastern parts of the state of Kansas were somewhat less susceptible to leaf rust in 2007, a common disease affecting wheat crops. This geographic distribution for leaf rust corresponds with areas of the state with somewhat lower utilization of the land for crops and rangeland, and fewer feedlots. Figure 3.1 shows areas of moderate (yellow) and severe (red) leaf rust disease pressure in 2007.
Figure 3.1. Leaf Rust Disease Pressure, Kansas 2007
Source: Kansas State Department of Agriculture, Kansas Cooperative Plant Disease Survey Report: Preliminary 2007 Kansas Wheat Disease Loss Estimates, www.ksda.gov/plant_protection/content/183/cid/611 Notes: Red = High to Severe, Yellow = Moderate. Blue square indicates approximate location of Neosho County

Neosho County DRAFT 3.13 Multi-Hazard Mitigation Plan January 2009
Other crop diseases and their primary locations include those listed in the following table:
Table 3.7. Kansas Crop Disease Regions
Disease/Fungus Primary Kansas Region Primary Crop Affected Septoria leaf disease Eastern 2/3 of Kansas Wheat, produce Tan spot Eastern 2/3 of Kansas Wheat Stripe rust Entire state Wheat Powdery mildew Eastern 2/3 of Kansas Produce, vine crops Scab Eastern 2/3 of Kansas Wheat Source: USDA Agricultural Research Service
The USDA Agricultural Research Service notes the most serious threat to wheat and cereal crops globally is stem rust race Ug99. This fungus is spreading across Africa, Asia, and most recently into the Middle East and is considered a serious threat to global food security.
Previous Occurrences
During the summers of 1855 and 1874, the region of Kansas that includes Neosho County experienced extensive crop damage due to grasshopper infestations. Historical accounts of the 1874 event state: "The sky was literally darkened by the hordes of insects as they came in from the Rocky Mountains to the west." (Barnhart, 1881).
In 2002, the state experienced a foot and mouth scare. The outbreak was ultimately determined not to be foot and mouth, but the episode demonstrated the level of concern in the community, the importance of accurate monitoring and rapid response. In 2003, the first confirmed domestic case of BSE disease was reported in Washington State and required quarantines and the destruction of several herds. According to the USDA Risk Management Agency, there were no insured crop losses in Neosho County as a result of agricultural infestation from 2005 to 2007.
Probability of Future Occurrences
Neosho County experiences some degree of agricultural losses each year as a result of naturally-occurring agricultural infestations.
High Likely: Event is probable within the next three years.
Magnitude/Severity
Limited— Injuries and/or illnesses do not result in permanent disability. Complete shutdown of critical facilities for more than one week with 10–25 percent of property is severely damaged.
Hazard Summary
Calculated Priority Risk Index Planning Significance 2.95 Moderate

Neosho County DRAFT 3.14 Multi-Hazard Mitigation Plan January 2009
3.2.3 Dam and Levee Failure
Description
The Kansas Department of Agriculture Division of Water Resources defines a state-regulated “dam” as any artificial barrier including appurtenant works with the ability to impound water, wastewater, or other liquids that has a height of 25 feet or more; or has a height of six feet or greater and also has the capacity to impound 50 or more acre feet. The height of the dam is measured from the downstream toe to the top of the dam if a watercourse is affected or from the lowest elevation of the outside limit of the dam to the top of the dam for barriers that do not extend across a stream or watercourse. Dam failure can be caused by simple structural failure, or any combination of the following factors:
• earthquake • flood conditions leading to overtopping • inadequate spillway capacity • internal erosion • improper design • improper maintenance • arson • negligent operation • failure of upstream dams
The failure of dams or levees can result in injuries, loss of life, and damage to property and the environment. While levees are built solely for flood protection, dams often serve multiple purposes, one of which may be flood control. Severe flooding and other storms can increase the potential that dams and levees will be damaged and fail as a result of the physical force of the flood waters or overtopping.
Dams and levees are usually engineered to withstand a flood with a computed risk of occurrence. If a larger flood occurs, then that structure will likely be overtopped. If during the overtopping, the dam fails or is washed out, the water behind is released as a flash flood. Failed dams can create floods that are catastrophic to life and property, in part because of the tremendous energy of the released water.
The hazard potential for dam failure is classified according to the following definitions accepted by the Interagency Committee on Dam Safety:
• Low Hazard Potential—Failure or misoperation results in no probable loss of human life and low economic and/or environmental losses. Losses are principally limited to the owner’s property.

Neosho County DRAFT 3.15 Multi-Hazard Mitigation Plan January 2009
• Significant Hazard Potential—Failure or misoperation results in no probable loss of human life but can cause economic loss, environmental damage, disruption of lifeline facilities, or other impacts. Significant hazard potential classification dams are often located in predominantly rural or agricultural areas but could be located in areas with population and significant infrastructure.
• High Hazard Potential—Failure or misoperation will probably cause loss of human life.
Speed of onset depends largely on the causal factors. Dam failure can occur in as little as a few minutes or slowly over the course of many months; warning time will vary accordingly. In the event of a catastrophic failure of a large dam, evacuation time at locations directly downstream would be extremely brief. Floodplain characteristics largely determine the available warning time for locations further downstream but overall warning time is typically less than 6 hours. Duration of high water conditions that result from dam failure depends on the capacity and stage of the reservoir at time of breach as well as the severity of the breach, but is generally less than one week.
The Dam Safety Program in Kansas is part of the broader Water Structures Program of the Kansas Department of Agriculture, Division of Water Resources. The Kansas Stream Obstructions Act (K.S.A. 82a-301 through 305a) gives the Chief Engineer, Kansas Department of Agriculture - Division of Water Resources the exclusive authority to regulate the construction, operation and maintenance of dams in Kansas. The written consent or permit of the Chief Engineer is required to construct a dam or make changes in any dam as required by the Act. The Chief Engineer has the power and duty to inspect any dam. The Chief may issue orders requiring correction of deficiencies or removal of the dam. An annual inspection of all dams found to be unsafe is required until the deficiency is corrected or the dam is removed. Where a dam condition is so dangerous as to pose an immediate safety threat, the Chief Engineer shall immediately employ any remedial means considered necessary. The Chief Engineer shall continue in full charge and control of any such dam until it is considered safe or the emergency prompting the remedial action has ceased.
Dams and levees are usually engineered to withstand a flood with a computed risk of occurrence. If a larger flood occurs, then that structure will likely be overtopped. If during the overtopping, the dam fails or is washed out, the water behind is released as a flash flood. Failed dams can create floods that are catastrophic to life and property, in part because of the tremendous energy of the released water. The Planning Committee determined, after review of available data, the federal and state inspection of dams and Dam Incident Notices would give adequate notice of dam condition problems well in advance of a breach.
Warning Time: Level 2— 12 to 24 hours
Duration: 4—more than one week

Neosho County DRAFT 3.16 Multi-Hazard Mitigation Plan January 2009
Geographic Location
According to data from the National Inventory of Dams, Neosho County has 63 state or federal regulated dams. Of those, two are high hazard dams, one is a significant hazard dam, 58 are low hazard dams and two are undetermined. The two high hazard dams and one significant hazard dam are described below:
• Lake Parsons Dam—This high hazard dam is located on Labette Creek forms Lake Parsons, a community lake in Neosho County, which is used for drinking water purposes. Construction of the dam was completed in 1959, and it is the property of the city of Parsons in Labette County. The Lake is located 3 miles north on highway 59 and 4 miles west on 40th road from the city of Parsons. It holds 980 acres of water and covers 980 surface acres. The dam is 52 feet high and is regulated by the Kansas Department of Water Resources. Because it drains downstream into Labette County, it does not impact any structures in Neosho County.
• L.D.H., Inc. Lake Dam—This high hazard dam and the lake it forms is owned by L.D.H. Farms, Inc. of Chanute, Kansas. The earthen dam impounds water from Turkey Creek and was completed in 1989. It is privately owned but is regulated by the Kansas Department of Water Resources. It is 24 feet high and is used for recreational purposes.
• Marion P. Stevens Dam—This significant hazard dam impounds water on the Big Creek and forms Stevens Lake, owned by the Stevens family. The dam is of earthen construction, is 642 feet long and 26 feet high. The dam creates a farm pond which is not state regulated.
The impoundment structure at Santa Fe Lake, located on Little Turkey Creek within the city limits of Chanute was originally classified as a levee, but was recently re-classified as a dam during the re-mapping effort that produced the preliminary digital flood insurance rate maps. According to the preliminary FEMA Flood Insurance Study for the re-mapping effort, this structure has little storage area and cannot be considered as a flood protection structure.
Figure 3.2 below shows the locations of dams in Neosho County.

Neosho County DRAFT 3.17 Multi-Hazard Mitigation Plan January 2009
Figure 3.2. Neosho County Dams

Neosho County DRAFT 3.18 Multi-Hazard Mitigation Plan January 2009
There are three reservoirs constructed by the U.S. Army Corps of Engineers outside of Neosho County that provide flood control for communities along the Neosho River (including Erie and Chanute in Neosho County). Construction of the Council Grove, Marion, and John Redmond Reservoirs on the upper reaches of the Cottonwood and Neosho watersheds has served to partially control flooding from the Neosho River to the communities in Neosho County. Since these reservoirs re at over 80 miles upstream of major communities in Neosho County, their effect is to reduce, not prevent flooding. These dams have been quite effective in reducing the flood peaks in Neosho River since their completion (Neosho County Preliminary Flood Insurance Study, 2008). Information on these reservoirs and dams is listed below:
• Marion Reservoir is located on the Cottonwood River three miles northwest of Marion in Marion County, Kansas. The project was placed in full flood control operation in 1968. Maximum discharge is 132,000 cubic feet per second (cfs). The flood of record occurred in June and July 1951 with a peak discharge of 54,000 cfs and a volume of 78,950 acre-feet which is equivalent to 7.4 inches of runoff from the drainage area above the dam site.
• Council Grove Reservoir is located on the Neosho River one and a half miles northwest of Council Grove in Morris County, Kansas. Construction of the project began in June 1960. The project was placed in full flood control operation in1964. Spillway capacity at maximum pool is 49,400 cfs. Channel capacity below the dam site is 3,100 cfs. The flood of record occurred in June and July 1951 with a peak discharge of 121,000 cfs and a volume of 184,200 acre-feet, which is equivalent to 14.0 inches of runoff from the drainage area above the dam site
• John Redmond Dam is operated by the U.S. Army Corps of Engineers and is located in Coffey County on the Neosho River about three miles northwest of Burlington. Construction of the project began in June 1959. Closure of the embankment was completed in September 1963. The project was completed for full flood control operation in September 1964. All major construction was completed in December 1965. Ultimate development was initiated 1 January 1976 and the conservation pool elevation changed from 1036.0 to 1039.0. The dam rises to a maximum height of 86.5 feet above the streambed. The structure is 21,790 feet long which includes the lengths of the following components: earth fill embankment, 20,740 feet; concrete spillway including piers and abutments, 664 feet; and two concrete non-overflow bulkhead sections, 300 feet. The spillway is gated and concrete. The net opening of the structure is 560 feet and it is equipped with fourteen 40- by 35-foot-high retainer gates. Spillway capacity at the maximum pool (elevation 1074.5) is 578,000 cfs and at the top of the flood control pool (elevation 1068.0) is 428,000 cfs. Two 24-inch- diameter low-flow pipes are located through the left non-overflow section with a discharge capacity of 130 cfs at the spillway crest. A 30-inch-diameter water supply connection is provided for future use. Bank-full capacity of the channel below the dam site is 12,000 cfs. The flood of record for John Redmond Dam occurred in June and July 1951 with a peak discharge of 408,000 cfs and a volume of 2,030,000 acre-feet, which is equivalent to 12.62 inches of runoff from the drainage area above the dam site. The failure of this dam is a

Neosho County DRAFT 3.19 Multi-Hazard Mitigation Plan January 2009
concern to the residents of Neosho County. If this dam failed, Neosho County would be impacted.
Levees
Levee Systems constructed along the Neosho River and along portions of Little Turkey Creek and Chanute Drain (a.k.a. Second Street Channel) in and around Chanute serve to contain low-frequency flooding but are not adequate for major floods. The Flood Insurance Rate Map for Chanute dated 2001 depicted in Figure 3.3 provides the location of the levee along the Northeast city limit boundary that provides limited protection from flooding of the Neosho River.
Figure 3.3 Chanute Flood Insurance Rate Map, 2001
source: FEMA Map Service Center

Neosho County DRAFT 3.20 Multi-Hazard Mitigation Plan January 2009
Levees along the Neosho River south of the City of Erie corporate limits exist to protect agricultural land along the Neosho River. The level of protection, if any, provided to the City of Erie by these levees, is unknown (FEMA Flood Insurance Study for the City of Erie, 1993). There is also a levee south of Chanute along the Neosho that provides limited protection to portions of Erie. These levees are not depicted on the Flood Insurance Rate Map from 1993 or the Preliminary Digital Flood Insurance Rate Map as the level of protection is not known.
Previous Occurrences
During the June/July 2007 flood event, the levee south of Chanute on the Neosho River broke and water went over the top of the levee into Erie damaging businesses, churches, and several residences. On July 2, 2007, parts of the town of Erie, Kansas were flooded with up to four feet of water, as levees in the vicinity of Erie and Chanute, Kansas breeched in three places. About 100 people were evacuated to two shelters (FEMA National Situation Update, July 3, 2007, http://www.fema.gov/emergency/reports/2007/nat070307.shtm
In August, 2005, a levee broke one mile east of Ash Grove Cement Plant, leaving a 45 foot hole. This is the levee depicted on the map in figure 3.3. In the June/July 2007 event, this levee did not fail. But, it was overtopped. According to the Flood Insurance Study, the level of protection provided by this levee is unknown.
Information from the Kansas Department of Agriculture reveals that there have been no reported dam failures or previous Dam Incident Reports in Neosho County. The Association of State Dam Safety Officials (ASDSO) reports ten dam failures in the U.S. from 1990 to 2007, with none of these events occurring in Kansas.
Probability of Future Occurrences
Based frequency of previous occurrences (levee failures in 2005 and 2007) and the definitions set forth in the hazard profile methodology, probability of future dam or levee failure is likely. Levee failure has a higher probability than dam failure based on the past performances of these structures during flood events. However, because dam failure is a manmade hazard, the methodology for calculating probability based on past occurrences does not necessarily reflect the actual risk of future occurrence. The HMPC determined that although damages could be high in the event of a dam failure, probability of dam failure is low. Overall probability of future occurrence is considered occasional.
Occasional: Event is probable within the next five years
Magnitude/Severity
Most dams in Neosho County are low hazard and present small risk to the people and property. However, additional development downstream from these dams could elevate their hazard rating.
Neosho County DRAFT 3.21 Multi-Hazard Mitigation Plan January 2009
The HMPC reviewed data on dams in Neosho County, and determined that only two are classified as "High Hazard." Breach of the Lake Parsons Dam would impact Labette County rather than Neosho County. The other High Hazard dam, owned by LDH Farms, is relatively new, and unlikely to fail. The significant hazard dam creates a rural farm pond the breach of which would impact residents on the farm. The Kansas Water Plan -- Small Dam Safety and Rehabilitation Policy Section that was approved by the Kansas Water Authority on November 18, 2005, establishes policies and guidelines for dam safety in Kansas. Breach of John Redmond Reservoir Dam in nearby Coffey County would have more serious impacts to the planning area. A breach in the dam could flood residential, commercial, and agricultural areas downstream in the Neosho River basin, including the communities of Chanute, Erie, and St. Paul in Neosho County. Many other adverse social and economic consequences could occur. A 1982 document entitled "Operation and Maintenance Manual, Volume II, Contingency Plans for Emergencies", prepared by the U.S. Army Corps of Engineers includes information on the John Redmond Reservoir. In the event of a catastrophic event, the maps identified flood waters impacting the City of Humboldt in adjacent Allen County within approximately 20 hours, and impacting the Town of Erie in approximately 28 hours.
The John Redmond dam, along with Marion Reservoir Dam and Council Grove Reservoir Dam is owned and maintained by the Army Corps of Engineers, and subject to regularly scheduled inspection and maintenance activities. Data from the Association of State Dam Safety Officials indicates that since 1990, no dam failures had occurred involving U.S. Corps of Engineers dams.
Limited—10-25 percent of property severely damaged; shutdown of facilities for more than a week; and/or injuries/illnesses treatable do not result in permanent disability
Hazard Summary
Calculated Priority Risk Index Planning Significance 2.65 Moderate
3.2.4 Drought
Description
Drought is generally defined as a condition of moisture levels significantly below normal over a large area for an extended period of time that adversely affects plants, animal life, and humans. It can also be defined in terms of meteorology, agriculture, and hydrology. A drought period can last for months, years, or even decades. It is rarely a direct cause of death, though the associated heat, dust, and stress can all contribute to increased mortality. Based on information from the National Weather Service for 2006, drought was the nation’s second most costly natural hazard, causing $2.6 billion in property and crop damages (flooding caused $3.9 billion in damages).
Periods of drought are normal occurrences in all parts of Kansas. Drought in Kansas is caused by severely inadequate amounts of precipitation that adversely affect farming and ranching, surface

Neosho County DRAFT 3.22 Multi-Hazard Mitigation Plan January 2009
and ground water supplies, and uses of surface waters for navigation and recreation. Drought can cause significant economic and environmental impacts and also create favorable conditions for wildfires and wind erosion (see Section 3.3.x Wildfire and Section 3.3.x Soil Erosion and Dust).
Warning Time: 1—more than 24 hours
Duration: 4—more than one week
Geographic Location
As a regional phenomenon, drought can affect all areas of Neosho County with roughly the same frequency and severity. The impacts of prolonged drought are greatest across the 92 percent of the County that is used for agricultural purposes. Across the broader region that includes all of Kansas and the nation as a whole, Figure 3.4 below shows that Neosho County is situated in an area of eastern Kansas that experienced drought 10-14.9 percent of the time over the 100 year period from 1895-1995.
Figure 3.4. United States Percent of Time in Drought, 1895–1995
Note: Light blue square indicates the region of southeastern Kansas that includes Neosho County
Drought can lead to shortages in municipal water supplies due to deficiency of the raw water supply and greatly increased customer water demand. In other cases the raw water supply may remain adequate, but problems can be encountered due to limited treatment or distribution

Neosho County DRAFT 3.23 Multi-Hazard Mitigation Plan January 2009
capacity. A 2006 assessment was conducted of 800 city or rural water district drinking water systems by the Kansas Water Office to determine drought vulnerability. According to this assessment, Neosho County does not have any drought vulnerable public water suppliers. However, private wells are vulnerable. Table 3.8 provides information on the water systems in Neosho County.
Table 3.8 List of Water Systems in Neosho County
Water System Name Population
Served Primary Water Source Type Water System ID City of Chanute 9053 Surface water KS2013307 City of Erie 1683 Surface water KS2013310 City of Galesburg 149 Purchased surface water KS2013308 City of St. Paul 657 Surface water KS2013316 City of Thayer 499 Surface water KS2013312 Coal Hollow Water Company 57 Purchased surface water KS2013302 Neosho Co Cons RWD 1 472 Purchased surface water KS2013320 Neosho Co RWD 12 437 Purchased surface water KS2013321 Neosho Co RWD 2 1275 Purchased surface water KS2013314 Neosho Co RWD 3 128 Purchased surface water KS2013315 Neosho Co RWD 4 1018 Purchased surface water KS2013317 Neosho Co RWD 4A 975 Purchased surface water KS2013319 Neosho Co RWD 5 112 Purchased surface water KS2013311 Neosho Co RWD 6 510 Purchased surface water KS2013305 Neosho Co RWD 7 603 Purchased surface water KS2013303 Neosho Co RWD 8 275 Purchased surface water KS2013309 Neosho Co RWD 9 200 Purchased surface water KS2013301
Source: E-FM CONSULTING Hazard Analysis, 2006
Previous Occurrences
From 1933 to 1940, Neosho County was part of the “Dust Bowl,” a period of severe drought and wind erosion that impacted a broad region of the Midwest. Causes included an extended period of below average precipitation and years of land management practices that left the dry topsoil susceptible to wind erosion. This Dust Bowl period devastated the agricultural base of the Great Plans, including Neosho County, though the southeastern Kansas counties fared slightly better than the rest of the state.
The planning area was also severely affected by drought conditions from 1952 to 1957. During this period, rainfall totals were below normal and temperatures were above normal. In 1953, Neosho County was part of the driest area of the country. During this drought, President Eisenhower made $40 million available to 13 drought-stricken states, including Kansas.
Figure 3.5 shows the precipitation levels across the United States during the droughts in the 1930s and 1950s.

Neosho County DRAFT 3.24 Multi-Hazard Mitigation Plan January 2009
Figure 3.5 Historical Droughts 1953 and 1937
Source: National Oceanic and Atmospheric Administration, http://www.ncdc.noaa.gov/paleo/drought/images/temporal_spatial.jpg Note: Light blue squares indicates approximate location of Neosho County
Recent drought impacts that affecting Neosho County are provided below. Unless otherwise indicated, these impacts are from the National Drought Mitigation Center’s Drought Impact Reporter:
• 2006 to 2007—As a result of drought conditions in 2006, the USDA provided $948,511 to Kansas for the Livestock Assistance Grant Program. This program provided state block grants to the State of Kansas Department of Agriculture to help livestock producers recover forage production losses due to drought conditions in 2006. Eligible counties experienced exceptional drought at Category D3 or D4 on the U.S. Drought Monitor.
• 1996—In response to severe drought conditions, the USDA Rural Development Program gave $9.1 million to four states, including Kansas, to dig deeper wells and move intake valves into deeper areas of existing reservoirs.
• 1989—The Kansas Farm Bureau reported that 48 percent of the state winter wheat crop was lost, valued at $600 million. Due to a lack of water and forage, there was a 50 percent increase in cattle sent to auction. This drought covered 36 percent of the United States at its peak, compared to 70 percent of the country during the Dust Bowl of the 1930’s. This drought is considered the costliest in U.S. history.
From 2005 to 2007, Neosho County was included in two USDA disaster declarations that included drought. During the period from 2003 to 2007, Neosho County was included in one drought watch declaration and five drought warning declarations According to the point system

Neosho County DRAFT 3.25 Multi-Hazard Mitigation Plan January 2009
utilized by the Kansas Water Office, Neosho County received 11 points during this time frame. (1 point for each watch declaration, 2 points for each warning and 3 points for each emergency).
The National Drought Mitigation Center developed the Drought Impact Reporter in response to the need for a national drought impact database for the United States. Information comes from a variety of sources: online drought-related news stories and scientific publications, members of the public who visit the website and submit a drought-related impact for their region, members of the media, and members of relevant government agencies. The Drought Impact Reporter contains information on 60 drought impacts from droughts that affected Neosho County between 1989 and 2008. The list is not comprehensive. Most of the impacts (32) were classified as “agriculture.” Other impacts include, “fire” (4), “environment” (7), “water/energy” (8), and “other” (9). Definitions for these categories are described below:
• Agriculture—Impacts associated with agriculture, farming, and ranching. Examples include damage to crop quality, income loss for farmers due to reduced crop yields, reduced productivity of cropland, insect infestation, plant disease, increased irrigation costs, cost of new or supplemental water resource development, reduced productivity of rangeland, forced reduction of foundation stock, closure/limitation of public lands to grazing, high cost/unavailability of water for livestock, and range fires.
• Water/Energy—Impacts associated with surface or subsurface water supplies (i.e., reservoirs or aquifers), stream levels or streamflow, hydropower generation, or navigation. Examples include lower water levels in reservoirs, lakes, and ponds; reduced flow from springs; reduced streamflow; loss of wetlands; estuarine impacts; increased groundwater depletion, land subsidence, reduced recharge; water quality effects; revenue shortfalls and/or windfall profits; cost of water transport or transfer; cost of new or supplemental water resource development; and loss from impaired navigability of streams, rivers, and canals.
• Environment—Impacts associated with wildlife, fisheries, forests, and other fauna. Examples include loss of biodiversity of plants or wildlife; loss of trees from urban landscapes, shelterbelts, wooded conservation areas; reduction and degradation of fish and wildlife habitat; lack of feed and drinking water; greater mortality due to increased contact with agricultural producers, as animals seek food from farms and producers are less tolerant of the intrusion; disease; increased vulnerability to predation; migration and concentration; and increased stress to endangered species.
• Fire—Impacts associated with forest and range fires that occur during drought events. The relationship between fires and droughts is very complex. Not all fires are caused by droughts and serious fires can result when droughts are not taking place.
• Other—Drought impacts that do not easily fit into any of the above categories.
According to the USDA Risk Management Agency, Insured crop losses in Neosho County as a result of drought conditions from 2005 to 2007 totaled $1,767,040. Table 3.9 provides additional details regarding the affected crops and amounts per year.

Neosho County DRAFT 3.26 Multi-Hazard Mitigation Plan January 2009
Table 3.9 Claims Paid in Neosho County for Crop Loss as a Result of Drought
Year Crop Hazard Claims Paid ($) 2005 Corn Drought $9,511 2005 Grain Sorghum Drought $13,476 2005 Soybeans Drought $121,558 2006 Wheat Drought $25,064 2006 Corn Drought $362,190 2006 Grain Sorghum Drought $33,407 2006 Soybeans Drought $1,128,985 2007 Corn Drought $9,421 2007 Soybeans Drought $63,428 Total $1,767,040
Source: USDA Risk Management Agency, 2008
Probability of Future Occurrences
According to the Palmer Drought Severity Index 1895-1995, Neosho County, Kansas experienced severe and extreme drought 10-14.9 percent of the time during that 100-year period, which equates to an occasional probability of occurrence. As a result of drought conditions that have occurred during the most recent decade, the HMPC determined that this hazard should receive a probability ranking of “likely”
Likely: Event is probable within the next three years
Magnitude/Severity
Drought impacts are wide-reaching and may be economic, environmental, and/or societal. The most significant impacts associated with drought in Kansas are those related to agriculture. As discussed in the profile on Agricultural Infestation, the agricultural industry provides the economic base for Neosho County. A prolonged drought could have severe economic impacts.
Drought conditions can also cause soil to compact and not absorb water well, potentially making an area more susceptible to flooding. An ongoing drought may also leave an area more prone to wildfires. Water supply can also be of concern during periods of prolonged drought. However, as previously mentioned, Neosho does not have any public water suppliers considered to be drought vulnerable by the Kansas Water Office. Drought impacts increase with the length of a drought.
Limited—10-25 percent of property severely damaged; shutdown of facilities for more than a week; and/or injuries/illnesses treatable do not result in permanent disability
Hazard Summary
Calculated Priority Risk Index Planning Significance 2.05 Moderate

Neosho County DRAFT 3.27 Multi-Hazard Mitigation Plan January 2009
3.2.5 Earthquake
Description
An earthquake is sudden motion or trembling of the ground caused by shifting tectonic plates. Earthquakes are potentially catastrophic, capable of causing multiple fatalities and major structural and infrastructure damage including disruption of utilities, communications, and transportation systems. Secondary affects can include landslides, seiches, liquefaction, fires, and dam failure. Earthquakes occur very abruptly with little or no warning. However, seismic monitoring in certain cases can detect increases in the geologic and seismic activity that precedes an earthquake event. Duration typically ranges from a few seconds to a minute or two, but aftershocks can occur during the hours and weeks after the quake, usually with diminishing frequency and intensity.
Warning Time: 4—less than six hours
Duration: 1—less than six hours.
Geographic Location
Overall, Neosho County is in an area of relatively low seismic activity. The closest series of faults called the Humboldt Fault Zone runs through Riley and Pottawatomie counties and extends south along the Nemaha Ridge also known as the Nemaha Uplift.
Figure 3.6 below shows the locations of minor earthquakes recorded by the Kansas Geological Survey between August 1977 and August 1989. The locations of earthquakes are indicated by blue points size coded by local magnitude. Locations of faults are indicated by green lines. The largest event had a magnitude of 4.0 and the smallest had a magnitude of 0.8 on the Richter scale. No seismic events were recorded in or near Neosho County.

Neosho County DRAFT 3.28 Multi-Hazard Mitigation Plan January 2009
Figure 3.6. Locations of Faults and Historic Micro-Earthquakes in Kansas
Source: Kansas Geological Survey, http://www.kgs.ku.edu/Publications/pic3/pic3_4.html Note: Light blue square indicates approximate location of Neosho County
The New Madrid Seismic Zone follows the Mississippi River valley from southeastern Missouri to northwestern Mississippi, roughly 180 miles southeast of Neosho County. While it is unlikely that Neosho County would receive extensive damage from a large New Madrid Seismic Zone event, it is possible that ground shaking would be noticed.
Based on the location of Neosho County relative to seismically active areas, earthquake risk is similar across the entire planning area, including all participating jurisdictions.
Previous Occurrences
At least 25 earthquakes were recorded by the Kansas Geological Survey between August 1876 and 1976 (Figure 3.7), but none are recorded in Neosho County. Kansas experiences small earthquakes on a routine basis, but few are of a magnitude that causes damage to buildings or the infrastructure. According to a 2001 FEMA report, Kansas ranks 45th among the states in the amount of damage caused by earthquakes in an average year.

Neosho County DRAFT 3.29 Multi-Hazard Mitigation Plan January 2009
Figure 3.7. Historical Earthquakes in Kansas Prior to 1977
Source: US Geologic Survey (USGS), http://earthquake.usgs.gov/regional/states/kansas/hazards.php Note: Light blue square indicates location of Neosho County
Probability of Future Occurrences
Figure 3.8. below indicates the probability of an magnitude 4.5+ earthquake in Neosho County over a 100 year time period, estimated to be 1.0 to 1.5 percent. This probability equates roughly to a 6,700-10,000 year recurrence interval. Based on these estimates the probability of a significant earthquake in any given year is unlikely.
Unlikely: History of events is less than or equal to 10 percent likely per year.

Neosho County DRAFT 3.30 Multi-Hazard Mitigation Plan January 2009
Figure 3.8. Earthquake Probability: Magnitude �4.75 within 50 Kilometers in 100 Years
Source: U.S. Geological Survey, http://eqint.cr.usgs.gov/eqprob/2002/index.php Note: Black square indicates approximate location of Neosho County
Magnitude/Severity
The amount of energy released during an earthquake is most commonly expressed on the moment magnitude scale and is measured directly from energy released from the fault or epicenter as recorded on seismographs. Another measure of earthquake magnitude is intensity. Intensity is an expression of the amount of shaking at any given location on the surface as felt by humans and defined by the Modified Mercalli Intensity Scale. It is typically the greatest cause of losses to structures during earthquakes and is determined by many factors including distance from epicenter and soil types. Table 3.10 features abbreviated descriptions of the 12 levels of intensity.

Neosho County DRAFT 3.31 Multi-Hazard Mitigation Plan January 2009
Table 3.10. Modified Mercalli Intensity (MMI) Scale
MMI Felt Intensity I Not felt except by a very few people under special conditions. Detected mostly by instruments. II Felt by a few people, especially those on upper floors of buildings. Suspended objects may swing. III Felt noticeably indoors. Standing automobiles may rock slightly. IV Felt by many people indoors, by a few outdoors. At night, some people are awakened. Dishes, windows, and
doors rattle. V Felt by nearly everyone. Many people are awakened. Some dishes and windows are broken. Unstable
objects are overturned. VI Felt by everyone. Many people become frightened and run outdoors. Some heavy furniture is moved. Some
plaster falls. VII Most people are alarmed and run outside. Damage is negligible in buildings of good construction,
considerable in buildings of poor construction. VIII Damage is slight in specially designed structures, considerable in ordinary buildings, great in poorly built
structures. Heavy furniture is overturned. IX Damage is considerable in specially designed buildings. Buildings shift from their foundations and partly
collapse. Underground pipes are broken. X Some well-built wooden structures are destroyed. Most masonry structures are destroyed. The ground is
badly cracked. Considerable landslides occur on steep slopes. XI Few, if any, masonry structures remain standing. Rails are bent. Broad fissures appear in the ground. XII Virtually total destruction. Waves are seen on the ground surface. Objects are thrown in the air.
Source: Multi-Hazard Identification and Risk Assessment, FEMA 1997
Figure 3.9 below indicates that there is a 2.0 percent probability of an earthquake exceeding a peak acceleration of 4.0 percent gravity in the next 50 years in Neosho County. Typically, significant earthquake damage occurs when accelerations are greater than 30 percent of gravity.
Figure 3.9. Kansas Seismic Hazard Map—Peak Acceleration (%g) with 2.0 Percent Probability of Exceedance in 50 Years
Source: U.S. Geological Survey, http://earthquake.usgs.gov/regional/states/kansas/hazards.php Note: Black square indicates approximate location of Neosho County

Neosho County DRAFT 3.32 Multi-Hazard Mitigation Plan January 2009
Negligible: Less than 10 percent of property severely damaged, shutdown of facilities and services for less than 24 hours; and/or injuries/illnesses treatable with first aid.
Hazard Summary
Calculated Priority Risk Index Planning Significance 1.45 Low 3.2.6 Expansive Soils
Description
A relatively widespread geologic hazard for Kansas is the presence of soils that expand and shrink in relation to their water content. Expansive soils can cause physical damage to building foundations, roadways, and other components of the infrastructure when clay soils swell and shrink due to changes in moisture content. For Kansas, the vulnerability to this hazard most frequently is associated with soils shrinking during periods of drought.
Warning Time: 1—less than 24 hours
Duration: 4—more than one week
Geographic Location
Figure 3.10 shows a map of the swelling potential of soils in Kansas. All of Neosho County is located in an area where part of the soil unit (generally less than 50 percent) consists of clay having slight to moderate swelling potential. More detailed data on how these soils vary within the Neosho County planning area was not available. Therefore, for the purposes of this plan, the hazard is considered to affect all participating jurisdictions.

Neosho County DRAFT 3.33 Multi-Hazard Mitigation Plan January 2009
Figure 3.10 Swelling Soils Map of Kansas
MAP LEGEND
Unit contains abundant clay having high swelling potential Part of unit (generally less than 50%) consists of clay having high swelling potential Unit contains abundant clay having slight to moderate swelling potential Part of unit (generally less than 50%) consists of clay having slight to moderate swelling potential Unit contains little or no swelling clay Data insufficient to indicate clay content of unit and/or swelling potential of clay
Source: U.S. Geological Survey, http://arcvoid.com/surevoid_web/soil_maps/ks.html Note: Black square indicates approximate location of Neosho County
Previous Occurrences
Streets and parking lots throughout the county are damaged every year by the effects of expansive soils. The frequency of damage from expansive soils can be associated with the cycles of drought and heavy rainfall, which reflect changes in moisture content. The effects of shrink-swell cycles in expansive soils are cumulative, and in most cases are associated with accelerated wear and tear on roads, sidewalks and building foundations. There is no data regarding incidents of damages resulting from expansive soils. These damages are largely isolated incidents and affected property owners make any necessary repairs.
Probability of Future Occurrences
Although there will continue to be some damage to paved areas and foundations in Neosho County due to swelling soils, it is unlikely that these damages will become greater in the future

Neosho County DRAFT 3.34 Multi-Hazard Mitigation Plan January 2009
unless new development occurs in areas where the hazard is more severe. Certain buildings and construction practices could be put in place to lessen these impacts. The HMPC determined that significant damage to assets in the planning area is occasional in any given year.
Occasional: Event is probable within the next five years
Magnitude/Severity
The HMPC determined that the impacts to the planning area from expansive soils are, for the most part, minor in damage and handled by individual property owners.
Negligible: Less than 10 percent of property severely damaged, shutdown of facilities and services for less than 24 hours; and/or injuries/illnesses treatable with first aid
Hazard Summary
Calculated Priority Risk Index Planning Significance 1.75 Low 3.2.7 Extreme Heat
Description
Extreme temperature events, both hot and cold, can have severe impacts on human health and mortality, natural ecosystems, agriculture, and other economic sectors. According to information provided by FEMA, extreme heat is defined as temperatures that hover 10 degrees or more above the average high temperature for the region and last for several weeks. Ambient air temperature is one component of heat conditions, with relative humidity being the other. The relationship of these factors creates what is known as the apparent temperature. The Heat Index chart shown in Figure 3.11. uses both of these factors to produce a guide for the apparent temperature or relative intensity of heat conditions.

Neosho County DRAFT 3.35 Multi-Hazard Mitigation Plan January 2009
Figure 3.11 Heat Index (HI) Chart
Source: National Weather Service (NWS) Note: Exposure to direct sun can increase Heat Index values by as much as 15°F. Note on the HI chart the shaded zone above 105°F. This corresponds to a level of HI that may cause increasingly severe heat disorders with continued exposure and/or physical activity.
From 1995-2006, there were 230 fatalities in the U.S. attributed to are summer heat. According to the National Weather Service, among natural hazards, no other natural disaster—not lightning, hurricanes, tornadoes, floods, or earthquakes—takes a greater toll. Table 3.11 below shows number of heat related fatalities per year form 1995-2006.

Neosho County DRAFT 3.36 Multi-Hazard Mitigation Plan January 2009
Table 3.11 Extreme Heat Fatalities, U.S. 1995-2006
Year Heat Related Fatalities 1995 1,021 1996 36 1997 81 1998 173 1999 502 2000 158 2001 166 2002 167 2003 36 2004 6 2005 158 2006 253
Total 2757 Annual Avg. (1995-2006) 230 Source: National Weather Service, http://www.weather.gov/os/hazstats/images/67-years.pdf
Those at greatest risk for heat-related illness include infants and children up to four years of age, people 65 years of age and older, people who are overweight, and people who are ill or on certain medications. However, even young and healthy individuals are susceptible if they participate in strenuous physical activities during hot weather. In agricultural areas, the exposure of farm workers, as well as livestock, to extreme temperatures is a major concern.
Table 3.12 lists typical symptoms and health impacts of exposure to extreme heat.
Table 3.12.Typical Health Impacts of Extreme Heat
Heat Index (HI) Disorder 80-90° F (HI) Fatigue possible with prolonged exposure and/or physical activity 90-105° F (HI) Sunstroke, heat cramps, and heat exhaustion possible with prolonged exposure
and/or physical activity 105-130° F (HI) Heatstroke/sunstroke highly likely with continued exposure
Source: National Weather Service Heat Index Program, www.weather.gov/os/heat/index.shtml
The National Weather Service has a system in place to initiate alert procedures (advisories or warnings) when the Heat Index is expected to have a significant impact on public safety. The expected severity of the heat determines whether advisories or warnings are issued. A common guideline for issuing excessive heat alerts is when the maximum daytime Heat Index is expected to equal or exceed 105 degrees Fahrenheit (°F) and the night time minimum Heat Index is 80°F or above for two or more consecutive days.
Warning Time: 1—more than 24 hours
Duration: 4—more than one week

Neosho County DRAFT 3.37 Multi-Hazard Mitigation Plan January 2009
Geographic Location
The entire planning area is subject to extreme heat events and all participating jurisdictions can be affected.
Previous Occurrences
During the period from 1960-2005, the NCDC database lists one incident of extreme heat in Neosho County in July 2006. From July 16-20, 2006 a deadly heat wave gripped much of central, south-central and southeast Kansas, and temperatures peaked in the 105-110 °F degree range, with afternoon heat indices about the same. The cover of darkness provided little in the way of relief, as overnight temperatures were slow to fall off, reaching only the upper 70s by sunrise for some locations. The prolonged heat claimed five lives across south-central and southeast Kansas, most of them elderly men. Three occurred in Wichita, one in Iola, and another in Coffeyville. There were three additional fatalities unofficially attributed to the heat wave of 2006, two in Wichita and one in Coffeyville. Additionally, dozens of individuals across central, south-central and southeast Kansas were treated for heat-related illnesses.
During 2005-2007, Neosho County received USDA emergency designations three times for excessive heat, twice in 2006, and once in 2007.
Figure 3.12 graphs the record temperatures by month from 1948 to 2007.
Figure 3.12 Daily Temperature Averages and Extremes, Chanute 1948-2007
- Extreme Max. is the maximum of all daily maximum temperatures recorded for the day of the year. - Ave. Max. is the average of all daily maximum temperatures recorded for the day of the year. - Ave. Min. is the average of all daily minimum temperatures recorded for the day of the year. - Extreme Min. is the minimum of all daily minimum temperatures recorded for the day of the year.
Source: High Plains Regional Climate Center, http://www.hprcc.unl.edu/data/historical/index.php?state=ks&action=select_state&submit=Select+State

Neosho County DRAFT 3.38 Multi-Hazard Mitigation Plan January 2009
As shown in table 3.13 below, during the period from 1948-2007, the National Weather Service Station at Chanute, KS recorded an annual average of 51.1 days over 90 degrees Fahrenheit and an average of 3 days below zero degrees Fahrenheit.
Table 3.13 Temperature Maximum and Minimum Chanute, KS, 1948-2007
Month # Days >= 90° F # Days <= 32° F # Days <= 32° F # Days <= 0° F Daily High Temperature Daily Low Temperature
January 0 8.3 27.2 1.6 February 0 4.2 21 0.7 March 0 1 14 0 April 0.1 0 2.9 0 May 0.9 0 0 0 June 7.4 0 0 0 July 18.5 0 0 0 August 17.2 0 0 0 September 6.3 0 0 0 October 0.6 0 1.8 0 November 0 0.8 13.3 0 December 0 4.8 24.3 0.7 Annual 51.1 19.1 104.5 3
High Plains Regional Climate Center Table updated on Sep 19, 2007
Based in information from the USDA Risk Management Agency, insured crop losses in Neosho County as a result of extreme heat conditions from 2005 to 2007 totaled $4,443. Details are provided in Table 3.14.
Table 3.14 Claims Paid in Neosho County for Crop Loss as a Result of Extreme Heat
Year Crop Claims Paid ($) 2006 Corn $2,961 2006 Soybeans $1,482 Total $4,443
Source: USDA Risk Management Agency
Probability of Future Occurrences
Although periods of extreme heat generally occur on an annual basis, events that cause significant health impacts occur less frequently. Based on patterns of previous occurrences, probability of future occurrence is considered likely.
Likely: Event is probable within the next three years.
Magnitude/Severity
The HMPC notes that instability of the electrical grid has been an issue during periods of extreme heat. Specific dates of occurrence were not available. The resulting intermittent power

Neosho County DRAFT 3.39 Multi-Hazard Mitigation Plan January 2009
outages increased the effects of extreme heat as some residents were not able to seek relief in air conditioned homes and buildings.
Due to the potential for fatalities and the possibility for the loss of electric power, periods of extreme heat can severely affect the planning area. In addition, accompanying drought may compound the problem exacerbating agricultural and economic losses.
Limited—10-25 percent of property severely damaged; shutdown of facilities for more than a week; and/or injuries/illnesses treatable do not result in permanent disability Calculated Priority Risk Index Planning Significance 2.4 Moderate 3.2.8 Flood
Description
There are several different types of potential flood events in Neosho County including riverine, flash flooding, and urban stormwater. Riverine flooding is defined as when a watercourse exceeds its “bank-full” capacity and is the most common type of flood event. Riverine flooding generally occurs as a result of prolonged rainfall, or rainfall that is combined with soils already saturated from previous rain events. The area adjacent to a river channel is its floodplain. In its common usage, “floodplain” most often refers to that area that is inundated by the 100-year flood, the flood that has a 1 percent chance in any given year of being equaled or exceeded. The 1 percent annual flood is the national standard to which communities regulate their floodplains through the National Flood Insurance Program.
Factors that directly affect the amount of flood runoff include precipitation, intensity and distribution, the amount of soil moisture, seasonal variation in vegetation, and water-resistance of the surface areas due to urbanization. The term "flash flood" describes localized floods of great volume and short duration. In contrast to riverine flooding, this type of flood usually results from a heavy rainfall on a relatively small drainage area. Precipitation of this sort usually occurs in the spring and summer. Urban flood events result as land loses its ability to absorb rainfall as it is converted from fields or woodlands to roads, buildings, and parking lots. Urbanization increases runoff two to six times over what would occur on undeveloped terrain.
The onset of flooding varies depending on the cause and type. Flash flooding and dam/levee failure inundation typically occur with little or no warning, whereas flooding caused by long periods of excessive rainfall tends to have longer duration but more gradual onset. Overall warning time is usually 6-12 hours. The duration of flood conditions is generally less than one week, but in exceptional cases can extend for much longer periods.
Warning Time: 2—12-24 hours

Neosho County DRAFT 3.40 Multi-Hazard Mitigation Plan January 2009
Duration: 3—less than one week
Geographic Location
Of the eight jurisdictions participating in this plan, four are currently participating in the National Flood Insurance Program: Neosho County, Chanute, Erie, and St. Paul all participate in the National Flood Insurance Program and have Flood Insurance Rate Maps designating the 100-year flood hazard. Flooding in Neosho County has recently been re-studied and FEMA has issued preliminary Digital Flood Insurance Rate Maps. These new maps will become effective in June 2009 and are provided in this document for planning purposes only.
Earlton, Galesburg, Stark, and Thayer are not currently in the NFIP. Thayer is in the process of completing the paperwork necessary for participation.
The primary large-scale flood threat to communities in Neosho County is the Neosho River which has a drainage area of over 4100 square miles upstream of the northern county boundary. Although the preliminary Digital Flood Insurance Rate Maps (DFIRM) are now available, the best available data for flooding in Neosho County during the vulnerability analysis phase of this planning effort was HAZUS-MH MR3, FEMA’s software program for estimating potential losses from disasters. HAZUS was used to generate a one percent annual flood, or 100-year flood, event for major rivers and creeks in the County. The software produces a flood polygon and flood depth grid that represent the 100-year flood. While not as accurate as official flood maps these floodplain boundaries are for use in GIS-based loss estimation. Figure 3.13 is a map of Neosho County’s 100-year floodplain as generated by HAZUS-MH MR3 with an overlay of the preliminary DFIRM. As the map displays, the 100-year floodplain boundaries created by the HAZUS flood model are fairly consistent with the preliminary DFIRM floodplain boundaries. Figures 3.14 through 3.20 on the following pages provide this same comparison for the individual cities within the planning area.

Neosho County DRAFT 3.41 Multi-Hazard Mitigation Plan January 2009
Figure 3.13. Neosho County Preliminary DFIRM and HAZUS 100-year Floodplain

Neosho County DRAFT 3.42 Multi-Hazard Mitigation Plan January 2009
Chanute
Chanute lies within the watershed of the Neosho River which flows in a southerly direction approximately one mile east of the city. Three tributaries of the Neosho River provide drainage for the city. Village Creek, located just outside the northern city limits drains the northern and western portions of the city. Runoff from the central portion of the city flows to Chanute Drain and the southernmost areas of the city are served by Little Turkey Creek. The primary large-scale flood threat to Chanute and the surrounding area is the Neosho River. Short-term local flooding may occur along Little Turkey Creek and Chanute Drain. Intense rainfall from thunderstorms may produce flash flooding on the tributaries, whereas floods on the Neosho River are generally caused by less intense rainfall of several days’ duration over a large area. (FEMA Flood Insurance Study for Chanute, 2001). The map in Figure 3.14 displays the 100-year floodplain as generated by HAZUS-MH MR3 with an overlay of the preliminary DFIRM for the City of Chanute.

Neosho County DRAFT 3.43 Multi-Hazard Mitigation Plan January 2009
Figure 3.14 Chanute Preliminary DFIRM and HAZUS 100-year Floodplain

Neosho County DRAFT 3.44 Multi-Hazard Mitigation Plan January 2009
Erie
The Neosho River rises in the Flint Hills region in Morris County, Kansas and flows in a southeasterly direction past Erie approximately one mile to the south. Puckets Run Creek is a small tributary to the Neosho River, which flows in a southerly direction through the east-central portion of the community. The drainage area contributing to Puckets Run Creek is about 3.4 square miles above the southern corporate limits. The floodplain for Puckets Run Creek is relatively narrow and will range from about 400 to 1,200 feet wide through the city with the higher value influenced by the backwater effect of the Neosho River. The tributary of Puckets Run Creek flows in a southwesterly direction, draining an area of about 1.0 square mile. The Neosho River floodplain in the vicinity of Erie is relatively undeveloped, with the exception of a few small houses, the city’s sewage disposal ponds, and some roads and railroad tracks. Development in the floodplains of Puckets Run Creek and its tributary consists of several residences, a few small businesses, a church, gas and electric utilities, the city’s fire station, several roads, and two railroad tracks (Erie Flood Insurance Study, FEMA, 1993).
The greatest potential for flooding in the Erie vicinity is due to the Neosho River. The city’s location about one mile from the river and the gradual upward slope places most of the community above the 100-year flood level. However, backwater from the river will flood the low lying land along Puckets Run Creek extending into the southeastern portion of the city. Major floods on the Neosho River have extended to the area within the present corporate limits several times in past years (Erie Flood Insurance Study, FEMA, 1993). The map in Figure 3.15 displays the 100-year floodplain as generated by HAZUS-MH MR3 with an overlay of the preliminary DFIRM for the City of Erie.

Neosho County DRAFT 3.45 Multi-Hazard Mitigation Plan January 2009
Figure 3.15. Erie Preliminary DFIRM and HAZUS 100-year Floodplain

Neosho County DRAFT 3.46 Multi-Hazard Mitigation Plan January 2009
St. Paul
The map in Figure 3.16 displays the 100-year floodplain as generated by HAZUS-MH MR3 with an overlay of the preliminary DFIRM for the City of St. Paul. As show in the map, the southwest portion of the city lies in the floodplain of the Neosho River
Figure 3.16 St. Paul Preliminary DFIRM and HAZUS 100-Year Floodplain

Neosho County DRAFT 3.47 Multi-Hazard Mitigation Plan January 2009
Thayer
The original flood hazard boundary map created for the City of Thayer did not indicate a floodplain in city limits and the map was later rescinded by FEMA. However, with the annexation of the land to the southwest of the original city limits around the Thayer Lake, floodplain now exists within current city limits. At this time, this area is not very developed. The map in Figure 3.17 displays the 100-year floodplain as generated by HAZUS-MH MR3 with an overlay of the preliminary DFIRM for the City of Thayer.
Figure 3.17 Thayer Preliminary DFIRM and HAZUS 100-year Floodplain

Neosho County DRAFT 3.48 Multi-Hazard Mitigation Plan January 2009
Although the Cities of Earlton, Galesburg, and Stark are not officially participating jurisdictions in this current planning effort, maps are provided to show the locations of the 100-year floodplain. The maps in Figures 3.18 through 3.20 display the 100-year floodplain as generated by HAZUS-MH MR3 with an overlay of the preliminary DFIRM for the Cities of Earlton, Galesburg, and Stark.
Figure 3.18 Earlton Preliminary DFIRM and HAZUS 100-year Floodplain

Neosho County DRAFT 3.49 Multi-Hazard Mitigation Plan January 2009
Figure 3.19 Galesburg Preliminary DFIRM and HAZUS 100-year Floodplain

Neosho County DRAFT 3.50 Multi-Hazard Mitigation Plan January 2009
Figure 3.20 Stark Preliminary DFIRM and HAZUS 100-year Floodplain

Neosho County DRAFT 3.51 Multi-Hazard Mitigation Plan January 2009
Previous Occurrences
There have been 17 recorded flood events in Neosho County between 1951 and 2007, including seven federal disaster declarations. Flooding impacts are described below for events where information is available. Descriptions of the nine flood events from 1993 to 2008 that did not result in disaster declarations were obtained from the NCDC database. Information on the flood of 1951 and prior events was obtained from the U.S. Geological Survey, FEMA Flood Insurance Studies, and the U.S. Army Corps of Engineers.
• FEMA-1711-DR: Severe Storms and Flooding—July 2, 2007. Extremely heavy rainfall from the end of June into early July caused flooding and flash flooding throughout Neosho County. The flash flooding and the ensuing river flooding in Chanute resulted in roughly 100 homes being destroyed and another 50 sustaining major damage. Approximately 500 citizens were displaced by the flood and some areas of the city were cut off from gas and electric service (Chanute Tribute, 7/2/2007). This event resulted in at least $10.5 million dollars in damages. An additional $1.5 million dollars in damage was reported to public infrastructure. The levy north of Chanute on the Neosho River broke and water went over the top of the levee into the northern part of Erie along Puckets Run and south to the River. The only grocery store in was destroyed. Several businesses, churches, and 11 residences in Erie were affected. Only three of the residences affected had flood insurance. The only road open to Erie was from the north. All other access roads into town were flooded (City of Erie, 2008). During this event, the Neosho River reached a record crest of 40.6 feet on the morning of July 2nd. This was 11.6 feet above flood stage. Major flooding was seen on the Neosho at Chanute when a crest of 36.82 feet was recorded on the morning of July 1st. The Neosho inundated the city of Chanute with some areas under as much as 7 to 8 feet of water. The river remained above flood stage at Chanute until July 4th and at Erie until July 5th. The most extreme measured rainfall reports from June 28th - 30th were 18.29 inches at Fredonia, 12.47 inches at Independence, 11.70 inches at Iola, 9.18 inches at Chanute, 8.63 inches at Erie and 8.40 inches at Coffeyville.
• June 12, 2007, Flash Flood. Numerous roads were closed in the northeast portion of the county including Piatt Road near Odense and US Highway 59 west of Stark. A reported $70,000 in damages occurred.
• August 25, 2005, Flash Flood. Many roads and highways in Chanute were barricaded in and around town, including Highways 39 and 57. A levee broke one mile east of Ash Grove Cement Plant, leaving a 45 foot hole.
• May 13, 2004, Flash Flood. Coon Creek and other local streams overflowed their banks. • June 12, 2002, Flash Flood. Highway 169 flooded six to eight inches deep one mile south of
Earlton. • May 24, 2002, Flash Flood. Walnut Street in Erie flooded with one foot of water. • May 8, 2002, flash Flood. Numerous roads across the county were covered with water. • May 7, 2002, Flash Flood. Numerous roads across Thayer were covered by water.

Neosho County DRAFT 3.52 Multi-Hazard Mitigation Plan January 2009
• FEMA-1258-DR: Severe Storms and Flooding—November 15, 1998. In Neosho County, $500,000 damage occurred mainly due to partial failure of a levy in Chanute
• June 9, 1995, Flash Flood. Numerous Streets were under water and many county roads were closed.
• April 24, 1994, Flood. Ten inches of rain in 24 hours caused the Neosho River to rise above flood stage. Extensive flooding occurred across southeast Kansas. The flooding closed many schools and roads. In Chanute, the river crested 9.5 feet above flood stage.
• July 10-13, 1951, Flood. According to the Chanute Flood Insurance Study (FEMA, 2001), the greatest flood of record at Chanute occurred in July 1951 when the Neosho River stage reached 38..6 feet (over 18 feet above flood stage). Discharge was most likely in excess of 400,000 cubic feet per second (cfs), considerably greater than that of a 100-year frequency flood. The 1951 flood was the result of abnormal precipitation throughout the state during the months of May and June followed by heavy rainfall in the basin from July 9 to July 13, 1951. Sever damage to crops and structures occurred as a result of this flood. Neosho County reported that 435 homes and over 1,000 farms or other buildings were damaged or destroyed. One person was killed and 22 persons injured during the flood (U.S. Department of the Army, Corps of Engineers, Tulsa District, Floodplain Information, Neosho and Cottonwood Rivers, Kansas, June 1965).
Other major floods have occurred on the Neosho River in 1926, 1927, 1928, 1943, 1944, 1945, 1948, and 1961. The July 1948 flood was of approximately 100-year magnitude. There are also accounts of a great flood in 1844 that may have been greater than the 1951 flood. (Chanute Flood Insurance Study, FEMA, 2001; Erie Flood Insurance Study, FEMA, 1993).
From 2005 to 2007, Neosho County received three USDA declarations that involved excessive moisture. According to the USDA Risk Management Agency, Insured crop losses in Neosho County as a result of flood conditions and excessive moisture from 2005 to 2007 totaled $4,539,373. Details are provided in Table 3.15.

Neosho County DRAFT 3.53 Multi-Hazard Mitigation Plan January 2009
Table 3.15 Claims Paid in Neosho County for Crop Loss as a Result of Flood and Excessive Moisture
Year Crop Hazard Claims Paid 2005 Wheat Excess Moisture/Precip/Rain $287,875 2005 Corn Excess Moisture/Precip/Rain $8,766 2005 Grain Sorghum Excess Moisture/Precip/Rain $6,992 2005 Soybeans Excess Moisture/Precip/Rain $114,236 2006 Soybeans Excess Moisture/Precip/Rain $12,371 2007 Wheat Excess Moisture/Precip/Rain $778,833 2007 Oats Excess Moisture/Precip/Rain $2,193 2007 Corn Excess Moisture/Precip/Rain $627,241 2007 Grain Sorghum Excess Moisture/Precip/Rain 69,138 2007 Soybeans Excess Moisture/Precip/Rain $1,047,438 2005 Corn Flood $27,063 2005 Grain Sorghum Flood $129 2005 Soybeans Flood $132,223 2007 Wheat Flood $114,968 2007 Corn Flood $876,432 2007 Grain Sorghum Flood $27,323 2007 Soybeans Flood $406,152 Total $4,539,373
Source: USDA’s Risk Management Agency, April, 2008
Probability of Future Occurrences
Records for the period 1993 to 2007 indicate that there were 16 flood events in 14 years, an average of more than one per year. Minor flooding occurs on an annual basis, damaging floods occur roughly once every three years. Based on this level of frequency, probability of future flooding with significant impacts in Neosho County are considered likely.
Likely: Event is probable within the next three years
Magnitude/Severity
Past flood events in Neosho County have caused significant damage to property and agriculture, endangered lives, and shut down critical facilities and infrastructure.
Critical: 25-50 percent of property severely damaged; shutdown of facilities for at least two weeks; and/or injuries and/or illnesses result in permanent disability
Hazard Summary
Calculated Priority Risk Index Planning Significance 2.85 Moderate

Neosho County DRAFT 3.54 Multi-Hazard Mitigation Plan January 2009
3.2.9 Hailstorm
Description
Hailstorms in Kansas cause damage to property, crops, and the environment, and harm livestock. Because of the large agricultural industry in Kansas, crop damage and livestock losses due to hail are of great concern to the state. Even relatively small hail can cause serious damage to crops and trees. Vehicles, roofs of buildings and homes, and landscaping are the other things most commonly damaged by hail. Hail has been known to cause injury and the occasional fatality to humans, often associated with traffic accidents.
Hail is associated with thunderstorms that can also bring powerful winds and tornadoes. A hailstorm forms when updrafts carry raindrops into extremely cold areas of the atmosphere where they condense and freeze. Hail falls when it becomes heavy enough to overcome the strength of the updraft and is pulled by gravity towards the earth. The onset of hailstorms is generally rapid. Duration is less than 6 hours and warning time is generally less than 6 hours.
Based on information provided by the Tornado and Storm Research Organization, Table 3.16 below describes typical damage impacts of the various sizes of hail.

Neosho County DRAFT 3.55 Multi-Hazard Mitigation Plan January 2009
Table 3.16. Tornado and Storm Research Organization Hailstorm Intensity Scale
Intensity Category
Diameter (mm)
Diameter (inches)
Size Description Typical Damage Impacts
Hard Hail 5-9 0.2-0.4 Pea No damage
Potentially Damaging
10-15 0.4-0.6 Mothball Slight general damage to plants, crops
Significant 16-20 0.6-0.8 Marble, grape Significant damage to fruit, crops, vegetation
Severe 21-30 0.8-1.2 Walnut Severe damage to fruit and crops, damage to glass and plastic structures, paint and wood scored
Severe 31-40 1.2-1.6 Pigeon's egg > squash ball
Widespread glass damage, vehicle bodywork damage
Destructive 41-50 1.6-2.0 Golf ball > Pullet's egg
Wholesale destruction of glass, damage to tiled roofs, significant risk of injuries
Destructive 51-60 2.0-2.4 Hen's egg Bodywork of grounded aircraft dented, brick walls pitted
Destructive 61-75 2.4-3.0 Tennis ball > cricket ball
Severe roof damage, risk of serious injuries
Destructive 76-90 3.0-3.5 Large orange > Soft ball
Severe damage to aircraft bodywork
Super Hailstorms
91-100 3.6-3.9 Grapefruit Extensive structural damage. Risk of severe or even fatal injuries to persons caught in the open
Super Hailstorms
>100 4.0+ Melon Extensive structural damage. Risk of severe or even fatal injuries to persons caught in the open
Source: Tornado and Storm Research Organisation (TORRO), Department of Geography, Oxford Brookes University Notes: In addition to hail diameter, factors including number and density of hailstones, hail fall speed and surface wind speeds affect severity.
Warning Time: 4—less than 6 hours
Duration: Level 1—less than 6 hours
Geographic Location
The entire planning area, including all participating jurisdictions, is at risk to hailstorms.
Previous Occurrences
The NCDC reports 113 hail events in Neosho County between 1955 and February 2008. Table 3.17 below shows the number of hail events by the size of the hail. These events caused a reported $1.06 million in property damages and $41,000 in crop damages.

Neosho County DRAFT 3.56 Multi-Hazard Mitigation Plan January 2009
Table 3.17. Neosho County Hail Events, 1960-2008
Hail Size (inches)
Number of Events 1960 to 2008
0.75 38 0.88 6 1.00 23 1.25 5 1.50 1 1.75 30 2.00 2 2.50 2 2.75 4 3.00 1 4.50 1
Source National Climatic Data Center Storm Events Database
Notable event details provided by the NCDC are summarized below:
• August 9, 1998. Tennis ball to softball-sized hail pelted a one square mile section on the south side of Lake Parsons, inflicting extensive damage to boats, tents, campers, vehicles, buildings and crops.
• April 12, 1993. A thunderstorm dropped hail as large as two inches in diameter in Chanute and across northern Neosho County. The hail covered the ground in Chanute and north of Erie accumulating to several inches in depth west of Shaw. More than 200 vehicles were damaged.
Probability of Future Occurrences
Based on NCDC data, there were 123 hail events in Neosho County from 1955-2008, an average of 2.3 each year. Hail events producing hail 1.75 inches and larger occurred 43 times over the same 53 year period. Based on the frequency of previous occurrences of storms producing hail 1.75 inches and larger, the probability of such an event in any given year is roughly 80 percent. There were two events during this period of hail over three inches. The probability of a hail event of this magnitude is four percent in any given year.
Regarding probability based on time of year, Figure 3.21 shows the daily probability of a hailstorm occurrence for Neosho County. Probability is highest in the spring months and overall probability is highest in the most recent reporting period.

Neosho County DRAFT 3.57 Multi-Hazard Mitigation Plan January 2009
Figure 3.21. Daily Hailstorm Probability, 2” Diameter or Larger, Neosho County 1980-1994
Source: National Severe Storms Laboratory, http://www.nssl.noaa.gov/hazard/hazardmap.html
Figure 3.22 is based on hailstorm data from 1980-1994. It shows the probability of hailstorm occurrence (2” diameter or larger) based on number of days per year within a 12.5 mile radius of a given point on the map.

Neosho County DRAFT 3.58 Multi-Hazard Mitigation Plan January 2009
Figure 322. Annual Hailstorm Probability (2’’ diameter or larger), United States 1980-1994
Source: NSSL, http://www.nssl.noaa.gov/users/brooks/public_html/bighail.gif Note: Black rectangle indicates approximate location of Allen County
Highly Likely: History of events is greater than 33% likely per year.
Magnitude/Severity
In addition to concerns for public safety, assets that are vulnerable to hail damage include crops and built structures. Of these, crop damage from hailstorms is the most common and costly. Large hail can devastate crops that are at vulnerable stages in the plant/harvest cycle, and it is possible for a great percentage of crop yields to be lost as a result of even a single hail event.
Structure damage due to hail is usually covered under private insurance. The NCDC reports that $1.1 million in property and crop damage occurred from 1993-1998. Information on specific structural damage costs in the planning area as a result of hail damage was not available.
Limited: 10-25 percent of property severely damaged; shutdown of facilities for more than a week; and/or injuries/illnesses treatable do not result in permanent disability
Hazard Summary
Calculated Priority Risk Index Planning Significance 2.8 Moderate

Neosho County DRAFT 3.59 Multi-Hazard Mitigation Plan January 2009
3.2.10 Lightning
Description
Severe thunderstorms strike Kansas on a regular basis with high winds, heavy rains, and the occasional subsequent flooding, often accompanied by lightning. Lightning is an electrical discharge between positive and negative regions of a thunderstorm. It is sudden, extremely destructive and potentially deadly. The National Weather Service reports that lightning caused 48 fatalities and 246 injuries nationwide in 2006 and causes 73 fatalities and 300 injuries in an average year.
The National Lightning Safety Institute reports that lightning causes more than 26,000 fires in the United States each year. The institute estimates that the total cost for direct and indirect impacts of lightning including property damage, increased operating costs, production delays, and lost revenue to be in excess of $6 billion per year.
Due to its nature as a powerful electrical phenomenon, lightning causes extensive damage to electronic systems that it contacts. A particular concern in Kansas is the protection of facilities and communications systems that are critical for maintaining emergency response systems, protecting public health, and maintaining the state’s economy.
Average duration of each lightning stroke is 30 microseconds and duration of lightning storm events is usually less than six hours. Thunderstorm forecasting and warning time for lightning occurrence is generally less than six hours.
Warning Time: 4—less than six hours
Duration: 1—less than six hours
Geographic Location
Lightning affects broad regions including any portion of the planning area. Neosho County is located in an area of eastern Kansas with the highest frequency of thunderstorms and lightning flashes in the state. Figures 3.23 and 3.24 below show the region that includes Neosho County averages 50-70 days with thunderstorms per year per 10,000 square miles and four to eight lightning strikes per square kilometer per year.

Neosho County DRAFT 3.60 Multi-Hazard Mitigation Plan January 2009
Figure 3.23. Distribution and Frequency of Thunderstorms
Source: Oklahoma Climatological Survey Note: Black square indicates approximate location of Allen County
Figure 3.24. Annual Frequency of Lightning in Kansas, 1996-2000
Source: National Weather Service, www.lightningsafety.noaa.gov/lightning_map.htm Note: Black square indicates approximate location of Allen County
Previous Occurrences
The NCDC database has record of four damaging lightning events in Neosho County from 1993 to February 2008.

Neosho County DRAFT 3.61 Multi-Hazard Mitigation Plan January 2009
• April 23, 1993. Lightning struck a home in St. Paul and damaged all the electrical wiring and appliances. There was no fire, but the fire department doused a few "hot spots" in the attic insulation. Televisions and telephones were also damaged at several other nearby homes.
• October 13, 1994. Lightning struck a tree and started a house fire. • May 13, 2004. Van struck in parking lot of Chanute SRS Office. Concussion of resultant
thunderclap of sufficient magnitude to shatter 10 large windows and an unspecified number of smaller windows. The lightning strike also produced two craters in the pavement beneath the vehicle's right tires, the right rear tire being deflated (Chanute Tribune, May 2004).
• June 1, 2007. Lightning struck a residence in the city of Chanute the evening of June 1st. (Chanute Tribune, June 2007).
With a population of 16,529, Neosho County is among the more sparsely populated counties of the state. As a result, some number of lightning events may go unreported because they do not cause identifiable damage or were not witnessed.
Probability of Future Occurrences
According to National Weather Service data, Allen County receives four to eight lightning strikes per square kilometer per year. Most of these lightning strikes do not result in damages. The HMPC classifies probability of future occurrence as likely in any given year.
Likely: Event is probable within the next three years
Magnitude/Severity
Although the frequency of lightning events is high, the magnitude is negligible. Generally damages are limited to single buildings and in most cases, personal hazard insurance covers any losses. The major concern identified by the HMPC is that communication towers and facilities are vulnerable to lightning strikes.
Negligible: Less than 10 percent of property severely damaged, shutdown of facilities and services for less than 24 hours; and/or injuries/illnesses treatable with first aid.
Hazard Summary
Calculated Priority Risk Index Planning Significance 2.05 Moderate
3.2.11 Soil Erosion and Dust
Description
Soil erosion and dust are both ongoing problems for Kansas. Both can cause significant loss of valuable agricultural soils, damage crops, harm environmental resources, and have adverse economic impacts. Soil erosion in Kansas is largely associated with periods of drought (wind

Neosho County DRAFT 3.62 Multi-Hazard Mitigation Plan January 2009
erosion) and flooding (streambank erosion). Improper agricultural and grazing practices can also contribute to soil erosion.
The United States is losing soil 10 times faster than the natural replenishment rate, and related production losses cost the nation $37.6 billion each year. Wind erosion is responsible for about 40 percent of this loss and can increase markedly in drought years. Wind erosion physically removes the lighter, less dense soil constituents such as organic matter, clays and silts. Thus it removes the most fertile part of the soil and lowers soil productivity, which can result in lower crop yields or poorer grade pastures and increase economic costs.
Streambank erosion, which can remove agricultural land and damage transportation systems and utility lines, occurs each year, particularly in the spring. A large proportion of all soil eroded ends up in rivers, streams, and lakes, which makes waterways more prone to flooding and contamination. One type of streambank erosion occurs after heavy rains when water is released from reservoirs causing water levels to rise in rivers and streams. The dry soil at the top of embankments becomes saturated. When reservoir gates are closed and flows return to normal, water levels suddenly drop and the heavy wet soil at the top of the embankments falls into the rivers and streams below.
Erosion increases the amount of dust carried by wind. Dust can also threaten agriculture and have economic impacts by reducing seedling survival and growth, increasing the susceptibility of plants to certain stressors, and damaging property and equipment (e.g., clogging machinery parts). It is also a threat to health and safety. It acts as an abrasive and air pollutant and carries about 20 human infectious disease organisms (including anthrax and tuberculosis). There is evidence that there is an association between dust and asthma. Some studies indicate that as much as 20 percent of the incidence of asthma is related to dust. Blowing dust can be severe enough to necessitate highway closures because of low visibility, which can cause vehicle accidents.
Erosion also creates a problem by filling in reservoirs with silt, negatively impacting storage capacity and water quality. Because of differing climatic conditions, land uses, and physical attributes in the various watersheds, sedimentation rates vary among the reservoirs. In 2001, the Kansas Water Office completed a report that projected the effect of sedimentation on State-owned storage in federal reservoirs. By the year 2040, sedimentation was projected to reduce the total amount of State-owned storage from 1.2 million acre-feet to roughly 857,000 acre-feet, a rate of loss of 6,260 acre-feet per year.
Warning Time: 1—more than 24 hours
Duration: 4—more than one week
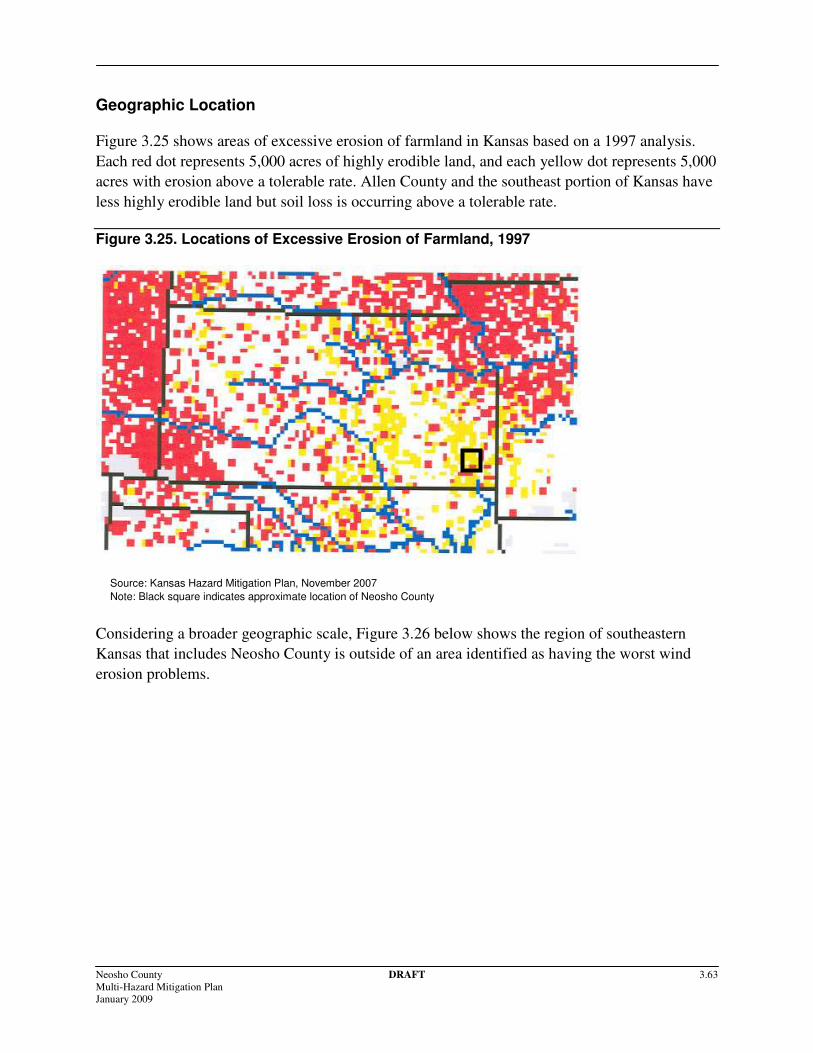
Neosho County DRAFT 3.63 Multi-Hazard Mitigation Plan January 2009
Geographic Location
Figure 3.25 shows areas of excessive erosion of farmland in Kansas based on a 1997 analysis. Each red dot represents 5,000 acres of highly erodible land, and each yellow dot represents 5,000 acres with erosion above a tolerable rate. Allen County and the southeast portion of Kansas have less highly erodible land but soil loss is occurring above a tolerable rate.
Figure 3.25. Locations of Excessive Erosion of Farmland, 1997
Source: Kansas Hazard Mitigation Plan, November 2007 Note: Black square indicates approximate location of Neosho County
Considering a broader geographic scale, Figure 3.26 below shows the region of southeastern Kansas that includes Neosho County is outside of an area identified as having the worst wind erosion problems.

Neosho County DRAFT 3.64 Multi-Hazard Mitigation Plan January 2009
Figure 3.26. United States Wind Erosion Areas
Source: U.S. Department of Agriculture Agricultural Research Service Wind Erosion Research Unit, www.weru.ksu.edu/ Note: Blue square indicates approximate location of Neosho County
Previous Occurrences
There are no dust storm events listed in the NCDC database. Previous occurrences of notable soil erosion in the planning area have occurred during flood events. These impacts are discussed in the flood hazard profile.
Probability of Future Occurrences
While soil erosion and dust occur annually as part of natural processes, the adverse effects of erosion are only fully realized as a cumulative function. Therefore, the probability of notable effects from soil erosion and dust events is considered occasional; meaning the cumulative effect of annual events reaches a notable level on the average of every five years.
Occasional: Event is probable within the next five years
Magnitude/Severity
Negligible: Less than 10 percent of property severely damaged, shutdown of facilities and services for less than 24 hours; and/or injuries/illnesses treatable with first aid
Hazard Summary
Calculated Priority Risk Index Planning Significance 1.75 Low

Neosho County DRAFT 3.65 Multi-Hazard Mitigation Plan January 2009
3.2.12 Tornado
Description
The National Weather Service defines a tornado as a “violently rotating column of air extending from a thunderstorm to the ground.” Tornadoes are the most violent of all atmospheric storms and are capable of tremendous destruction. Wind speeds can exceed 250 mph, and damage paths can be more than one mile wide and 50 miles long. In an average year, more than 900 tornadoes are reported in the United States, resulting in approximately 80 deaths and more than 1500 injuries. High winds not associated with tornadoes are profiled separately in this document in Section 3.2.13 Windstorm.
Although tornadoes have been documented on every continent, they occur most frequently in the United States east of the Rocky Mountains. Kansas is situated in an area that is generally known as “Tornado Alley.” Climatological conditions are such that warm and cold air masses meet in the center of the country to create conditions of great instability and fast moving air at high pressure that can ultimately result in formation of tornado funnels.
In Kansas, most tornadoes and tornado-related deaths and injuries occur during the months of April, May, and June. However, tornadoes have struck in every month. Similarly, while most tornadoes occur between 3:00 and 9:00 p.m., a tornado can strike at any time.
Prior to February 1, 2007, tornado intensity was measured by the Fujita (F) scale. This scale was revised and is now the Enhanced Fujita scale. Both scales are sets of wind estimates (not measurements) based on damage. The new scale provides more damage indicators (28) and associated degrees of damage, allowing for more detailed analysis, better correlation between damage and wind speed. It is also more precise because it takes into account the materials affected and the construction of structures damaged by a tornado.
Table 3.18 shows the wind speeds associated with the original Fujita scale ratings and the damage that could result at different levels of intensity. Table 3.19 shows the wind speeds associated with the Enhanced Fujita Scale ratings. The Enhanced Fujita Scale’s damage indicators and degrees of damage can be found online at www.spc.noaa.gov/efscale/ef-scale.html.

Neosho County DRAFT 3.66 Multi-Hazard Mitigation Plan January 2009
Table 3.18. Original Fujita Scale
Fujita (F) Scale Fujita Scale
Wind Estimate (mph) Typical Damage F0 < 73 Light damage. Some damage to chimneys; branches
broken off trees; shallow-rooted trees pushed over; sign boards damaged.
F1 73-112 Moderate damage. Peels surface off roofs; mobile homes pushed off foundations or overturned; moving autos blown off roads.
F2 113-157 Considerable damage. Roofs torn off frame houses; mobile homes demolished; boxcars overturned; large trees snapped or uprooted; light-object missiles generated; cars lifted off ground.
F3 158-206 Severe damage. Roofs and some walls torn off well-constructed houses; trains overturned; most trees in forest uprooted; heavy cars lifted off the ground and thrown.
F4 207-260 Devastating damage. Well-constructed houses leveled; structures with weak foundations blown away some distance; cars thrown and large missiles generated.
F5 261-318 Incredible damage. Strong frame houses leveled off foundations and swept away; automobile-sized missiles fly through the air in excess of 100 meters (109 yards); trees debarked; incredible phenomena will occur.
Source: National Oceanic and Atmospheric Administration Storm Prediction Center, www.spc.noaa.gov/faq/tornado/f-scale.html
Table 3.19. Enhanced Fujita Scale
Enhanced Fujita (EF) Scale
Enhanced Fujita Scale Wind Estimate (mph)
EF0 65-85 EF1 86-110 EF2 111-135 EF3 136-165 EF4 166-200 EF5 Over 200
Source: National Oceanic and Atmospheric Administration Storm Prediction Center, www.spc.noaa.gov/faq/tornado/ef-scale.html
Warning Time: 4—typical warning time is less than six hours
Duration: 1—typical duration is less than six hours
Geographic Location
While tornadoes can occur in all areas of the State of Kansas, historically, some areas of the state have been more susceptible to this type of damaging storm. Figure 3.26 illustrates the number of F3, F4, and F5 tornadoes recorded in the United States per 3,700 square miles between 1950 and

Neosho County DRAFT 3.67 Multi-Hazard Mitigation Plan January 2009
1998. Neosho County is in the section shaded dark orange, indicating 16-25 tornadoes of this magnitude during this 48-year period.
Figure 3.26. Tornado Activity in the United States
Note: Blue square indicates approximate location of Neosho County
Previous Occurrences
According to the NCDC database, there were 28 tornadoes in Neosho County between 1954 and May 2008. There were no reported deaths and four injuries. Reported property damages totaled over $3.5 million. Of these 28 events, seven were rated F2 and one was rated F3. Table 3.20 summarizes these events.
Table 3.20. Recorded Tornadoes in Neosho County, 1954-2008
Location or County Date Time Magnitude Injuries Estimated
Damages ($) Neosho County May 31, 1954 3:30 PM F2 0 25,000 Neosho County May 31, 1954 3:30 PM F2 0 25,000 Neosho County July 23, 1955 4:30 PM F0 0 0 Neosho County October 4, 1959 1:50 PM F1 0 0 Neosho County April 29, 1960 3:07 PM F1 0 3,000 Neosho County May 19, 1960 7:40 PM F1 0 0 Neosho County April 26, 1964 10:20 AM F0 0 0 Neosho County March 8, 1973 7:50 PM F2 1 250,000

Neosho County DRAFT 3.68 Multi-Hazard Mitigation Plan January 2009
Location or County Date Time Magnitude Injuries Estimated
Damages ($) Neosho County March 8, 1973 8:15 PM F2 0 250,000 Neosho County May 1, 1973 -- F1 0 25,000 Neosho County May 11, 1973 6:00 AM F2 0 250,000 Neosho County May 20, 1982 4:23 PM F1 0 250,000 Neosho County May 30, 1982 4:18 PM F0 0 0 Neosho County June 3, 1983 2:15 AM F1 0 250,000 Neosho County April 7, 1986 6:55 PM F0 0 0 Neosho County November 15, 1988 2:05 PM F1 0 25,000 Neosho County November 15, 1988 2:15 PM F2 0 25,000 Erie April 19, 2000 7:20 PM F2 3 1,800,000 South Mound April 19, 2000 8:00 PM F0 0 25,000 South Mound June 4, 2000 5:50 PM F0 0 0 St Paul May 4, 2003 3:37 PM F0 0 15,000 Galesburg April 21, 2005 4:54 PM F3 0 200,000 South Mound April 21, 2005 5:19 PM F1 0 15,000 Chanute June 30, 2005 7:04 PM F0 0 0 Thayer September 13, 2005 5:22 PM F0 0 0 Erie November 27, 2005 4:06 PM F1 0 120,000 Johnson Airport May 1, 2008 8:14 PM F0 0 0 Earlton May 1, 2008 8:44 PM F0 0 0 TOTALS: 4 3,553,000 Source: National Climatic Data Center (NCDC), http://www4.ncdc.noaa.gov/cgi-win/wwcgi.dll?wwevent~storms Note: Zero (0) values may indicate missing data
The NCDC provided descriptions of damages from the following tornado events:
• April 19, 2000. FEMA-1327-DR: Forming at 1920 CST 6 miles southwest of Erie, the tornado moved northeast around 35 mph passing just south of Erie at 1931 CST. F2 intensity for much of its track, the tornado injured 3 people on the southern periphery of Erie as it destroyed or heavily damaged 12 homes, several mobile homes, as well as a few trees. This tornado then crossed into Crawford County.
• May 6, 2003. FEMA-1462-DR: Unspecified damage to two homes, trees, and power lines six miles south of St. Paul.
• April 21, 2005. One frame house was partially unroofed and one barn destroyed. Tornado crossed the Neosho/Crawford county line, 5 miles southeast of St. Paul. The tornado lifted one mile east of the Neosho/Crawford county line. Damage summary: Two miles south of Galesburg: One barn damaged & two out-buildings destroyed. Three miles southeast of Galesburg: Two mobile homes destroyed, one frame house dislodged from its foundation & two barns destroyed. Four miles east-southeast of Galesburg: Frame house unroofed with two exterior walls collapsed. A garage and one shed were destroyed. Tree damage occurred at each of these locations.
• November 27, 2005. Shortly after touchdown approximately 2 miles northeast of Erie, the tornado produced F1 damage to homes, outbuildings and trees. Thereafter, the tornado lost some of its intensity, and subsequent damage was rated F0.

Neosho County DRAFT 3.69 Multi-Hazard Mitigation Plan January 2009
Probability of Future Occurrences
Based on records of 28 tornado events in Neosho County over the 54 year period from 1954-2008, there is a 51.9 percent probability of a tornado occurring in Neosho County in a given year. This, along with the location of Neosho County in Wind Zone IV, makes the probability of a tornado in any given year highly likely.
Highly Likely: History of events is greater than 33% likely per year. Event is probable within the calendar year.
The National Severe Storms Laboratory calculated probability of violent tornadoes based on time of year for the period 1921-1995. Figure 3.27 below shows the probability of a F2 or larger tornado occurring on any given day at a location within a 25 mile radius of the center of Allen County. For example, a y-axis value of 2.0 would indicate a two percent chance of receiving the chosen type of severe weather on the date indicated by the x-axis value. The 1966-1981 period was the peak in probability based on data from previous occurrences, with the most recent reporting period (1981-1995) showing a significantly lower probability of occurrence than the overall average. For both significant (F2 or larger) and violent (F4 and larger) tornadoes there is a pronounced peak in probability during the spring months.
Figure 3.27. Daily Significant Tornado Probability, F2 or Larger, Neosho County 1921-1995
Source: National Severe Storms Laboratory, http://www.nssl.noaa.gov/hazard/hazardmap.html

Neosho County DRAFT 3.70 Multi-Hazard Mitigation Plan January 2009
Based on the same methodology described for the previous graph, Figures 3.28 and 3.29 below show the probability of an F4 or larger tornado occurring on any given day at a location within a 25 mile radius of the center of Allen County, and the frequency of F2 or larger tornadoes based on location in the U.S., respectively.
Figure 3.28. Daily Violent Tornado Probability, F4 or Larger, Neosho County 1921-1995
Source: National Severe Storms Laboratory, http://www.nssl.noaa.gov/hazard/hazardmap.html
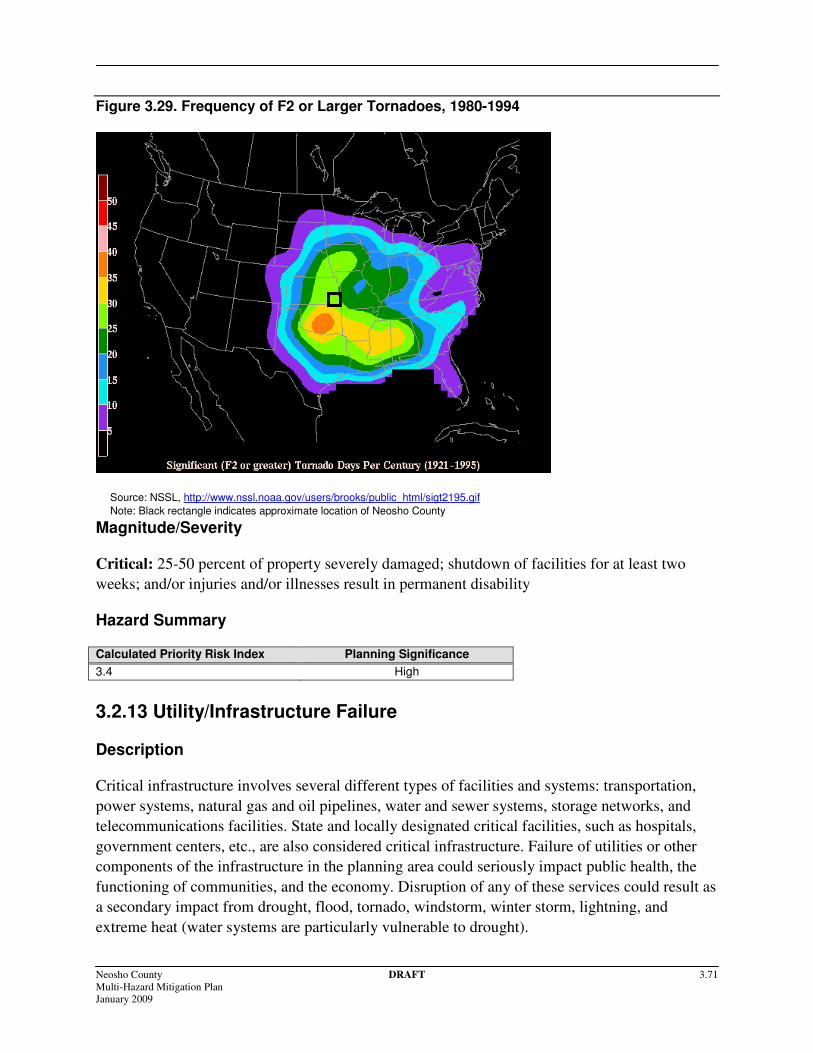
Neosho County DRAFT 3.71 Multi-Hazard Mitigation Plan January 2009
Figure 3.29. Frequency of F2 or Larger Tornadoes, 1980-1994
Source: NSSL, http://www.nssl.noaa.gov/users/brooks/public_html/sigt2195.gif Note: Black rectangle indicates approximate location of Neosho County
Magnitude/Severity
Critical: 25-50 percent of property severely damaged; shutdown of facilities for at least two weeks; and/or injuries and/or illnesses result in permanent disability
Hazard Summary
Calculated Priority Risk Index Planning Significance 3.4 High
3.2.13 Utility/Infrastructure Failure
Description
Critical infrastructure involves several different types of facilities and systems: transportation, power systems, natural gas and oil pipelines, water and sewer systems, storage networks, and telecommunications facilities. State and locally designated critical facilities, such as hospitals, government centers, etc., are also considered critical infrastructure. Failure of utilities or other components of the infrastructure in the planning area could seriously impact public health, the functioning of communities, and the economy. Disruption of any of these services could result as a secondary impact from drought, flood, tornado, windstorm, winter storm, lightning, and extreme heat (water systems are particularly vulnerable to drought).

Neosho County DRAFT 3.72 Multi-Hazard Mitigation Plan January 2009
Also of concern are solar storms. The next 11-year cycle of solar storms will most likely start in March 2008 and peak in late 2011 or mid-2012. These storms can potentially affect power and communication systems.
The largest electric utilities in Neosho County are Heartland Electric Cooperative, Radiant Electric Cooperative, and Twin Valley Electric Cooperative. In recent years, regional electric power grid system failures in the western and northeastern United States have demonstrated that similar failures could happen in Kansas. This vulnerability is most appropriately addressed on a multi-state regional or national basis.
Warning Time: 4—less than 6 hours
Duration: 3—less than one week
Geographic Location
Utility lines and critical infrastructure are located throughout Neosho County, concentrated in the county’s population centers and on lines connecting them. Figures 3.44 and 3.46 in Section 3.3.3 show the location of utilities and critical infrastructure in relation to flood risk areas of Neosho County.
The cities of Chanute and Erie provide their own power. Chanute has owned and operated an electric utility since 1916. In 2007 Chanute had three power plants and 100 miles of electric lines with a peak operating load of 38.7 mega watts per year. Additional electric providers include Radiant Electric, Twin Valley Electric, Westar, Kansas Gas and Electric, and Kansas Power and Light.
The City of Chanute Sewer Utility has 69 miles of collection lines and seven lift stations. The present wastewater treatment plant began operation in 1983 and treats approximately 4.2 million gallons of water per day from approximately 3,700 residential, 460 commercial and 40 industrial customers.
With the exception of Earlton, which utilizes a septic tank system, the remainder of Neosho County utilizes sewage lagoons for the treatment of wastewater, with permitted discharge into local bodies of surface water.
Telephone, television, and internet service providers include Southwestern Bell, Sprint, Craw-Kan Telephone, Cox Cable, Cable One, and Cable TV of St. Paul.
Previous Occurrences
Disruptions to utility services result annually as a secondary impact to drought, flood, tornado, windstorm, winter storm, lightning, and extreme heat.

Neosho County DRAFT 3.73 Multi-Hazard Mitigation Plan January 2009
Probability of Future Occurrences
Based on a level of frequency that includes occurrences of utility failure on an annual basis, this hazard’s CPRI probability for significant events is “likely” (event is probable within the next three years).
Likely: Event is probable within the next three years.
Magnitude/Severity
Limited—10-25 percent of property severely damaged; shutdown of facilities for more than a week; and/or injuries/illnesses treatable do not result in permanent disability
Hazard Summary
Calculated Priority Risk Index Planning Significance 2.85 Moderate
3.2.14 Wildfire
Description
Wildfires in Kansas typically originate in pasture or prairie areas following the ignition of dry grasses (by natural or human sources). About 75 percent of Kansas wildfires start during spring due to dry weather conditions. Since protecting people and structures takes priority, a wildfire’s cost to natural resources, crops, and pastured livestock can be ecologically and economically devastating. In addition to the health and safety impacts to those directly affected by fires, the state is also concerned about the health affects of smoke emissions to surrounding areas.
Wildfires in Kansas are frequently associated with lightning and drought conditions, as dry conditions make vegetation more flammable. As new development encroaches into the wildland-urban interface (areas where development occurs within or immediately adjacent to wildlands, near fire-prone trees, brush, and/or other vegetation), more and more structures and people are at risk. On occasion, ranchers and farmers intentionally ignite vegetation to restore soil nutrients or alter the existing vegetation growth. These fires have the potential to erupt into wildfires.
Warning Time: 4—less than six hours
Duration: 2—less than one day
Geographic Location
The entire planning area is subject to incidents of wild fire. There is an increased risk in agricultural areas where Conservation Reserve Program (CRP) land is burned and in rural areas

Neosho County DRAFT 3.74 Multi-Hazard Mitigation Plan January 2009
where individuals burn trash or debris. During high wind conditions, these small fires can get out of control and spread to dry vegetation such as native grasses, shrubs, and Eastern Cedar trees.
In April 2007, the Kansas Forest Service prepared a Community Wildfire Hazard Assessment Report. This report details the conclusions of the status of Wildland Urban Interface (WUI) issues that might have an impact on the safety of persons and/or property in Neosho County Kansas. To complete the assessment, Forest Service personnel obtained baseline data on the Wildland Urban Interface boundaries from the USGS website Geo Mac (www.geomac.gov). This data was then confirmed with a “windshield” survey. The assessment concludes the following:
St. Paul, Earlton, Urbana, Kimball, Thayer, Shaw, Galesburg, Chanute and Erie were all determined to be low risk areas for wildfire. Stark, South Mound, and Morehead were determined to have a moderate risk for wildfire. This moderate rating was assigned as a result of the heavy fuel loads of hardwood timber, grass and eastern red cedar mix that have little or no break in the fuel continuity between the communities and the surrounding vegetation fuels. There is also an “intermix” WUI condition in some parts of these communities. Intermix WUI occurs when vegetation in vacant lots within the community could carry a vegetation fire that could spread to surrounding buildings.
Figure 3.30 shows the wildland urban interface boundaries in the planning area.

Neosho County DRAFT 3.75 Multi-Hazard Mitigation Plan January 2009
Figure 3.30 GeoMac Wildland Urban Interface Boundaries, Neosho, Kansas
source: USGS www.goemac.gov
Although the wildfire assessment for Thayer was determined to be low, the planning committee reported a specific risk of wildfire in the City as a result of sparks from the railroad igniting nearby vegetation. So, the overall risk for wildfire in Thayer is considered to be moderate.
Previous Occurrences
According to the Special Kansas Fire Loss Summary-2006 Kansas State University Wildland Report, there were 148 fires in Neosho County impacting a total of 2,544 acres in 2006. No fatalities or injuries resulted from these wildfires but they did cause an estimated $123,400 in property losses.
The Kansas Incident Fire Reporting System reports that from 2003-2006, Neosho County lost 4,396 acres to wild fires. The acreage burned in Neosho County ranks 27 highest out of 105 counties in Kansas during this time frame.

Neosho County DRAFT 3.76 Multi-Hazard Mitigation Plan January 2009
Probability of Future Occurrences
Although they are generally small, wildfires occur in Neosho County on an annual basis. Future occurrence of this hazard and degree of impacts is likely to increase if development in wildland-urban interface areas increases.
Likely: Event is probable within the next three years.
Magnitude/Severity
Wildfires occur on an annual basis; however, most do not result in significant threat to life or property. An average of 1,099 acres per year were impacted by wildfires from 2003-2006, representing 0.3 percent of the total planning area on an annual basis.
Negligible—Less than 10 percent of property severely damaged, shutdown of facilities and services for less than 24 hours; and/or injuries/illnesses treatable with first aid
Hazard Summary
Calculated Priority Risk Index Planning Significance 2.45 Moderate
3.2.15 Windstorm
Description
Straight-line winds are generally any thunderstorm wind that is not associated with rotation (i.e., not a tornado). These winds, which can exceed 100 mph, represent the most common type of severe weather and are the most common cause of thunderstorm damage. Since thunderstorms do not have a narrow track like a tornado, associated wind damage can be extensive and affect broad regions including and multiple counties. Objects like trees, barns, outbuildings, high-profile vehicles, and power lines/poles can be toppled or destroyed, and roofs, windows, and homes can be damaged as wind speeds increase. One type of straight-line wind is the downburst, which can cause damage equivalent to a strong tornado and can be extremely dangerous to aviation.
Thunderstorms over Kansas typically happen between late April and early September, but, given the right conditions, they can develop as early as March. They are usually produced by super cell thunderstorms or a line of thunderstorms that typically develop on hot and humid days.
Warning Time: 2—less than one day
Duration: 2—less than one day

Neosho County DRAFT 3.77 Multi-Hazard Mitigation Plan January 2009
Geographic Location
All of Neosho County is susceptible to high wind events. The County is located in Wind Zone IV, which is susceptible to winds up to 250 mph. Figure 3.31 below shows the wind zones of the United States based on maximum wind speeds; Kansas is located within wind zones III and IV, the highest inland categories. All of Neosho County is in Zone IV.
Figure 3.31. Wind Zones in the United States
Source: FEMA; http://www.fema.gov/plan/prevent/saferoom/tsfs02_wind_zones.shtm Note: Blue square indicates approximate location of Neosho County
Previous Occurrences
Neosho County was included in two presidential disaster declarations involving impacts from high winds. In 2005 and again in 2007, USDA disaster declarations were issued that included high winds as a primary cause.
According to the NCDC database, there are 82 separate reports of wind events in Neosho County between 1955 and June 2008 (multiple events during the same day were counted as one event). During this time period there were no reported deaths or injuries as a result of windstorm events. Total property damage for events from 1994-2008 is estimated at $4.18 million. Table 3.21 below lists windstorm events in Neosho County from 1994-2008.

Neosho County DRAFT 3.78 Multi-Hazard Mitigation Plan January 2009
Table 3.21 Windstorm Events, Neosho County 1994-2008
Location or County Date Magnitude Estimated Damages Chanute July 7, 1994 52 kts. 5,000 Erie April 17, 1995 52 kts. 0 Erie June 9, 1995 0 kts. 16,000 Erie July 4, 1995 0 kts. 16,000 Erie July 23, 1995 60 kts. 0 Thayer April 28, 1996 70 kts. 0 Thayer April 28, 1996 65 kts. 15,000 Erie July 8, 1996 0 kts. 0 Chanute June 29, 1997 56 kts. 0 Thayer June 8, 1998 52 kts. 0 Chanute June 29, 1998 61 kts. 90,000 Erie June 29, 1998 61 kts. 1,000,000 St Paul August 9, 1998 52 kts. 25,000 Thayer September 29, 1998 52 kts. 0 Erie October 4, 1998 52 kts. 0 St Paul October 4, 1998 52 kts. 0 St Paul October 17, 1998 65 kts. 50,000 Chanute November 9, 1998 52 kts. 0 Erie May 17, 1999 52 kts. 3,000 Thayer June 28, 1999 56 kts. 0 Chanute February 25, 2000 52 kts. 75,000 Multi-County region March 8, 2000 61 kts. 50,000 Morehead April 19, 2000 52 kts. 0 Chanute May 27, 2000 56 kts. 100,000 Chanute May 27, 2000 56 kts. 0 Chanute Airport May 27, 2000 57 kts. 0 Erie April 14, 2001 52 kts. 0 Chanute June 3, 2001 52 kts. 0 Stark July 25, 2001 52 kts. 0 Chanute Airport September 7, 2001 58 kts. 0 Thayer September 7, 2001 52 kts. 0 Shaw September 7, 2001 52 kts. 0 Earlton March 8, 2002 56 kts. 10,000 St Paul August 23, 2002 56 kts. 25,000 Chanute September 18, 2002 61 kts. 0 Chanute April 16, 2003 65 kts. 35,000 Thayer April 16, 2003 52 kts. 0 Erie April 16, 2003 61 kts. 0 St Paul April 16, 2003 61 kts. 0 Chanute April 19, 2003 61 kts. 0 St Paul June 25, 2003 52 kts. 0 Erie July 9, 2003 78 kts. 50,000 Erie July 9, 2003 54 kts. 0 Stark July 9, 2003 52 kts. 0 Chanute August 5, 2003 61 kts. 10,000

Neosho County DRAFT 3.79 Multi-Hazard Mitigation Plan January 2009
Location or County Date Magnitude Estimated Damages St Paul August 5, 2003 61 kts. 50,000 Erie August 22, 2003 52 kts. 0 Thayer March 4, 2004 52 kts. 0 Earlton April 23, 2004 52 kts. 0 Stark May 26, 2004 60 kts. 0 Chanute July 5, 2004 61 kts. 5,000 Galesburg July 5, 2004 61 kts. 10,000 Erie July 5, 2004 61 kts. 0 Chanute June 30, 2005 78 kts. 1,000,000 Erie June 30, 2005 78 kts. 500,000 St Paul June 30, 2005 78 kts. 500,000 Chanute June 30, 2005 52 kts. 0 Chanute June 30, 2005 53 kts. 0 Erie June 30, 2005 61 kts. 25,000 Erie June 30, 2005 61 kts. 0 St Paul June 30, 2005 87 kts. 400,000 Thayer August 24, 2005 52 kts. 0 Thayer August 24, 2005 52 kts. 0 Chanute August 24, 2005 50 kts. 0 Thayer September 13, 2005 52 kts. 0 Chanute July 28, 2006 52 kts. 3,000 Erie August 6, 2006 60 kts. 15,000 Erie August 6, 2006 65 kts. 35,000 Thayer October 17, 2007 52 kts. 0 Stark October 17, 2007 52 kts. 0 Thayer October 17, 2007 52 kts. 0 Chanute May 23, 2008 50 kts. 0 Chanute May 26, 2008 53 kts. 0 Galesburg June 3, 2008 52 kts. 0 Chanute June 3, 2008 52 kts. 0 Chanute June 3, 2008 56 kts. 18,000 Erie June 3, 2008 52 kts. 0 Erie June 3, 2008 61 kts. 20,000 St Paul June 3, 2008 61 kts. 25,000 St Paul June 3, 2008 52 kts. 0 Johnson Airport June 8, 2008 59 kts. 0 TOTALS: 4,181,000 Source: National Climatic Data Center (NCDC), http://www4.ncdc.noaa.gov/cgi-win/wwcgi.dll?wwevent~storms Note: Zero (0) values may indicate missing data
Summaries of selected windstorm events are listed below (source: NCDC):
• June 3, 2008. An unsecured trailer house was blown over on its side by this high wind event that also blew down several power lines and tree limbs.

Neosho County DRAFT 3.80 Multi-Hazard Mitigation Plan January 2009
• August 6, 2006. The roof was blown off of the highland dairy cooler one mile north or Erie causing an estimated $35,000 in damages. Two large trees were blown over and fell on top of two houses causing an estimated $15,000 in damages.
• July 28, 2006. A utility pole was downed near the intersection of 230th Road and Brown Road causing an estimated $3,000 in damages.
• June 30, 2005 This severe wind storm affected Neosho, Crawford, and Cherokee Counties causing damage to power poles, conductor and electrical equipment resulting in widespread power outages. Store front windows were blown out and a camper was blown across a street. Numerous trees were blown over damaging homes and automobiles. In St. Paul, the school was damaged as well as the steeple on the St. Francis Catholic Church (Figure 3.32). St. Paul Elementary lost its entire roof and sheet metal littered the school grounds. The high school lost several windows and part of its roof as well. Total damages were estimated at $2.5 million. (Chanute Tribune, July 1, 2005).
Figure 3.32 St. Francis Catholic Church Steeple Damage (watermark shows original steeple)
source: St. Paul, Kansas Website, http://www.stpaulks.us/History.html

Neosho County DRAFT 3.81 Multi-Hazard Mitigation Plan January 2009
• July 5, 2004. A storage shed the size of a 3-car garage was destroyed with parts of the shed thrown onto the elementary school grounds nearly one block away. An aluminum boat stored inside the shed was also thrown, with the boat blown into the windshield of a vehicle owned by the school. This storm also caused downed power lines.
• August 5, 2003. One residence three miles from St. Paul was extensively damaged when the east-facing garage door was ripped from its supports causing the roof to collapse onto the three vehicles parked inside. A barn approximately 1 mile west of the property was unroofed with the dislodged roof and sections of tin scattered 1/4 mile across an adjacent field. Damage was estimated at $50,000 (Chanute Tribune).
• July 9, 2003. A pole barn roof collapsed. Damages were estimated at $50,000. • April 16, 2003. A roof was blown off of a storage building and the top 40 feet of a wireless
transmitter tower was destroyed causing an estimated $35,000 in damages. • August 23, 2002. Part of the roof was blown off the old city hall building in St. Paul.
Damages were estimated at $25,000. • May 27, 2000. Two large trees were uprooted by strong winds in Chanute. The trees' roots
lifted one side of a house from its foundation. Both trees toppled onto a next-door neighbor's house causing damage to its roof. Damage estimates were $100,000.
• February 25, 2000. A storage building under construction collapsed causing an estimated $75,000 in damages.
• October 17, 1998. A vehicle was blown into the front window of a building in St. Paul. Numerous power poles were blown down and the roofs of three buildings were blown off causing an estimated $50,000 in damages.
• June 29, 1998. The roofs of two stores were destroyed and two mobile homes were heavily damaged in Erie. This storm also downed numerous trees and power lines. Total damages were estimated to be $1 million.
• April 28, 1996. A roof was blown off a building in Thayer causing an estimated $15,000 in damages.
• July 4, 1995. A mobile home was blown off of its foundation three miles west of Erie causing approximately $16,000 in damages.
• June 9, 1995. The roof was blown off of a store two blocks east of Highway 59 in Erie causing an estimated $16,000 in damages.
• June 7, 1994. Strong winds damaged roofs and trees in the north part of town in Erie causing an estimated $50,000.
According to the USDA Risk Management Agency, in 2006, excess wind caused damage to the corn crop. $1,240 in crop insurance was paid as a result.
Probability of Future Occurrences
According to NCDC, there were 159 reports of high wind events in Neosho County between 1958 and June 2008 (57 years). For some events, more than one impact report was issued. There

Neosho County DRAFT 3.82 Multi-Hazard Mitigation Plan January 2009
was an average of 2.8 wind impact reports per year for this period. Based on the frequency of previous occurrences, probability of future occurrence is considered highly likely.
Highly Likely—History of events is greater than 33 percent likely per year
The National Severe Storms Laboratory calculated probability of windstorms based on time of year for the period 1980-1999. Figure 3.33 below shows the probability of a windstorm 50 knots or greater occurring on any given day at a location within a 25 mile radius of the center of Neosho County. For example, a y-axis value of 2.0 would indicate a two percent chance of receiving the chosen type of severe weather on the date indicated by the x-axis value. The most recent reporting period had the highest probability based on data from previous occurrences, while overall probability was highest during the spring months across all reporting periods.
Figure 3.33. Daily Windstorm Probability, 50 Knots or Higher, Neosho County 1980-1999
Source: National Severe Storms Laboratory, http://www.nssl.noaa.gov/hazard/hazardmap.html
Based on a similar methodology described for the previous graph, Figure 3.34 below shows the probability of a windstorm (65 knots or greater) occurring on any given day at a location within a 25 mile radius of the center of Neosho County.

Neosho County DRAFT 3.83 Multi-Hazard Mitigation Plan January 2009
Figure 3.34. Annual Windstorm Probability (65+ knots), United States 1980-1994
Source: NSSL, http://www.nssl.noaa.gov/users/brooks/public_html/bigwind.gif Note: Black rectangle indicates approximate location of Neosho County
Magnitude/Severity
Limited—10-25 percent of property severely damaged; shutdown of facilities for more than a week; and/or injuries/illnesses treatable do not result in permanent disability
Hazard Summary
Calculated Priority Risk Index Planning Significance 2.9 Moderate
3.2.16 Winter Storm
Description
Winter storms in Kansas typically involve snow, extreme cold, and/or freezing rain (ice storms). These conditions pose a serious threat to public safety, disrupt commerce and transportation, and can damage utilities and communications infrastructure. Winter storms can also disrupt emergency and medical services, hamper the flow of supplies, and isolate homes and farms.

Neosho County DRAFT 3.84 Multi-Hazard Mitigation Plan January 2009
Heavy snow can collapse roofs and down trees onto power lines. Extreme cold conditions can stress or kill unprotected livestock and freeze water sources. Direct and indirect economic impacts of winter storms include cost of snow removal, damage repair, increased heating bills, business and crop losses, power failures and frozen or burst water lines.
For humans, extreme cold can cause hypothermia (an extreme lowering of the body’s temperature) and permanent loss of limbs due to frostbite. Infants and the elderly are particularly at risk, but anyone can be affected. According to the National Center for Health Statistics, approximately 600 adults die from hypothermia each year, with the isolated elderly being most at risk. Also at risk are those without shelter or live in a home that is poorly insulated or without heat. Other potential health and safety threats include toxic fumes from emergency heaters, household fires caused by fireplaces or emergency heaters, and driving in treacherous conditions.
The National Weather Service describes different types of winter storm conditions as follows:
• Blizzard—Winds of 35 mph or more with snow and blowing snow reducing visibility to less than 1/4 mile for at least three hours.
• Blowing Snow—Wind-driven snow that reduces visibility. Blowing snow may be falling snow and/or snow on the ground picked up by the wind.
• Snow Squalls—Brief, intense snow showers accompanied by strong, gusty winds. Accumulation may be significant.
• Snow Showers—Snow falling at varying intensities for brief periods of time. Some accumulation is possible.
• Freezing Rain—Measurable rain that falls onto a surface whose temperature is below freezing. This causes the rain to freeze on surfaces, such as trees, cars, and roads, forming a coating or glaze of ice. Most freezing-rain events are short lived and occur near sunrise between the months of December and March.
• Sleet—Rain drops that freeze into ice pellets before reaching the ground. Sleet usually bounces when hitting a surface and does not stick to objects.
Wind can greatly amplify the impact of cold ambient air temperatures and thus the severity of winter storms. Provided by the National Weather Service, Figure 3.35 shows the relationship of wind speed to apparent temperature and typical time periods for the onset of frostbite.

Neosho County DRAFT 3.85 Multi-Hazard Mitigation Plan January 2009
Figure 3.35. Wind Chill Chart
Source: NOAA, National Weather Service, http://www.weather.gov/om/windchill/
Duration of the most severe impacts of winter storms is generally less than one week, though dangerous cold, snow, and ice conditions can remain present for longer periods in certain cases. Weather forecasts are commonly predict the most severe winter storms at least 24 hours in advance, leaving adequate time to warn the public.
Warning Time: 2—12-24 hours
Duration: 3—less than one week
Geographic Location
The entire State of Kansas is vulnerable to heavy snow and freezing rain. Figure 3.36 below shows average annual snowfall for the state of Kansas. Northwestern Kansas receives the greatest average annual snowfall with upwards of 40 inches per year. The southeastern region of Kansas that includes Neosho County, receives the least snowfall in the state, averaging 4.6 to 9.4 inches per year.

Neosho County DRAFT 3.86 Multi-Hazard Mitigation Plan January 2009
Figure 3.36. Kansas, Average Annual Snowfall
Source: Kansas State University Weather Data Library, www.oznet.ksu.edu/wdl/Maps/Climatic/AnnualFreezeMap.asp Note: Black square indicates Neosho County
The area of southeastern Kansas that includes Neosho County receives more hours of freezing rain than any other region in Kansas. Figure 3.37 below shows that Neosho County falls in a zone that receives 9-12 hours of freezing rain per year.
Figure 3.37. Average Number of Hours per Year with Freezing Rain in the United States
Source: American Meteorological Society. “Freezing Rain Events in the United States.” http://ams.confex.com/ams/pdfpapers/71872.pdf. Note: Black square indicates approximate location of Neosho County

Neosho County DRAFT 3.87 Multi-Hazard Mitigation Plan January 2009
Previous Occurrences
Neosho County has received one presidential declaration, one state declaration and two USDA declarations for this hazard, listed below in Table 3.22.
Table 3.3.22 Disaster Declarations in Neosho County Involving Winter Storm
Declaration Date Description Declaration Type Disaster Number April 4, 2007 Excessive Heat, Winter Storms USDA S2525
November 30, 2006 Winter Storm State -- January 4, 2005 Winter Storms and Excessive
Moisture USDA M1579
February 6, 2002 Ice Storm Presidential—Major Disaster Declaration
1402
Summaries of selected winter storm events are listed below (source: NCDC):
• January 31, 2008. Snow accumulated 8 to 10 inches across the county. A powerful storm system moved across the central and southern plains on January 31st. This resulted in a relatively narrow swath of heavy snow across south-central and southeast Kansas. The snow started falling after midnight on the 31st, and ended by mid-afternoon across south-central Kansas, and early evening across southeast Kansas. The snow was particularly heavy during the morning hours, when snowfall rates exceeded one inch per hour for several hours, especially across southeast Kansas. Additionally, gusty northerly winds up to 35 miles per hour resulted in reduced visibilities and at times significant drifting snow.
• December 9, 2007. Approximately one inch of ice and sleet accumulated across Neosho County. The ice storm knocked power out to much of the county. It is unknown how much damage was caused. Neosho County Community College reported damages to roofs, gutters, vent-hoods, as well as severe tree damage
• November 30, 2006. A massive winter storm produced record breaking snowfall, along with areas of freezing rain and sleet, across much of south-central and southeast Kansas. Southeast Kansas was hardest hit, where several locations were buried under 12 or more inches of snow, and up to one-half inch of ice. Transportation was brought to a stand-still; schools, businesses, and organizations were closed for several days; and numerous traffic accidents occurred. The weight of the snow caused sporadic structural damage.
Figure 3.38 below shows snow accumulation depths for the November 30, 2006 storm. Most areas of Neosho County received at least one foot of snow from this storm.

Neosho County DRAFT 3.88 Multi-Hazard Mitigation Plan January 2009
Figure 3.38 Southeast Kansas Snow Accumulation Map, November 30, 2006
Source: National Weather Service, 2007 Kansas Severe Weather Awareness Week Information Packet Note: Black square indicates Neosho County
• December 13, 2003. The same winter storm that produced 7-10 inch accumulations across
South-Central Kansas, produced comparable accumulations across Southeast Kansas in the morning. The greater accumulations occurred along the Oklahoma border. Law enforcement, emergency management, and trained spotters all provided timely reports throughout this event.
• February 23, 2003. A winter storm moving southeast from the Rockies across Oklahoma produced snowfalls of ranging from 6-15 inches across most of south-central and southeast Kansas.
• December 4, 2002. A powerful early season winter storm crossing the Southern Plains spread snow across southern Kansas from Tuesday evening, Dec. 3rd, thru Wednesday afternoon, Dec. 4th. The resulting accumulations reached 6-10 inches, with the greater amounts, 8-10 inches, along the Oklahoma border. Across Southeast Kansas, freezing drizzle preceded the heavy snow, with numerous highways no doubt slick and dangerous.
• March 1, 2002. Low pressure developed rapidly over New Mexico during the morning. As the low moved east into West Texas, it deepened considerably, allowing rich gulf moisture to surge north across East Texas and Oklahoma and into Kansas. An upper-level impulse lifting northeast across the Southern Plains induced sufficient lift to produce bands of snow across Central Kansas late in the afternoon. By evening, the snow increased in both coverage and

Neosho County DRAFT 3.89 Multi-Hazard Mitigation Plan January 2009
intensity, and between 10 PM and midnight, moderate to heavy snow occurred across that part of Central Kansas generally along, and southeast, of a line from Hutchinson to McPherson. By midnight, the snow had overspread South-Central and most of Southeast Kansas. Accumulations were 3-6 inches, with the greater amounts occurring across Southeast Kansas where the snow was occasionally convective. However, northerly winds of 30-40 mph whipped across the region resulting in widespread blowing and drifting snow that frequently reduced visibilities to around 1/4 mile.
• January 29, 2002 FEMA-1402-DR, Ice Storm. Beginning on January 29, a three-day severe winter storm hit 35 Kansas counties in the southeast corner of the state with freezing rain, drizzle, sleet, and snow. With one to two inches of ice accumulation, utility poles and power lines snapped, transportation was treacherous, and fallen trees damaged many structures. The resulting power outages affected nearly the entire region and lasted nearly a week in some areas. Loss of power was particularly problematic for many nursing homes. There were seven casualties, and property damage approximated $32 million in the entire affected region. Neosho County received over $1.4 Million in FEMA Public Assistance funds as a result of this disaster. Schools and businesses across Neosho County were closed as a result of the power outages. The city shop building in Thayer was damaged when the roof collapsed. According to information from Radiant Electric Cooperative, ice accumulation resulted in pole damage and destruction of service wires. Ninety-five percent of the 5,383 meters served were without power. By 8:00 pm on January 30th, all communities within a thirty mile radius were without power. Emergency restoration efforts continued through February 8th at which time all service had been restored to residences and most businesses. Emergency restoration damage consisted of replacement of 620 poles, 158 cross-arms, 38,869 feet of conductor and 85 transformers. Permanent restoration consisted of 150 miles of single phase and ten miles of three phase lines. In all, damages to Radiant Electric exceeded $8.0 Million. FEMA paid 75 percent of this cost and the State of Kansas paid 10 percent. Radiant Electric was responsible for the remaining 15 percent (Radiant Electric Cooperative, 2008). Heartland Rural Electric Cooperative also reported widespread loss of poles, conductor, and electrical equipment.
• February 9, 2001. Widespread rain changed to a mixture of sleet and freezing rain early on the morning of the 9th. By the time the freezing rain and sleet had changed to snow, 1/4-1/2 inches of ice had accumulated across most of southeast Kansas. North winds of 20-30 mph compounded matters, causing spotty power outages across the region.
• December 13, 2000. A potent winter storm crossing Oklahoma and Arkansas buried nearly all of southeast Kansas with 6 to 14 inches of snow.
• March 10, 2000. A late season winter storm produced a narrow swath of 6 to 8 inch snowfalls across extreme southeast Kansas. The heavy wet snow caused widespread damage to trees, power lines, and about 30 power poles. Approximately 2,600 to 2,700 people experienced power outages lasting the duration of the weekend.
• January 27, 2000. A slow-moving winter storm produced widespread 6-8 inch snowfalls across most of central, south-central and southeast Kansas from the morning of the 27th thru

Neosho County DRAFT 3.90 Multi-Hazard Mitigation Plan January 2009
midday on the 28th. Reports were also received from amateur radio operators, law enforcement and emergency managers.
• March 12, 1999. A late season winter storm moving from northern New Mexico into northeast Texas spread heavy snow across much of central, south-central and southeast Kansas resulting in accumulations ranging from 6-11 inches. South-central Kansas bore the brunt of the storm where 8-11 inches buried much of this region. The greatest accumulations reported were in Kingman County (11 inches), Harper County (8-10 inches), Southwest Sedgwick County (9 inches) and Sumner County (8 inches). Possessing a high water equivalent, the weight of the snow caused a roof to collapse at a shop in Harper (North-central Harper County) causing an estimated $5,000 damage. In Attica (West-central Harper County) snow inflicted damage to car awnings and tree limbs.
• November 20, 1994. Heavy snow blanketed portions of West Central Kansas on this Sunday. The snow was accompanied by thunder at times between 0800-1200 MST. Snowfall amounts included 6 inches at Sharon Springs and Wallace and 7 inches just south of Goodland.
According to the USDA Risk Management Agency, Insured crop losses in Neosho County as a result of freeze and cold winter conditions from 2005 to 2007 totaled $1,102,092. Details are provided in Table 3.23.
Table 3.23 Claims Paid in Neosho County for Crop Loss as a Result of Freeze Conditions
Year Crop Hazard Claims
Paid ($) 2005 Wheat Freeze $680 2005 Corn Freeze $504 2005 Soybeans Freeze $140 2006 Soybeans Freeze $1,817 2007 Wheat Freeze $1,069,660 2007 Oats Freeze $664 2007 Corn Freeze $26,423 2006 Wheat Cold Winter $2,204 Total $1,102,092
Source: USDA’s Risk Management Agency, April, 2008
Probability of Future Occurrences
During the 14-year period from 1993 to 2007, there were 20 recorded winter storm events in Neosho County. The recurrence interval for winter storms for this period is 9 months. Based on this recurrence interval the probability of future occurrence rating for winter storms is highly likely.
Highly Likely—History of events is greater than 33 percent likely per year

Neosho County DRAFT 3.91 Multi-Hazard Mitigation Plan January 2009
Magnitude/Severity
Limited—10-25 percent of property severely damaged; shutdown of facilities for more than a week; and/or injuries/illnesses treatable do not result in permanent disability
Hazard Summary
Calculated Priority Risk Index Planning Significance 3.0 High
3.2.17 Hazard Profiles Summary
Table 3.24 summarizes the results of the hazard profiles and how each hazard varies by jurisdiction. Of moderate and high ranked hazards, dam and levee failure, flood hazard, and wildfire hazard vary uniquely across the planning area. This assessment was used by the HMPC to prioritize those hazards of greatest significance to the planning area, enabling the County to focus resources where they are most needed. Those hazards that occur infrequently, or have little or no impact on the planning area, were determined to be of low significance. Those hazards determined to be of high significance were characterized as priority hazards that required further evaluation in Section 3.3, Vulnerability Assessment.
Table 3.24. Planning Significance of Identified Hazard by Jurisdiction
Hazard Neosho County Chanute Erie
St. Paul Thayer
Agricultural Infestation M M M M M Dam and Levee Failure M M M L L Drought M M M M M Earthquake L L L L L Expansive Soils L L L L L Extreme Heat M M M M M Flood H H H L L Hailstorm M M M M M Lightning M M M M M Soil Erosion and Dust L L L L L Utility/Infrastructure Failure
M M M M M
Tornado H H H H H Wildfire M L L L M Windstorm M M M M M Winter Storm H H H H H Source: HMPC Note: H = High, M = Moderate, L = Low

Neosho County DRAFT 3.92 Multi-Hazard Mitigation Plan January 2009
3.3 Vulnerability Assessment
Requirement §201.6(c)(2)(ii) :[The risk assessment shall include a] description of the jurisdiction’s vulnerability to the hazards described in paragraph (c)(2)(i) of this section. This description shall include an overall summary of each hazard and its impact on the community.
Requirement §201.6(c)(2)(ii)(A) :The plan should describe vulnerability in terms of the types and numbers of existing and future buildings, infrastructure, and critical facilities located in the identified hazard areas.
Requirement §201.6(c)(2)(ii)(B) :[The plan should describe vulnerability in terms of an] estimate of the potential dollar losses to vulnerable structures identified in paragraph (c)(2)(i)(A) of this section and a description of the methodology used to prepare the estimate.
Requirement §201.6(c)(2)(ii)(C): [The plan should describe vulnerability in terms of] providing a general description of land uses and development trends within the community so that mitigation options can be considered in future land use decisions. Requirement §201.6(c)(2)(ii): (As of October 1, 2008) [The risk assessment] must also address National Flood Insurance Program (NFIP) insured structures that have been repetitively damaged floods. 3.3.1 Methodology
The vulnerability assessment further defines and quantifies populations, buildings, critical facilities, and other community assets at risk to natural hazards. The vulnerability assessment for this plan followed the methodology described in the FEMA publication Understanding Your Risks—Identifying Hazards and Estimating Losses (2002).
The vulnerability assessment was conducted based on the best available data and the significance of the hazard. Data to support the vulnerability assessment was collected from the following sources:
• County and jurisdictional GIS data (hazards, base layers, and assessor’s data) • Statewide GIS datasets compiled by state and federal agencies • FEMA’s HAZUS-MH loss estimation software • Written descriptions of assets and risks provided by participating jurisdictions • Existing plans and reports • Personal interviews with HMPC members and other stakeholders

Neosho County DRAFT 3.93 Multi-Hazard Mitigation Plan January 2009
The Vulnerability Assessment is divided into four parts:
• Section 3.3.2 Community Assets first describes the assets at risk in Neosho County, including the total exposure of people and property; critical facilities and infrastructure; natural, cultural, and historic resources; and economic assets.
• Section 3.3.3 Vulnerability by Hazard describes the vulnerability to each hazard identified in section 3.1 and profiled in section 3.2. This vulnerability analysis includes a vulnerability overview for each hazard. For hazards of high and moderate significance, where available, the vulnerability analysis includes evaluation of vulnerable buildings, infrastructure, and critical facilities; estimated losses and a discussion of the methodology used to estimate losses; and discusses future development in relation to hazard-prone areas.
• Section 3.3.4 Future Land Use and Development discusses development trends, including population growth, housing demand, and future projects.
• Section 3.3.4 Summary of Key Issues summarizes the key issues and conclusions identified in the risk assessment process.
3.3.2 Community Assets
This section assesses the population, structures, critical facilities and infrastructure, and other important assets in Neosho County that may be at risk to natural hazards.
Total Exposure of Population and Structures
Table 3.25 shows the total population, number of structures, and estimated value of improvements to parcels by jurisdiction. Land values have been purposely excluded because land remains following disasters, and subsequent market devaluations are frequently short term and difficult to quantify. Additionally, state and federal disaster assistance programs generally do not address loss of land or its associated value (other than loss of crops through USDA). In general, exposure of people and property is concentrated in the City of Chanute.
Table 3.25. Population and Building Exposure by Jurisdiction
City Population Building
Count Building Contents
($) Contents Exposure
($) Total Exposure
($) Chanute 9,411 5,321 709,365,000 507,698,000 1,217,063,000 Earlton 80 61 4,557,000 2,807,000 7,364,000 Erie 1,211 867 77,358,000 53,394,000 130,752,000 Galesburg 150 90 19,576,000 20,545,000 40,121,000 St Paul 646 360 51,979,000 38,988,000 90,967,000 Stark 106 62 5,316,000 3,404,000 8,720,000 Thayer 500 279 33,295,000 22,726,000 56,021,000 Unincorporated 4,893 3,104 279,473,000 172,194,000 451,667,000 Total 16,997 10,144 1,180,919,000 821,756,000 2,002,675,000 Sources: Kansas Division of the Budget (population); HAZUS-MH (MR 3) (structures)

Neosho County DRAFT 3.94 Multi-Hazard Mitigation Plan January 2009
Critical Facilities and Infrastructure
A critical facility may be defined as one that provides essential public safety or mitigation functions during response or recovery operations. Table 3.26 below gives examples of critical facilities, high potential loss facilities and transportation and lifelines as they are defined for the purposes of this analysis.
Table 3.26 Critical Facilities, Definitions and Examples
Essential Facilities High Potential Loss
Facilities Transportation and Lifelines Hospitals and other medical facilities Power plants Highways, bridges, and tunnels Police stations Dams and levees Railroads and facilities Fire stations Military installations Airports Emergency operations centers Hazardous material sites Water treatment facilities Schools Natural gas, facilities and pipelines Shelters Communications facilities Day care centers Nursing homes Main government buildings
Source: FEMA HAZUS-MH MR3
Table 3.27 is an inventory of critical facilities and infrastructure (based on available data from the State of Kansas) in Neosho County.
Table 3.27. Inventory of Critical Facilities and Infrastructure by Jurisdiction
Facility Chanute Earlton Erie Galesburg St. Paul Stark Thayer Total Airport 1 -- -- -- -- -- -- 1
Bridges 9 -- 5 -- -- -- -- 14
Dams 2 -- -- -- -- -- -- 2
Elder Care Facility/ Long Term Care Facility
5 -- 1 -- 1 -- -- 7
Health Care Facility 6 -- 1 -- 1 -- -- 8 Power Plant 3 -- 2 -- -- -- -- 5 Fire Stations 1 1 1 1 1 1 1 7 EMS Stations 1 -- 1 -- -- -- -- 2
Schools 6 -- 2 1 1 -- 1 11
Wastewater Facilities 1 -- 1 1 1 1 1 6 Total 35 1 14 3 5 2 3 63
Sources: HAZUS-MH (MR 3)
Table 3.28 provides specific information on the Elder Care Facilities and Long Term Care Facilities in Neosho County. Citizens that reside in these facilities are considered special needs and may require additional assistance in the event of a natural hazard or emergency event. In

Neosho County DRAFT 3.95 Multi-Hazard Mitigation Plan January 2009
addition to these facilities, there is one hospital, Neosho Memorial Regional Medical Center located in Chanute.
Table 3.28 Elder Care/Long Term Care Facilities in Neosho County
Elder Care Facility Name Location # of Beds Chanute Health Care Center Chanute 77 Heritage Health Care Center Chanute 53 Prairie Mission Retirement Village St. Paul 68 Guest Home Estates II Chanute 34 Guest Home Estates III Chanute 25 Guest Home Estates VIII Erie 23 Applewood Rehabilitation, Inc Canute 46 Figure 3.39 shows locations of bridges in the planning area.

Neosho County DRAFT 3.96 Multi-Hazard Mitigation Plan January 2009
Figure 3.39. Neosho County Bridges

Neosho County DRAFT 3.97 Multi-Hazard Mitigation Plan January 2009
Other Assets
Assessing the vulnerability of Neosho County to disaster also involves an inventory of natural, historic, cultural, and economic assets located in the planning area. This is important for the following reasons:
• The county may decide that these types of resources warrant a greater degree of protection due to their unique and irreplaceable nature and contribution to the overall economy.
• If these resources are impacted by a disaster, knowing about them ahead of time allows for more prudent care in the immediate aftermath, when the potential for additional impacts is higher.
• The rules for reconstruction, restoration, rehabilitation, and/or replacement are often different for these types of designated resources.
• Natural resources can have beneficial functions that reduce the impacts of natural hazards, such as wetlands and riparian habitat, which help absorb and attenuate floodwaters.
• Losses to economic assets (e.g., major employers or primary economic sectors) could have severe impacts on a community and its ability to recover from disaster.
In Neosho County, specific assets include the following:
• Endangered, threatened, special status species: The two species endemic to Neosho County listed by the U.S, Fish and Wildlife Department (USFW) as threatened are: Mead’s milkweed (plant) and Neosho madtom (fish). Also, populations of the Neoshow mucket (clam) are closely monitored as a candidate species for potential future listing.
• Cultural Resources: Santa Fe Depot/Safari museum in Chanute, Osage Mission Museum in St. Paul, public libraries are located in Erie, Chanute, St. Paul, and Thayer, and numerous churches are located throughout the county
• Economic Resources/Major Employers: Erie—USD 101, City of Erie, Beachner Grain; Chanute—Ash Grove, Quest, City of Chanute; Thayer—Beachner Grain, W&G Fertilizer, Acorn Valley Cabinetry; St. Paul—Beachner Grain, Westhoff Interiors
• Natural Resources: The Neosho Wildlife Area, located in southeast Neosho County is a man-made marsh developed by the Kansas Department of Wildlife and Parks as a migratory waterfowl resting and feeding place and public hunting area. The Wildlife Area is located on the flat floodplain below the junction of Flat Rock Creek and the Neosho River, and contains approximately 3,426 acres, of which 1,748 acres are water contained in 15 man-made pools. The Wetlands Reserve Program is a voluntary program offering landowners the opportunity to protect, restore, and enhance wetlands on their property. The USDA Natural Resources Conservation Service (NRCS) provides technical and financial support to help landowners with their wetland restoration efforts. The NRCS goal is to achieve the greatest wetland functions and values, along with optimum wildlife habitat, on every acre enrolled in the program. This program offers landowners an opportunity to establish long-term conservation and wildlife practices and protection. The photos in figures 3.40 and 3.41 are of a Neosho

Neosho County DRAFT 3.98 Multi-Hazard Mitigation Plan January 2009
County wetland restored through this program. This 200 acre wetland was restored utilizing a perpetual easement and with the assistance of the U.S. Fish and Wildlife Service
Figures 3.40 and 3.41. Restored Wetland in Neosho County
source: Natural Resources Conservation Service, http://www.nrcs.usda.gov/programs/wrp/photo_gallery/photo_ks.html
• Historic resources: There are 9 Neosho County properties on the National Register of
Historic Places. These properties are identified in Table 3.29.
Table 3.29. Neosho County Properties on the National Register of Historic Places
Property Name Address Location National/State
Register/Date Listed Atchison Topeka, and Santa Fe Depot
111 North Lincoln Chanute State Register
Austin Bridge 4 miles southeast of Chanute Chanute National Register 9/15/1977
Chanute Public (Carnegie) Library
102 South Lincoln Chanute State Register
Cut-Off Bridge 6.3 miles south and 1.7 miles east of St. Paul
St. Paul Vicinity State Register
Maxwell’s Slough Bridge
0.5 miles west and 1 mile south of St. Paul St. Paul (Neosho County)
St. Paul National Register 7/2/1985
Osage Mission Infirmary
325 Main Street St. Paul National Register 9/6/2005
State Street Bridge State Street over Neosho River Tributary
Erie National Register 7/2/1985
Thayer State Bank 201 Neosho Avenue Thayer State Register 11/8/2003
Tioga Inn 12 East main Chanute National Register 2/23/1990
Source: Kansas State Historical Society, www.kshs.org/resource/national_register/index.php

Neosho County DRAFT 3.99 Multi-Hazard Mitigation Plan January 2009
Community Assets by Jurisdiction
Table 3.30 below provides community assets by jurisdiction. These are specific assets identified by the planning committee as those structures and facilities that should receive priority consideration in efforts to minimize risk.
Table 3.30. Specific Community Assets in Neosho County
Name of Asset Replacement Value ($) Occupancy/ Capacity # Unincorporated County Ashley Clinics Not provided Not provided Labette Health Clinics Not provided Not provided NMRMC Hospital Not provided Not provided Law Enforcement Offices (3) Not provided Not provided Fire Departments (6) Not provided Not provided Power Plants (2) Not provided N/A Dams/Levees Not provided N/A Day Cares (numerous) Not provided Not provided Nursing Homes (numerous) Not provided Not provided Government Buildings (6) Not provided Not provided Numerous highways and bridges Not provided Not provided Communications Center/Back-up Not provided Not provided Utility Pipelines Not provided N/A Water Treatment Facilities (3) Not provided N/A Chanute Hospital Not provided Not provided Police (Memorial Building) Not provided Not provided Fire (Memorial Building) Not provided Not provided Emergency Operations Center (Memorial Building)
7,501,231 Not provided
Power Plants 48,339,516 N/A Water Plant 2,961,474 N/A Waste Water Plant 5,941,040 N/A Airport 2,057,122 Not provided Erie Fire Station 1,500,000 Not provided Electric Power Plant 4,933,557 N/A Courthouse Not provided Not provided Nursing Home Not provided Not provided Water Treatment Plant 2,635,933 N/A St. Paul Fire Station Not provided Not provided Clinic Not provided Not provided City Hall Not provided Not provided Nursing Home Not provided Not provided Corrections Not provided Not provided Water Plant Not provided N/A

Neosho County DRAFT 3.100 Multi-Hazard Mitigation Plan January 2009
Name of Asset Replacement Value ($) Occupancy/ Capacity # Post Office Not provided Not provided Water Treatment Not provided N/A Sewer Treatment Not provided N/A Church Not provided Not provided Museum Not provided Not provided Beachner Grain Not Provided Not Provided Westhoff Interiors Not Provided Not Provided Thayer Thayer Fire Station Building 282,591 50 Thayer Fire Station Equipment 275,000 N/A City Hall same bldg. as fire station 100 Thayer lake #1 Dam 1,500,000 N/A Thayer Lake #2 Dam 1,500,000 N/A Thayer Christian Preschool 85,000 Not provided Rehmert Day Care 90,000 Not provided Gindelsberger Day Care 90,000 Not provided Sanitary Sewer Lift Stations 125,434 N/A Water Treatment Plant 1,500,000 N/A Radio Communications 15,000 N/A City Lagoons (2 cells) Not provided N/A Generators 60,000 N/A Thayer Museum 123,123 Not provided City Park Band Shell 22,181 Not provided Beachner Grain Not provided Not provided W&G Fertilizer Not provided 15 Acorn Valley Cabinetry Not provided Not provided USD 101 Erie Elementary School 5,095,968 350 Galesburg Elementary School 2,479,721 120 Erie High School 6,928,695 230 Bus Barn 201,000 30 Central Office 710,629 10 USD 413 Chanute Elementary School 16,000,000 850 Chanute High School 25,000,000 850 Royster Middle School 20,000,000 600 Lincoln Early Learning Center 3,000,000 100 District Administration Office 450,000 50 Maintenance/Transportation Building 850,000 25 USD 447 Thayer Schools 3,454,014 350 USD 505 Chetopa Campus 12,000,000 362 St. Paul Campus (elem., middle, high)
8,000,000 330
Vehicle Fleet 1,600,000 N/A

Neosho County DRAFT 3.101 Multi-Hazard Mitigation Plan January 2009
Name of Asset Replacement Value ($) Occupancy/ Capacity # Neosho County Community College
Neosho County Community College Campus
28,000,000 250-263 residents 730-2000 students,
faculty, staff, patrons Heartland Electric Cooperative Urbana Substation 2,000,000 N/A 400 miles of electric distribution system
13,960,000 N/A
Radiant Electric Cooperative Electric distribution system serving rural areas; consisting of 1,126 poles and 64 miles of line, serving 336 meters
675,270 N/A
3.3.3 Vulnerability by Hazard
This section describes overall vulnerability and estimates potential losses for buildings, infrastructure, and critical facilities located in identified hazard areas. This vulnerability assessment was limited to the hazards that received moderate or high in planning significance scores based on HMPC input and results of the CPRI index.
Detailed vulnerability assessment is not provided for those hazards with low planning significance scores. Only a vulnerability overview is provided for those low-ranked hazards listed below:
• Earthquake • Expansive Soils • Soil Erosion and Dust
Vulnerability assessment for hazards receiving high or moderate planning significance scores is limited by the data available and methods of analysis vary by hazard type. Many of the identified hazards, particularly weather related hazards, affect the entire planning area, and specific hazard areas cannot be mapped geographically. For these hazards, which include drought, extreme heat, hailstorm, lightning, tornado, windstorm, and winter storm, vulnerability is mainly discussed in qualitative terms because data on potential losses to structures is not available.
Of the high and moderate significance hazards, flood is the primary hazard that varies between jurisdictions and has identified hazard areas. It is discussed first and the remaining hazards are presented in alphabetical order.

Neosho County DRAFT 3.102 Multi-Hazard Mitigation Plan January 2009
Flood Vulnerability
Overview
Planning Significance: Moderate. Overall vulnerability to flooding is highest in developed areas of the floodplains of the Neosho River and its tributaries. According to the vulnerability analysis and the loss estimates provided below in Table 3.31, the unincorporated areas of the county would be hit the hardest by a 100-year flood followed by the City of Erie and then the City of Chanute.
Methodology
A geographic information system approach (GIS) was used to quantify how flood risk varies across the planning area. During the vulnerability analysis process of this planning effort, the best available flood data for Neosho County was generated by HAZUS-MH MR3, FEMA’s software program for estimating potential losses from disasters. Although the preliminary Digital Flood Insurance Rate Maps are now available, they were not available during the vulnerability analysis phase of this process and they are not yet officially effective (effective date is June 2009).
HAZUS-MH was used to generate a 100-year floodplain for major rivers and creeks in the County (those with a minimum drainage area of 1.0 square mile). The software produces a flood polygon and flood-depth grid that represents the base flood. While not as accurate as official flood maps, these floodplain boundaries are useful in GIS-based loss estimation. Once the floodplain was generated, the software’s census-block level population and building inventory data was used to estimate numbers of residents potentially displaced by flooding and potential structural damages.
Flood Vulnerability: Estimated Potential Losses to Existing Development
HAZUS provides reports on the number of buildings impacted, building repair costs, and the associated loss of building contents and business inventory. Building damage can cause additional losses to a community as a whole by restricting the building’s ability to function properly. Income loss data accounts for business interruption and rental income losses as well as the resources associated with damage repair and job and housing losses. These losses are calculated by HAZUS using a methodology based on the building damage estimates. Flood damage is directly related to the depth of flooding. For example, a two-foot flood generally results in about 20 percent damage to the structure (which translates to 20 percent of the structure’s replacement value). HAZUS uses depth-damage curves to estimate building losses as the flood depth varies across the inundation area.
Default HAZUS-MH data was used to develop the loss estimates. Thus, the potential losses derived from HAZUS-MH, the best available data, may contain some inaccuracies. The building valuations used in HAZUS-MH MR3 are updated to R.S. Means 2006 and commercial data is updated to Dun & Bradstreet 2006. There could be errors and inadequacies associated with the

Neosho County DRAFT 3.103 Multi-Hazard Mitigation Plan January 2009
hydrologic and hydraulic modeling of the HAZUS-MH model. However, as depicted in the floodplain maps in the flood hazard profile section (Section 3.2.8), the HAZUS generated floodplain is very close to the floodplain presented in the preliminary digital flood insurance rate maps. The damaged building counts generated by HAZUS-MH are susceptible to rounding errors and are likely the weakest output of the model due to the use of census blocks for analysis.
After running the HAZUS analysis for a 100-year flood event, the building inventory loss estimates (which are linked to census block geography) were sorted by jurisdiction to illustrate how the potential for loss varies across the planning area. Table 3.31 shows estimated potential building losses by jurisdiction.
Table 3.31. Estimated Flood Losses by Jurisdiction
Jurisdiction
Building Damage
($)
Contents Damage
($)
Inventory Loss
($) Relocation Loss ($)
Capital Related Loss ($)
Rental Income Loss ($)
Wage Loss
($) Total
Loss ($) % of Total
Chanute 1,231,000 2,218,000 103,000 4,000 8,000 3,000 23,000 3,590,000 13%
Earlton 35,000 77,000 11,000 0 0 0 1,000 124,000 0%
Erie 1,714,000 2,440,000 55,000 2,000 4,000 2,000 124,000
4,341,000 15%
Galesburg - - - - - - - - -
St. Paul 94,000 142,000 7,000 0 0 0 2 245,000 1%
Stark - - - - - - - - -
Thayer 2,000 2,000 0 0 0 0 0 4,000 0%
Uninc. 10,564,000 8,874,000 399,000 7,000 27,000 2,000 43,000 19,916,000
71%
Total 13,640,000 13,753,000
575,000 13,000 39,000 7,000 191,002
28,220,000
100%
Source: HAZUS-MH MR3
Unincorporated areas of the County are at most risk to flood losses according to this analysis, accounting for 71 percent of the potential loss, with the City of Erie accounting for 15 percent and the City of Chanute accounting for 13 percent.
Figure 3.42 below shows estimated potential building losses by area.

Neosho County DRAFT 3.104 Multi-Hazard Mitigation Plan January 2009
Figure 3.42. Estimated Potential Losses from 100-Year Flood in Neosho County

Neosho County DRAFT 3.105 Multi-Hazard Mitigation Plan January 2009
Flood Vulnerability: Potential Population Displaced
HAZUS estimates for the population displaced during a 100-year flood event using U.S. Census data and flood depths. This analysis is shown in Table 3.32 the software estimates that 478 people from unincorporated areas of the County could be displaced and need sheltering as the result of a 100-year flood event with 179 displaced in Erie and 84 displaced in Chanute.
Table 3.32. Estimated Displaced Persons in Floodplain Neosho County
Jurisdiction Displaced Population
Short Term Needs
Chanute 84 34 Earlton 4 0 Erie 179 57 Galesburg - - St. Paul 5 0 Stark - - Thayer 0 0 Unincorporated 478 83 Total 750 174
Source: HAZUS MH MR3
Figure 3.43 below classifies areas of Neosho County by number of residents potentially displaced by a flood with an estimated one percent chance of occurrence in any given year (100-year flood event). As shown by the darker shaded areas on the map, Specific areas of risk include northeast portions of Chanute as well as the extreme west central section along the tributary to the Neosho and those areas in the floodplain of Little Turkey Creek. In Erie, the eastern portions of along Pucketts Run would be impacted. In St. Paul, the vulnerable areas are in the southwest portion of city limits. The areas of the unincorporated county that are at greatest risk can be seen all along the Neosho River and its tributaries. For the other incorporated cities of Neosho County there is little risk to people and property from flood damage.

Neosho County DRAFT 3.106 Multi-Hazard Mitigation Plan January 2009
Figure 3.43. Potential Population Displaced by 100-Year Flood in Neosho County

Neosho County DRAFT 3.107 Multi-Hazard Mitigation Plan January 2009
Flood Vulnerability: Critical Facilities, Pipelines, and Electric Lines
Critical facilities data from the State of Kansas, the National Bridge Inventory, and the National Inventory of Dams (the latter two from HAZUS-MH) was used along with the floodplain generated by HAZUS-MH to identify critical facilities in the floodplain.
Based on this analysis, the six critical facilities in the Neosho County floodplain are four scour-critical bridges, a waste water treatment facility in Erie, and a waste water treatment facility in Galesburg. Galesburg did not participate in this planning process. As a result, this data has not been validated. Table 3.33 and Figure 3.44 below show the results of this analysis.
Table 3.33.Critical Facilities in the 100-Year Floodplain in Neosho County
Flooded Critical Facility Name Near City
Flood Depth (ft)
Scour Critical Bridge K39 Hwy Stark 7.51 Scour Critical Bridge K57 Hwy St Paul 9.06 Scour Critical Bridge US 59, K57 Hwy Erie 4.24 Scour Critical Bridge US 169 Hwy Chanute 5.82 Waste Water Treatment City of Erie Waste Water Treatment
Plant Erie 4.86
Waste Water Treatment Galesburg Galesburg 2.13 Source: HAZUS MH MR3

Neosho County DRAFT 3.108 Multi-Hazard Mitigation Plan January 2009
Figure 3.44.Neosho County Critical Facilities in the 100-Year Floodplain

Neosho County DRAFT 3.109 Multi-Hazard Mitigation Plan January 2009
A scour index is used to quantify the vulnerability of a bridge to structural damage during a flood due to undermining or displacement of bridge supports during increased river flow volumes. Bridges with a scour index between 1 and 3 are considered scour critical, which means their foundation elements are unstable for the observed or evaluated scour condition.
There are nine scour critical bridges in Neosho County, all located on main highways. One is located north of Chanute off of Highway 169 almost on the Neosho/Allen County boundary; another is located south of Chanute approaching Earlton on Highway 169. Four scour critical bridges are located east of Chanute on Highway 39 toward Stark. Two are on Highway 59, one to the north and one to the south of Erie. One scour critical bridge is located on Highway 47 between St Paul and its intersection of Highway 59. The location of these bridges is shown in Figure 3.45 below.

Neosho County DRAFT 3.110 Multi-Hazard Mitigation Plan January 2009
Figure 3.45.Neosho County Bridges

Neosho County DRAFT 3.111 Multi-Hazard Mitigation Plan January 2009
Figure 3.46 below maps locations of pipelines and powerlines in relation to the 100-year floodplain. Pipeline and powerline intersections with the floodplain are concentrated in northwestern portion of the County north of Chanute, potentially complicating repair of these facilities if damage were to occur during a flood event.

Neosho County DRAFT 3.112 Multi-Hazard Mitigation Plan January 2009
Figure 3.46. Neosho County Pipelines and Utilities in Relation to the 100-Year Floodplain

Neosho County DRAFT 3.113 Multi-Hazard Mitigation Plan January 2009
Flood Vulnerability: Critical Facility Locations by City
Figures 3.48 through 3.54 below map the locations of critical facilities in relation to the 100-year floodplain for the incorporated cities of Neosho County.
Figure 3.48. Critical Facilities in Relation to 100-Year Floodplain: Chanute

Neosho County DRAFT 3.114 Multi-Hazard Mitigation Plan January 2009
Figure 3.49. Critical Facilities in Relation to 100-Year Floodplain: Earlton

Neosho County DRAFT 3.115 Multi-Hazard Mitigation Plan January 2009
Figure 3.50. Critical Facilities in Relation to 100-Year Floodplain: Erie

Neosho County DRAFT 3.116 Multi-Hazard Mitigation Plan January 2009
Figure 3.51. Critical Facilities in Relation to 100-Year Floodplain: Galesburg

Neosho County DRAFT 3.117 Multi-Hazard Mitigation Plan January 2009
Figure 3.52. Critical Facilities in Relation to 100-Year Floodplain: Stark

Neosho County DRAFT 3.118 Multi-Hazard Mitigation Plan January 2009
Figure 3.53. Critical Facilities in Relation to 100-Year Floodplain: St. Paul

Neosho County DRAFT 3.119 Multi-Hazard Mitigation Plan January 2009
Figure 3.54. Critical Facilities: Thayer

Neosho County DRAFT 3.120 Multi-Hazard Mitigation Plan January 2009
National Flood Insurance Program and Repetitive Flood Loss Properties
Of the five jurisdictions participating in this plan, four are currently participating in the National Flood Insurance Program: Neosho County, Chanute, Erie, and St. Paul all participate in the National Flood Insurance Program and have Flood Insurance Rate Maps designating the 100-year flood hazard. Thayer is in the process of completing the paperwork necessary for participation. The city has annexed a large piece of ground to the southwest. Streets included in the annexed area are Lake View, Prairie, and Timber Streets. There is a sizeable floodplain in the annexed area. The original flood map was rescinded but these annexations will require that the city adopt a floodplain management ordinance. Earlton, Galesburg, and Stark are not currently in the NFIP. These three jurisdictions did not participate in this plan. There are no repetitive loss properties in Neosho County. Table 3.34 below outlines NFIP participation status for Neosho County communities.
Table 3.34 Community Participation in the National Flood Insurance Program in Neosho County
Jurisdiction Date Joined Effective FIRM
Date
Policies in
Force
Insurance in Force
($)
Number of
Claims
Claims Totals
($) Neosho County
2/61995-Emergency Program 2/1/2005-Regular Program Entry
2/1/2005 (study underway)
31 3,540,000 14 417,072
Chanute 5/13/1975-Emergency Program 1/13/1979 Regular Program Entry
7/5/2001 (study underway)
63 3,813,600 24 500,375
Erie 4/4/1975-Emergency Program 7/17/1978-Regular Program Entry
12/3/1993 (study underway)
27 1881000 7 145,295.33
St. Paul 2/21/1978-Emergency Program 9/5/1990-Regular Program Entry
9/5/1990 (study underway)
5 503,500 2 49,445
Source: National Flood Insurance Program: SFHA=Special Flood Hazard Area
Agricultural Infestation Vulnerability
Overview
Planning Significance: Moderate. Of the 368,400 land acres (576 square miles) in Neosho County, 341,000 acres (92.5 percent) are classified as farm land. In 2006, the value of crops harvested in Neosho County was $21,851,100 and the value of cattle and milk production was $16,036,000 ($37,887,100 combined total). A widespread infestation of agricultural products could seriously impact the economic base of the planning area.
Potential Losses to Existing Development
Buildings, infrastructure, and critical facilities are not vulnerable to this hazard. Its impacts are primarily economic and environmental, rather than structural affects. Rough estimates of potential direct losses fall in a range of 1-50 percent of annual crop receipts for the County and/or a 1-75 percent of livestock receipts. Based on a worst case scenario where 50 percent of crop production and 75 percent of livestock is lost in a given year due to agricultural infestations, the total direct costs could be nearly $23 million. Indirect costs are not estimated in this analysis.

Neosho County DRAFT 3.121 Multi-Hazard Mitigation Plan January 2009
Future Development
Future development is not expected to impact Neosho County’s vulnerability to this hazard.
Dam and Levee Failure Vulnerability
Overview
Planning Significance: Moderate. Dam or levee failure is typically an additional or secondary impact of another disaster such as flooding or earthquake. The impacts to the County and its municipalities from a dam failure would be similar in some cases to those associated with flood events (see the flood hazard vulnerability analysis and discussion). The biggest difference is that a catastrophic dam failure has the potential to result in a much greater loss of life and destruction to property and infrastructure due to the potential speed of onset and greater depth, extent, and velocity of flooding. Another difference is that dam failures could flood areas outside of mapped
According to the National Inventory of Dams, Neosho County has 63 total state or federal regulated dams. Of those, two are high hazard dams and one is a significant hazard dam. Detailed descriptions are provided in section 3.2.3
• Lake Parsons Dam—This high hazard dam is located on Labette Creek forms Lake Parsons, a community lake in Neosho County, which is used for drinking water purposes. Because it drains downstream into Labette County, it does not impact any structures in Neosho County.
• L.D.H., Inc. Lake Dam—This high hazard dam and the lake it forms is owned by L.D.H. Farms, Inc. of Chanute, Kansas. The earthen dam impounds water from Turkey Creek and was completed in 1989. It is privately owned but is regulated by the Kansas Department of Water Resources. It is 24 feet high and is used for recreational purposes.
• Marion P. Stevens Dam—This significant hazard dam impounds water on the Big Creek and forms Stevens Lake, owned by the Stevens family. The dam is of earthen construction, is 642 feet long and 26 feet high. The dam creates a farm pond which is not state regulated.
• The flood control structure at Santa Fe Lake in the City of Chanute was previously listed as a levee structure. However, during the re-mapping effort to provide digital flood insurance rate maps for the county, this structure was re-categorized as a dam. The hazard significance of this dam is unknown at this time.
There are several levees in and around Chanute and Erie. However, many of these serve to contain low-frequency flooding and agricultural land and are overtopped during significant events. In some instances, these levee systems may provide a false sense of protection. It should be noted that the HAZUS flood analysis for the 100-year flood scenario does not take into account any protection provided by these levees. So, the vulnerability analysis for flood shows the areas that would be impacted if and when the limited protection ability of the levees is surpassed.

Neosho County DRAFT 3.122 Multi-Hazard Mitigation Plan January 2009
Potential Losses to Existing Development
Dams
Losses from a dam failure will vary based on the dam involved, warning time, and time of day, but the potential exists for property losses into the millions and multiple deaths and injuries. Impacts to critical facilities would be similar to those identified in the flood vulnerability analysis.
The Kansas Division of Water Resources, Water Structures Program was contacted to obtain dam inundation maps and Emergency Action Plans (EAPs) for the high hazard dams. The inundation maps and Emergency Action Plans are not available for any of the high hazard dams in Neosho County that are regulated by the State. However, general descriptions of those areas that might be impacted by breach or failure are provided below. This information is provided for planning purposes only and is not intended to make inundation determinations that would be provided in an Emergency Action Plan.
• Lake Parsons Dam would not impact structures in Neosho County because it drains downstream into Labette County.
• LDH, Inc. Lake Dam—impacts of breach or failure are unknown at this time. • Marion P. Stevens Dam—According to the draft mitigationplan.com draft plan, one
residence would be affected by breach or failure of this dam. • Santa Fe Lake Dam--According to the City of Chanute, if the Santa Fe Lake Dam breached
or failed, 7-10 businesses could be impacted
Breach of John Redmond Reservoir Dam, Marion Reservoir, or Council Grove Reservoir in counties upstream could have more serious impacts to the planning area. A breach in these dams could flood residential, commercial, and agricultural areas downstream in the Neosho River basin, including the communities of Chanute, Erie, and St. Paul in Neosho County. Impacts would be similar to those listed under flood impacts. Many other adverse social and economic consequences could occur. A 1982 document entitled "Operation and Maintenance Manual, Volume II, Contingency Plans for Emergencies", prepared by the U.S. Army Corps of Engineers includes information on the John Redmond Reservoir. In the event of a catastrophic event, the maps identified flood waters impacting the City of Humboldt in adjacent Allen County within approximately 20 hours, and impacting the Town of Erie in approximately 28 hours.
Emergency Action Plans associated with the USACE-regulated dams upstream of Neosho County are on file with USACE. Specific information on downstream impacts is considered sensitive due to Homeland Security concerns, and is not presented in this public document
Although the capability to compute specific potential losses specific to dam and levee failure is not currently available, the HMPC estimated to be in the range of 1-50 percent of total potential losses from flooding. Considering a worst case scenario, this could total $6.8 million in direct losses.

Neosho County DRAFT 3.123 Multi-Hazard Mitigation Plan January 2009
Levees
The loss estimates generated from HAZUS in the flood vulnerability section can be considered inclusive of levee failure losses, as HAZUS did not account for levee protection at Chanute or Erie or other areas of the County. In addition, the levees present in Neosho County provide limited protection and are not considered to provide protection from the 100-year flood.
Future Development
Future development located in downstream from dams in floodplains or inundation zones would negatively impact Neosho County’s vulnerability to this hazard. The three cities with population growth for the 1990-2007 period are each located at safe distances from floodplains, but future development in unincorporated areas could be vulnerable to dam failure impacts.
Drought Vulnerability
Overview
Planning Significance: Moderate. Negative impacts of drought are primarily economic and environmental. With over ninety two percent of the land area of Neosho County used for agricultural purposes, the planning area has significant exposure to this hazard. In addition to potential economic impacts, water supplies for local communities can also be threatened and soil erosion, dust, and wildfire hazard can all be exacerbated by drought conditions.
Potential Losses to Existing Development
Drought normally does not impact structures and it can be difficult to identify specific hazard areas. According to the three-year period for which data is available from USDA’s Risk Management Agency, (see previous occurrences section under drought profile in section 3.2.4) the average amount of annual claims paid for crop damage as a result of drought in Neosho County was $589,013. The HMPC realizes that USDA claims only represent a small portion of the actual damages. Aside from agricultural impacts, other losses related to drought include increased costs of fire suppression and damage to roads and structural foundations due to the shrink dynamic of expansive soils during excessively dry conditions.
The planning committee reviewed previous drought events in Neosho County and in Kansas, and made the following findings concerning a future drought event in Neosho county: (1) that 75% of the land area could be impacted; (2) that few injuries and few illnesses would result; (3) that few properties would be destroyed; (4) that there would be high direct costs and low indirect costs; (5) that 15 percent of the population would be at risk; and (6) that structures would not be at risk.

Neosho County DRAFT 3.124 Multi-Hazard Mitigation Plan January 2009
Future Development
As population grows, demand for water increases for household, commercial, industrial, recreational, and agricultural uses. Population has declined in Neosho County over previous few decades and currently new development is limited in scale. Future development is unlikely to exacerbate drought conditions in the short term.
Earthquake Vulnerability
Overview
Planning Significance: Low. As discussed under the magnitude section of the profile for this hazard (Section 3.2.5), there is only a 2 percent probability of an earthquake exceeding a peak acceleration of 4 percent gravity in the next 50 years in the Neosho County planning area. Typically, significant earthquake damage occurs when accelerations are greater than 30 percent of gravity. With this in mind, the HMPC has determined that the planning area is not vulnerable to significant earthquake damage.
Expansive Soils Vulnerability
Overview
Planning Significance: Low. The HMPC has determined that while the entire planning area is vulnerable to some structure damage as a result of shrinking and expanding soils, there is no data available to determine damage estimates for this hazard. In most cases, individual property owners pay for repairs to damages caused by this hazard. The HMPC felt that underground water pipes may be at risk to damages associated with expansive soils. However, there is no data to support damages and costs associated with this hazard at this time.
Extreme Heat Vulnerability
Overview
The population that is most vulnerable to extreme heat impacts are persons over age 65. Individuals below the federal poverty level also may also be at increased risk to extreme heat in cases where air conditioning is not affordable. Based on information from the 2000 U.S. Census, Table 3.35 below compares the percentage of persons over age 65 and the percentage of persons below the federal poverty level in the incorporated participating jurisdictions to state and national averages.

Neosho County DRAFT 3.125 Multi-Hazard Mitigation Plan January 2009
3.35. Selected Demographic and Economic Characteristics, Neosho County 2000
Community Population
2000 Age 65 and Over (%) Individuals Below Poverty Level (%)
United States 281,421,906 12.4 12.4
Kansas 2,688,418 13.3 9.9
Neosho County 16,997 17.5 13.0
Chanute 9,411 18.9 15.0
Earlton 80 18.8 7.0
Erie 1,211 19.9 14.9
Galesburg 150 18.7 13.8
Stark 106 11.3 17.2
St. Paul 646 22.8 10.7
Thayer 500 12.2 9.9 Source: 2000 Census, U.S. Census Bureau Note: The Census Bureau defines the poverty level using a set of money income thresholds that vary by family size and composition
The HMPC identified the power distribution infrastructure as vulnerable to brownouts or blackouts during periods of extreme heat when the use of air conditioning puts a strain on power generation and transmission.
Potential Losses to Existing Development
Extreme heat normally does not impact structures and it is difficult to identify specific hazard areas. Heavy trucking can increase wear and tear on roadways during periods of extreme heat though the cost of these impacts is difficult to quantify. Stress on livestock and minor to moderate reductions in crop yields due to are also typical impacts of extended periods of high temperatures.
Nursing homes and elder care facilities are especially vulnerable to extreme heat events. These facilities are provided in Table 3.28 in Section 3.3.2. The power infrastructure is known to be at risk, but at this time, there is no data available to estimate potential dollar losses as a result of power failure during extreme heat events.
Future Development
A growing population increases the number of people vulnerable to extreme heat events; new development increases the strain on the power grid during extreme heat periods. In general, population and development trends in Neosho County are declining and unlikely to increase vulnerability to extreme heat in the short term.

Neosho County DRAFT 3.126 Multi-Hazard Mitigation Plan January 2009
Hailstorm Vulnerability
Overview
Planning Significance: Moderate. In general, assets in the planning area that are vulnerable to hail damage include crops and built structures. Of these, damages to crops as a result of hail can be the most devastating. If hail size is large in diameter and crops are at a vulnerable stage in the plant/harvest cycle, it is possible for a great percentage of crop yields to be lost as a result of even a single hail event.
Structure damage, such as roof damage, damages to siding and windows occurs frequently with hail damage and is usually covered under private insurance. Specific structural damages in the planning area as a result of hail damage are not available.
Personal injury can also occur as a result of very large hail if individuals are outdoors during a hail event.
Potential Losses to Existing Development
The NCDC reports that $1.1 million in property and crop damage occurred from 1993-1998. Information on the percentage of this total attributed to structural damage is not available.
According to the USDA Risk Management Agency, insured crop losses in Neosho County as a result of hail in 2005 totaled $560,357, outlined in Table 3.36 below. No claims were reported in 2006 and 2007. Based on information from this three year period, the average annual crop loss as a result of hail is in excess of $186,000. The HMPC realizes that this estimate is low as many losses are either not insured or a claim is not filed for compensation.
Table 3.36 Crop Loss Claims Paid as a Result of Hail, Neosho County 2005
Year Crop Hazard Claims Paid ($) 2005 Corn Hail $254,290 2005 Grain Sorghum Hail $18,530 2005 Soybeans Hail $287,537 Total $560,357
Source: USDA’s Risk Management Agency, April 2008
Future Development
Development trends are unlikely to increase vulnerability to hailstorms.
Lightning Vulnerability
Overview
Planning Significance: Moderate. The NCDC reports no injuries or fatalities resulting from lightning strikes from 1993-2007, but it is nonetheless a significant public safety hazard. National Weather Service data indicates that Neosho County is in a region that receives four to

Neosho County DRAFT 3.127 Multi-Hazard Mitigation Plan January 2009
eight lightning strikes per square kilometer per year. Most of these lightning strikes do not result in damages, but electronic equipment located inside buildings is vulnerable. Communications equipment and warning transmitters and receivers could be knocked out by lightning strikes.
Potential Losses to Existing Development
Structures in exposed locations at high elevation relative to its surroundings is the most vulnerable existing development. Estimates of damage and potential losses at these facilities are not currently available.
Future Development
Future development is unlikely to increase vulnerability to lightning.
Soil Erosion
Vulnerability Overview
Planning Significance: Low. The assets that are most vulnerable to soil erosion in the planning area are agricultural land, bridges, roads, and water supplies that can fill with sediment. The vulnerability of bridges and roads to erosion is discussed under the flood hazard since the main cause of damaging erosion to these structures is flood waters rushing past and washing out the soil.
Tornado Vulnerability
Overview
Planning Significance: High. Neosho County is located in a region of the U.S. with very high frequency of dangerous and destructive tornadoes. On at least two occasions tornadoes have resulted injuries to residents of Neosho County and there have been six occurrences with tornado related damages topping $250,000.
Warning time for tornadoes is relatively short. Children, the elderly and disabled persons are particularly vulnerable to such hazards with rapid onset. There is an identified need for additional storm shelters in Neosho County that can withstand the force of a major tornado and to protect the safety of residents. The HMPC notes that many homes in the planning area are old with declining structural integrity and thus susceptible to impacts from even minor tornadoes.
Potential Losses to Existing Development
To estimate vulnerability to tornadoes, the HMPC considered the impacts of the EF5 tornado that hit Greensburg, Kansas in May of 2007. Although the EF5 magnitude event is not a common occurrence, this event was used for comparative analysis due to the lack of specific damages information for events of a lesser magnitude as well as the desire to consider a worst-case scenario for this hazard with high planning significance in Neosho County. There are many variables that come in to consideration when attempting to estimate vulnerability to tornadoes

Neosho County DRAFT 3.128 Multi-Hazard Mitigation Plan January 2009
such as wind speed, time on the ground, affected population density, affected building density, width of ground swath, and time of day. Therefore, the HMPC chose to consider a worst-case scenario for planning purposes. This is consistent with the methodology applied by FEMA in design and construction of tornado saferoom structures, which are designed to withstand an EF5, or worst-case scenario event.
Greensburg is approximately 20 miles west of Erie. The tornado was 1.7 miles in width and traveled 22 miles. It directly impacted the city, destroying 95 percent of all structures and severely damaging the remaining 5 percent. Greensburg at the time had a population of approximately 1,500 across a 1.5 square mile area. By comparison, Erie is similar with a population in 2006 of 1,276 people and is 0.9 square miles in size.
If a tornado event similar to that of Greensburg occurred in the populated sections of the planning area, it is conceivable that a similar level of destruction could occur. Table 3.37 estimates potential losses for an EF5 event by calculating a 95 percent loss of structure value in the damaged area of each. Damaged area was calculated by dividing the impacted area of Greensburg (1.5 square miles) by the area of each jurisdiction. For cities with areas less than or equal to the City of Greensburg, impact to 100 percent of the city area was assumed. This analysis indicates that a scenario similar to that of Greensburg in any one of the participating jurisdictions could result in damages totaling in the millions for even the smallest communities.
Table 3.37 Potential Property Loss from EF5 Tornado by Jurisdiction
Community City Area Number of Structures
Total Structure Value ($)
City Area Damaged by EF5* (%)
95% Structural Value Loss in Damaged Area ($)
Chanute 6.2 5,321 709,365,000 24.2 163,083,014 Earlton 0.1 61 4,557,000 100 4,329,150 Erie 0.9 867 77,358,000 100 73,490,100 Galesburg 0.2 90 19,576,000 100 18,597,200 Stark 0.2 360 51,979,000 100 49,380,050 St. Paul 1.1 62 5,316,000 100 5,050,200 Thayer 0.7 279 33,295,000 100 31,630,250
The Kansas Hazard Mitigation Plan lists data from the NCDC on total property losses and annualized losses due to tornados from 1950-2006, analyzed by county. In Neosho County, the estimate for past damage in 2008 dollars is $8,184,641 and annualized property damage is $143,590.
Future Development
Future development projects should consider tornado hazards at the planning, engineering and architectural design stage. In particular, school construction projects should consider the incorporation of tornado safe rooms as this is one of the priority uses determined by the State of Kansas Division of Emergency Management for FEMA mitigation grant funds.
Neosho County DRAFT 3.129 Multi-Hazard Mitigation Plan January 2009
Utility/Infrastructure Failure Vulnerability
Overview
Planning Significance: Moderate. Utilities and infrastructure are vulnerable to damage by many natural hazards. Typically the events that cause the most damages are flood, winter storm, and wind storm. However, even buried infrastructure is at risk to damage from expansive soils and manmade causes whether intentional or unintentional. The electrical grid is vulnerable in periods of extreme heat when air conditioning use peaks. Public health and safety and the economy are the primary concerns with this hazard.
Potential Losses to Existing Development
By definition, this hazard includes all infrastructure and critical facilities that could be impacted by one or more hazard events. Electrical blackouts and power surges can damage high tech equipment but generally causes no structural damage.
Future Development
Future development can increase vulnerability to this hazard by placing additional strains on existing infrastructure and by increasing the size and thus the exposure of infrastructure networks.
Wildfire Vulnerability
Overview
Planning Significance: Moderate. According to the HMPC, the areas that are most vulnerable to wildfire are agricultural areas where CRP land is burned, rural areas where trash and debris are burned, and the wildland-urban interface areas. According to the Kansas Incident Fire Reporting System, from 2003-2006, Neosho County lost an average of 1,465 (a total of 4,396 over a three year period) acres per year to wildland fires.
In April 2007, the Kansas Forest Service prepared a Community Wildfire Hazard Assessment Report. The assessment concluded the following: St. Paul, Earlton, Urbana, Kimball, Thayer, Shaw, Galesburg, Chanute and Erie were all determined to be low risk areas for wildfire. Stark, South Mound, and Morehead were determined to have a moderate risk for wildfire. This moderate rating was assigned as a result of the heavy fuel loads of hardwood timber, grass and eastern red cedar mix that have little or no break in the fuel continuity between the communities and the surrounding vegetation fuels. There is also an “intermix” WUI condition in some parts of these communities. Intermix WUI occurs when vegetation in vacant lots within the community could carry a vegetation fire that could spread to surrounding buildings.
Potential Losses to Existing Development
Homes built in rural areas are more vulnerable since they are in closer proximity to CRP land that is burned and homeowners are more likely to burn trash and debris in rural locations. The

Neosho County DRAFT 3.130 Multi-Hazard Mitigation Plan January 2009
vulnerability of structures in rural areas is exacerbated due to the lack of hydrants in these areas for firefighting and the distance required for firefighting vehicles and personnel to travel to respond.
Future Development
Future development in the wildland-urban interface would increase vulnerability to this hazard.
Windstorm Vulnerability
Overview
Planning Significance: High. Damaging windstorms are a common occurrence in the planning area. Damages frequently occur to structures and power lines. Debris flying from high wind events can shatter windows in structures and vehicles and can harm people that are not adequately sheltered.
Potential Losses to Existing Development
Campers, mobile homes, barns, and sheds and their occupants are particularly vulnerable as windstorm events in Neosho County can be sufficient in magnitude to overturn these lighter structures. Overhead power lines and infrastructure are also vulnerable.
Future Development
Future development projects should consider windstorm hazards at the planning, engineering and architectural design stage.
Winter Storm Vulnerability
Overview
Planning Significance: High. The entire planning area is vulnerable to the effects of winter storm. During periods of heavy snow fall, transportation can be treacherous. The most significant damage during winter storm events occurs when freezing rain and drizzle accumulate on utility poles and power lines causing widespread power outages. Since the power outages associated with winter storm occur during cold weather, the population is at risk to cold temperature exposure. As with extreme heat events, the elderly populations are considered to be more vulnerable. See the vulnerability section for Extreme Heat for a discussion of the vulnerability of the elderly population.
Potential Losses to Existing Development
Buildings that have tree limbs hanging over the structure are more vulnerable to damage by falling tree limbs. The power poles and power lines are the critical facilities that are most vulnerable. Roads and bridges become covered with snow and ice making travel treacherous. This can impact the response of emergency vehicles. Businesses experience loss of income as a result of closure during power outages.

Neosho County DRAFT 3.131 Multi-Hazard Mitigation Plan January 2009
In the most recent Presidential Disaster Declaration for a winter storm event, Neosho County received over $1.4 Million in FEMA Public Assistance. It is anticipated that in a similar event, this level of damages would occur. It should be noted that this amount does not take in to consideration damages incurred by private businesses or other expenses non-reimbursable by FEMA or other damages that may have been covered by private insurance.
Future Development
Future development could potentially increase vulnerability to this hazard by increasing demand on the utilities and increasing the exposure of infrastructure networks.
3.3.4 Future Land Use and Development
For the most part, Neosho County is not experiencing population growth. Table 3.38 provides information on changes in population and housing units in the planning area. Despite the overall lack of population growth, development is occurring at certain location in the county. Three of Neosho County’s smaller communities are experiencing population growth, Earlton, Stark and Thayer. New development should be monitored to ensure that it does not take place in hazard-prone areas, specifically in the floodplains, dam inundation areas and the wildland-urban interface.
Table 3.38. Change in Population and Housing Units
Location 1990
Population 2007
Population Percent Change
1990-2007 1990 Housing
Units 2000 Housing
Units Percent Change
1990-2000 Neosho County
17,035 16,228 -4.7 7,726 7,461 -3.4
Chanute 9,488 8,854 -6.7 4,426 4,262 -3.7 Earlton 69 78 13.0 29 32 10.3 Erie 1276 1,150 -9.9 568 545 -4.0 Galesburg 160 146 -8.8 77 72 -6.5 Stark 79 103 30.4 42 47 11.9 St. Paul 687 655 -4.7 251 241 -4.0 Thayer 435 448 3.0 218 203 -6.9 Unincorporated 4,841 4,754 -1.8 2,115 2,059 -2.7
Source: US Census; Kansas Department of the Budget, http://budget.ks.gov/files/FY2010/KS_Certified_Population_July2008.xls
Planned Development/Expansion Activities
In Erie, the city has determined that future expansion will be slated towards non-hazard areas. A new nursing home and a new school are planned for construction on the north end of Erie where land has been annexed. Plans include infrastructure expansion and new housing additions in that area as well. Figure 3.50 shows the approximate location of the annexed area and planned construction area.

Neosho County DRAFT 3.132 Multi-Hazard Mitigation Plan January 2009
In Chanute, the South Santa Fe growth area will receive street improvements. This area is not in a floodplain. A new school with an FEMA tornado safe room is planned for construction in the area near 35th and Plummer. This area is not in the floodplain. A new housing development, hospital expansion project, and Oil Patch Oil Field Supply Store are planned for the area at 7th and Plummer. A new school with a FEMA safe room is planned for construction at this location as well. Current land use in Chanute is 60% residential, 30% commercial, and 10% other.
St. Paul is considering construction of a new water tower and a new water plant. Details on the locations have not yet been determined. Current land use in St. Paul is 85% residential and 15% commercial.
In Thayer, a new Community Building is planned for construction at the Thayer City Park. This building will be used for community events, fund raisers, private parties, and other community events. In addition, the city has annexed a large piece of ground to the southwest (refer to the map in figure 3.x). Streets in the annexed area are Lake View, Prairie, and Timber Streets. There is a sizeable floodplain in the annexed area. The original flood map was rescinded but these annexations will require that the city adopt a floodplain management ordinance. If development occurs in this area, the city’s vulnerability to flood hazard could increase.
Unified School District 101 is in the process of constructing a new high school in Erie. This school will have a FEMA-approved safe room funded in part by a FEMA Hazard Mitigation Grant Program Grant. Erie Elementary and Galesburg Elementary are both slated to undergo remodeling to include new FEMA-approved saferooms, also funded in part by FEMA Hazard Mitigation Grant Program funds.
Unified School District 505 is in the process of constructing a new high school in St. Paul. This will be complete by July 1, 2009 and will house two FEMA safe rooms.
Neosho County Community College reports that new regulations under the Higher Education Reauthorization Act and Americans with Disabilities Amendment Act may potentially significantly increase the number of intellectually-disabled individuals seeking educational opportunities on the NCCC campus. An increase in the number of these types of students could impact the ability to handle certain emergency operations such as emergency evacuations in the event of fire, or emergency shelter in the event of severe weather.
For the entire seven-county distribution area, Radiant Electric Cooperative is planning $363,000 in system expansion/improvements. Of this amount, $108,000 will go toward new metering infrastructure, $90,000 in new services, $85,000 in new tie lines, $80,000 in service uprates and pole changeouts.

Neosho County DRAFT 3.133 Multi-Hazard Mitigation Plan January 2009
3.3.5 Summary of Key Issues
Table 3.39 shows the results of the Hazard Ranking in order of High to Low Planning Significance based on the methodology described in section 3.1.
Table 3.39 Neosho County Hazard Ranking-High to Low Planning Significance
Hazard Type Probability Magnitude Warning
Time Duration CPRI Planning
Significance Tornado 4 3 4 1 3.4 High Winter Storm 4 2 2 3 3 High Agricultural Infestation 4 2 1 4 2.95 Moderate Windstorm 4 2 2 2 2.9 Moderate Flood 3 3 2 3 2.85 Moderate Utility / Infrastructure Failure 3 2 4 3 2.85 Moderate Hailstorm 4 2 2 1 2.8 Moderate Dam and Levee Failure 3 3 2 1 2.65 Moderate Drought 3 2 1 4 2.5 Moderate Wildfire 3 1 4 2 2.45 Moderate Extreme Heat 3 2 1 3 2.4 Moderate Lightning 3 1 2 1 2.05 Moderate Expansive Soils 2 1 1 4 1.75 Low Soil Erosion & Dust 2 1 1 4 1.75 Low Earthquake 1 1 4 1 1.45 Low The HMPC will focus efforts for the mitigation strategy on those hazards with a moderate and high planning significance. The following section summarizes key issues brought out by the risk assessment.
Tornado
• Not all schools/public buildings have saferooms. • Public may not be aware of existing shelter locations • Need new/updated indoor and outdoor warning systems • Mobile homes are specifically vulnerable Winter Storm
• Snow load on roofs can cause structure damage • Ice accumulation damages power lines and power infrastructure causing prolonged power
outages • Roads become hazardous for motorists • Schools and businesses close as a result of power outages and treacherous road conditions

Neosho County DRAFT 3.134 Multi-Hazard Mitigation Plan January 2009
• Freeze conditions can cause losses to crop yield. Over $1 million in crop insurance claims as a result of freeze conditions from 2005-2007.
Agricultural Infestation
• Crops are vulnerable to Septoria leaf disease, tan spot, stripe rust, powdery mildew, and scab • Grasshopper infestation has occurred Windstorm
• Frequent wind events cause damage to power lines • Unsecured mobile homes, campers, barns, and sheds and their occupants are specifically
vulnerable • Trees and tree limb debris damage power lines, power infrastructure, structures, and
automobiles • Storefront windows are vulnerable to damage from high-winds • Roofs are frequently damaged Utility / Infrastructure Failure
• Can be a secondary impact of other hazard events such as flood, tornado, windstorm, winter storm, lightning or extreme heat
Flood
• Earlton, Galesburg, Stark, are not currently in the National Flood Insurance Program • Thayer is not currently in the National Flood Insurance Program. But they are in the process
of completing the necessary paperwork • Homes and businesses throughout the county were impacted by June/July 2007 flood event • North and northeast portions of Chanute were inundated • Some areas of Chanute were cut off from gas and electric service • The northern part of Erie along Puckets Run flooded as a result of the levee breach • Many homes that flooded did not have flood insurance • HAZUS loss-estimation indicates the potential for over $28 million in damages in the
planning area. • The Erie Wastewater treatment plant is the floodplain • There are nine scour critical bridges in the planning area • Low-lying roads become covered with water in flash flooding and riverine flooding • Crop insurance claims a result of flooding and excess moisture totaled over $4.5 million from
2005-2007. Hailstorm
• 113 hail events in a 53-year period • Crops and roofs are damaged by large hail events Dam and Levee Failure
• 63 state or federal regulated dams; two are high hazard dams, one is a significant hazard dam • Three upstream U.S. Army Corps of Engineers Reservoirs: Marion Reservoir, Council
Grove Reservoir, and John Redmond Dam

Neosho County DRAFT 3.135 Multi-Hazard Mitigation Plan January 2009
• Levee systems in and around Chanute and Erie provide protection from low-frequency flooding only
• During Summer 2007 flood event, the levee south of Chanute on the Neosho River broke and water went over the top of the levee into Erie damaging businesses, churches, and several residences
• In August, 2005, a levee broke one mile east of Ash Grove Cement Plant in Chanute, leaving a 45-foot hole.
• Inundation maps and emergency action plans are not available for either of the two state-regulated high hazard dams in the planning area
Drought
• Private wells are vulnerable to water shortage • Agricultural production can be severely impacted Wildfire
• St. Paul, Earlton, Urbana, Kimball, Thayer, Shaw, Galesburg, Chanute and Erie were all determined to be low risk areas for wildfire.
• In Thayer, wildfires can be ignited when sparks from the railroad ignite nearby vegetation • Stark, south Mound, and Morehead were determined to have a moderate risk for wildfire as a
result of heavy loads of hardwood timber, grass and eastern red cedar mix that have little or no break in the fuel continuity between the communities and the surrounding vegetation fuels.
Extreme Heat
• Instability of the electrical grid has been an issue during periods of extreme heat. • Identification and notification of cooling centers is needed • Elderly populations are at increased risk. Neosho County has a high percent of elderly
citizens. Lightning
• Communications towers and facilities are vulnerable to lightning strikes • Lightning damages electronics equipment • Lightning can cause structure fires Expansive Soils
• Streets and parking lots throughout the county are damaged every year by the effects of expansive soils.
• Roads, bridges, waterlines, and wells are damaged by expansive soils