3 standardisation of catch rates · pdf file3 standardisation of catch rates ... i19, i20...
TRANSCRIPT
Stock assessment of the Queensland banana prawn fishery 18
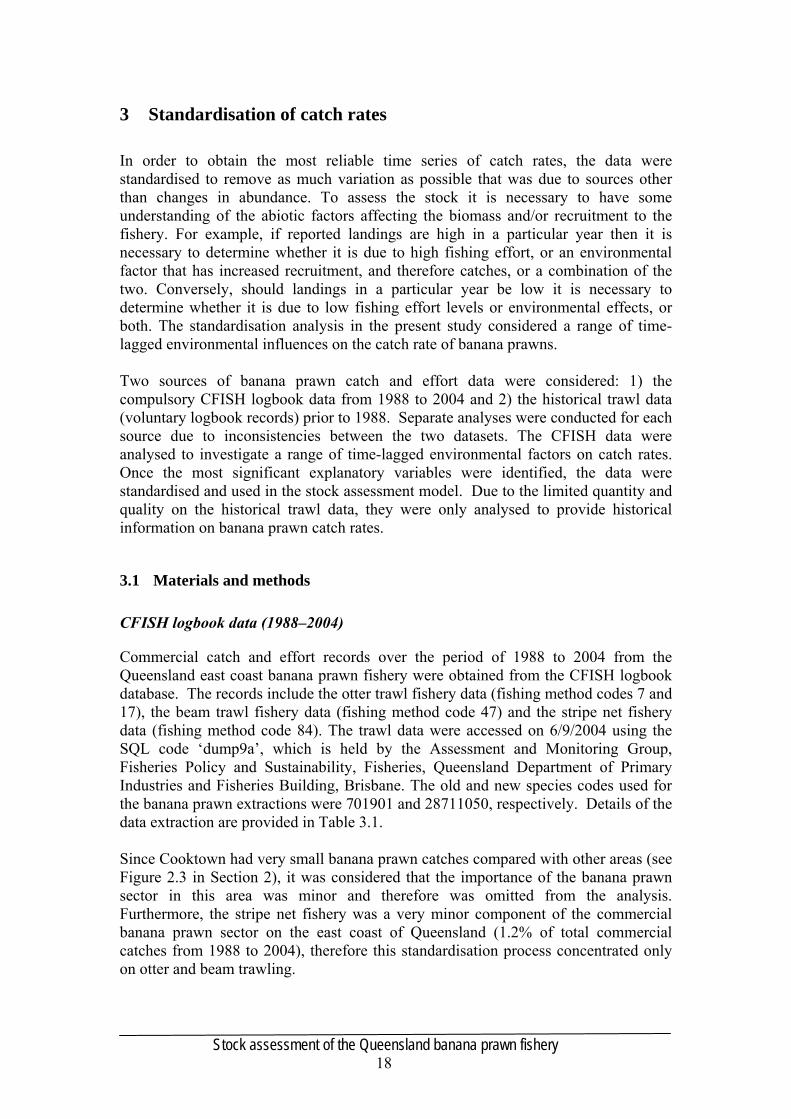
3 Standardisation of catch rates
In order to obtain the most reliable time series of catch rates, the data were standardised to remove as much variation as possible that was due to sources other than changes in abundance. To assess the stock it is necessary to have some understanding of the abiotic factors affecting the biomass and/or recruitment to the fishery. For example, if reported landings are high in a particular year then it is necessary to determine whether it is due to high fishing effort, or an environmental factor that has increased recruitment, and therefore catches, or a combination of the two. Conversely, should landings in a particular year be low it is necessary to determine whether it is due to low fishing effort levels or environmental effects, or both. The standardisation analysis in the present study considered a range of time-lagged environmental influences on the catch rate of banana prawns. Two sources of banana prawn catch and effort data were considered: 1) the compulsory CFISH logbook data from 1988 to 2004 and 2) the historical trawl data (voluntary logbook records) prior to 1988. Separate analyses were conducted for each source due to inconsistencies between the two datasets. The CFISH data were analysed to investigate a range of time-lagged environmental factors on catch rates. Once the most significant explanatory variables were identified, the data were standardised and used in the stock assessment model. Due to the limited quantity and quality on the historical trawl data, they were only analysed to provide historical information on banana prawn catch rates.
3.1 Materials and methods
CFISH logbook data (1988–2004)
Commercial catch and effort records over the period of 1988 to 2004 from the Queensland east coast banana prawn fishery were obtained from the CFISH logbook database. The records include the otter trawl fishery data (fishing method codes 7 and 17), the beam trawl fishery data (fishing method code 47) and the stripe net fishery data (fishing method code 84). The trawl data were accessed on 6/9/2004 using the SQL code ‘dump9a’, which is held by the Assessment and Monitoring Group, Fisheries Policy and Sustainability, Fisheries, Queensland Department of Primary Industries and Fisheries Building, Brisbane. The old and new species codes used for the banana prawn extractions were 701901 and 28711050, respectively. Details of the data extraction are provided in Table 3.1. Since Cooktown had very small banana prawn catches compared with other areas (see Figure 2.3 in Section 2), it was considered that the importance of the banana prawn sector in this area was minor and therefore was omitted from the analysis. Furthermore, the stripe net fishery was a very minor component of the commercial banana prawn sector on the east coast of Queensland (1.2% of total commercial catches from 1988 to 2004), therefore this standardisation process concentrated only on otter and beam trawling.
Stock assessment of the Queensland banana prawn fishery 19
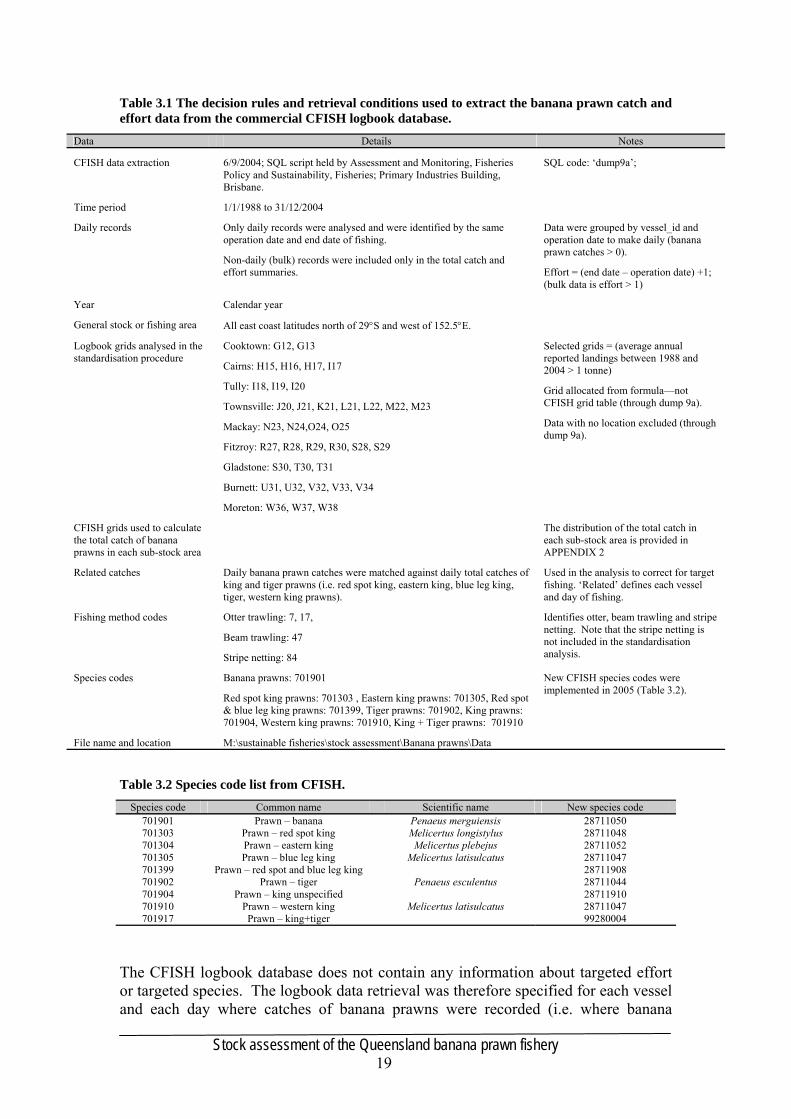
Table 3.1 The decision rules and retrieval conditions used to extract the banana prawn catch and effort data from the commercial CFISH logbook database.
Data Details Notes
CFISH data extraction 6/9/2004; SQL script held by Assessment and Monitoring, Fisheries Policy and Sustainability, Fisheries; Primary Industries Building, Brisbane.
SQL code: ‘dump9a’;
Time period 1/1/1988 to 31/12/2004
Daily records Only daily records were analysed and were identified by the same operation date and end date of fishing.
Non-daily (bulk) records were included only in the total catch and effort summaries.
Data were grouped by vessel_id and operation date to make daily (banana prawn catches > 0).
Effort = (end date – operation date) +1; (bulk data is effort > 1)
Year Calendar year
General stock or fishing area All east coast latitudes north of 29°S and west of 152.5°E.
Logbook grids analysed in the standardisation procedure
Cooktown: G12, G13
Cairns: H15, H16, H17, I17
Tully: I18, I19, I20
Townsville: J20, J21, K21, L21, L22, M22, M23
Mackay: N23, N24,O24, O25
Fitzroy: R27, R28, R29, R30, S28, S29
Gladstone: S30, T30, T31
Burnett: U31, U32, V32, V33, V34
Moreton: W36, W37, W38
Selected grids = (average annual reported landings between 1988 and 2004 > 1 tonne)
Grid allocated from formula—not CFISH grid table (through dump 9a).
Data with no location excluded (through dump 9a).
CFISH grids used to calculate the total catch of banana prawns in each sub-stock area
The distribution of the total catch in each sub-stock area is provided in APPENDIX 2
Related catches Daily banana prawn catches were matched against daily total catches of king and tiger prawns (i.e. red spot king, eastern king, blue leg king, tiger, western king prawns).
Used in the analysis to correct for target fishing. ‘Related’ defines each vessel and day of fishing.
Fishing method codes Otter trawling: 7, 17,
Beam trawling: 47
Stripe netting: 84
Identifies otter, beam trawling and stripe netting. Note that the stripe netting is not included in the standardisation analysis.
Species codes Banana prawns: 701901
Red spot king prawns: 701303 , Eastern king prawns: 701305, Red spot & blue leg king prawns: 701399, Tiger prawns: 701902, King prawns: 701904, Western king prawns: 701910, King + Tiger prawns: 701910
New CFISH species codes were implemented in 2005 (Table 3.2).
File name and location M:\sustainable fisheries\stock assessment\Banana prawns\Data
Table 3.2 Species code list from CFISH.
Species code Common name Scientific name New species code 701901 Prawn – banana Penaeus merguiensis 28711050 701303 Prawn – red spot king Melicertus longistylus 28711048 701304 Prawn – eastern king Melicertus plebejus 28711052 701305 Prawn – blue leg king Melicertus latisulcatus 28711047 701399 Prawn – red spot and blue leg king 28711908 701902 Prawn – tiger Penaeus esculentus 28711044 701904 Prawn – king unspecified 28711910 701910 Prawn – western king Melicertus latisulcatus 28711047 701917 Prawn – king+tiger 99280004
The CFISH logbook database does not contain any information about targeted effort or targeted species. The logbook data retrieval was therefore specified for each vessel and each day where catches of banana prawns were recorded (i.e. where banana
Stock assessment of the Queensland banana prawn fishery 20
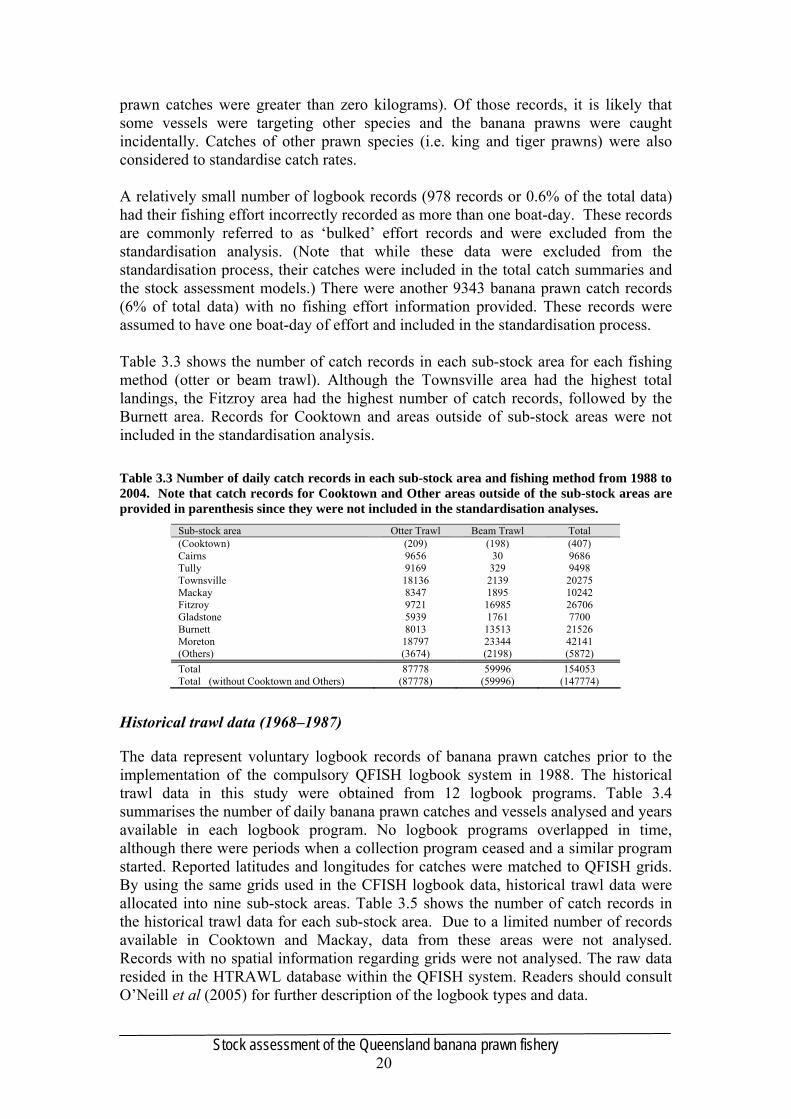
prawn catches were greater than zero kilograms). Of those records, it is likely that some vessels were targeting other species and the banana prawns were caught incidentally. Catches of other prawn species (i.e. king and tiger prawns) were also considered to standardise catch rates. A relatively small number of logbook records (978 records or 0.6% of the total data) had their fishing effort incorrectly recorded as more than one boat-day. These records are commonly referred to as ‘bulked’ effort records and were excluded from the standardisation analysis. (Note that while these data were excluded from the standardisation process, their catches were included in the total catch summaries and the stock assessment models.) There were another 9343 banana prawn catch records (6% of total data) with no fishing effort information provided. These records were assumed to have one boat-day of effort and included in the standardisation process. Table 3.3 shows the number of catch records in each sub-stock area for each fishing method (otter or beam trawl). Although the Townsville area had the highest total landings, the Fitzroy area had the highest number of catch records, followed by the Burnett area. Records for Cooktown and areas outside of sub-stock areas were not included in the standardisation analysis. Table 3.3 Number of daily catch records in each sub-stock area and fishing method from 1988 to 2004. Note that catch records for Cooktown and Other areas outside of the sub-stock areas are provided in parenthesis since they were not included in the standardisation analyses.
Sub-stock area Otter Trawl Beam Trawl Total (Cooktown) (209) (198) (407) Cairns 9656 30 9686 Tully 9169 329 9498 Townsville 18136 2139 20275 Mackay 8347 1895 10242 Fitzroy 9721 16985 26706 Gladstone 5939 1761 7700 Burnett 8013 13513 21526 Moreton 18797 23344 42141 (Others) (3674) (2198) (5872) Total 87778 59996 154053 Total (without Cooktown and Others) (87778) (59996) (147774)
Historical trawl data (1968–1987)
The data represent voluntary logbook records of banana prawn catches prior to the implementation of the compulsory QFISH logbook system in 1988. The historical trawl data in this study were obtained from 12 logbook programs. Table 3.4 summarises the number of daily banana prawn catches and vessels analysed and years available in each logbook program. No logbook programs overlapped in time, although there were periods when a collection program ceased and a similar program started. Reported latitudes and longitudes for catches were matched to QFISH grids. By using the same grids used in the CFISH logbook data, historical trawl data were allocated into nine sub-stock areas. Table 3.5 shows the number of catch records in the historical trawl data for each sub-stock area. Due to a limited number of records available in Cooktown and Mackay, data from these areas were not analysed. Records with no spatial information regarding grids were not analysed. The raw data resided in the HTRAWL database within the QFISH system. Readers should consult O’Neill et al (2005) for further description of the logbook types and data.
Stock assessment of the Queensland banana prawn fishery 21
Table 3.4 Summary of historical trawl data obtained from 12 logbook programs. Source Description # of records # of vessels Years
AFS Australian Fisheries Service (now AFMA) logs
694 126 1980–1987
BH BURNETT HEADS RESEARCH STATION VOLUNTARY LOGBOOK PROGRAM
1191 142 1977–1983, 1986–1987
BH85 As above 39 13 1985 CF88 CFISH pre 1988 15 5 1987 CS1B CSIRO (B)ay 8917 131 1969–1974 CS1N CSIRO (N)orth, King &tiger prawn 6634 72 1974–1979 DI01 Diary data entry (DE) 195 6 1977–1981, 1983–1987 DI02 Diary data entry (DE) (Log_desc) 322 18 1968–1969, 1974–1980, 1983–
1987 DI03 Historic DE- CSIRO grids 12 2 1980,81,84 DPI DPI research log 85 12 1986–1987 ECP CSIRO research log 1805 226 1970–1979 UL02 Historic DE- SUNFISH grids 26 7 1979, 1983–1986
Table 3.5 Number of daily catch records in each sub-stock area from historical trawl data 1986–1987. Note that catch records for Cooktown, Mackay and Other areas outside of the sub-stock areas are provided in parenthesis since they were not included in the standardisation analyses.
Sub-stock area # record (Cooktown) (32) Cairns 1238 Tully 479 Townsville 460 (Mackay) (11) Fitzroy 753 Gladstone 422 Burnett 507 Moreton 15616 (Others) (1990) Total 19935 Total (without Cooktown, Mackay and Others) (18465)
Environmental data
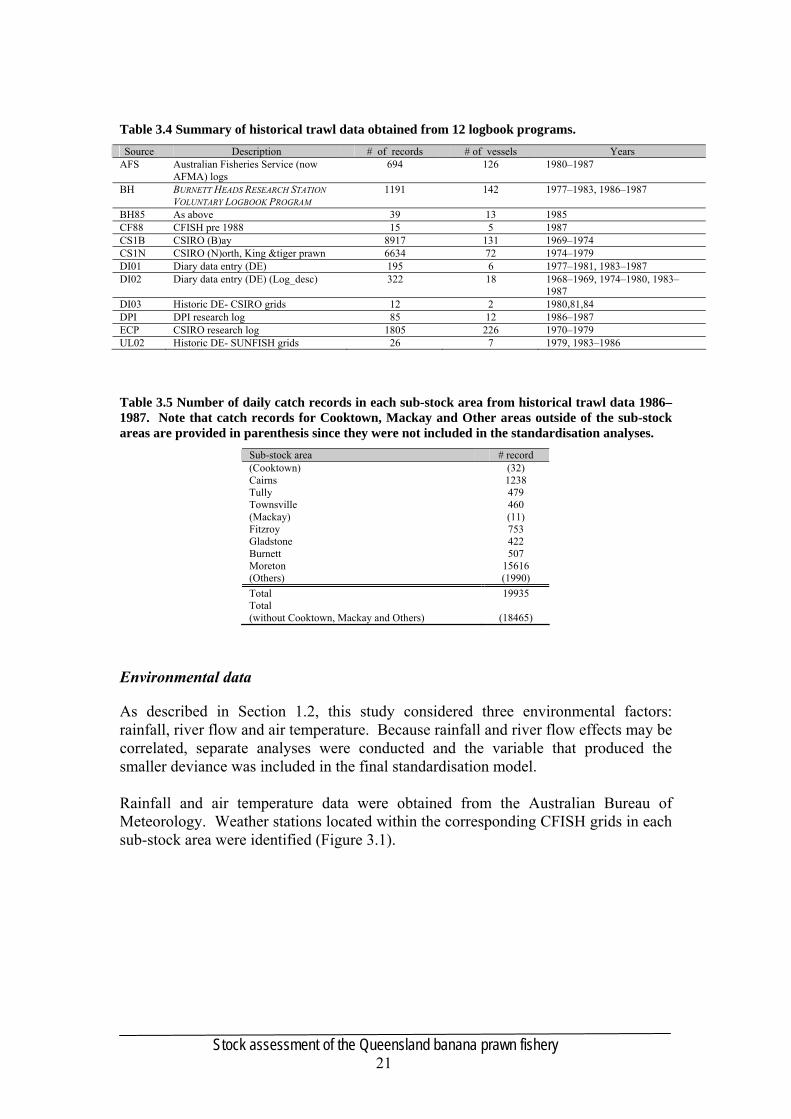
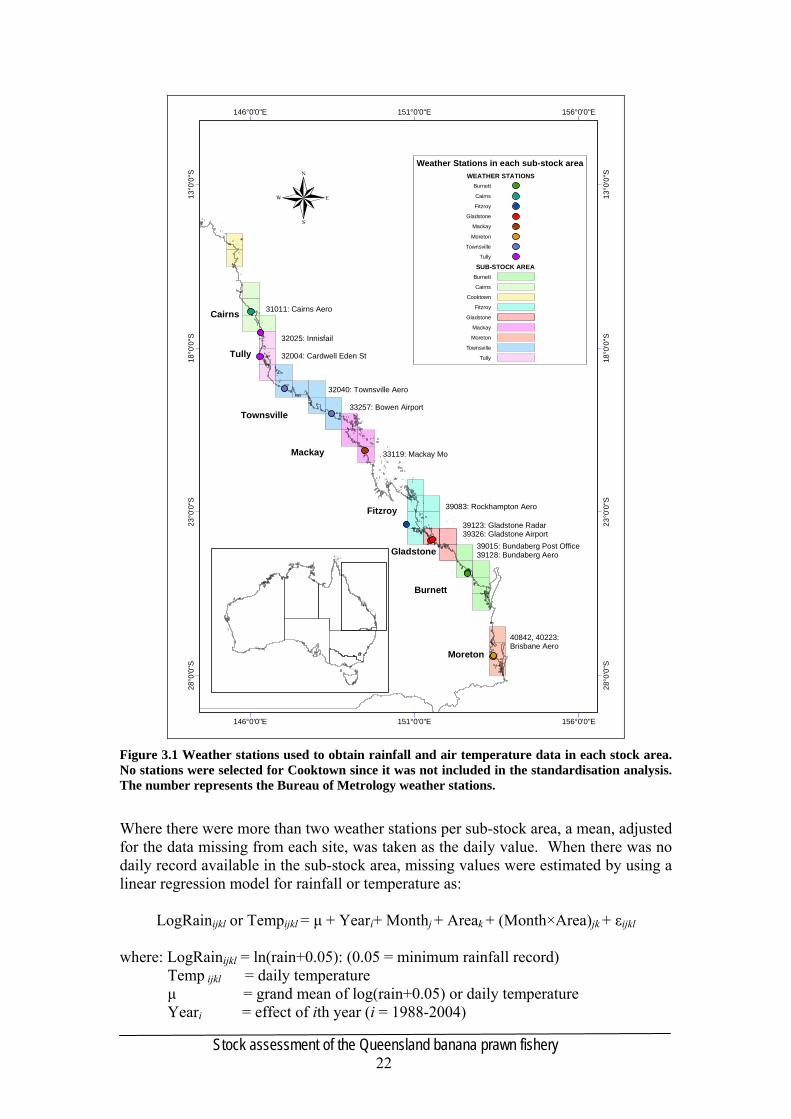
As described in Section 1.2, this study considered three environmental factors: rainfall, river flow and air temperature. Because rainfall and river flow effects may be correlated, separate analyses were conducted and the variable that produced the smaller deviance was included in the final standardisation model. Rainfall and air temperature data were obtained from the Australian Bureau of Meteorology. Weather stations located within the corresponding CFISH grids in each sub-stock area were identified (Figure 3.1).
Stock assessment of the Queensland banana prawn fishery 22
Cairns
Townsville
Tully
Mackay
Fitzroy
Gladstone
Burnett
Moreton
31011: Cairns Aero
32025: Innisfail
32004: Cardwell Eden St
32040: Townsville Aero
33257: Bowen Airport
33119: Mackay Mo
39083: Rockhampton Aero
39123: Gladstone Radar39326: Gladstone Airport
39015: Bundaberg Post Office39128: Bundaberg Aero
40842, 40223:Brisbane Aero
146°0'0"E
146°0'0"E
151°0'0"E
151°0'0"E
156°0'0"E
156°0'0"E
28°0
'0"S
28°0
'0"S
23°0
'0"S
23°0
'0"S
18°0
'0"S
18°0
'0"S
13°0
'0"S
13°0
'0"S
Weather Stations in each sub-stock areaWEATHER STATIONS
Burnett
Cairns
Fitzroy
Gladstone
Mackay
Moreton
Townsville
Tully
SUB-STOCK AREABurnett
Cairns
Cooktown
Fitzroy
Gladstone
Mackay
Moreton
Townsville
Tully
®
Figure 3.1 Weather stations used to obtain rainfall and air temperature data in each stock area. No stations were selected for Cooktown since it was not included in the standardisation analysis. The number represents the Bureau of Metrology weather stations.
Where there were more than two weather stations per sub-stock area, a mean, adjusted for the data missing from each site, was taken as the daily value. When there was no daily record available in the sub-stock area, missing values were estimated by using a linear regression model for rainfall or temperature as:
LogRainijkl or Tempijkl = μ + Yeari+ Monthj + Areak + (Month×Area)jk + εijkl where: LogRainijkl = ln(rain+0.05): (0.05 = minimum rainfall record) Temp ijkl = daily temperature μ = grand mean of log(rain+0.05) or daily temperature Yeari = effect of ith year (i = 1988-2004)
Stock assessment of the Queensland banana prawn fishery 23
Monthj = effect of jth month (j=1-12) Areak = effect of kth sub-stock area (k = 1-8; Burnett, Cairns, … ,Moreton)
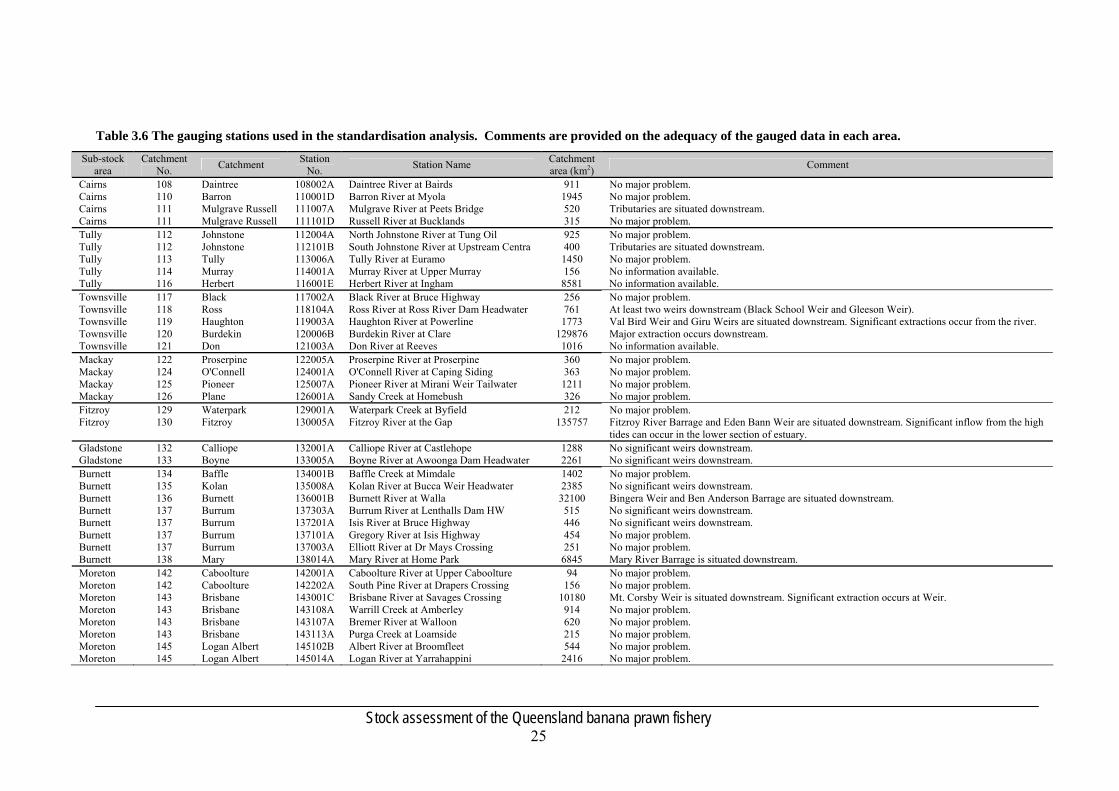
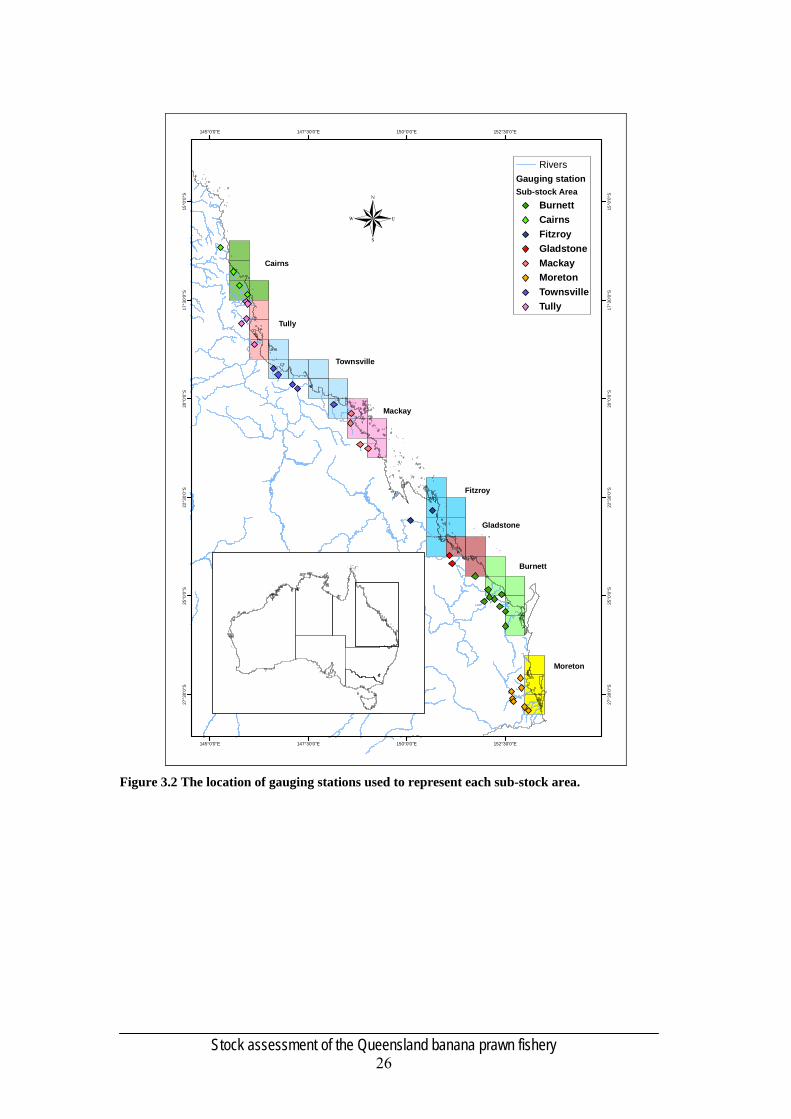
(Month×Area)jk = interaction between month and sub-stock area εijkl = natural variation attribute to the ijklth individual observation. Note that rainfall data were transformed [ln(rain+0.05)] due to the high skewness caused by the large number of zero rainfall observations. This model estimated monthly average rainfall in each sub-stock area. The model considered seasonal patterns specific to each sub-stock area (Month×Area) and took account of the differences between years (i.e. dry year vs wet year). Missing rainfall and temperature records accounted for 1.1% and 5.9% of the total number of days during the study period, respectively. Note that this study only used rainfall and air temperature records with data quality coded ‘1’ (quality controlled and acceptable) and ‘2’ (not quality controlled), as defined by the Bureau of Meteorology. River flow data were obtained from the Queensland Department of Natural Resources, Mines and Water. In each catchment, downstream gauging stations where flow data were largely available between the period of 1988 and 2004 were identified, and total daily river flow in each sub-stock area were calculated by summing each gauged data in the corresponding estuary (mgl/day). A total of 39 gauging stations were selected corresponding to 28 catchments on the east coast of Queensland (Table 3.6). The location of these stations in each sub-stock area is shown in Figure 3.2. For some catchments, flow data were obtained from more than one gauging station (e.g. catchment nos 137 and 143). This was because data were not available from the gauging station that was located near the mouth of the river. Flow data were therefore obtained from two or more gauging stations located in tributaries that were distant from the river mouth. In order to mitigate flooding and to maintain water supply for agriculture, industry, and urban uses, most of Queensland’s major rivers (e.g. Brisbane, Fitzroy and Burdekin) are regulated and managed with weirs and/or barrages (see Comments in Table 3.6). Significant water extraction is expected from these infrastructures, and it is not possible to estimate the accurate total flow of each catchment using the gauged data. However, Vance et al.(1985) used gauged flow data from small creeks off the main rivers in the Gulf of Carpentaria which accurately reflected variation in flow from the catchment. Robins et al. (2005) adjusted the raw gauged data for the Fitzroy River to take account of the amount of extracted water, but found that there were was very little difference in the flow-catch correlations when using either the raw flow data or the adjusted data (Dr Julie Robins, 2005, pers. comm., 6 June). It was therefore concluded that the raw flow data measured at the gauging stations can provide an adequate indication of the flow pattern for each catchment, and this was therefore used in the present analysis. This study used flow records with the data quality code of ‘9’ or ‘10’ (normal data), ‘59’ (derived height), ‘69’ (derived discharge) and ‘130’ (not quality controlled but reliable), which were defined by the Department of Natural Resources, Mines and Water. Where there was no daily flow record available (4% of total records), missing values were estimated from other stations located within the same sub-stock area. A separate linear mixed model (LMM) was run in each sub-stock area shown as:

Stock assessment of the Queensland banana prawn fishery 24
LogFlowij = μ+ Station (fixed)i + Date (random)j + εij where: LogFlow = ln(flow+ min_flow) μ = grand mean of logflow Stationi = effect of ith station (i = number of stations in each sub-stock area:
4 stations in Cairns, 5 in Tully, etc.) Datej = effect of jth date
(j = 1~52600: number of date from 01/01/1987 to 31/12/2004) εij = natural variation attribute to the ijth individual observation. A linear mixed model (LMM) was chosen rather than a regression model because it treated the Date term as a random effect and was computationally less intensive. Note that river flow data were transformed by taking the natural log, ln(flow+minimum flow), due to the skewness and zero values.
Stock assessment of the Queensland banana prawn fishery 25
Table 3.6 The gauging stations used in the standardisation analysis. Comments are provided on the adequacy of the gauged data in each area.
Sub-stock area
Catchment No. Catchment Station
No. Station Name Catchment area (km2) Comment
Cairns 108 Daintree 108002A Daintree River at Bairds 911 No major problem. Cairns 110 Barron 110001D Barron River at Myola 1945 No major problem. Cairns 111 Mulgrave Russell 111007A Mulgrave River at Peets Bridge 520 Tributaries are situated downstream. Cairns 111 Mulgrave Russell 111101D Russell River at Bucklands 315 No major problem. Tully 112 Johnstone 112004A North Johnstone River at Tung Oil 925 No major problem. Tully 112 Johnstone 112101B South Johnstone River at Upstream Centra 400 Tributaries are situated downstream. Tully 113 Tully 113006A Tully River at Euramo 1450 No major problem. Tully 114 Murray 114001A Murray River at Upper Murray 156 No information available. Tully 116 Herbert 116001E Herbert River at Ingham 8581 No information available. Townsville 117 Black 117002A Black River at Bruce Highway 256 No major problem. Townsville 118 Ross 118104A Ross River at Ross River Dam Headwater 761 At least two weirs downstream (Black School Weir and Gleeson Weir). Townsville 119 Haughton 119003A Haughton River at Powerline 1773 Val Bird Weir and Giru Weirs are situated downstream. Significant extractions occur from the river. Townsville 120 Burdekin 120006B Burdekin River at Clare 129876 Major extraction occurs downstream. Townsville 121 Don 121003A Don River at Reeves 1016 No information available. Mackay 122 Proserpine 122005A Proserpine River at Proserpine 360 No major problem. Mackay 124 O'Connell 124001A O'Connell River at Caping Siding 363 No major problem. Mackay 125 Pioneer 125007A Pioneer River at Mirani Weir Tailwater 1211 No major problem. Mackay 126 Plane 126001A Sandy Creek at Homebush 326 No major problem. Fitzroy 129 Waterpark 129001A Waterpark Creek at Byfield 212 No major problem. Fitzroy 130 Fitzroy 130005A Fitzroy River at the Gap 135757 Fitzroy River Barrage and Eden Bann Weir are situated downstream. Significant inflow from the high
tides can occur in the lower section of estuary. Gladstone 132 Calliope 132001A Calliope River at Castlehope 1288 No significant weirs downstream. Gladstone 133 Boyne 133005A Boyne River at Awoonga Dam Headwater 2261 No significant weirs downstream. Burnett 134 Baffle 134001B Baffle Creek at Mimdale 1402 No major problem. Burnett 135 Kolan 135008A Kolan River at Bucca Weir Headwater 2385 No significant weirs downstream. Burnett 136 Burnett 136001B Burnett River at Walla 32100 Bingera Weir and Ben Anderson Barrage are situated downstream. Burnett 137 Burrum 137303A Burrum River at Lenthalls Dam HW 515 No significant weirs downstream. Burnett 137 Burrum 137201A Isis River at Bruce Highway 446 No significant weirs downstream. Burnett 137 Burrum 137101A Gregory River at Isis Highway 454 No major problem. Burnett 137 Burrum 137003A Elliott River at Dr Mays Crossing 251 No major problem. Burnett 138 Mary 138014A Mary River at Home Park 6845 Mary River Barrage is situated downstream. Moreton 142 Caboolture 142001A Caboolture River at Upper Caboolture 94 No major problem. Moreton 142 Caboolture 142202A South Pine River at Drapers Crossing 156 No major problem. Moreton 143 Brisbane 143001C Brisbane River at Savages Crossing 10180 Mt. Corsby Weir is situated downstream. Significant extraction occurs at Weir. Moreton 143 Brisbane 143108A Warrill Creek at Amberley 914 No major problem. Moreton 143 Brisbane 143107A Bremer River at Walloon 620 No major problem. Moreton 143 Brisbane 143113A Purga Creek at Loamside 215 No major problem. Moreton 145 Logan Albert 145102B Albert River at Broomfleet 544 No major problem. Moreton 145 Logan Albert 145014A Logan River at Yarrahappini 2416 No major problem.
Stock assessment of the Queensland banana prawn fishery 26
Cairns
Townsville
Tully
Mackay
Fitzroy
Gladstone
Burnett
Moreton
145°0'0"E
145°0'0"E
147°30'0"E
147°30'0"E
150°0'0"E
150°0'0"E
152°30'0"E
152°30'0"E
27°3
0'0"
S
27°3
0'0"
S
25°0
'0"S
25°0
'0"S
22°3
0'0"
S
22°3
0'0"
S
20°0
'0"S
20°0
'0"S
17°3
0'0"
S
17°3
0'0"
S
15°0
'0"S
15°0
'0"S
®
RiversGauging stationSub-stock Area
BurnettCairnsFitzroyGladstoneMackayMoretonTownsvilleTully
Figure 3.2 The location of gauging stations used to represent each sub-stock area.
Stock assessment of the Queensland banana prawn fishery 27
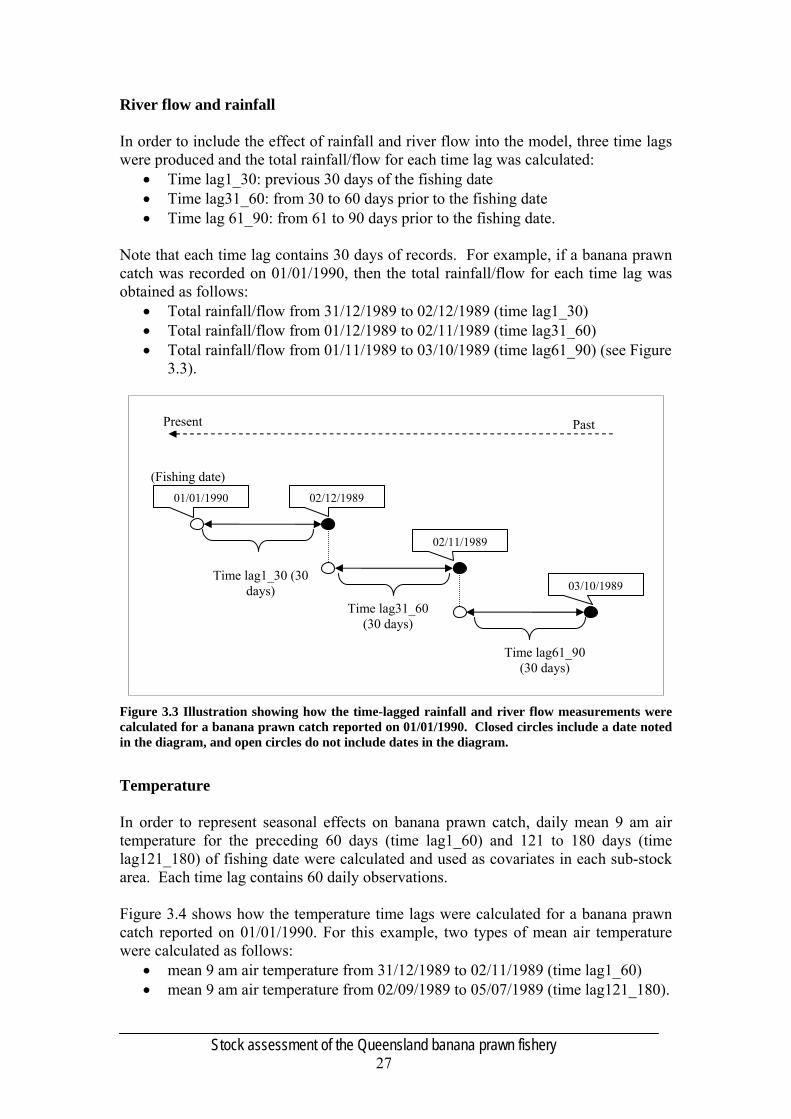
River flow and rainfall In order to include the effect of rainfall and river flow into the model, three time lags were produced and the total rainfall/flow for each time lag was calculated:
• Time lag1_30: previous 30 days of the fishing date • Time lag31_60: from 30 to 60 days prior to the fishing date • Time lag 61_90: from 61 to 90 days prior to the fishing date.
Note that each time lag contains 30 days of records. For example, if a banana prawn catch was recorded on 01/01/1990, then the total rainfall/flow for each time lag was obtained as follows:
• Total rainfall/flow from 31/12/1989 to 02/12/1989 (time lag1_30) • Total rainfall/flow from 01/12/1989 to 02/11/1989 (time lag31_60) • Total rainfall/flow from 01/11/1989 to 03/10/1989 (time lag61_90) (see Figure
3.3).
Figure 3.3 Illustration showing how the time-lagged rainfall and river flow measurements were calculated for a banana prawn catch reported on 01/01/1990. Closed circles include a date noted in the diagram, and open circles do not include dates in the diagram.
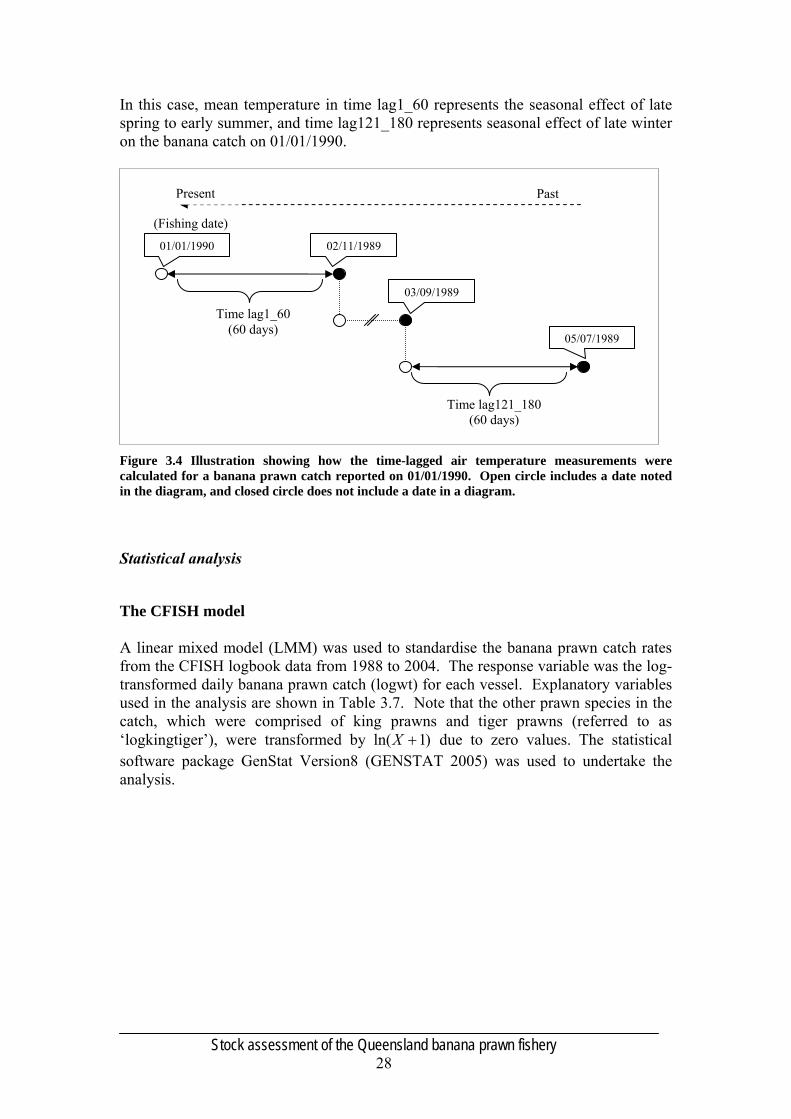
Temperature In order to represent seasonal effects on banana prawn catch, daily mean 9 am air temperature for the preceding 60 days (time lag1_60) and 121 to 180 days (time lag121_180) of fishing date were calculated and used as covariates in each sub-stock area. Each time lag contains 60 daily observations. Figure 3.4 shows how the temperature time lags were calculated for a banana prawn catch reported on 01/01/1990. For this example, two types of mean air temperature were calculated as follows:
• mean 9 am air temperature from 31/12/1989 to 02/11/1989 (time lag1_60) • mean 9 am air temperature from 02/09/1989 to 05/07/1989 (time lag121_180).
Time lag61_90 (30 days)
Past Present
Time lag1_30 (30 days)
(Fishing date)
Time lag31_60 (30 days)
01/01/1990 02/12/1989
02/11/1989
03/10/1989
Stock assessment of the Queensland banana prawn fishery 28
In this case, mean temperature in time lag1_60 represents the seasonal effect of late spring to early summer, and time lag121_180 represents seasonal effect of late winter on the banana catch on 01/01/1990.
Figure 3.4 Illustration showing how the time-lagged air temperature measurements were calculated for a banana prawn catch reported on 01/01/1990. Open circle includes a date noted in the diagram, and closed circle does not include a date in a diagram.
Statistical analysis
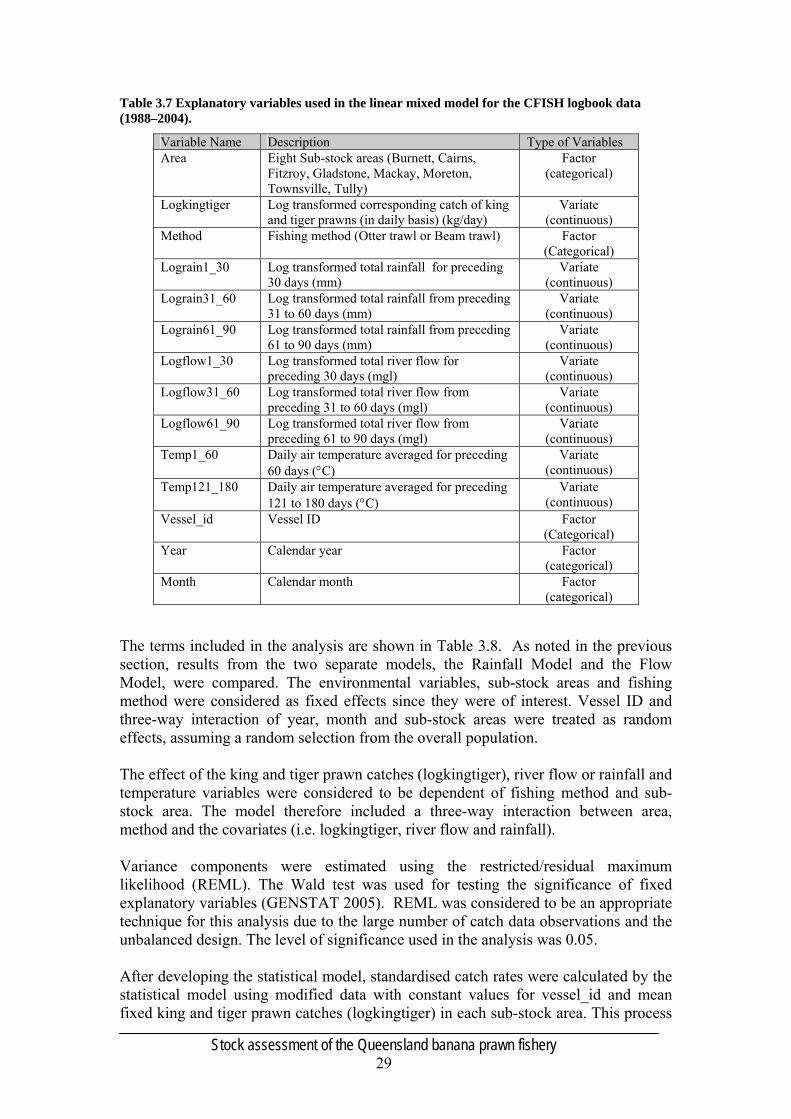
The CFISH model A linear mixed model (LMM) was used to standardise the banana prawn catch rates from the CFISH logbook data from 1988 to 2004. The response variable was the log-transformed daily banana prawn catch (logwt) for each vessel. Explanatory variables used in the analysis are shown in Table 3.7. Note that the other prawn species in the catch, which were comprised of king prawns and tiger prawns (referred to as ‘logkingtiger’), were transformed by )1ln( +X due to zero values. The statistical software package GenStat Version8 (GENSTAT 2005) was used to undertake the analysis.
Past
Time lag121_180 (60 days)
(Fishing date)
Time lag1_60 (60 days)
01/01/1990 02/11/1989
03/09/1989
05/07/1989
Present
Stock assessment of the Queensland banana prawn fishery 29
Table 3.7 Explanatory variables used in the linear mixed model for the CFISH logbook data (1988–2004).
Variable Name Description Type of Variables Area Eight Sub-stock areas (Burnett, Cairns,
Fitzroy, Gladstone, Mackay, Moreton, Townsville, Tully)
Factor (categorical)
Logkingtiger Log transformed corresponding catch of king and tiger prawns (in daily basis) (kg/day)
Variate (continuous)
Method Fishing method (Otter trawl or Beam trawl) Factor (Categorical)
Lograin1_30 Log transformed total rainfall for preceding 30 days (mm)
Variate (continuous)
Lograin31_60 Log transformed total rainfall from preceding 31 to 60 days (mm)
Variate (continuous)
Lograin61_90 Log transformed total rainfall from preceding 61 to 90 days (mm)
Variate (continuous)
Logflow1_30 Log transformed total river flow for preceding 30 days (mgl)
Variate (continuous)
Logflow31_60 Log transformed total river flow from preceding 31 to 60 days (mgl)
Variate (continuous)
Logflow61_90 Log transformed total river flow from preceding 61 to 90 days (mgl)
Variate (continuous)
Temp1_60 Daily air temperature averaged for preceding 60 days (°C)
Variate (continuous)
Temp121_180 Daily air temperature averaged for preceding 121 to 180 days (°C)
Variate (continuous)
Vessel_id Vessel ID Factor (Categorical)
Year Calendar year Factor (categorical)
Month Calendar month Factor (categorical)
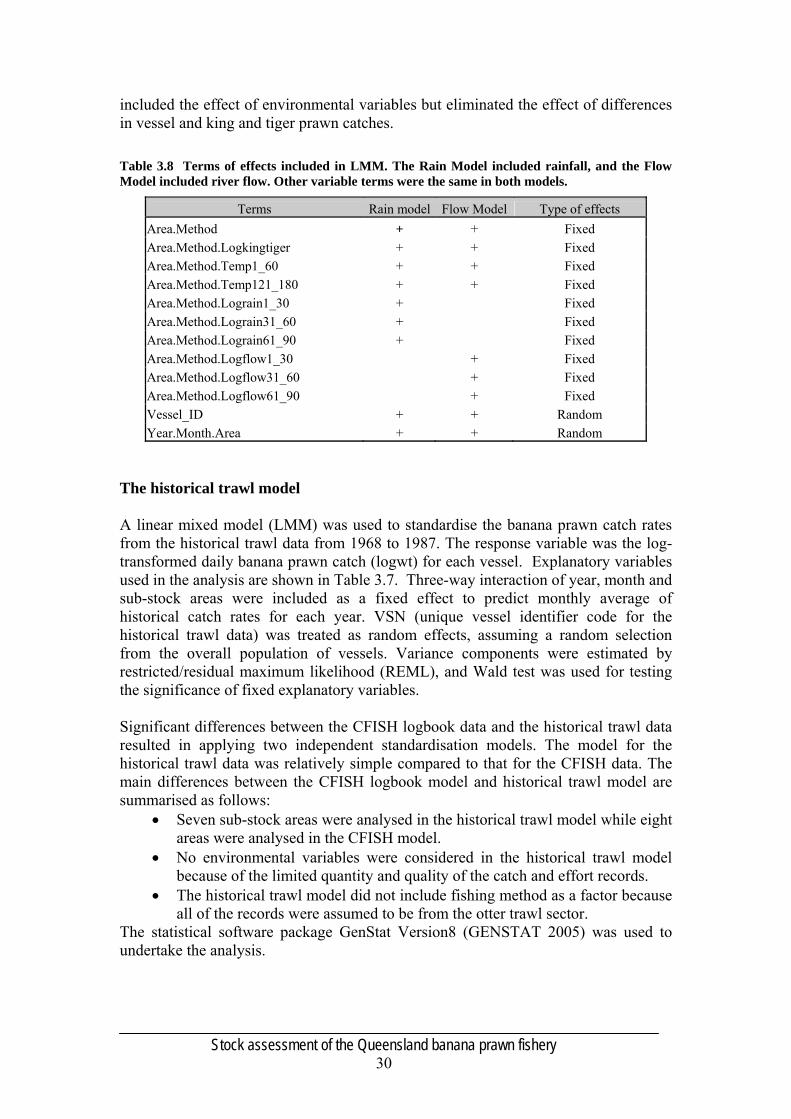
The terms included in the analysis are shown in Table 3.8. As noted in the previous section, results from the two separate models, the Rainfall Model and the Flow Model, were compared. The environmental variables, sub-stock areas and fishing method were considered as fixed effects since they were of interest. Vessel ID and three-way interaction of year, month and sub-stock areas were treated as random effects, assuming a random selection from the overall population. The effect of the king and tiger prawn catches (logkingtiger), river flow or rainfall and temperature variables were considered to be dependent of fishing method and sub-stock area. The model therefore included a three-way interaction between area, method and the covariates (i.e. logkingtiger, river flow and rainfall). Variance components were estimated using the restricted/residual maximum likelihood (REML). The Wald test was used for testing the significance of fixed explanatory variables (GENSTAT 2005). REML was considered to be an appropriate technique for this analysis due to the large number of catch data observations and the unbalanced design. The level of significance used in the analysis was 0.05. After developing the statistical model, standardised catch rates were calculated by the statistical model using modified data with constant values for vessel_id and mean fixed king and tiger prawn catches (logkingtiger) in each sub-stock area. This process
Stock assessment of the Queensland banana prawn fishery 30
included the effect of environmental variables but eliminated the effect of differences in vessel and king and tiger prawn catches. Table 3.8 Terms of effects included in LMM. The Rain Model included rainfall, and the Flow Model included river flow. Other variable terms were the same in both models.
Terms Rain model Flow Model Type of effects Area.Method + + Fixed Area.Method.Logkingtiger + + Fixed Area.Method.Temp1_60 + + Fixed Area.Method.Temp121_180 + + Fixed Area.Method.Lograin1_30 + Fixed Area.Method.Lograin31_60 + Fixed Area.Method.Lograin61_90 + Fixed Area.Method.Logflow1_30 + Fixed Area.Method.Logflow31_60 + Fixed Area.Method.Logflow61_90 + Fixed Vessel_ID + + Random Year.Month.Area + + Random
The historical trawl model A linear mixed model (LMM) was used to standardise the banana prawn catch rates from the historical trawl data from 1968 to 1987. The response variable was the log-transformed daily banana prawn catch (logwt) for each vessel. Explanatory variables used in the analysis are shown in Table 3.7. Three-way interaction of year, month and sub-stock areas were included as a fixed effect to predict monthly average of historical catch rates for each year. VSN (unique vessel identifier code for the historical trawl data) was treated as random effects, assuming a random selection from the overall population of vessels. Variance components were estimated by restricted/residual maximum likelihood (REML), and Wald test was used for testing the significance of fixed explanatory variables. Significant differences between the CFISH logbook data and the historical trawl data resulted in applying two independent standardisation models. The model for the historical trawl data was relatively simple compared to that for the CFISH data. The main differences between the CFISH logbook model and historical trawl model are summarised as follows:
• Seven sub-stock areas were analysed in the historical trawl model while eight areas were analysed in the CFISH model.
• No environmental variables were considered in the historical trawl model because of the limited quantity and quality of the catch and effort records.
• The historical trawl model did not include fishing method as a factor because all of the records were assumed to be from the otter trawl sector.
The statistical software package GenStat Version8 (GENSTAT 2005) was used to undertake the analysis.