3 t10 aes eletropaulo
TRANSCRIPT
3Q10 Results
November, 2010
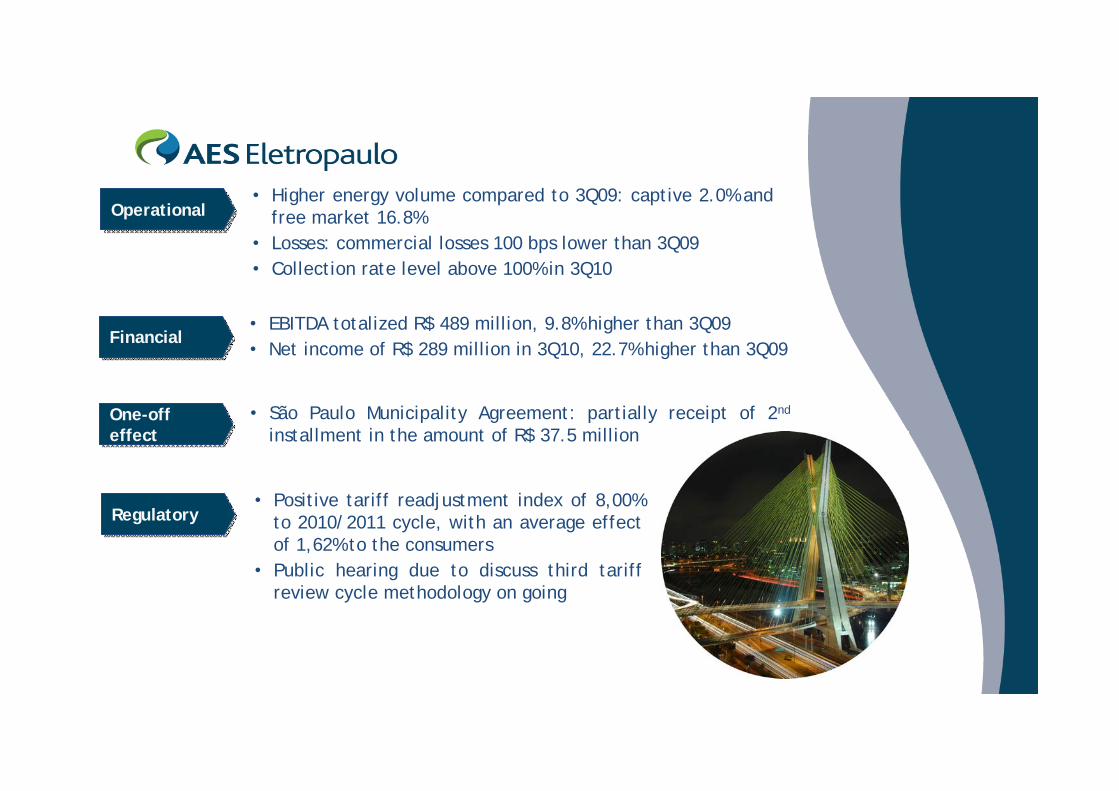
• EBITDA totalized R$ 489 million, 9.8% higher than 3Q09 • Net income of R$ 289 million in 3Q10, 22.7% higher than 3Q09
• Higher energy volume compared to 3Q09: captive 2.0% and free market 16.8%
• Losses: commercial losses 100 bps lower than 3Q09• Collection rate level above 100% in 3Q10
• São Paulo Municipality Agreement: partially receipt of 2nd
installment in the amount of R$ 37.5 million
• Positive tariff readjustment index of 8,00% to 2010/2011 cycle, with an average effect of 1,62% to the consumers
• Public hearing due to discuss third tariff review cycle methodology on going
FinancialFinancial
OperationalOperational
One-off effectOne-off effect
RegulatoryRegulatory
3
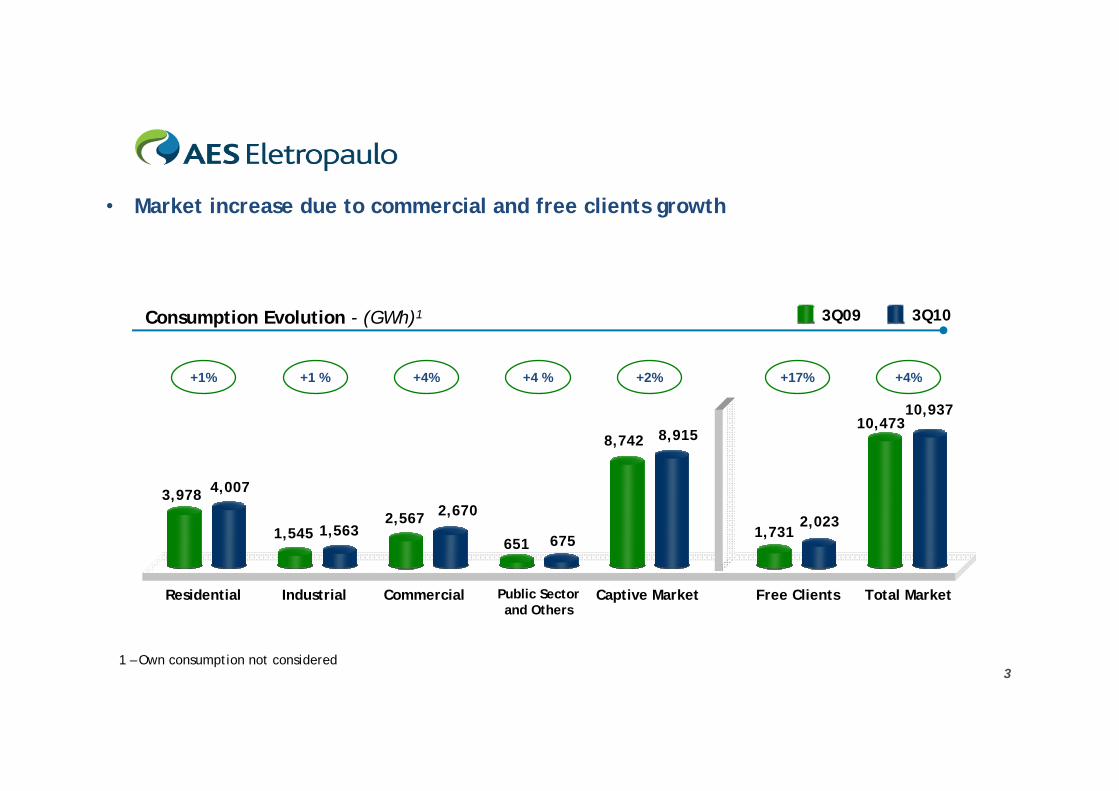
Consumption Evolution - (GWh)1 3Q103Q09
• Market increase due to commercial and free clients growth
Free Clients
1,7312,023
Captive Market
8,742 8,915
Residential Industrial Commercial Public Sector and Others
Total Market
651
2,5671,545
3,978
10,473
675
4,007
1,5632,670
10,937
+1% +4% +4 % +2% +4%+1 % +17%
1 – Own consumption not considered
4
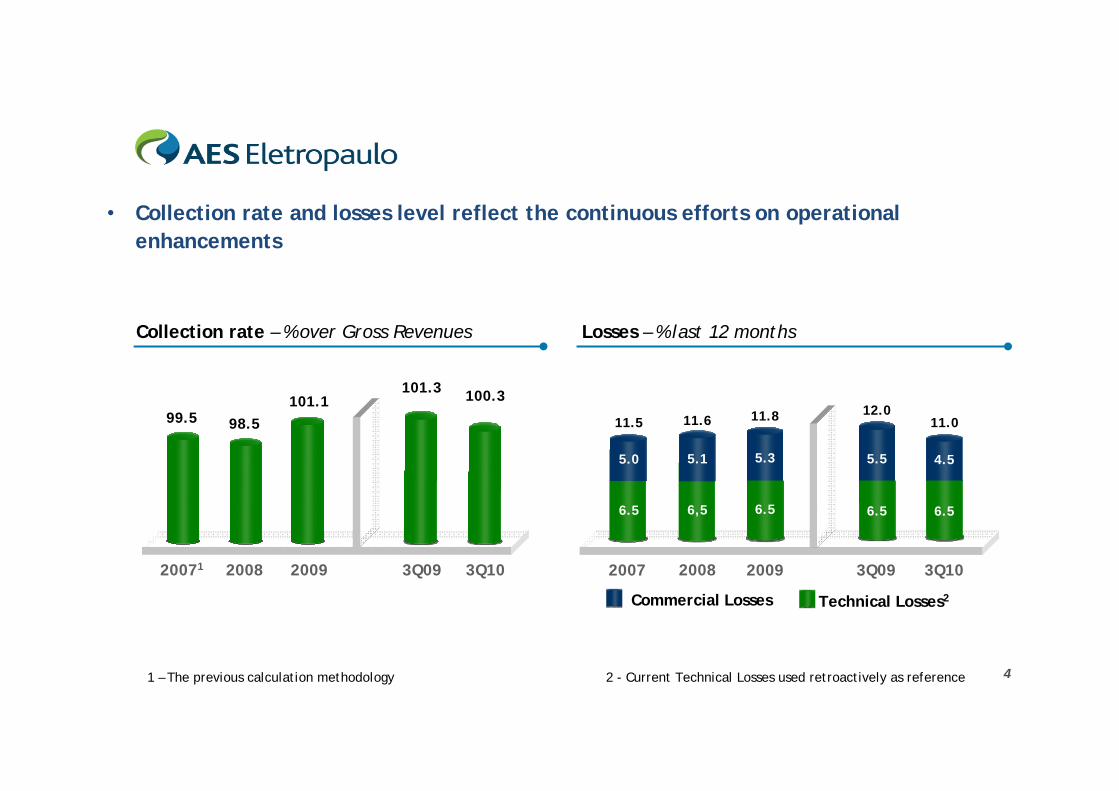
98.5
20092008 3Q09
100.3
3Q10
101.3101.1
99.5
20071 2008
5.1
6,5
11.6
3Q10
4.5
6.5
11.0
3Q09
6.5
5.5
12.0
2007
5.0
6.5
11.5
5.0
6.5
2009
5.3
6.5
11.8
6.5
5.3
6.5
Collection rate – % over Gross Revenues Losses – % last 12 months
1 – The previous calculation methodology 2 - Current Technical Losses used retroactively as reference
Commercial Losses Technical Losses2
• Collection rate and losses level reflect the continuous efforts on operational enhancements
5
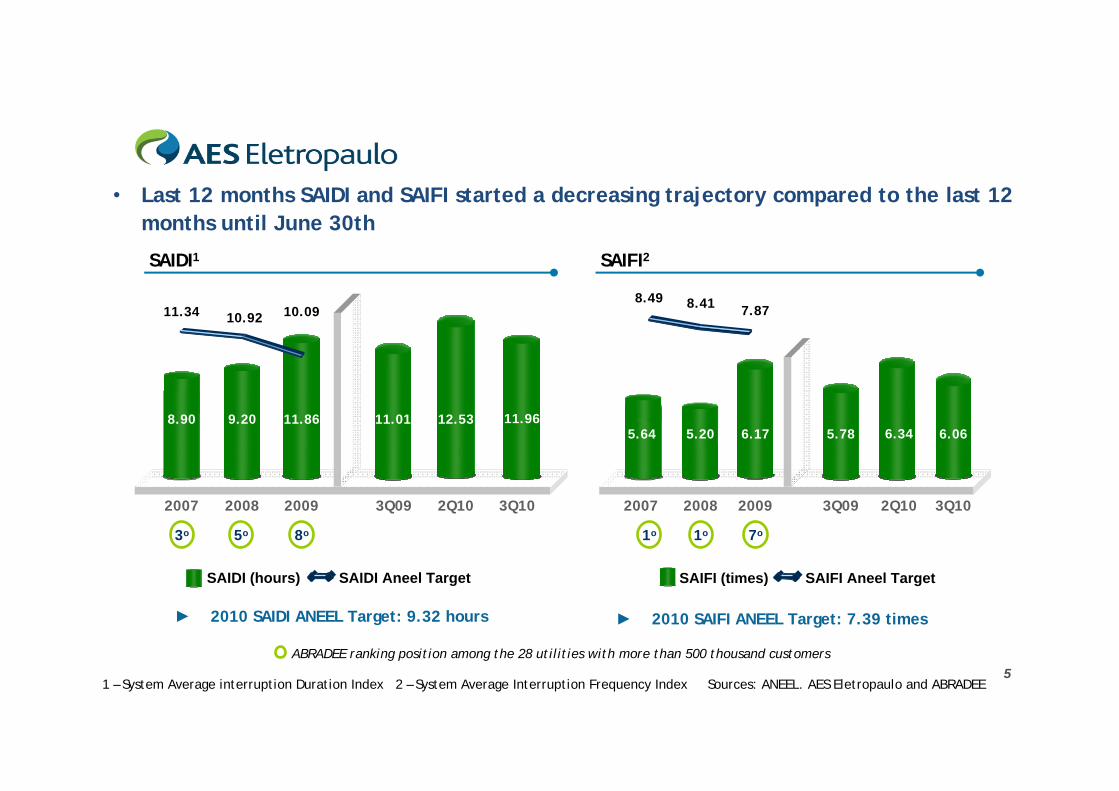
• Last 12 months SAIDI and SAIFI started a decreasing trajectory compared to the last 12 months until June 30th
SAIFI2SAIDI1
1 – System Average interruption Duration Index 2 – System Average Interruption Frequency Index Sources: ANEEL. AES Eletropaulo and ABRADEE
ABRADEE ranking position among the 28 utilities with more than 500 thousand customers
► 2010 SAIDI ANEEL Target: 9.32 hours ► 2010 SAIFI ANEEL Target: 7.39 times
SAIDI (hours) SAIDI Aneel Target SAIFI (times) SAIFI Aneel Target
9.208.90
2007 2008 3Q10
11.34 10.92
2009
3o
3Q09
5o
11.86
10.09
11.01
8o
2Q10
11,9611.96
2007 2009 3Q09
7.878.49 8.41
3Q10
1o
5.64 5.78
2008
6.17 6,736.06
1o 7o
5.20
2Q10
12.536.34
6
3Q10 Investments
2008
103
111
8
3Q09
149
1545
3Q102009 2010(e)
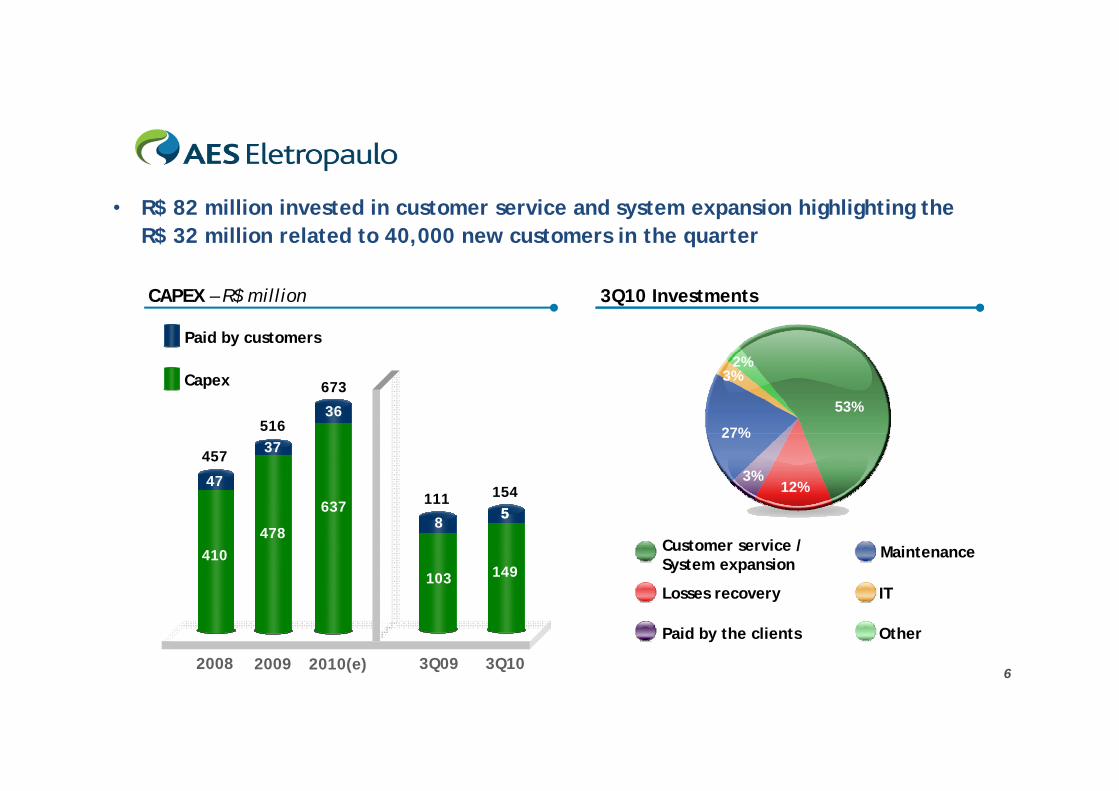
• R$ 82 million invested in customer service and system expansion highlighting the R$ 32 million related to 40,000 new customers in the quarter
410
457
47
516
478
37
637
36
673
CAPEX – R$ million
Paid by customers
Capex
Customer service / System expansion
Paid by the clients
Losses recovery
Maintenance
IT
Other
5
12%
27%
53%
3%
3%2%
7
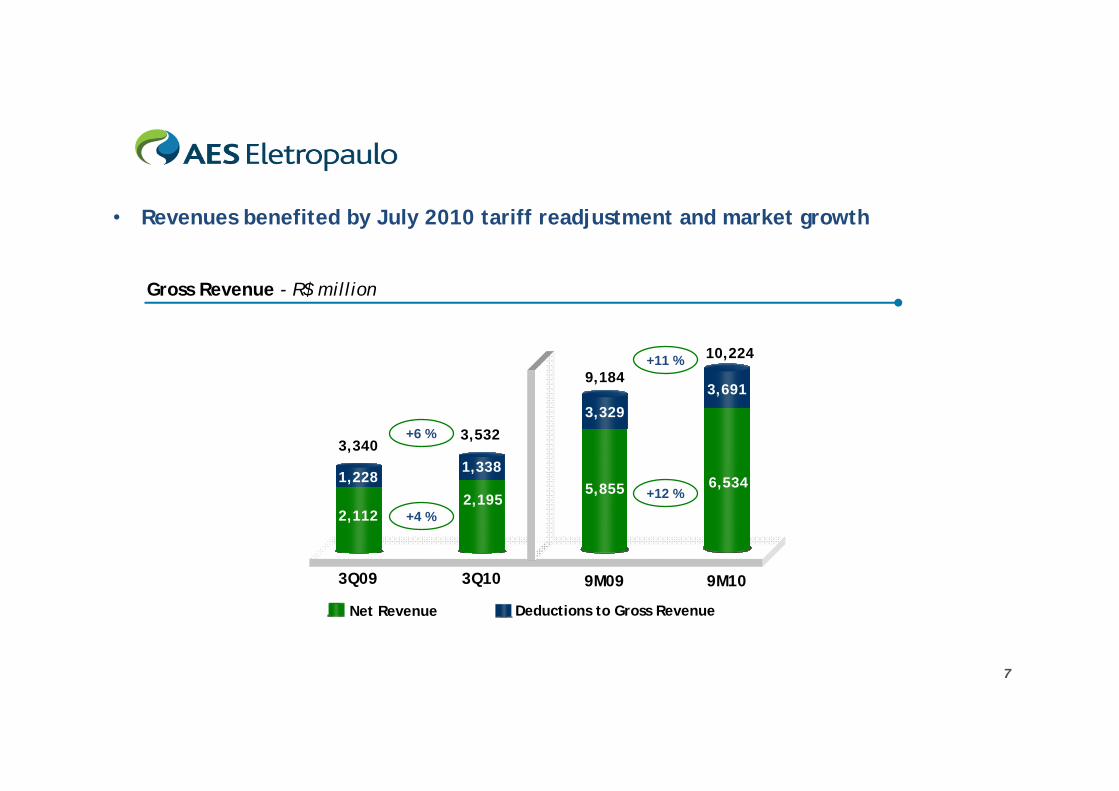
• Revenues benefited by July 2010 tariff readjustment and market growth
Gross Revenue - R$ million
3Q09 3Q10
1,228
2,112
3,3401,338
2,195
3,532+6 %
+4 %
9M09 9M10
3,329
5,855
9,1843,691
6,534
10,224+11 %
+12 %
Deductions to Gross RevenueNet Revenue
8
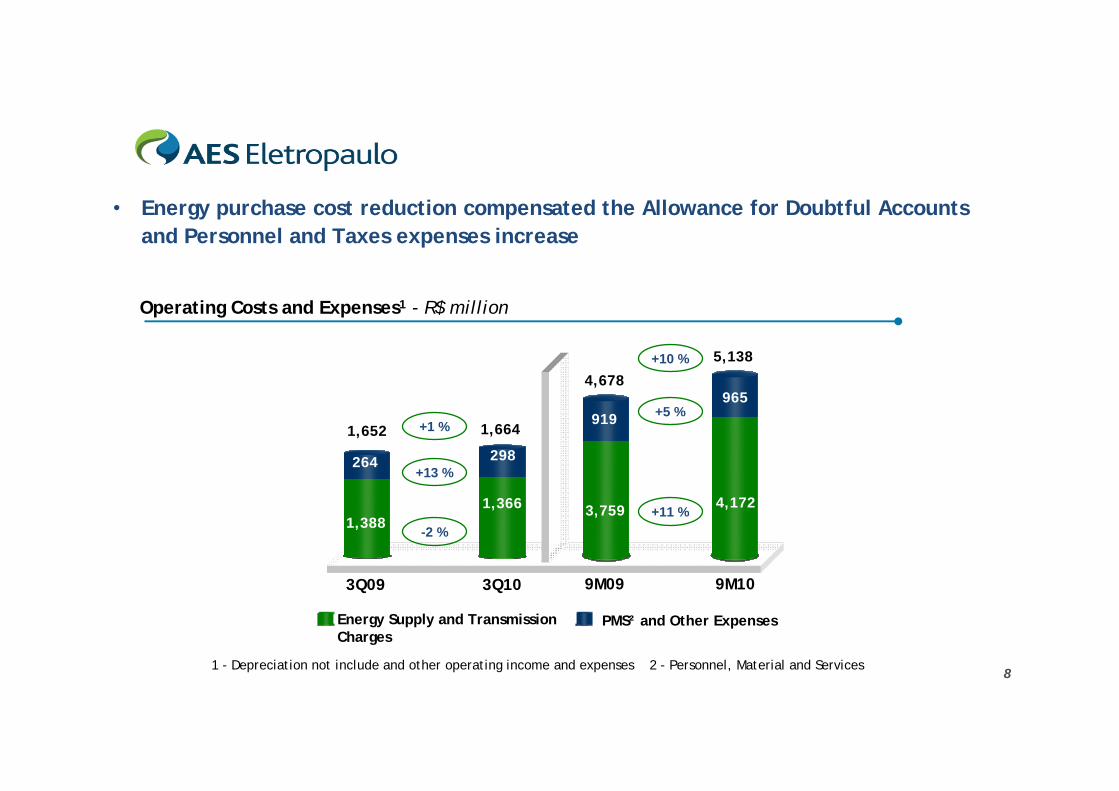
• Energy purchase cost reduction compensated the Allowance for Doubtful Accounts and Personnel and Taxes expenses increase
Operating Costs and Expenses1 - R$ million
3Q09 3Q10
264
1,388
1,652
298
1,366
1,664+1 %
+13 %
-2 %
9M09 9M10
919
3,759
4,678965
4,172
5,138+10 %
+5 %
+11 %
PMS² and Other ExpensesEnergy Supply and Transmission Charges
1 - Depreciation not include and other operating income and expenses 2 - Personnel, Material and Services
9
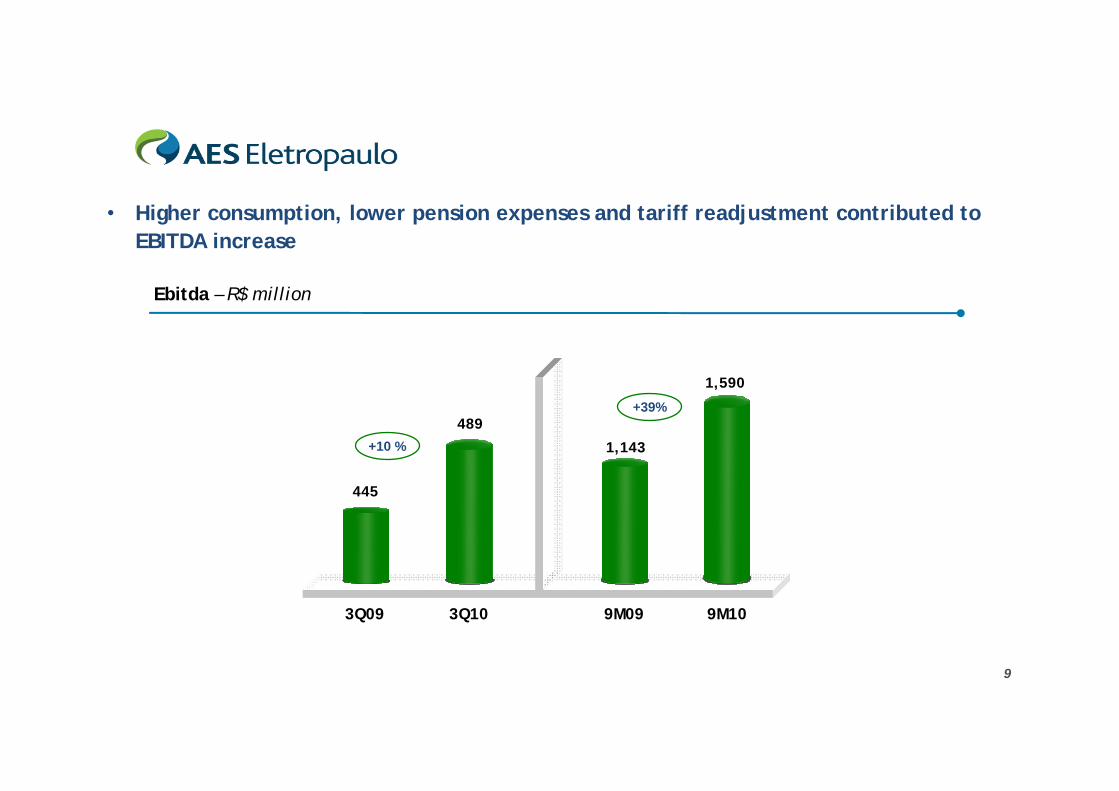
• Higher consumption, lower pension expenses and tariff readjustment contributed to EBITDA increase
3Q09 3Q10
+10 %
9M09 9M10
+39%
445
489
1,143
1,590
Ebitda – R$ million
10
3Q103Q09
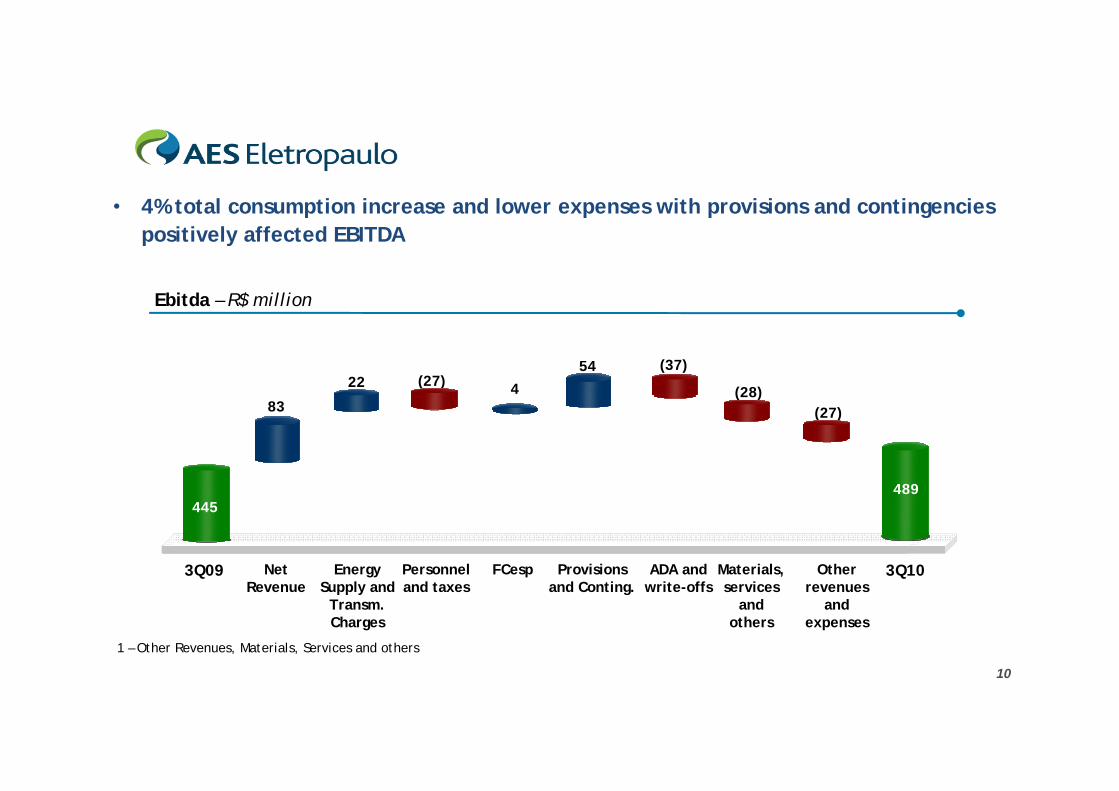
• 4% total consumption increase and lower expenses with provisions and contingencies positively affected EBITDA
Ebitda – R$ million
1 – Other Revenues, Materials, Services and others
Other revenues
and expenses
FCespNetRevenue
Energy Supply and
Transm. Charges
Personnel and taxes
ADA andwrite-offs
Materials, services
and others
489
83
445
4
54 (37)22 (27)
(28)(27)
Provisions and Conting.
11
3Q10
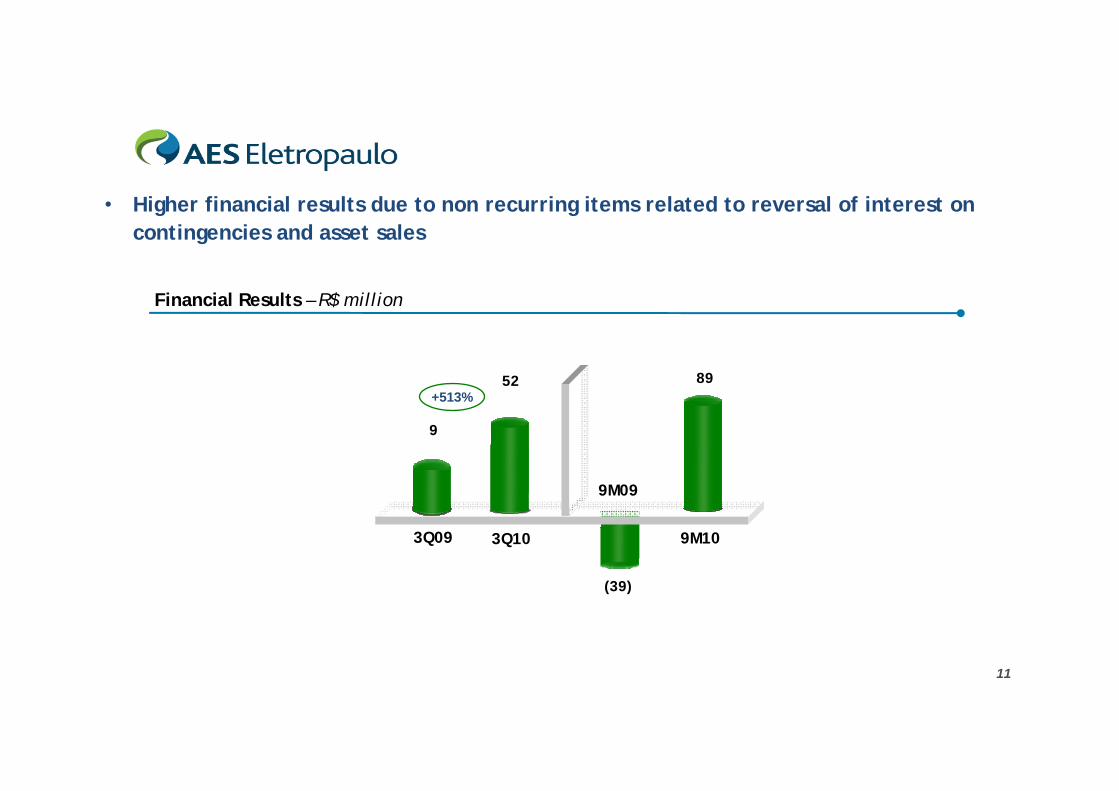
• Higher financial results due to non recurring items related to reversal of interest on contingencies and asset sales
52
(39)
89
9M09
9M10
9
3Q09
+513%
Financial Results – R$ million
12
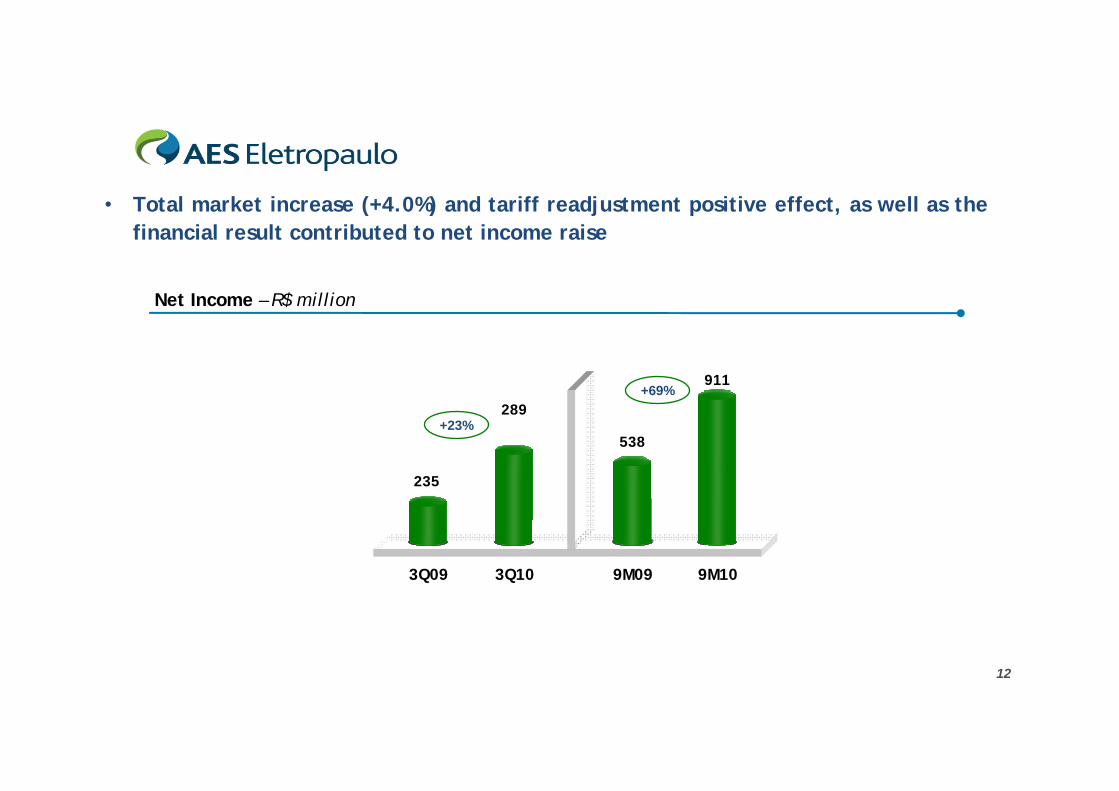
3Q09 3Q10
+23%289
• Total market increase (+4.0%) and tariff readjustment positive effect, as well as the financial result contributed to net income raise
9M09
538
9M10
911+69%
235
Net Income – R$ million
13
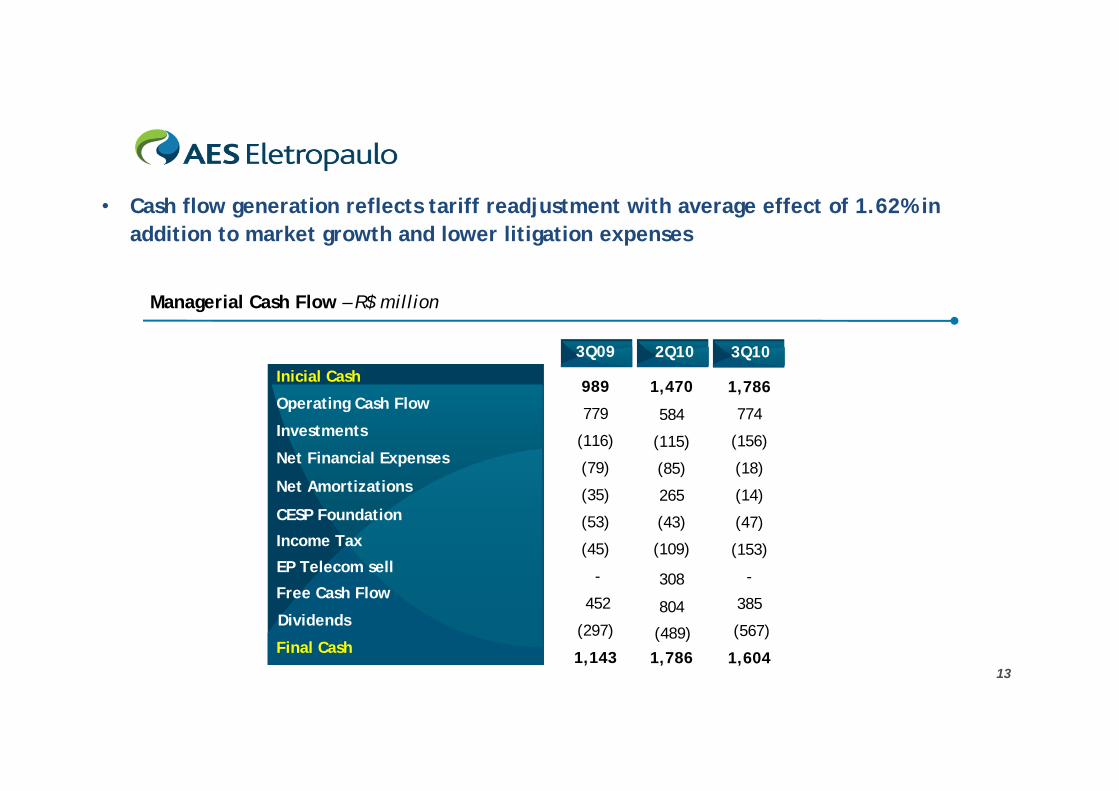
• Cash flow generation reflects tariff readjustment with average effect of 1.62% in addition to market growth and lower litigation expenses
3Q09
989
779
(116)
(79)
(35)
(53)
(45)
452
1,143
(297)
3Q10
-
2Q10
1,470
584
(115)
(85)
265
(43)
(109)
804
1,786(489)
308
Managerial Cash Flow – R$ million
Inicial Cash
Operating Cash Flow
Investments
Net Financial Expenses
Net Amortizations
CESP Foundation
Income Tax
Dividends
Free Cash Flow
Final Cash
EP Telecom sell
1,786
774
(156)
(18)
(14)
(47)
(153)
385
1,604
(567)
-
14
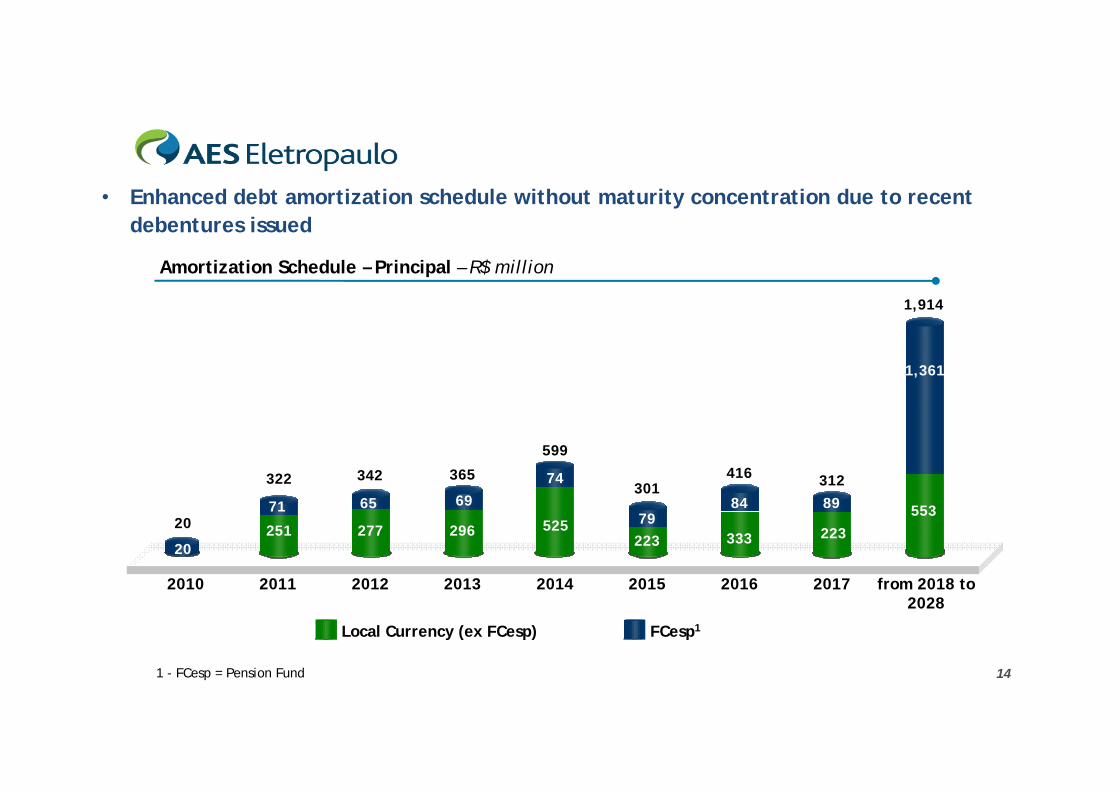
• Enhanced debt amortization schedule without maturity concentration due to recent debentures issued
Amortization Schedule – Principal – R$ million
Local Currency (ex FCesp) FCesp1
2010 2011 2012 2013 2014 2015 from 2018 to 2028
20172016
524251 277 296 525
223
553
56
1,361
6520
322 342 365
599
301
1,914
312
333
416
71 6974
7984 89
22320
1 - FCesp = Pension Fund
15
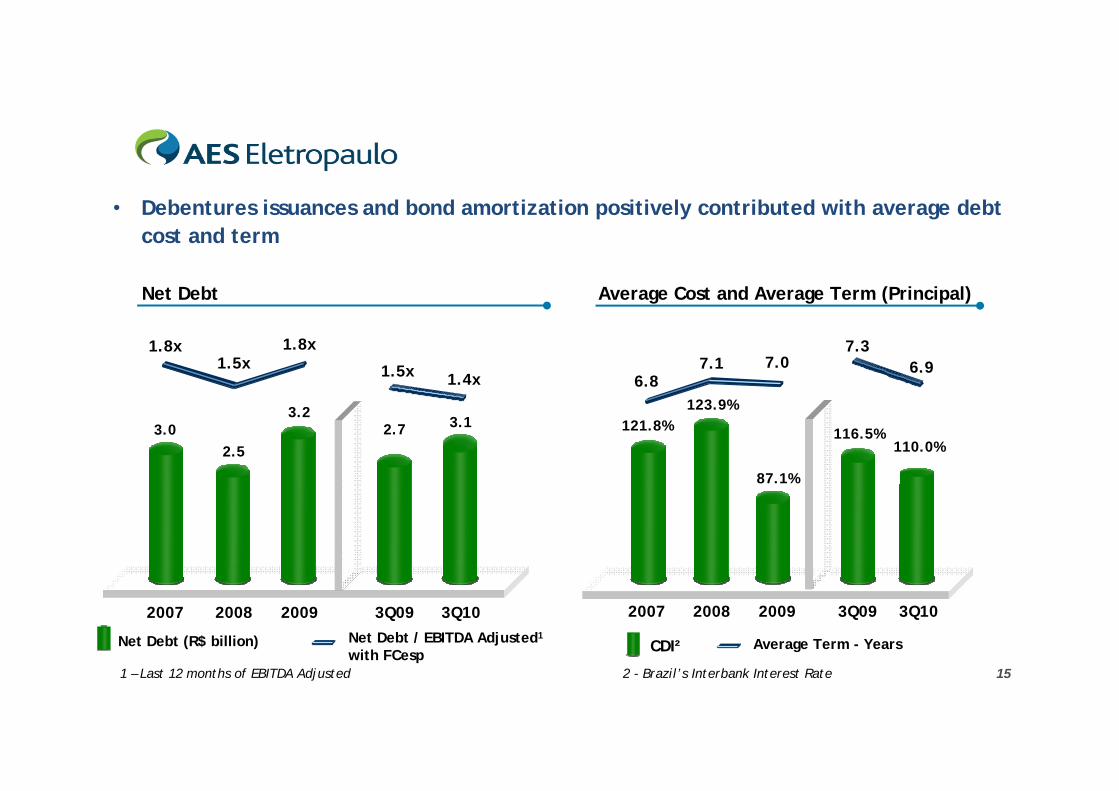
• Debentures issuances and bond amortization positively contributed with average debt cost and term
2007
3.0
2008
2.5
1.8x1.5x
1.8x
3.1
1.5x
3Q10
2.7
3Q09
1.4x
2009
3.2
6.87.1 7.0 6.9
2007
121.8%
2008
123.9%
3Q10
110.0%
3Q09
116.5%
2009
87.1%
7.3
Net Debt Average Cost and Average Term (Principal)
CDI² Average Term - YearsNet Debt (R$ billion) Net Debt / EBITDA Adjusted1
with FCesp1 – Last 12 months of EBITDA Adjusted 2 - Brazil’s Interbank Interest Rate
The statements contained in this document with regard to the business prospects, projected operating and financial results, and growth potential are merely forecasts based on the expectations of the Company’s Management in relation to its future performance.
Such estimates are highly dependent on market behavior and on the conditions affecting Brazil’s macroeconomic performance as well as the electric sector and international market, and they are therefore subject to changes.
3Q10 Results