3. the water cycle - west suffolk councils homepage · 3. the water cycle 3.1 introduction the...
TRANSCRIPT

C r ea t i ng t h e en v i ro n men t f o r bu s i n es s
Final Report © Entec UK Limited
Doc Reg No. C039
Page 9 November 2008
3. The Water Cycle
3.1 Introduction
The urban water cycle describes the pathways and processes through which the water we use, together with rainfall
runoff, moves through the natural and built environment, as well as through the above and below ground
infrastructure on which the domestic population and industry depend. Figure 3.1 summarises the water cycle and
how water enters, leaves and returns to the river system.
Figure 3.1 Schematic of the urban water cycle
The capacity of the water infrastructure needs to be sized appropriately to ensure the sufficient supply of clean
water to homes and industry and to receive foul drainage, whilst preventing the discharge of polluted runoff and
untreated foul drainage to protect the quality of the receiving water and any dependant habitats.
Rainfall is collected and
treated to potable
standard and pumped to
homes and other non-
domestic properties.
Waste water and foul effluent
is collected, treated and
removed from settlements.
Treated effluent is usually
discharged into the river
system.
Surface runoff from roads
and other hard surfaces
can exacerbate localised
flooding and introduce
pollutants in to streams and
rivers.
The floodplain absorbs excess
water spilling from rivers during
flood events.
Combined sewers carry storm
water and sewer water. During
heavy rainfall increased flows
can exceed capacity and
sewage is forced to overflow into
streams and rivers through
outfalls.
C r ea t i ng t h e en v i ro n men t f o r bu s i n es s
Final Report © Entec UK Limited
Doc Reg No. C039
Page 10 November 2008
3.2 Integrated Catchment Management
Development in the study area is constrained by environmental quality objectives enforced by UK and European
legislation. The Water Framework Directive (WFD) is European legislation that aims to consolidate existing
legislation. It came into force in December 2000, and was transposed into UK law in 2003. It introduces some
new environmental standards that will help to improve the ecological health of inland waters to achieve ‘good
status’. This will be achieved by:
• driving more sustainable use of water as a natural resource, through wiser consumption habits;
• creating better habitats for wildlife that lives in and around water, for example by improving the
chemical quality of water;
• progressively reducing or phasing out discharges, emissions and losses of priority substances and
priority hazardous substances;
• progressively reducing the pollution of groundwater;
• contributing to mitigating the effects of floods and droughts.
There is synergy between the philosophy behind Water Cycle Studies and WFD which is designed to ensure that
water bodies maintain or achieve ‘good status’ through the holistic management of all the contributing factors, such
as:
• pollution from specific discharge points;
• diffuse pollution related to various land use type;
• abstractions in the catchment that may be reducing the capacity of the water body to dilute pollutants;
• flooding events that may introduce additional pollutants, or modify the channel morphology, through
erosion or sediment deposition.
The influence of the Water Framework Directive on the provision and quality of wastewater treatment processes is
described in section 6.1.4.
Sustainable drainage systems that encourage infiltration and slow down the movement of rainfall runoff in the
catchment could both reduce the amount of urban pollutants entering watercourses, and mitigate the impact of
intense rainfall events on surface water flooding. Reducing the amount of potable water that is wasted by
implementing water efficiency measures, would reduce the pressure to abstract, reducing the pressure on aquatic
ecosystems, increasing the volume of water available for dilution, and conversely reducing flow in the sewer
network.
C r ea t i ng t h e en v i ro n men t f o r bu s i n es s
Final Report © Entec UK Limited
Doc Reg No. C039
Page 11 November 2008
The urban water cycle is complex and highly integrated with many feedback mechanisms. Advanced planning and
appropriate management helps to ensure that the water cycle contributes to a safe, clean and healthy environment,
rather than being a source of long term problems.
3.3 The Study Area
In order to advise on the most sustainable approach water management, an understanding of the existing natural
environment and drainage infrastructure is required. The hydrology, ground conditions and drainage of the study
area have been summarised using information from various sources, including the Environment Agency, the British
Geological Survey and the National Soils Research Institute, and consultations with Anglian Water. Figure shows
the main towns within the study area, and the WwTWs serving populations over 500. It illustrates the main rivers
into which the treatment plants discharge treated effluent. There are two SSSI sites, these are both terrestrial
woodlands and so are not directly affected by activities within the urban water cycle. There are no Special Areas of
Conservation (SAC) or Special Protection Areas (SPA) within the study area, although the Essex Estuaries is a
designated SAC, and the Blackwater Estuary and Abberton Reservoir to the south east of the district have SPA
status.
More details on specific elements of the study area are presented in this report:
• Bedrock geology and surface drift geology Figure 3.3
• Water Company zones boundaries Figure 4.1
• Groundwater protection zones Figure 6.1
C r ea t i ng t h e en v i ro n men t f o r bu s i n es s
Final Report © Entec UK Limited
Doc Reg No. C039
Page 12 November 2008
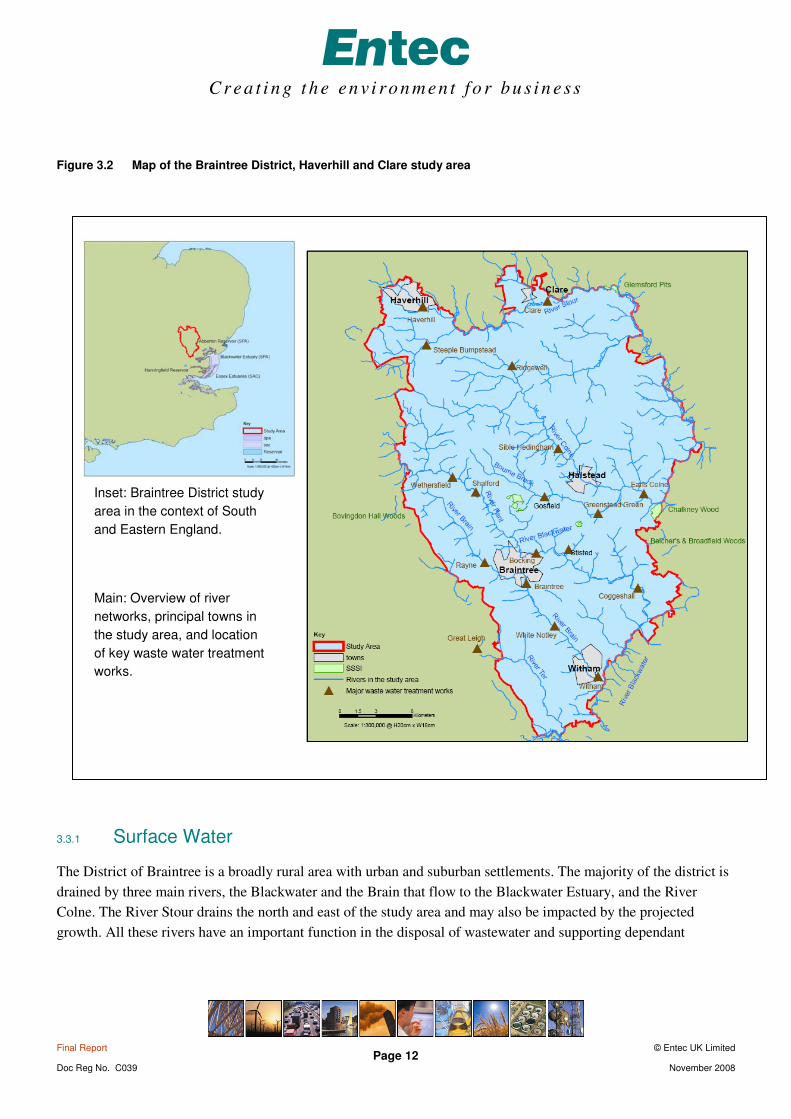
Figure 3.2 Map of the Braintree District, Haverhill and Clare study area
3.3.1 Surface Water
The District of Braintree is a broadly rural area with urban and suburban settlements. The majority of the district is
drained by three main rivers, the Blackwater and the Brain that flow to the Blackwater Estuary, and the River
Colne. The River Stour drains the north and east of the study area and may also be impacted by the projected
growth. All these rivers have an important function in the disposal of wastewater and supporting dependant
Inset: Braintree District study
area in the context of South
and Eastern England.
Main: Overview of river
networks, principal towns in
the study area, and location
of key waste water treatment
works.

C r ea t i ng t h e en v i ro n men t f o r bu s i n es s
Final Report © Entec UK Limited
Doc Reg No. C039
Page 13 November 2008
habitats, particularly the reservoirs and estuaries, in addition to the supply of water for consumption, industry and
irrigation. All the rivers flow south east into the North Sea on the Essex coastline.
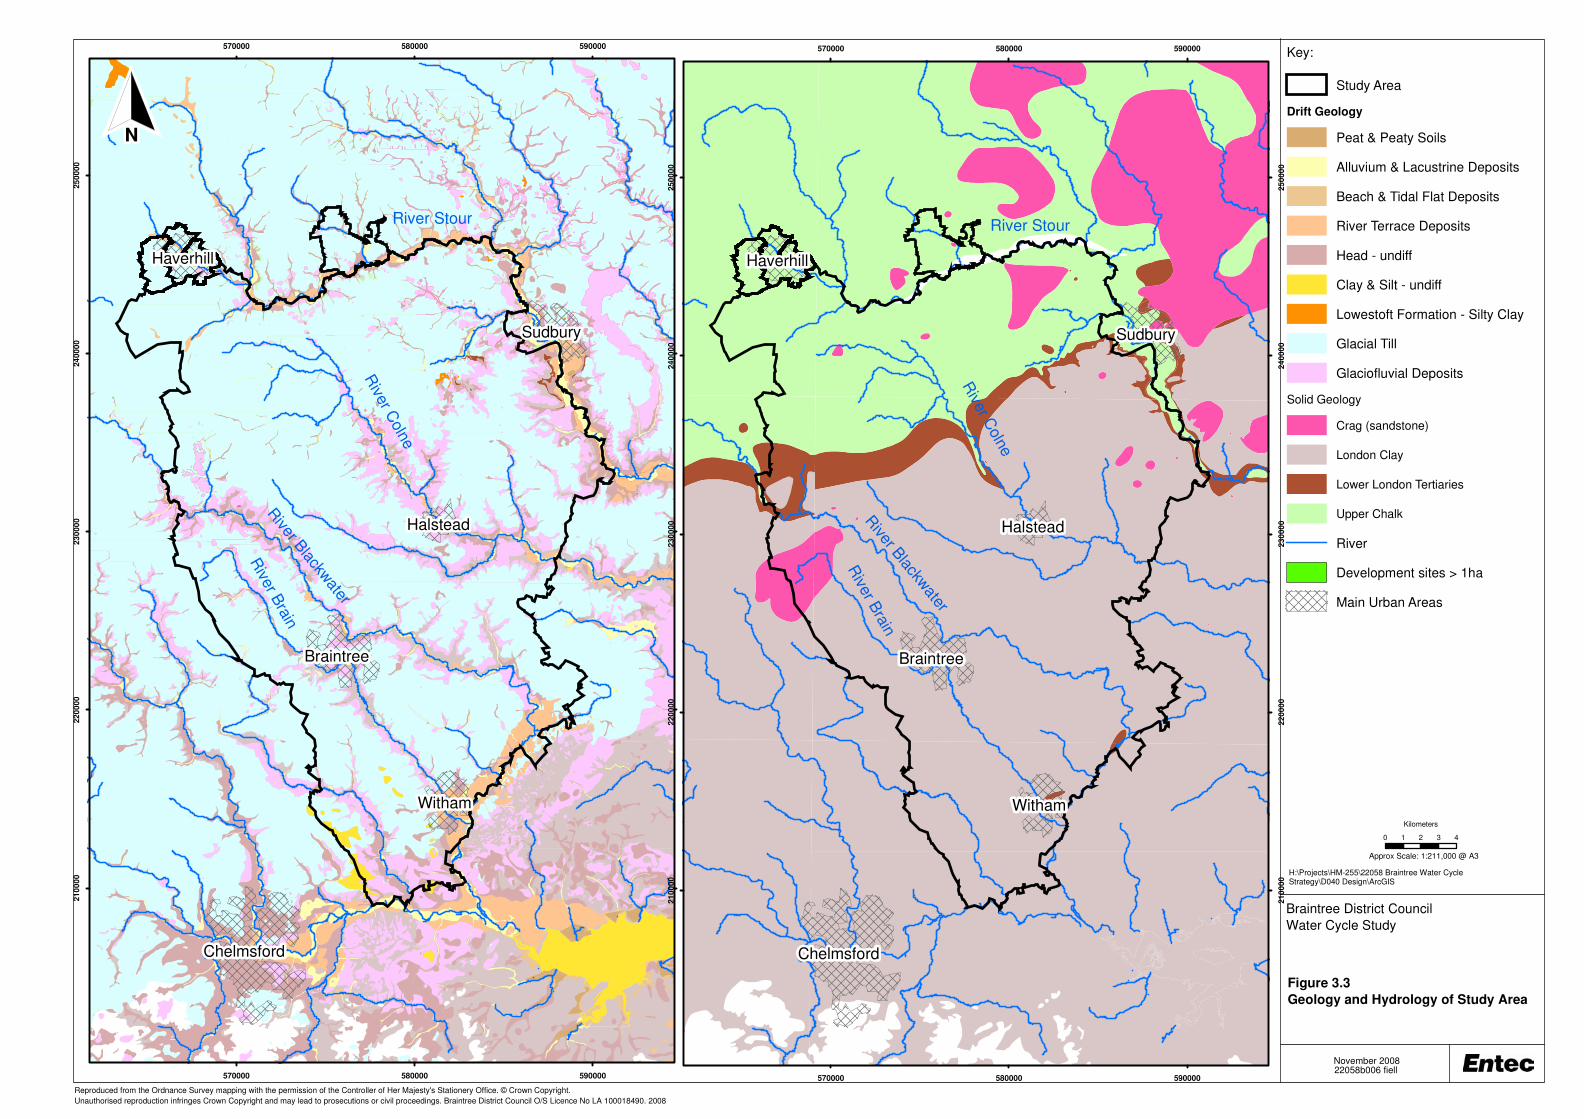
3.3.2 Geology and Hydrogeology
Much of the study area is underlain by London clay, with the exception of the north around Haverhill that is
underlain by Cretaceous Chalk. The London Clay has a low permeability, meaning that water cannot move
through the rock. In contrast, the chalk is highly permeable. Overlying the London Clay and Chalk are deposits of
Boulder Clay and, within the river valleys, River Terrace Deposits. The soil has a predominantly lime-rich loamy
and clayey nature that impedes drainage.
Infiltration rates are low in the clay and rainfall is predominantly conveyed via surface runoff into the river systems
quickly. In areas where chalk is dominant, the potential for infiltration is much higher. However the overlying
drift deposits of Boulder Clay and soils impedes infiltration.
The London Clay is classified as a minor aquifer. The formation has low permeability and little groundwater yield
for mains public water supply, but may be an important source for local supplies and to maintain baseflows in to
the rivers. The London Clay overlies Cretaceous Chalk at a depth of around 30 to 60m between Braintree and
Witham. The Chalk is classified as a major aquifer with high permeability and provides groundwater abstractions
for public water supply and other uses.
Figure 3.3 shows the bedrock geology and the surface drift geology of the Braintree District, Haverhill and Clare
study area.
The following technical sections describe the different elements of the water cycle and assess the current capacity
to accommodate proposed growth across the study area. Capacity issues that pose a potential barrier to
development are highlighted together with a review of the strategic options proposed by the water companies and
recommendations for Local Authorities and Developers to consider.

C r ea t i ng t h e en v i ro n men t f o r bu s i n es s
Final Report © Entec UK Limited
Doc Reg No. C039
Page 14 November 2008
3.4 Climate Change
It is important to take into account the predicted impacts of climate change when considering surface water
management, as advocated within PPS25 and PPS1. The changes in global climate patterns are predicted to lead to
increased global temperatures, cause sea levels to rise and increase the frequency and intensity of rainfall and
extreme weather. At a regional scale the nature of impacts will vary, and will depend on the levels of greenhouse
gas in the atmosphere. Alternative forecasts have been calculated based on varying greenhouse gas emissions
scenarios by the U.K. Climate Change Impacts Programme (UKCIP). For Essex, under a Medium-High emissions
scenario in the 2050s, the 2002 UKCIP predictions1 forecast an increase in rainfall of between 15% and 20% in the
winter accompanied by decreases in summer rainfall of between 20% and 30%.
Entec has reviewed the published Water Resources Management Plans (WRMPs) to confirm that both Anglian
Water and Essex and Suffolk Water have incorporated the most likely impacts of climate change into their resource
and demand forecasts. Both companies have also used good practice to take account of the uncertainties associated
with climate change. The water supply component of this Water Cycle Study is based on the data provided by the
water companies, and so the impact of climate change.
PPS25 uses data extracted from UKCIP2 to detail the allowances that should be made to accommodate climate
change. Allowances will be needed to manage increased rainfall and the subsequent increase in runoff that will be
generated. PPS25 expects new developments to be designed to accommodate the impacts of increase runoff from
climate change. Sustainable Drainage Systems (SuDS) will become more important to manage increased rainfall
during the future winters and during extreme storm events. Drainage recommendations are inherently site specific
and so the impacts that climate change may have on the need for, and design of, sustainable drainage should be
considered further in the more detailed Phase 2 WCS.
1 Climate Change Scenarios for the United Kingdom, The UKCIP Scientific Report, UKCIP, April 2002
2 www.ukcip.co.uk
Chelmsford
Braintree
Witham
Haverhill
Sudbury
Halstead
570000
570000
580000
580000
590000
590000
21
00
00
21
00
00
22
00
00
22
00
00
23
00
00
23
00
00
24
00
00
24
00
00
25
00
00
25
00
00
Reproduced from the Ordnance Survey mapping with the permission of the Controller of Her Majesty's Stationery Office. © Crown Copyright.
Unauthorised reproduction infringes Crown Copyright and may lead to prosecutions or civil proceedings. Braintree District Council O/S Licence No LA 100018490. 2008
22058b006 fiell
Braintree District Council
Water Cycle Study
Figure 3.3
Geology and Hydrology of Study Area
Approx Scale: 1:211,000 @ A3
November 2008
0 1 2 3 4
Kilometers
N
H:\Projects\HM-255\22058 Braintree Water Cycle Strategy\D040 Design\ArcGIS
Key:
Study Area
Drift Geology
Peat & Peaty Soils
Alluvium & Lacustrine Deposits
Beach & Tidal Flat Deposits
River Terrace Deposits
Head - undiff
Clay & Silt - undiff
Lowestoft Formation - Silty Clay
Glacial Till
Glaciofluvial Deposits
Solid Geology
Crag (sandstone)
London Clay
Lower London Tertiaries
Upper Chalk
River
Development sites > 1ha
Main Urban Areas
Rive
r Coln
e
River B
lackwater
Rive
r Brain
River Stour
Chelmsford
Braintree
Witham
Haverhill
Sudbury
Halstead
570000
570000
580000
580000
590000
590000
21
00
00
21
00
00
22
00
00
22
00
00
23
00
00
23
00
00
24
00
00
24
00
00
25
00
00
25
00
00
Rive
r Coln
e
River B
lackwater
Rive
r Brain
River Stour