3 - tools for stratigraphic analysiseps.mcgill.ca/~courses/c186-425/tools for stratigraphic...
TRANSCRIPT
1
Tools for Stratigraphic Analysis
ContentsIntroductionMethods of Study: Modern EnvironmentsMethods of Study: Ancient DepositsSummary
IntroductionBasin analysts use a variety of methods to study modern and ancient basinsFor now, we will focus on the basin fill: sediments/sedimentary rocks
IntroductionQuestions:
Where do they come from?How are they deposited?What are their properties?What are controls on deposition?Etc.
Both “direct” and “indirect” methods are used to study basin fills
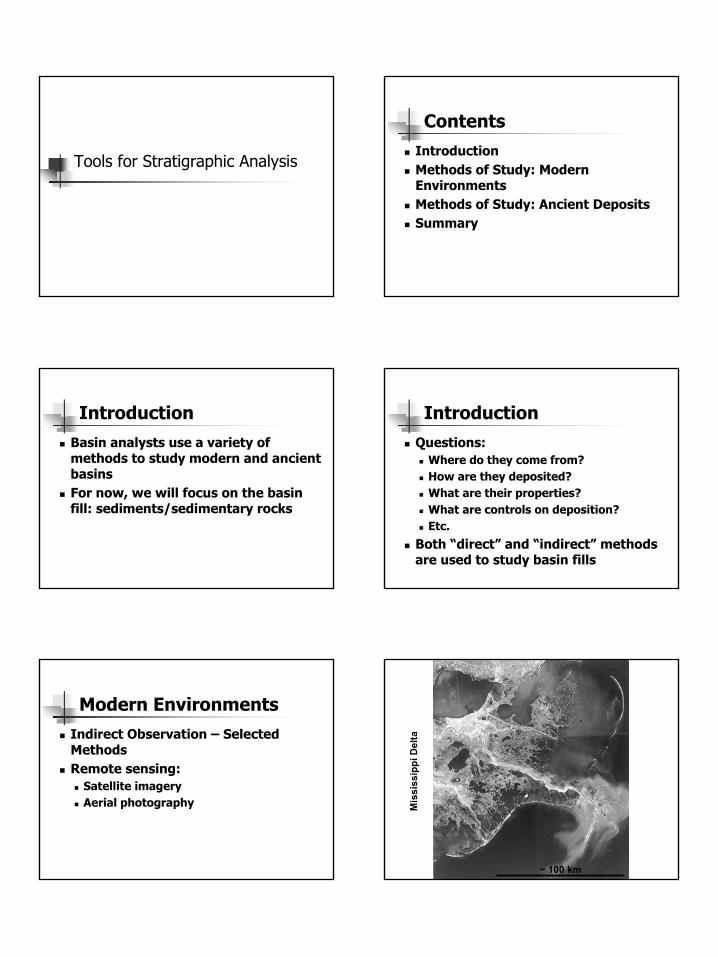
Modern EnvironmentsIndirect Observation – Selected MethodsRemote sensing:
Satellite imageryAerial photography
~ 100 km
Mis
siss
ippi
Del
ta
2
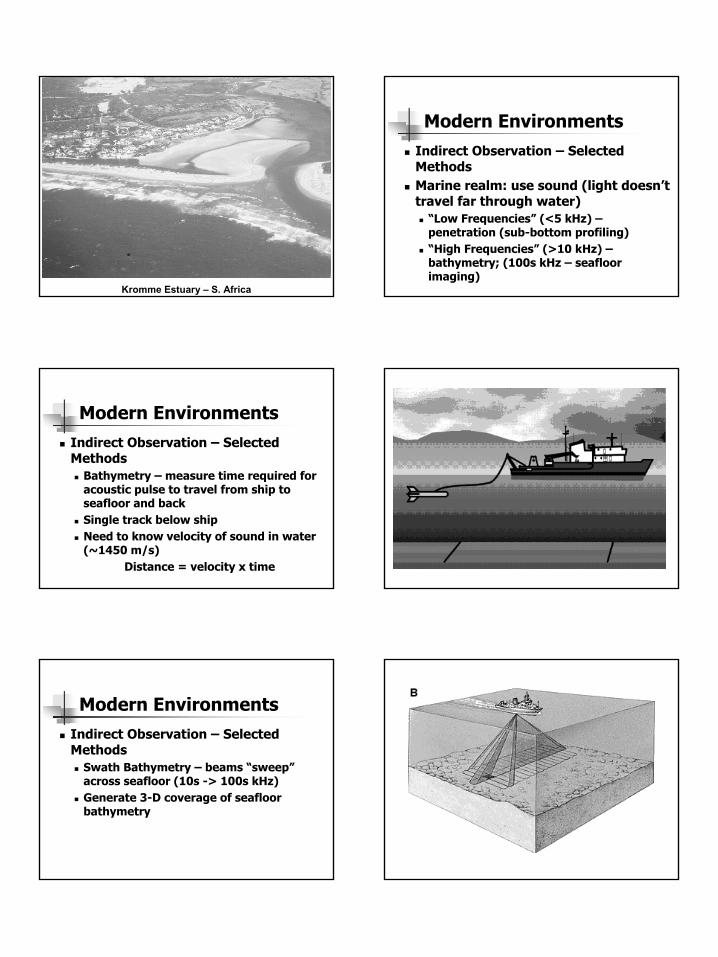
Kromme Estuary – S. Africa
Modern EnvironmentsIndirect Observation – Selected MethodsMarine realm: use sound (light doesn’t travel far through water)
“Low Frequencies” (<5 kHz) –penetration (sub-bottom profiling)“High Frequencies” (>10 kHz) –bathymetry; (100s kHz – seafloor imaging)
Modern EnvironmentsIndirect Observation – Selected Methods
Bathymetry – measure time required for acoustic pulse to travel from ship to seafloor and backSingle track below shipNeed to know velocity of sound in water (~1450 m/s)
Distance = velocity x time
Modern EnvironmentsIndirect Observation – Selected Methods
Swath Bathymetry – beams “sweep”across seafloor (10s -> 100s kHz)Generate 3-D coverage of seafloor bathymetry
3
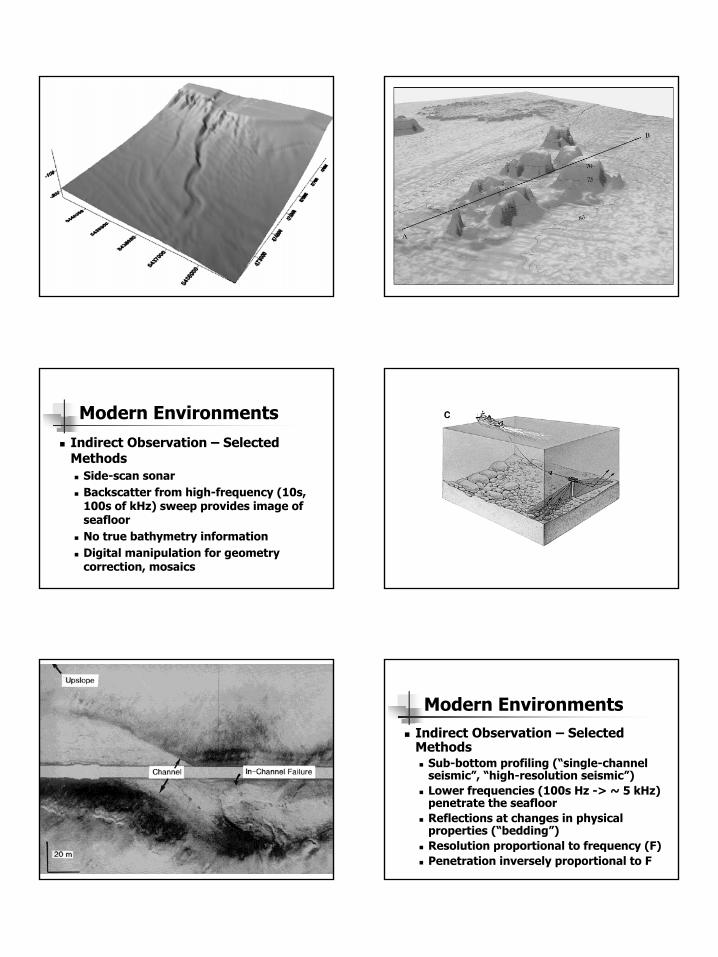
Modern EnvironmentsIndirect Observation – Selected Methods
Side-scan sonarBackscatter from high-frequency (10s, 100s of kHz) sweep provides image of seafloorNo true bathymetry informationDigital manipulation for geometry correction, mosaics
Modern EnvironmentsIndirect Observation – Selected Methods
Sub-bottom profiling (“single-channel seismic”, “high-resolution seismic”)Lower frequencies (100s Hz -> ~ 5 kHz) penetrate the seafloorReflections at changes in physical properties (“bedding”)Resolution proportional to frequency (F)Penetration inversely proportional to F
4
Modern EnvironmentsIndirect Observation – Selected Methods
See internal structure of seafloor featuresPenetrate meters -> 100s metersVertical axis in time (two-way traveltime)
Modern EnvironmentsA variety of “direct” methods are used to study modern environments
Observation/measurementSampling
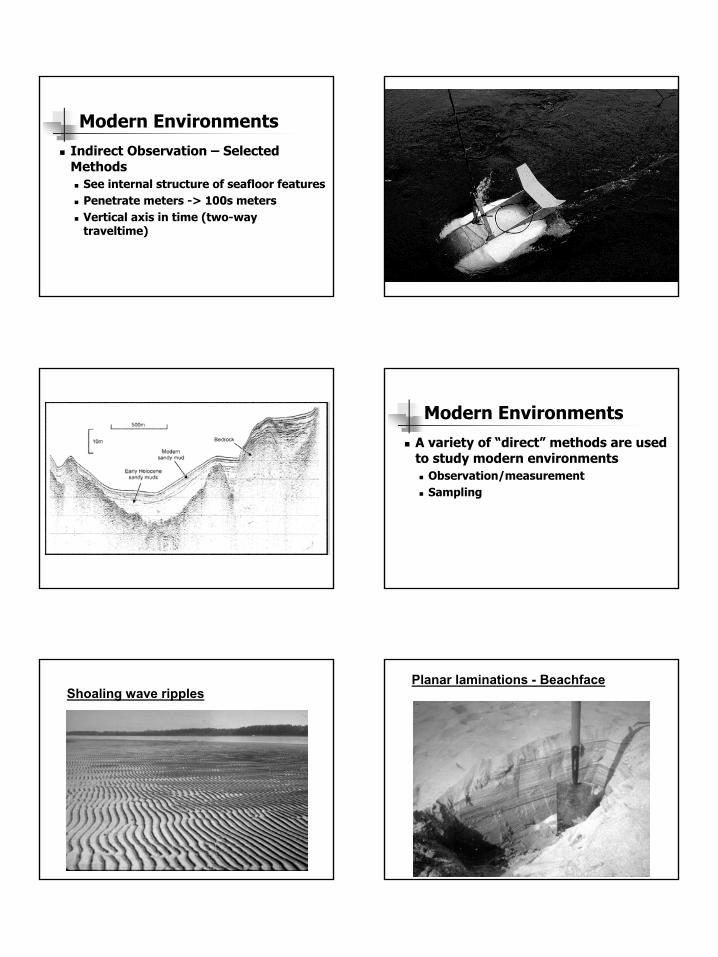
Shoaling wave ripplesPlanar laminations - Beachface
5
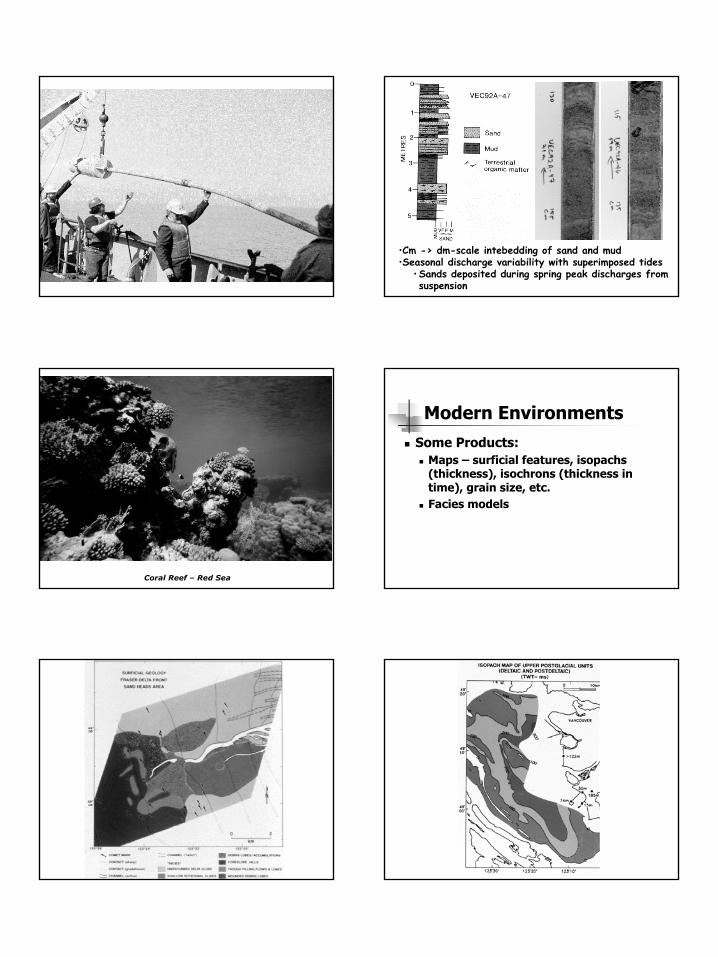
•Cm -> dm-scale intebedding of sand and mud•Seasonal discharge variability with superimposed tides
•Sands deposited during spring peak discharges from suspension
Coral Reef Coral Reef –– Red SeaRed Sea
Modern EnvironmentsSome Products:
Maps – surficial features, isopachs(thickness), isochrons (thickness in time), grain size, etc.Facies models
6
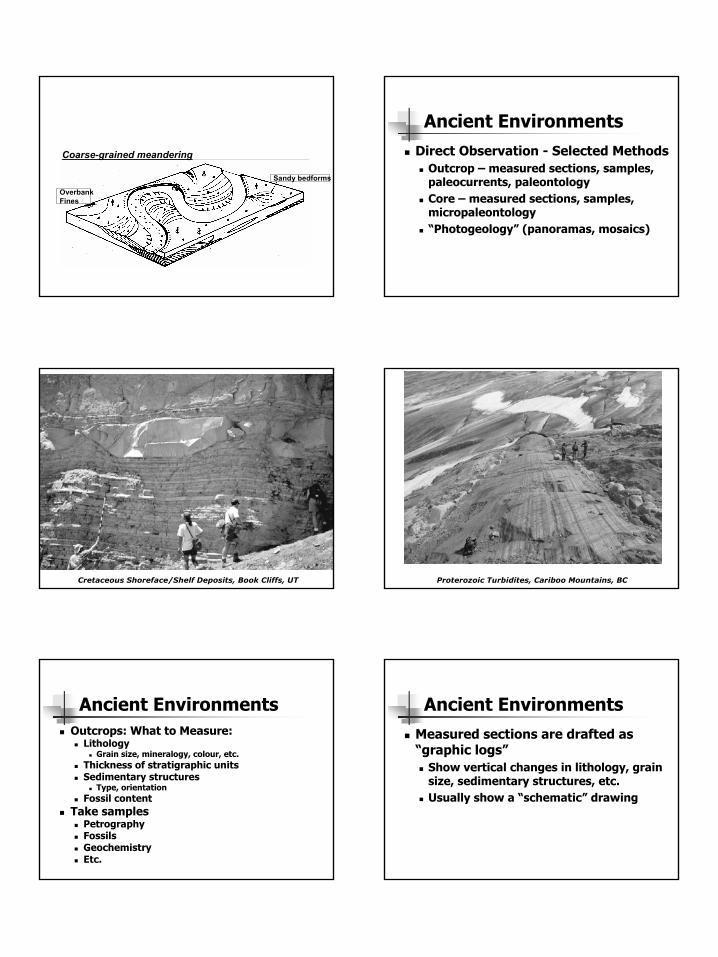
Coarse-grained meandering
OverbankFines
Sandy bedforms
Ancient EnvironmentsDirect Observation - Selected Methods
Outcrop – measured sections, samples, paleocurrents, paleontologyCore – measured sections, samples, micropaleontology“Photogeology” (panoramas, mosaics)
Cretaceous Cretaceous ShorefaceShoreface/Shelf Deposits, Book Cliffs, UT/Shelf Deposits, Book Cliffs, UT ProterozoicProterozoic TurbiditesTurbidites, , CaribooCariboo Mountains, BCMountains, BC
Ancient EnvironmentsOutcrops: What to Measure:
LithologyGrain size, mineralogy, colour, etc.
Thickness of stratigraphic unitsSedimentary structures
Type, orientationFossil content
Take samplesPetrographyFossilsGeochemistryEtc.
Ancient EnvironmentsMeasured sections are drafted as “graphic logs”
Show vertical changes in lithology, grain size, sedimentary structures, etc.Usually show a “schematic” drawing
7
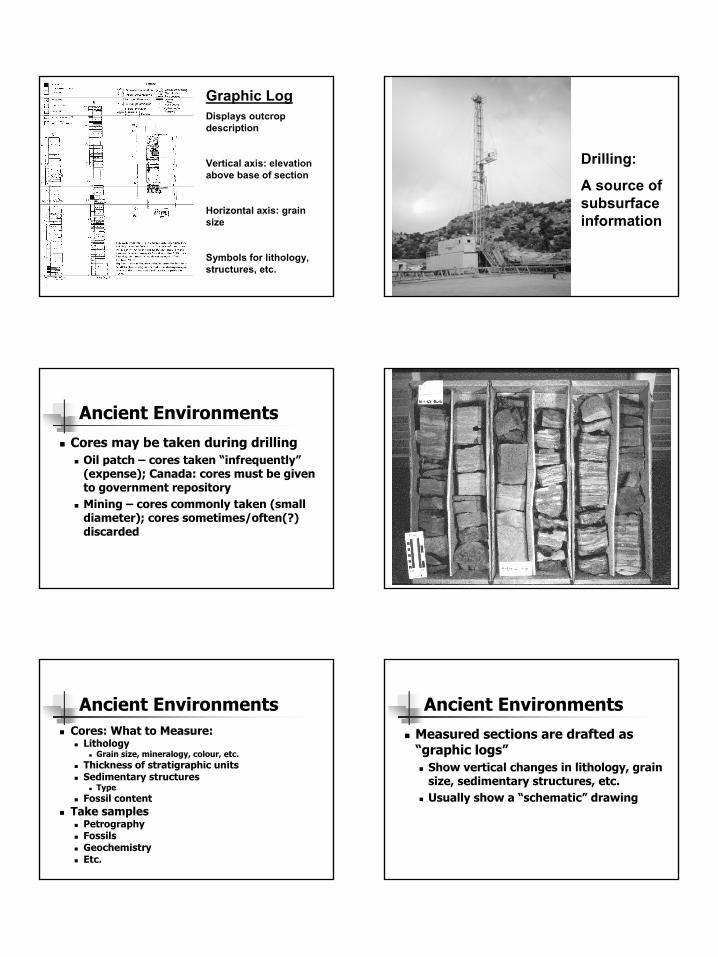
Graphic LogDisplays outcrop description
Vertical axis: elevation above base of section
Horizontal axis: grain size
Symbols for lithology, structures, etc.
Drilling:
A source of subsurface information
Ancient EnvironmentsCores may be taken during drilling
Oil patch – cores taken “infrequently”(expense); Canada: cores must be given to government repositoryMining – cores commonly taken (small diameter); cores sometimes/often(?) discarded
Ancient EnvironmentsCores: What to Measure:
LithologyGrain size, mineralogy, colour, etc.
Thickness of stratigraphic unitsSedimentary structures
TypeFossil content
Take samplesPetrographyFossilsGeochemistryEtc.
Ancient EnvironmentsMeasured sections are drafted as “graphic logs”
Show vertical changes in lithology, grain size, sedimentary structures, etc.Usually show a “schematic” drawing
8
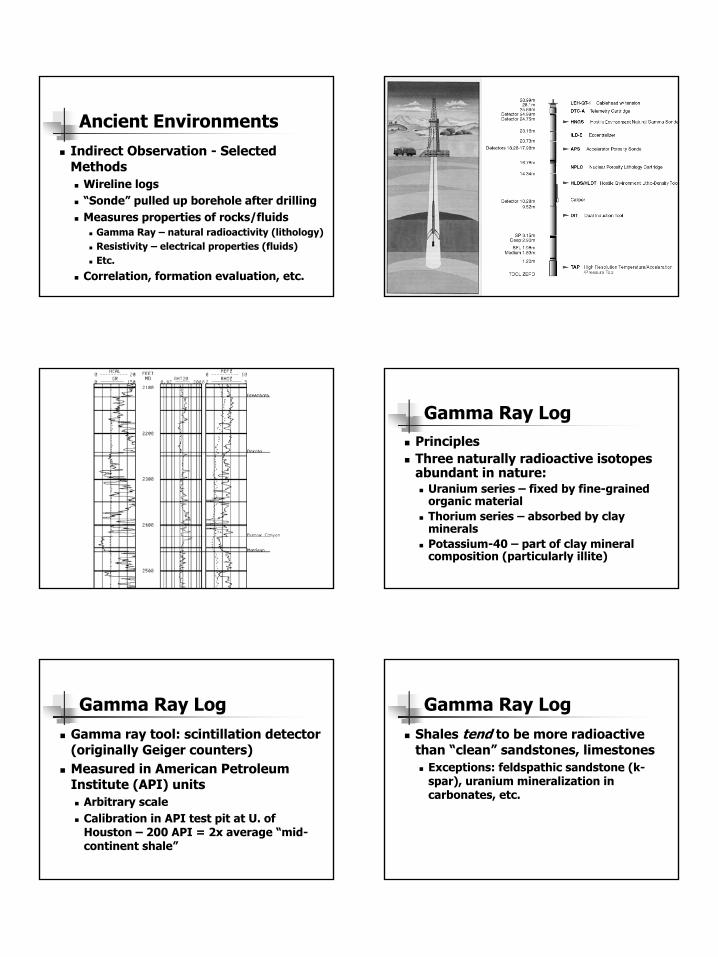
Ancient EnvironmentsIndirect Observation - Selected Methods
Wireline logs“Sonde” pulled up borehole after drillingMeasures properties of rocks/fluids
Gamma Ray – natural radioactivity (lithology)Resistivity – electrical properties (fluids)Etc.
Correlation, formation evaluation, etc.
Gamma Ray LogPrinciplesThree naturally radioactive isotopes abundant in nature:
Uranium series – fixed by fine-grained organic materialThorium series – absorbed by clay mineralsPotassium-40 – part of clay mineral composition (particularly illite)
Gamma Ray LogGamma ray tool: scintillation detector (originally Geiger counters)Measured in American Petroleum Institute (API) units
Arbitrary scaleCalibration in API test pit at U. of Houston – 200 API = 2x average “mid-continent shale”
Gamma Ray LogShales tend to be more radioactive than “clean” sandstones, limestones
Exceptions: feldspathic sandstone (k-spar), uranium mineralization in carbonates, etc.
9
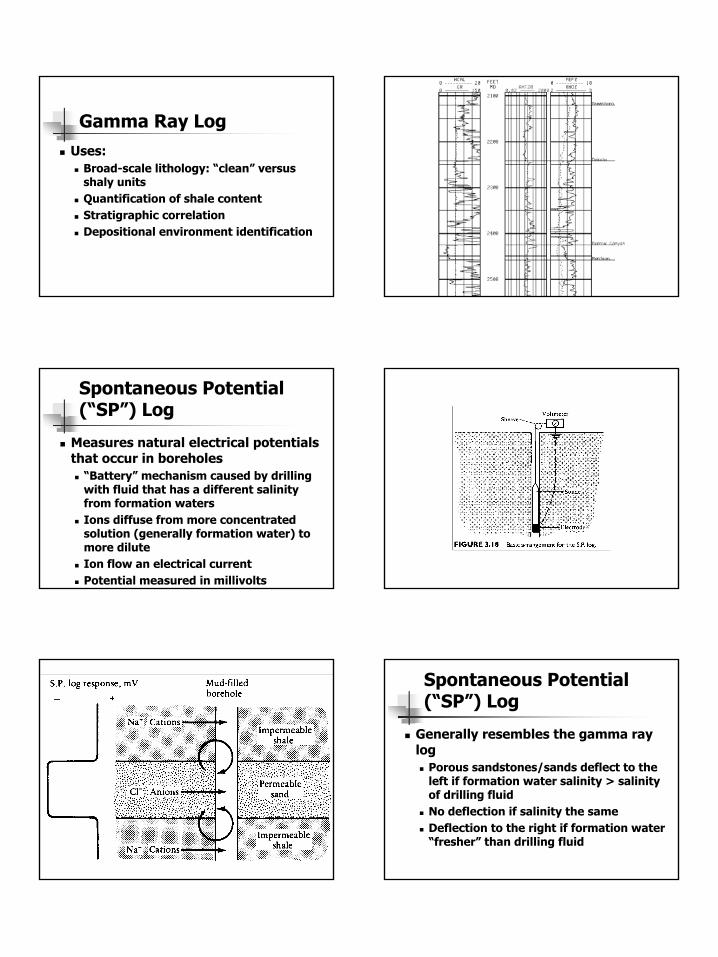
Gamma Ray LogUses:
Broad-scale lithology: “clean” versus shaly unitsQuantification of shale contentStratigraphic correlationDepositional environment identification
Spontaneous Potential (“SP”) Log
Measures natural electrical potentials that occur in boreholes
“Battery” mechanism caused by drilling with fluid that has a different salinity from formation watersIons diffuse from more concentrated solution (generally formation water) to more diluteIon flow an electrical currentPotential measured in millivolts
Spontaneous Potential (“SP”) Log
Generally resembles the gamma ray log
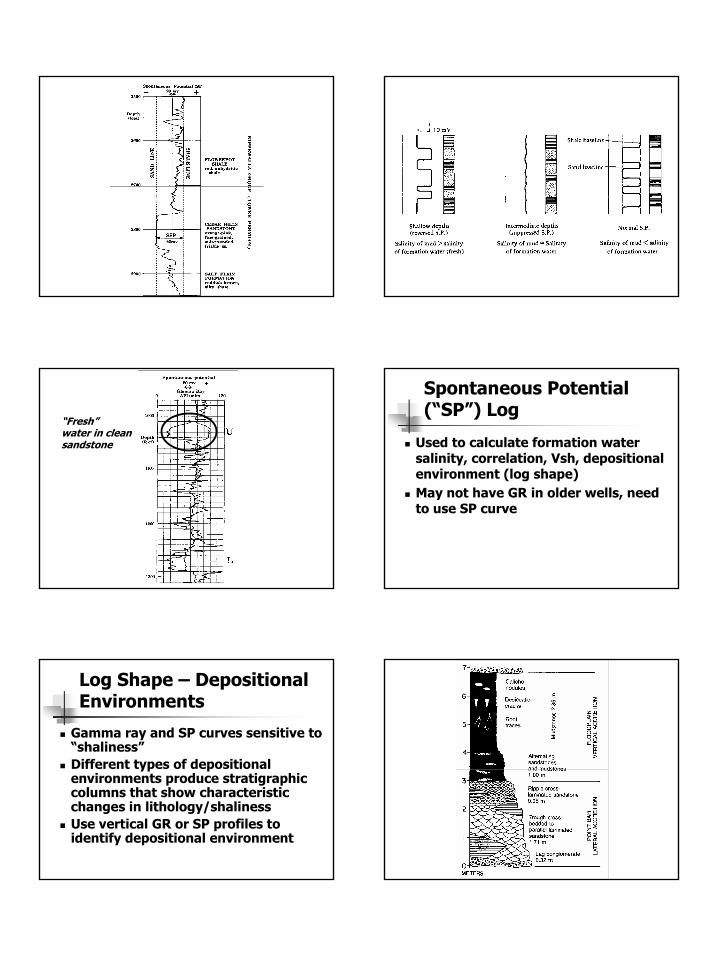
Porous sandstones/sands deflect to the left if formation water salinity > salinity of drilling fluidNo deflection if salinity the sameDeflection to the right if formation water “fresher” than drilling fluid
10
“Fresh”water in cleansandstone
Spontaneous Potential (“SP”) Log
Used to calculate formation water salinity, correlation, Vsh, depositional environment (log shape)May not have GR in older wells, need to use SP curve
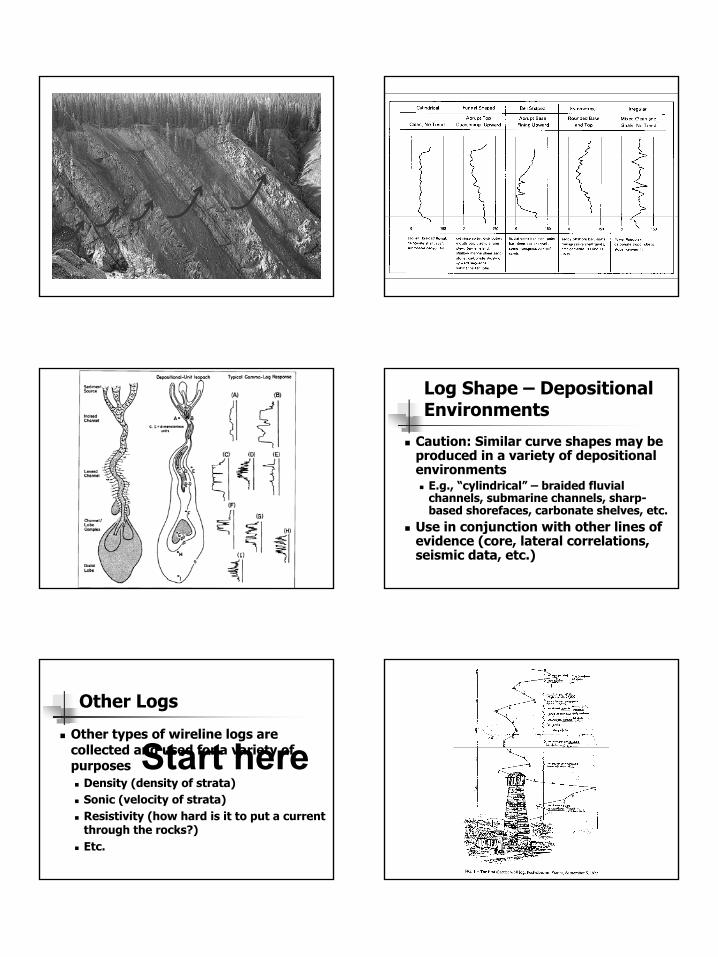
Log Shape – Depositional Environments
Gamma ray and SP curves sensitive to “shaliness”Different types of depositional environments produce stratigraphic columns that show characteristic changes in lithology/shalinessUse vertical GR or SP profiles to identify depositional environment
11
Log Shape – Depositional Environments
Caution: Similar curve shapes may be produced in a variety of depositional environments
E.g., “cylindrical” – braided fluvial channels, submarine channels, sharp-based shorefaces, carbonate shelves, etc.
Use in conjunction with other lines of evidence (core, lateral correlations, seismic data, etc.)
Other Logs
Other types of wireline logs are collected and used for a variety of purposes
Density (density of strata)Sonic (velocity of strata)Resistivity (how hard is it to put a current through the rocks?)Etc.
Start here
12
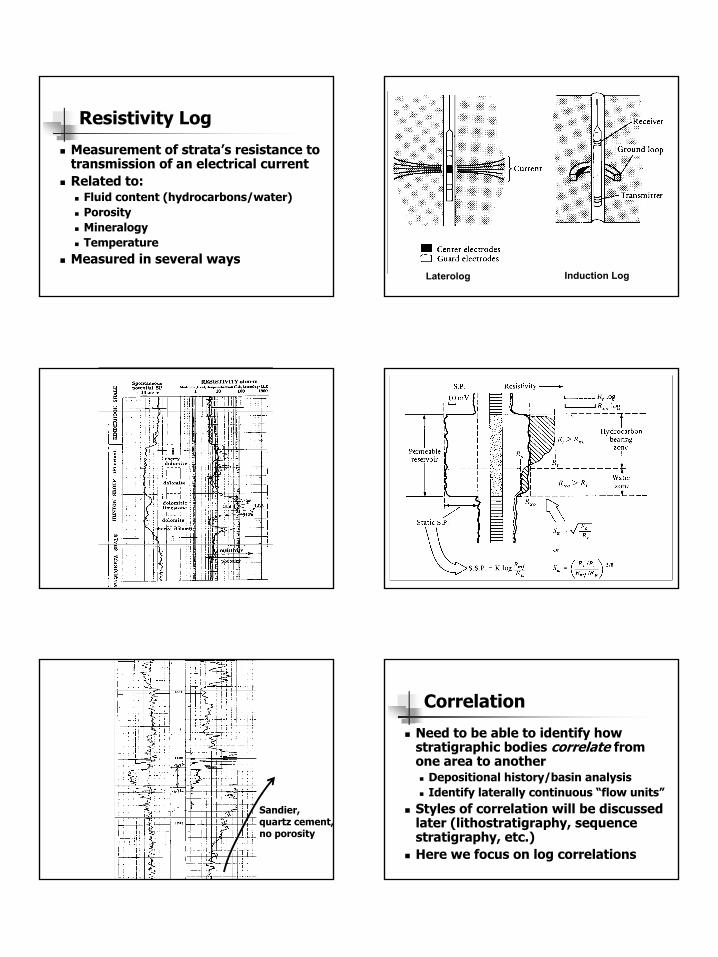
Resistivity Log
Measurement of strata’s resistance to transmission of an electrical currentRelated to:
Fluid content (hydrocarbons/water)PorosityMineralogyTemperature
Measured in several waysLaterolog Induction Log
Sandier,quartz cement,no porosity
Correlation
Need to be able to identify how stratigraphic bodies correlate from one area to another
Depositional history/basin analysisIdentify laterally continuous “flow units”
Styles of correlation will be discussed later (lithostratigraphy, sequence stratigraphy, etc.)Here we focus on log correlations
13
Correlation
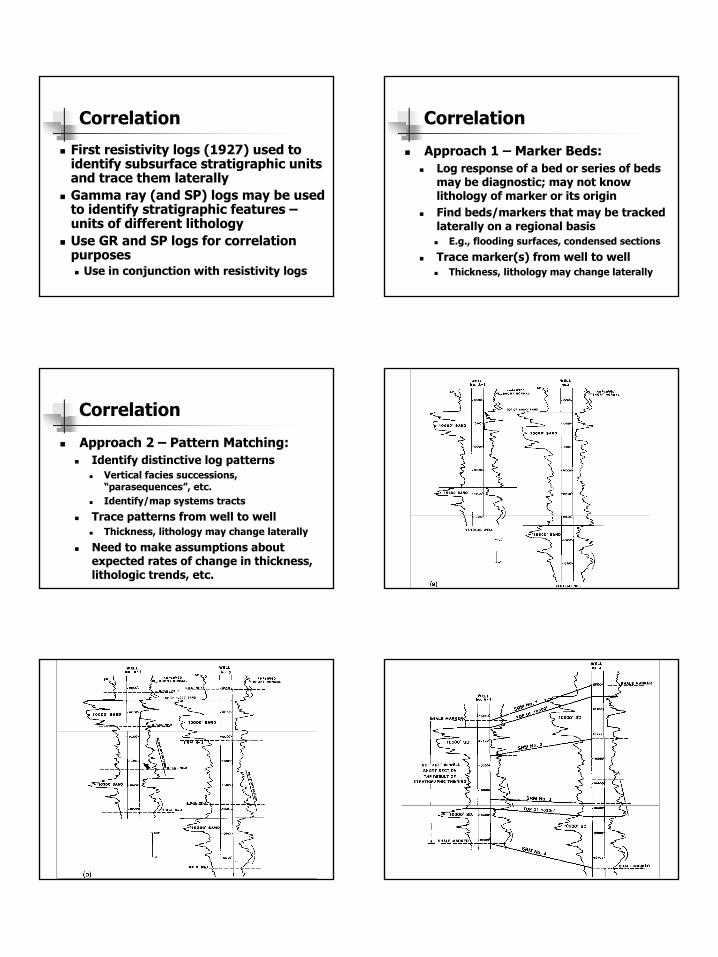
First resistivity logs (1927) used to identify subsurface stratigraphic units and trace them laterallyGamma ray (and SP) logs may be used to identify stratigraphic features –units of different lithologyUse GR and SP logs for correlation purposes
Use in conjunction with resistivity logs
Correlation
Approach 1 – Marker Beds:Log response of a bed or series of beds may be diagnostic; may not know lithology of marker or its originFind beds/markers that may be tracked laterally on a regional basis
E.g., flooding surfaces, condensed sections
Trace marker(s) from well to wellThickness, lithology may change laterally
Correlation
Approach 2 – Pattern Matching:Identify distinctive log patterns
Vertical facies successions, “parasequences”, etc.Identify/map systems tracts
Trace patterns from well to wellThickness, lithology may change laterally
Need to make assumptions about expected rates of change in thickness, lithologic trends, etc.
14
Correlation
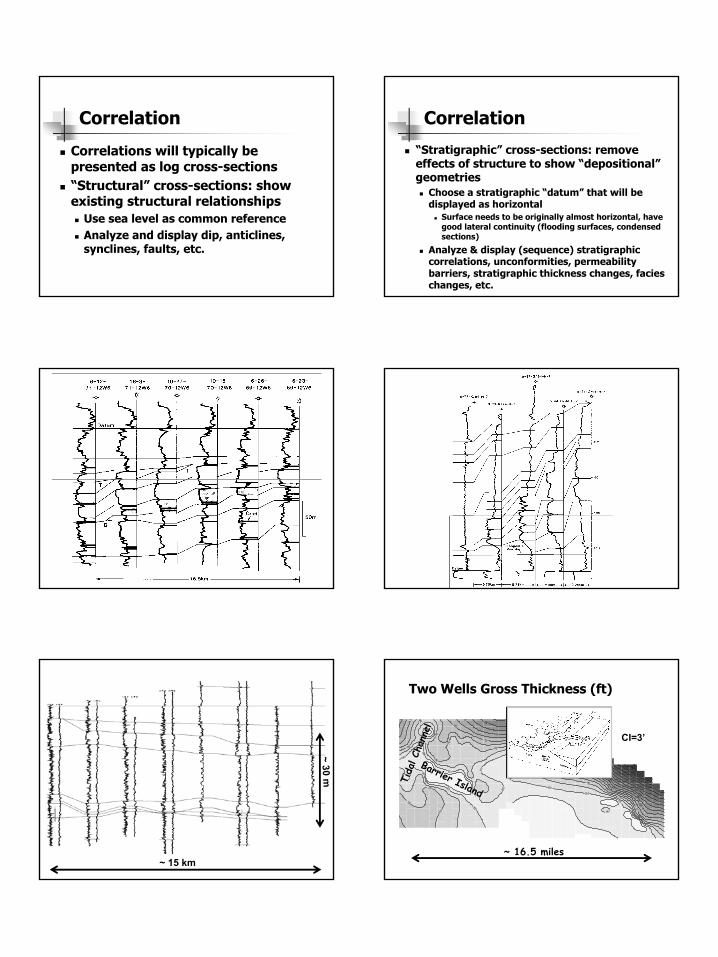
Correlations will typically be presented as log cross-sections“Structural” cross-sections: show existing structural relationships
Use sea level as common referenceAnalyze and display dip, anticlines, synclines, faults, etc.
Correlation
“Stratigraphic” cross-sections: remove effects of structure to show “depositional”geometries
Choose a stratigraphic “datum” that will be displayed as horizontal
Surface needs to be originally almost horizontal, have good lateral continuity (flooding surfaces, condensed sections)
Analyze & display (sequence) stratigraphic correlations, unconformities, permeability barriers, stratigraphic thickness changes, facies changes, etc.
~ 15 km
~ 30 m
~ 16.5 miles~ 16.5 miles
CI=3’
Two Wells Gross Thickness (ft)
Tida
l Cha
nnel
Tida
l Cha
nnel
Barrier Island
Barrier Island
15
Logs – Advantages
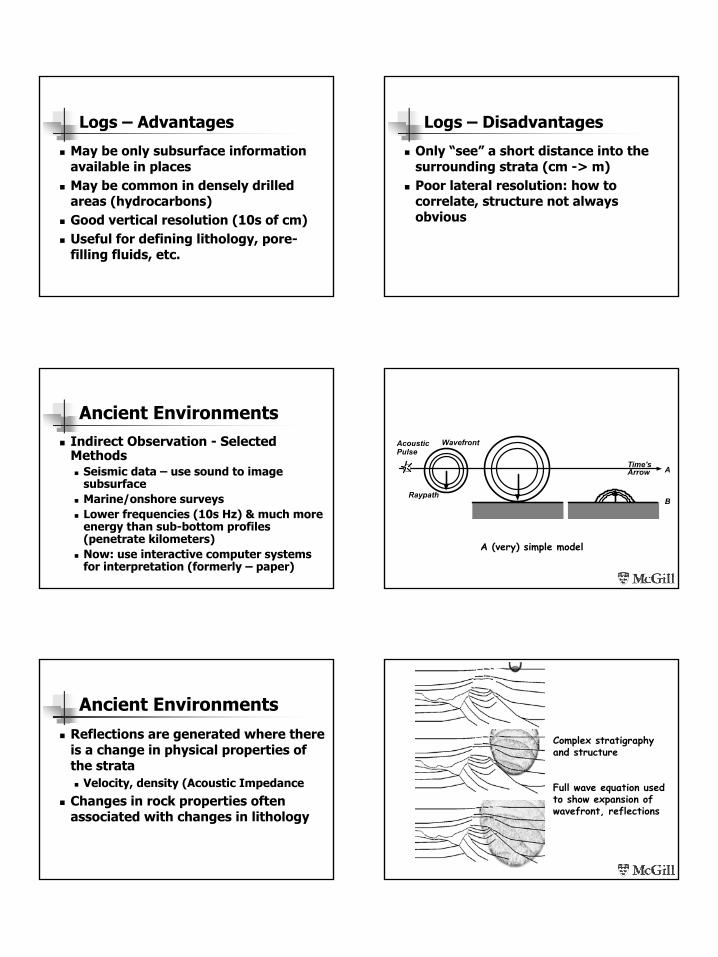
May be only subsurface information available in placesMay be common in densely drilled areas (hydrocarbons)Good vertical resolution (10s of cm)Useful for defining lithology, pore-filling fluids, etc.
Logs – Disadvantages
Only “see” a short distance into the surrounding strata (cm -> m)Poor lateral resolution: how to correlate, structure not always obvious
Ancient EnvironmentsIndirect Observation - Selected Methods
Seismic data – use sound to image subsurfaceMarine/onshore surveysLower frequencies (10s Hz) & much more energy than sub-bottom profiles (penetrate kilometers)Now: use interactive computer systems for interpretation (formerly – paper)
Wavefront
Raypath
A
B
Acoustic Pulse
Time's Arrow
A (very) simple model
Ancient EnvironmentsReflections are generated where there is a change in physical properties of the strata
Velocity, density (Acoustic Impedance
Changes in rock properties often associated with changes in lithology
Complex stratigraphy and structure
Full wave equation used to show expansion of wavefront, reflections
16
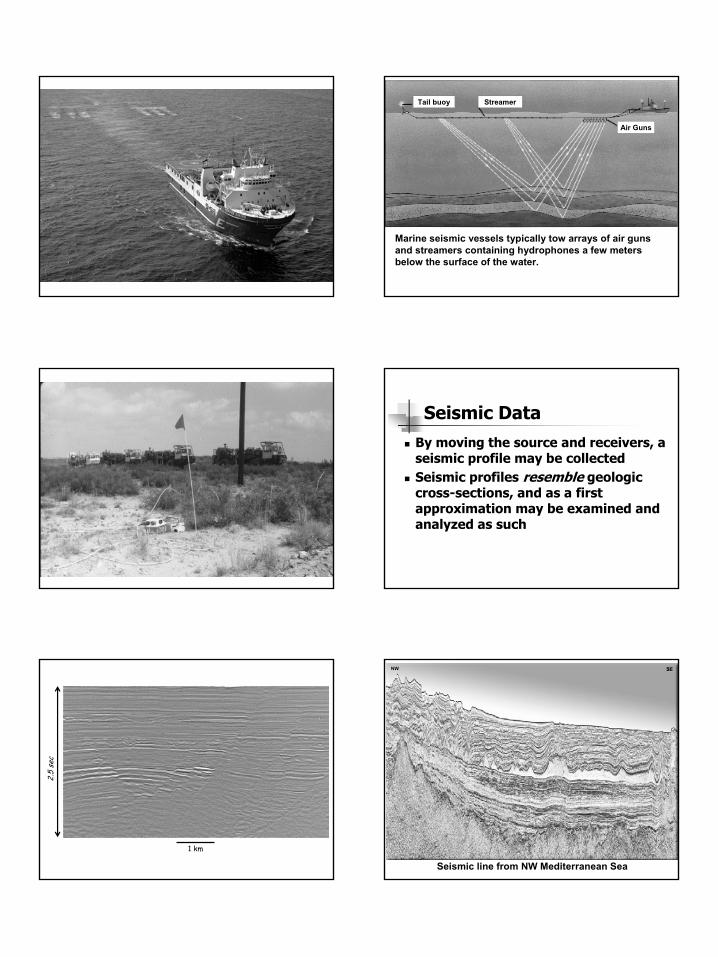
Air Guns
Streamer Tail buoy
Marine seismic vessels typically tow arrays of air guns and streamers containing hydrophones a few meters below the surface of the water.
Seismic DataBy moving the source and receivers, a seismic profile may be collectedSeismic profiles resemble geologic cross-sections, and as a first approximation may be examined and analyzed as such
2.5
sec
1 km
Seismic line from NW Mediterranean Sea
17
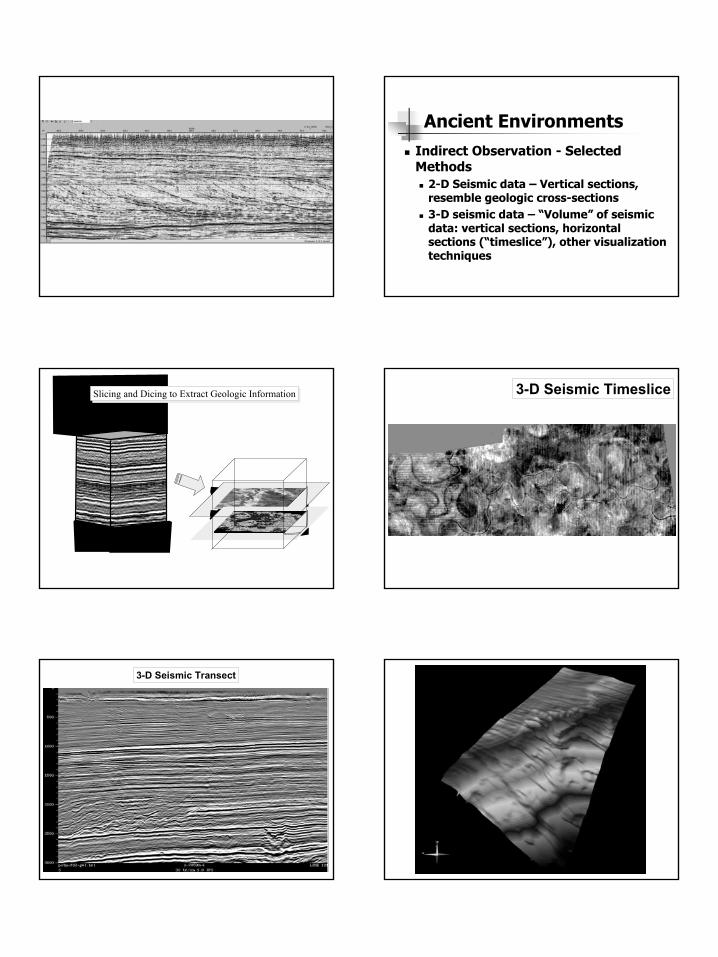
Ancient EnvironmentsIndirect Observation - Selected Methods
2-D Seismic data – Vertical sections, resemble geologic cross-sections3-D seismic data – “Volume” of seismic data: vertical sections, horizontal sections (“timeslice”), other visualization techniques
Seismic Cube
Slicing and Dicing to Extract Geologic Information 3-D Seismic Timeslice
3-D Seismic Transect
18
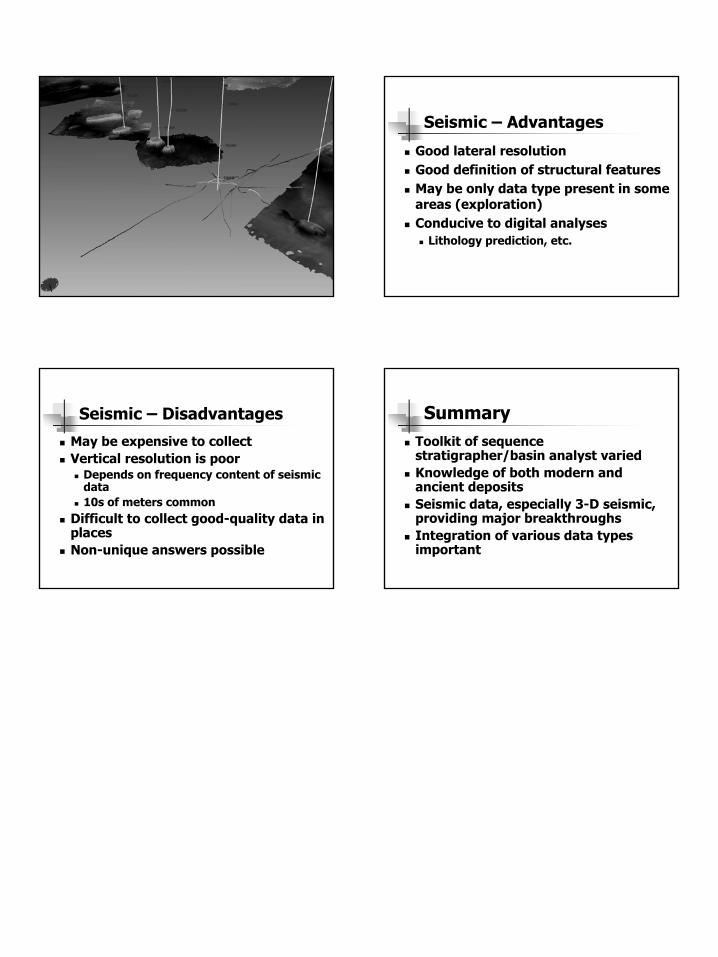
Seismic – Advantages
Good lateral resolutionGood definition of structural featuresMay be only data type present in some areas (exploration)Conducive to digital analyses
Lithology prediction, etc.
Seismic – Disadvantages
May be expensive to collectVertical resolution is poor
Depends on frequency content of seismic data10s of meters common
Difficult to collect good-quality data in placesNon-unique answers possible
SummaryToolkit of sequence stratigrapher/basin analyst variedKnowledge of both modern and ancient depositsSeismic data, especially 3-D seismic, providing major breakthroughsIntegration of various data types important