3’-utr polymorphisms of vitamin b-related genes are
TRANSCRIPT

genesG C A T
T A C G
G C A T
Article
3’-UTR Polymorphisms of Vitamin B-Related GenesAre Associated with Osteoporosis and OsteoporoticVertebral Compression Fractures (OVCFs) inPostmenopausal Women
Tae-Keun Ahn 1,† , Jung Oh Kim 2,† , Hui Jeong An 3, Han Sung Park 3, Un Yong Choi 4 ,Seil Sohn 4, Kyoung-Tae Kim 5,6 , Nam Keun Kim 3,* and In-Bo Han 4,*
1 Department of Orthopedics, CHA Bundang Medical Center, CHA University, Seongnam 13496, Korea;[email protected]
2 Theragen Bio Co., Ltd. 145, Gwanggyo-ro, Yeongtong-gu, Suwon 16229, Korea; [email protected] Department of Biomedical Science, College of Life Science, CHA University, Seongnam 13488, Korea;
[email protected] (H.J.A.); [email protected] (H.S.P.)4 Department of Neurosurgery, CHA Bundang Medical Center, CHA University, Seongnam 13496, Korea;
[email protected] (U.Y.C.); [email protected] (S.S.)5 Department of Neurosurgery, School of Medicine, Kyungpook National University, Daegu 41944, Korea;
[email protected] Department of Neurosurgery, Kyungpook National University Hospital, Daegu 41944, Korea* Correspondence: [email protected] (N.K.K.); [email protected] (I.-B.H.); Tel.: +82-31-881-7137 (N.K.K.);
+82-31-780-1924 (I.-B.H.)† The authors are contributed equally to this work.
Received: 2 April 2020; Accepted: 27 May 2020; Published: 2 June 2020�����������������
Abstract: As life expectancy increases, the prevalence of osteoporosis is increasing. In addition tovitamin D which is well established to have an association with osteoporosis, B vitamins, such asthiamine, folate (vitamin B9), and cobalamin (vitamin B12), could affect bone metabolism, bone quality,and fracture risk in humans by influencing homocysteine/folate metabolism. Despite the crucial role ofB vitamins in bone metabolism, there are few studies regarding associations between B vitamin-relatedgenes and osteoporosis. In this study, we investigated the genetic association of four single nucleotidepolymorphisms (SNPs) within the 3’-untranslated regions of vitamin B-related genes, includingTCN2 (encodes transcobalamin II), CD320 (encodes transcobalamin II receptor), SLC19A1 (encodesreduced folate carrier protein 1), and SLC19A2 (encodes thiamine carrier 1), with osteoporosis andosteoporotic vertebral compression fracture (OVCF). We recruited 301 postmenopausal womenand performed genotyping of CD320 rs9426 C>T, TCN2 rs10418 C>T, SLC19A1 rs1051296 G>T,and SLC19A2 rs16862199 C>T using a polymerization chain reaction-restriction fragment lengthpolymorphism assay. There was a significantly higher incidence of both osteoporosis (AOR 5.019;95% CI, 1.533–16.430, p < 0.05) and OVCF (AOR, 5.760; 95% CI, 1.480–22.417, p < 0.05) in individualswith genotype CD320 CT+TT and high homocysteine concentrations. Allele combination analysisrevealed that two combinations, namely CD320 C-TCN2 T-SLC19A1 T-SLC19A2 C (OR, 3.244; 95% CI,1.478–7.120, p < 0.05) and CD320 T-TCN2 C-SLC19A1 G-SLC19A2 C (OR, 2.287; 95% CI, 1.094–4.782,p < 0.05), were significantly more frequent among the osteoporosis group. Our findings suggest thatSNPs within the CD320 gene in 3´-UTR may contribute to osteoporosis and OVCF occurrences insome individuals. Furthermore, specific allele combinations of CD320, TCN2, SLC19A1, and SLC19A2may contribute to increased susceptibility to osteoporosis and OVCF.
Keywords: cobalamin; folate; homocysteine; polymorphism; osteoporosis; compression fracture
Genes 2020, 11, 612; doi:10.3390/genes11060612 www.mdpi.com/journal/genes

Genes 2020, 11, 612 2 of 18
1. Introduction
As the number of older people at risk for compromised bone health rapidly increases, identifyingnew risk factors for osteoporosis has become the center of attention. Researchers have reportedmany risk factors for osteoporosis and osteoporotic bone fractures, such as age, history of fragilityfractures, smoking habits, alcohol intake, steroid use, low bone mineral density (BMD) andhyperhomocysteinemia [1]. Accumulating evidence suggests that high homocysteine level maycause osteoporosis by over production of free radicals and oxidative stress, promotion of osteoclastactivity and bone resorption, and inhibition of bone formation. Vitamins are also closely related tobone health. Particularly, vitamins A, D, E and K have been proved to contribute to maintainingbone health [2]. In addition, the role of B-vitamins in bone health has been receiving increasingattention due to both individual action as vitamins and their action on influencing homocysteineconcentration [3–7]. Deficiencies in vitamin B6, B9 (folate), and B12 (cobalamin) have been knownto cause increased serum levels of homocysteine because these vitamins act as co-factors for variousenzymes involved in homocysteine metabolism [1,2]. Cobalamin has been known to increase osteoblastproliferation and cobalamin deficiency may increase osteoclast formation by elevation of homocysteineand mehtylmalnonic acid levels. Folate was also reported to aid maintenance of bone density byhelping to preserve optimal nitric oxide synthase activity in the bone cells [7]. Although the effectsof vitamin B1 (thiamine) on bone health remains unclear, previous studies show that thiamine mayinhibit receptor activator of nuclear factor κB ligand induced osteoclastogenesis, suggesting a potentiallink between thiamine deficiency and poor bone health [2].
In addition to these clinical factors, genetic variations within individuals have also beendemonstrated to affect the occurrence of osteoporosis and related fractures. Many genetic associationstudies have confirmed the relationship between reduced BMD, candidate gene polymorphisms,and an increased risk of fracture. Some of the associated polymorphisms reside in vitamin-relatedgenes; among these, polymorphisms within vitamin D-related genes, especially the gene encoding thevitamin D receptor, have been most widely investigated and are known to be associated with BMD invarious populations [8,9]. Despite the role of B vitamins in bone metabolism, there are few studiesexamining the relationship between polymorphisms of vitamin B-related genes and osteoporosis.Only several homocysteine/folate metabolism-related genes have been linked with osteoporosis todate. For example, a single nucleotide polymorphism (SNPs) in methylenetetrahydrofolate reductase(MTHFR 677 C>T) has been shown to be associated with BMD [10,11]. Recently, it was also reportedthat SNPs in the 3´ untranslated regions (UTRs) of MTHFR (2572 C>A) and thymidylate synthase(1100 C>T) are associated with the prevalence of osteoporosis and osteoporotic vertebral compressionfractures (OVCFs) [12].
Apart from vitamin D, B vitamins are also associated with bone metabolism. Data have suggestedthat B vitamins, such as folate (vitamin B9) and cobalamin (vitamin B12), affect bone metabolism,bone quality, and fracture risk in humans by contributing to homocysteine/folate metabolism [3–6].High level of homocysteine may impair collagen cross-link within bone, thereby resulting in decreasedbone mineral density and increased susceptibility to fracture [13,14]. The folate and cobalamin areimportant cofactors and should be transported readily to cells. CD320 and TCN2 genes are associatedwith cobalamin transport. SLC19A1 encodes protein that transport folate. Polymorphisms of thosegenes may affect the homocysteine metabolism. Despite the role of B vitamins in bone metabolism,there are few studies examining the relationship between vitamin B-related genes and osteoporosis.Only several homocysteine/folate metabolism-related genes have been linked with osteoporosis todate. For example, a single nucleotide polymorphism (SNP) in methylenetetrahydrofolate reductase(MTHFR 677C>T) has been shown to be associated with BMD [10,11]. Recently, it was also reportedthat SNPs in the 3’ untranslated regions (UTRs) of MTHFR (2572C>A) and thymidylate synthase(1100C>T) are associated with the prevalence of osteoporosis and osteoporotic vertebral compressionfracture (OVCF) [12].

Genes 2020, 11, 612 3 of 18
B-vitamins should be transported readily to cells to maintain intracellular concentrations. Thiaminecan be transported into mammalian cells by thiamine transporter 1, also known as thiamine carrier1 (TC1) or soluble carrier family 19 member 2 (SLC19A2), which is encoded by the SLC19A2 gene.Cobalamin is absorbed in the distal ileum by binding to gastric intrinsic factor. The absorbed cobalaminthen binds to transcobalamin II (TC II, encoded by TCN2 gene) within the enterocyte, and thecobalamin-TC II complex is released into the blood stream. The complex is transported to all tissueswhere it can be internalized into cells by binding to the TC II receptor (encoded by CD320) [15]. Transportof folate into mammalian cells can occur via folate receptor 1 (RFC1) which in humans is encoded bythe SLC19A1 gene. Therefore, we chose four well-known SNPs of B vitamins-related genes, includingTCN2 (encodes TC II), CD320 (encodes TC II receptor), SLC19A1 (encodes reduced folate carrier gene(RFC1)), and SLC19A2 (encodes thiamine carrier 1) because polymorphisms of B vitamins-related genescould reduce the availability of B vitamins contributing to the risk of osteoporosis and OVCFs [16,17].Studies on the relationship between B vitamins and gene polymorphisms are currently insufficient.To the best of our knowledge, there have been no published studies on the association betweenpolymorphisms in vitamin B-related microRNA (miRNA) binding sites (3´-UTR) and osteoporosis andOVCFs. Therefore, in the current study, a database search with MicroSNiPer was used to identify fourSNPs in miRNA binding sites within the 3´-UTRs of vitamin B-related genes: CD320 rs9426 C>T, TCN2rs10418 C>T, SLC19A1 rs1051296 G>T, and SLC19A2 rs16862199 C>T. The minor allele frequency foreach of the four SNPs was >5% in the Asian population. We then investigated the associations of thesefour SNPs with osteoporosis and OVCFs in Korean postmenopausal women.
2. Materials and Methods
2.1. Study Design
We performed a case-control study to examine the relationship between four SNPs in vitaminB-related genes, namely CD320 rs9426 C>T, TCN2 rs10418 C>T, SLC19A1 rs1051296 G>T, and SLC19A2rs16862199 C>T, and osteoporosis and OVCF risk. The research was conducted in accordance with theprinciples described in the Declaration of Helsinki. The institutional Review Board of CHA BundangMedical Center approved this study (IRB number: BD2015-043), and all participants provided writteninformed consent.
2.2. Study Population
The study group comprised 301 postmenopausal Korean women from the South Korean provinceof Gyeonggi-do. Postmenopausal women were recruited from the neurosurgery and orthopedicsurgery departments at the CHA Bundang Medical Center. Korean postmenopausal women ≥50 yearsof age were eligible for inclusion in the study. The diagnosis of osteoporosis was based on Dual-energyX-ray absorptiometry (DEXA, Norland Medical Systems, White Plains, NY, USA) of the lumbar spineand hips. Diagnosis of osteoporosis was based on a BMD threshold of 2.5 standard deviations belowthat of a young adult (T-score, <−2.5 or lower) according to the standard World Health Organizationcriteria. An OVCF was diagnosed when a progressive or newly generated compression fracture wasidentified after low-energy trauma. An OVCF was defined as a height reduction of the vertebrae >15%in any anterior, central, or posterior portion of the vertebrae in plain radiographs [18]. The presenceof an OVCF was first determined by a trained neurosurgeon or an orthopedic surgeon and was thenconfirmed by a radiologist. Computed tomography (CT) or magnetic resonance imaging (MRI) wasconducted for subjects with suspicious findings in the plain radiographs or bone scans.
All subjects with osteoporosis met the following criteria: 1) absence of metabolic diseases, suchas diffuse idiopathic skeletal hyperostosis, pituitary gland disorders, hyperthyroidism, rheumatoidarthritis, or hyperparathyroidism; 2) no use of drugs that affect bone metabolism or blood clotting,including oral anticoagulants, oral contraceptives, hormone replacement therapy, corticosteroids,calcium, vitamin D, or vitamin B; 3) absence of seronegative spondyloarthropathy; 4) no history of
Genes 2020, 11, 612 4 of 18
stroke or ischemic heart disease; 5) no prior cancer diagnosis; and 6) Korean descent. All subjects wereexamined using conventional X-radiography, DEXA, and MRI to evaluate the configuration and acuityof the fracture. Whole-body bone scanning was used in cases where MRI was contraindicated.
Control subjects were recruited from individuals who visited the CHA Bundang Medical Centerfor routine health examinations. Subjects with lumbar spine and hip BMD T-scores >−1.0 and nospine or hip fractures were enrolled. The exclusion criteria were identical to those used for theosteoporosis group. Demographic features and comorbidities, such as hypertension, diabetes mellitus,and other cerebro- and cardiovascular diseases, were investigated in all osteoporosis and controlsubjects. Hypertension was defined as systolic blood pressure (SBP) >140 mmHg or diastolic bloodpressure (DBP) >90 mmHg, including subjects undergoing antihypertensive treatment. Diabetesmellitus (DM) was defined as a fasting plasma glucose level >126 mg/dL, including subjects who werealready diagnosed as diabetic.
2.3. Blood Sample
Plasma levels of glucose (reference range, <100 mg/dL), homocysteine (reference range <12µmol/L),folate (reference range, 3.45–13.77 ng/mL), high-density lipoprotein (HDL; reference range, >40 mg/dL),low-density lipoprotein (LDL; reference range, <130 mg/dL), triglycerides (TG; reference range,<200 mg/dL), and vitamin B12 (reference range, 211–911 pg/mL) were measured in fasting bloodsamples from each subject. Homocysteine was measured by fluorescent polarization immunoassayusing an Abbott IMx system (Abbott Laboratories, Abbott Park, IL, USA), folate was measured bycompetitive immunoassay using ACS:180 (Bayer, Tarrytown, NY, USA), and vitamin B12 was measuredusing the Bio-Rad Quantaphase II radioassay (Hercules, CA, USA). All assays were conducted accordingto manufacturer’s instructions. HDL, LDL, and TG concentrations were assessed using standardhospital protocols.
2.4. Genetic Analyses
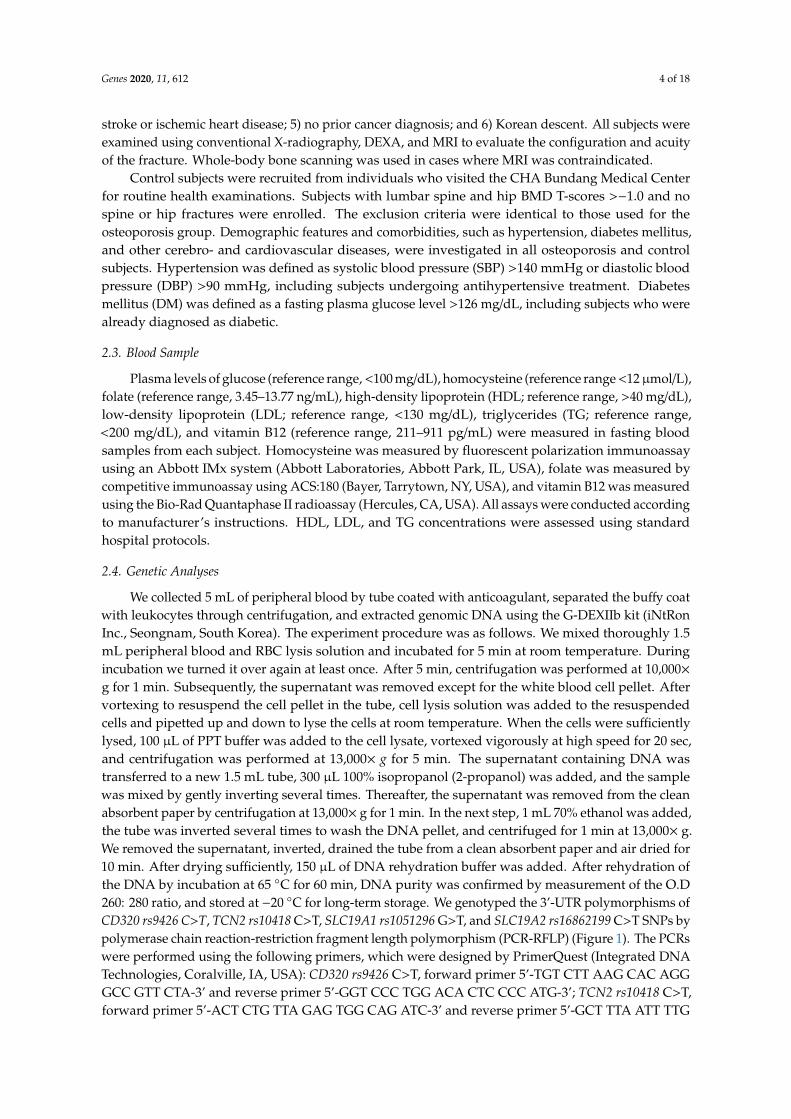
We collected 5 mL of peripheral blood by tube coated with anticoagulant, separated the buffy coatwith leukocytes through centrifugation, and extracted genomic DNA using the G-DEXIIb kit (iNtRonInc., Seongnam, South Korea). The experiment procedure was as follows. We mixed thoroughly 1.5mL peripheral blood and RBC lysis solution and incubated for 5 min at room temperature. Duringincubation we turned it over again at least once. After 5 min, centrifugation was performed at 10,000×g for 1 min. Subsequently, the supernatant was removed except for the white blood cell pellet. Aftervortexing to resuspend the cell pellet in the tube, cell lysis solution was added to the resuspendedcells and pipetted up and down to lyse the cells at room temperature. When the cells were sufficientlylysed, 100 µL of PPT buffer was added to the cell lysate, vortexed vigorously at high speed for 20 sec,and centrifugation was performed at 13,000× g for 5 min. The supernatant containing DNA wastransferred to a new 1.5 mL tube, 300 µL 100% isopropanol (2-propanol) was added, and the samplewas mixed by gently inverting several times. Thereafter, the supernatant was removed from the cleanabsorbent paper by centrifugation at 13,000× g for 1 min. In the next step, 1 mL 70% ethanol was added,the tube was inverted several times to wash the DNA pellet, and centrifuged for 1 min at 13,000× g.We removed the supernatant, inverted, drained the tube from a clean absorbent paper and air dried for10 min. After drying sufficiently, 150 µL of DNA rehydration buffer was added. After rehydration ofthe DNA by incubation at 65 ◦C for 60 min, DNA purity was confirmed by measurement of the O.D260: 280 ratio, and stored at −20 ◦C for long-term storage. We genotyped the 3’-UTR polymorphisms ofCD320 rs9426 C>T, TCN2 rs10418 C>T, SLC19A1 rs1051296 G>T, and SLC19A2 rs16862199 C>T SNPs bypolymerase chain reaction-restriction fragment length polymorphism (PCR-RFLP) (Figure 1). The PCRswere performed using the following primers, which were designed by PrimerQuest (Integrated DNATechnologies, Coralville, IA, USA): CD320 rs9426 C>T, forward primer 5’-TGT CTT AAG CAC AGGGCC GTT CTA-3’ and reverse primer 5’-GGT CCC TGG ACA CTC CCC ATG-3’; TCN2 rs10418 C>T,forward primer 5’-ACT CTG TTA GAG TGG CAG ATC-3’ and reverse primer 5’-GCT TTA ATT TTG

Genes 2020, 11, 612 5 of 18
TCA GAG GCA GG-3’; SLC19A1 rs1051296 G>T, forward primer 5’-GCT TCT CTG TCT CTG TGGAAA-3’ and reverse primer 5’-AAG CCT GGC ACA TAC CAA-3’; and SLC19A2 rs16862199 C>T,forward primer 5’-GCA GGA ATC ACA TCT ATC CTA GTT CC-3’ and reverse primer 5’-GCT TAAGGT ACG CTT GCT TGT C-3’. The underlined bases indicate mismatches with the complementarysequence. For RFLP analysis of the SNPs, the PCR products for CD320, TCN2, SLC19A1, and SLC19A2were digested with the restriction enzymes StyI, BglII, BanI, and Hpy188I, respectively. To confirm thefour SNPs and validate the RFLP results, 10%–20% of the samples were randomly selected, used for asecond round of PCR, and analyzed by DNA sequencing using an automatic ABI3730xL DNA analyzer(Applied Biosystems, Forster City, CA, USA). The concordance of the quality control sample was 100%.Genes 2020, 11, x FOR PEER REVIEW 7 of 18
Figure 1. Restriction fragment length polymorphism (RFLP) variations according to genotypes. (A) CD320 rs9426 C>T (B) TCN2 rs10418 C>T (C) SLC19A1 rs1051296 G>T (D) SLC19A2 rs16862199 C>T.
Figure 2. Genotype frequencies of single nucleotide polymorphisms. (A) CD320 rs9426 C>T (B) TCN2 rs10418 C>T (C) SLC19A1 rs1051296 G>T (D) SLC19A2 rs16862199 C>T.
Figure 1. Restriction fragment length polymorphism (RFLP) variations according to genotypes.(A) CD320 rs9426 C>T (B) TCN2 rs10418 C>T (C) SLC19A1 rs1051296 G>T (D) SLC19A2 rs16862199C>T.
2.5. Statistical Analyses
Differences between groups were assessed using the chi-squared test and Student’s t-test forcategorical variables and continuous variables, respectively. Multivariate logistic regression and Fisher’sexact test were used to compare the genotype and allele combination frequencies, respectively, betweencases (osteoporosis group, including non-OVCF and OVCF subjects) and controls. Allele frequencieswere evaluated for deviation from Hardy-Weinberg equilibrium using a threshold of p = 0.05. To estimatethe relative risk for osteoporosis with respect to subject genotype in the non-OVCF and OVCF groups,the odds ratio (OR) and 95% confidence interval (CI) were calculated. Analysis of variance (ANOVA)was used to analyze the association of the genotypes with BMD, body mass index (BMI), DBP, SBP,and levels of glucose, homocysteine, folate, HDL, LDL, TG, and vitamin B12. A p-value ≤ 0.05 wasconsidered to indicate statistical significance. ORs were adjusted (AOR) for possible confounders,such as age, sex, DM, hypertension, and serum folate and vitamin B12 levels. Statistical analyseswere performed using GraphPad Prism 4.0 software (GraphPad Software, Inc., San Diego, CA, USA),MedCalc v.18.11.3 software (MedCalc Software, Mariakerke, Belgium), and HAPSTAT 3.0 (Universityof North Carolina, Chapel Hill, NC). We constructed all possible allele combinations for the four SNPsand analyzed gene-gene interactions using the multifactor dimensionality reduction (MDR) method(MDR software package v.2.0, www.epistasis.org) [19].

Genes 2020, 11, 612 6 of 18
3. Results
3.1. Patient Characteristics
The mean ages in the control group (n = 158) and osteoporosis group (n = 143) were 69.36 ± 6.26years and 69.38 ± 7.25 years, respectively. Of the 143 subjects with osteoporosis (osteoporosis group),74 patients were diagnosed with OVCF (OCVF group). When comparing the control group with theosteoporosis group, we found that patients with osteoporosis were significantly more likely to havehigher blood glucose levels, lower BMI, and decreased LDL and vitamin B12 levels. Patients in theOVCF group had significantly higher blood glucose levels, lower folate levels, and lower BMIs thansubjects in the control group [9] (Table 1).
3.2. Genotype Frequencies of CD320, TCN2, SLC19A1, and SLC19A2 SNPs
The genotype and allele frequencies of the CD320 rs9426 C>T, TCN2 rs10418 C>T, SLC19A1rs1051296 G>T, and SLC19A2 rs16862199 C>T SNPs were compared between control subjects andosteoporosis patients with or without OVCF. There were no statistically significant differences ingenotype or allele frequencies between the control and osteoporosis groups for any of the four SNPs(Figure 2; Table 2).
Genes 2020, 11, x FOR PEER REVIEW 7 of 18
Figure 1. Restriction fragment length polymorphism (RFLP) variations according to genotypes. (A) CD320 rs9426 C>T (B) TCN2 rs10418 C>T (C) SLC19A1 rs1051296 G>T (D) SLC19A2 rs16862199 C>T.
Figure 2. Genotype frequencies of single nucleotide polymorphisms. (A) CD320 rs9426 C>T (B) TCN2 rs10418 C>T (C) SLC19A1 rs1051296 G>T (D) SLC19A2 rs16862199 C>T.
Figure 2. Genotype frequencies of single nucleotide polymorphisms. (A) CD320 rs9426 C>T (B) TCN2rs10418 C>T (C) SLC19A1 rs1051296 G>T (D) SLC19A2 rs16862199 C>T.
3.3. Allele Combination Analysis Using the MDR Method
We then used the MDR method to compare allele combination frequencies for the four SNPsbetween the control and osteoporosis groups (Table 3). The allele combinations listed below arepresented according to the following gene order: CD320, TCN2, SLC19A1, and SLC19A2. The allelecombination analysis revealed significant differences between the groups. Specifically, two allelecombinations differed significantly between the control and osteoporosis (non-OVCF and OVCF)groups: C-T-T-C (OR 3.244; 95% CI 1.478–7.120, p < 0.05) and T-C-G-C (OR 2.287; 95% CI 1.094–4.782,p < 0.05). Five allele combinations demonstrated significant differences between the control and OVCFgroups: C-C-G-T (OR 1.280; 95% CI 1.280–7.386, p < 0.05), C-C-T-C (OR 1.028; 95% CI 1.028–2.788,

Genes 2020, 11, 612 7 of 18
p < 0.05), C-C-T-T (OR 1.522; CI 1.522–15.900, p < 0.05), C-T-T-C (OR 1.482; 95% CI 1.482–9.187, p < 0.05),and T-C-G-C (OR 1.556; 95% CI 1.556–8.089, p < 0.05). Three allele combinations showed significantdifferences between the control and non-OVCF groups: C-T-G-C (OR 0.075; CI 0.075–0.887, p < 0.05),C-T-G-T (OR 1.098; CI 1.098–393.000, p < 0.05), and C-T-T-C (OR 1.133; 95% CI 1.133–6.844, p < 0.05).Among these combinations, combination C-T-G-T in the osteoporosis group demonstrated the highestOR (OR, 14.850; 95% CI, 0.810–272.100, p < 0.05).
3.4. Stratified and Interactions Analyses between CD320, TCN2, SLC19A1, and SLC19A2 SNPs andClinical Parameters
To determine whether the four SNPs were associated with osteoporosis and OVCF prevalence inspecific subsets of patients, we conducted a stratified analysis of the data according to age, hypertension,DM, and serum levels of folate, vitamin B12, and homocysteine. To enable interaction analyses forserum levels, we established cut-off values for folate, vitamin B12, and homocysteine, using cut-offsat the bottom 15% for folate (4.59 nmol/L) and B12 (395 pg/mL), and a cut-off at the top 15% forhomocysteine (12.68 µmol/L).
The incidence of osteoporosis was significantly higher for genotype CD320 rs9426 CT+TT thangenotype CC both in patients ≥69 years of age (AOR 2.399, CI 1.101–5.226) and in patients with highhomocysteine concentrations (homocysteine > 12.68 µmol/L) (AOR 5.019, CI 1.533–16.430, p < 0.05;Figure 3A). The incidence of osteoporosis was also significantly higher for genotype TCN2 CT+TTthan genotype CC in subsets of patients without hypertension, with diabetes, with low folate levels,or with low homocysteine concentrations (Table 4). To evaluate the effect of the dominant genotypein the stratified conditions of each parameter, each SNP was also analyzed using a dominant model.There were no significant differences between dominant and recessive SNPs (Supplementary Table S1).
Next, the incidence of OVCF was analyzed with respect to each SNP. The results showed thatOVCF incidence was increased for genotype CD320 rs9426 CT+TT compared to genotype CC both inpatients with low folate levels (AOR 7.307, CI 1.975–27.033) and in patients with high homocysteineconcentrations (homocysteine > 12.68 µmol/L) (AOR 5.760, CI 1.480–22.417, p < 0.05; Figure 3B).The genotype SLC19A1 rs1051296 GT+TT was also associated with a higher incidence of OVCF thangenotype GG in patients with low folate levels (AOR 3.589, CI 1.440–8.950; Table 5). In the stratifiedconditions of each parameter, the dominant model did not demonstrate significant differences, althoughgenotype CD320 rs9426 CT+TT exhibited an increased frequency of OVCF in patients with low folatelevels (AOR 2.040, CI 0.500–8.322) or high homocysteine concentrations (AOR 3.500, CI 0.795–15.400;Supplementary Table S2).

Genes 2020, 11, 612 8 of 18Genes 2020, 11, x FOR PEER REVIEW 8 of 18
Figure 3. (A) Osteoporosis risk stratified by interaction between CD320 rs9426 C>T and homocysteine levels (B) OVCF risk stratified by interaction between CD320 rs9426 C>T and homocysteine levels. Hcy, homocysteine; OVCF, osteoporotic vertebral compression fracture ; * p < 0.05.
Figure 3. (A) Osteoporosis risk stratified by interaction between CD320 rs9426 C>T and homocysteinelevels (B) OVCF risk stratified by interaction between CD320 rs9426 C>T and homocysteine levels. Hcy,homocysteine; OVCF, osteoporotic vertebral compression fracture; * p < 0.05.

Genes 2020, 11, 612 9 of 18
Table 1. Baseline characteristics of control and osteoporosis groups.
Characteristic Control (n = 158) Osteoporosis (n = 143) p * Non-OVCF (n = 69) p ** OVCF (n = 74) p ***
Age (years, mean ± SD) 69.36 ± 6.26 69.38 ± 7.25 0.983 70.83 ± 6.53 0.207 70.23 ± 9.44 0.282Hypertension (n) 79 (50.0%) 52 (36.4%) 0.134 20 (29.0%) <0.0001 32 (43.2%) 0.0007
SBP (mmHg, mean ± SD) 135.92 ± 18.65 127.32 ± 14.44 <0.0001 126.54 ± 13.76 0.0002 128.13 ± 15.16 0.003DBP (mmHg, mean ± SD) 80.73 ± 11.52 75.48 ± 10.33 0.0001 74.42 ± 10.24 0.0001 76.57 ± 10.38 0.012
Diabetes mellitus (n) 22 (13.9%) 26 (18.2%) 0.392 17 (24.6%) 0.645 9 (12.2%) 0.05FBS (mg/dL, mean ± SD) 111.78 ± 28.12 123.56 ± 43.20 0.006 114.70 ± 26.41 0.466 132.56 ± 54.01 0.0002
Homocysteine (µmol/L, mean ± SD) 9.74 ± 3.04 9.83 ± 4.09 0.83 9.54 ± 4.35 0.69 10.11 ± 3.84 0.441Folate (ng/mL, mean ± SD) 9.51 ± 6.48 8.28 ± 4.87 0.074 10.27 ± 4.95 0.408 6.57 ± 4.11 0.0005BMI (kg/m2, mean ± SD) 24.52 ± 3.11 23.48 ± 3.81 0.045 23.88 ± 2.77 0.173 21.37 ± 6.98 0.005
HDL (mg/dL, mean ± SD) 47.67 ± 12.13 44.78 ± 14.24 0.223 44.42 ± 12.27 0.18 45.16 ± 16.19 0.385LDL (mg/dL, mean ± SD) 130.30 ± 44.64 107.31 ± 39.55 0.002 95.18 ± 32.38 <0.0001 120.64 ± 42.64 0.281TG (mg/dL, mean ± SD) 152.85 ± 87.54 146.81 ± 81.90 0.567 133.89 ± 87.61 0.169 159.05 ± 74.81 0.633
Vitamin B12 (pg/mL, mean ± SD) 824.92 ± 919.42 593.13 ± 353.52 0.033 552.61 ± 292.27 0.023 750.13 ± 510.97 0.75BMD (g/cm2, mean ± SD) - −3.04 ± 0.94 - −3.13 ± 0.62 - −2.93 ± 1.21 -
SD, standard deviation; OVCF, osteoporotic vertebral compression fracture; SBP, systolic blood pressure; DBP, diastolic blood pressure; FBS, fasting blood sugar; BMI, body mass index;HDL, high density lipoprotein; LDL, low density lipoprotein; TG, triglyceride; BMD, bone mineral density. p *—Osteoporosis versus Controls, p **—Non OVCF vs Controls, and p***—OVCF vs Controls.

Genes 2020, 11, 612 10 of 18
Table 2. Genotype frequencies for the 3’-UTR polymorphisms of CD320, TCN2, SLC19A1 and SLC19A2 genes in control and OVCF groups.
Genotype †Control (n =158), n (%)
Osteoporosis(n = 143), n (%) AORa (95% CI) p * Non–OVCF
(n = 69) AOR (95% CI) p ** OVCF(n = 74) AOR (95% CI) p ***
CD320C>T (rs9426)CC 120 (75.9) 103 (72.0) 1.000 (reference) 50 (72.5) 1.000 (reference) 53 (71.6) 1.000 (reference)CT 37 (23.4) 40 (28.0) 1.256 (0.738–2.138) 0.401 19 (27.5) 1.246 (0.638–2.434) 0.520 21 (28.4) 1.408 (0.731–2.712) 0.307TT 1 (0.6) 0 (0.0) N/A 0.998 0 (0.0) N/A 0.998 0 (0.0) N/A 0.998
Dominant (CC vs CT+TT) 1.222 (0.720–2.074) 0.459 1.210 (0.621–2.359) 0.576 1.369 (0.712–2.630) 0.347Recessive (CC+CT vs TT) N/A 0.998 N/A 0.998 N/A 0.998
HWE–P 0.264 0.052TCN2C>T (rs10418)
CC 115 (73.2) 104 (72.7) 1.000 (reference) 48 (69.6) 1.000 (reference) 56 (75.7) 1.000 (reference)CT 40 (25.5) 36 (25.2) 1.015 (0.593–1.736) 0.957 20 (29.0) 1.342 (0.690–2.610) 0.387 16 (21.6) 0.750 (0.372–1.513) 0.422TT 2 (1.3) 3 (2.1) 0.853 (0.182–3.993) 0.840 1 (1.4) 0.665 (0.067–6.645) 0.729 2 (2.7) 1.215 (0.211–7.000) 0.828
Dominant (CC vs CT+TT) 1.007 (0.599–1.695) 0.978 1.279 (0.668–2.447) 0.458 0.800 (0.410–1.561) 0.514Recessive (CC+CT vs TT) 0.884 (0.192–4.077) 0.874 0.611 (0.062–5.998) 0.673 1.372 (0.240–7.841) 0.722
HWE–P 0.473 0.955SLC19A1G>T (rs1051296)
GG 46 (29.1) 36 (25.2) 1.000 (reference) 17 (24.6) 1.000 (reference) 19 (25.7) 1.000 (reference)GT 89 (56.3) 79 (55.2) 1.059 (0.611–1.835) 0.839 44 (63.8) 1.241 (0.623–2.474) 0.539 35 (47.3) 0.868 (0.436–1.727) 0.686TT 23 (14.6) 28 (19.6) 1.388 (0.653–2.949) 0.394 8 (11.6) 0.853 (0.303–2.401) 0.763 20 (27.0) 1.659 (0.686–4.009) 0.261
Dominant (GG vs GT+TT) 1.098 (0.649–1.858) 0.727 1.138 (0.582–2.227) 0.705 0.990 (0.516–1.898) 0.975Recessive (GG+GT vs TT) 1.253 (0.658–2.387) 0.493 0.713 (0.290–1.751) 0.460 1.670 (0.796–3.505) 0.175
HWE–P 0.058 0.195SLC19A2C>T (rs16862199)
CC 123 (78.8) 106 (74.1) 1.000 (reference) 52 (75.4) 1.000 (reference) 54 (73.0) 1.000 (reference)CT 30 (19.2) 35 (24.5) 1.395 (0.794–2.451) 0.248 16 (23.2) 1.124 (0.545–2.317) 0.752 19 (25.7) 1.678 (0.842–3.344) 0.142TT 3 (1.9) 2 (1.4) 0.823 (0.133–5.093) 0.834 1 (1.4) 0.930 (0.090–9.660) 0.952 1 (1.4) 0.831 (0.082–8.417) 0.875
Dominant (CC vs CT+TT) 1.345 (0.778–2.326) 0.288 1.118 (0.554–2.255) 0.756 1.607 (0.822–3.142) 0.166Recessive (CC+CT vs TT) 0.758 (0.124–4.646) 0.764 0.915 (0.089–9.423) 0.941 0.782 (0.079–7.737) 0.833
HWE–P 0.602 0.640
† Odds ratio adjusted by age, gender, hypertension, diabetes mellitus, BMI, glucose and folate p *—Osteoporosis versus Controls, p **—Non OVCF vs Controls, and p ***—OVCF vsControls. AOR, adjusted odds ratio; CI, confidence interval; OVCF, osteoporotic vertebral compression fracture, HWE-P, Hardy-Weinberg equilibrium p-value; N/A, not applicable.

Genes 2020, 11, 612 11 of 18
Table 3. Allele combination analysis for four vitamin B-related genes (CD320, TCN2, SLC19A1, and SLC19A2) using the multifactor dimensionality reduction methodto compare genotype frequencies between OVCF and control groups.
Allele Combination Control†(2 n = 316)
Osteoporosis†(2 n = 286)
OR (95% CI) p * Non–OVCF†(2 n = 148)
OR (95% CI) p ** OVCF†(2 n = 138)
OR (95% CI) p ***
CD320 rs9246C>T / TCN2 rs10418C>T / RFC rs1051296G>T / SLC19A2 rs16862199C>TC-C-G-C 0.390 0.317 1.000 (reference) 0.386 1.000 (reference) 0.269 1.000 (reference)C-C-G-T 0.039 0.062 2.027 (0.930–4.420) 0.080 0.039 0.324 (0.324–2.882) 1.000 0.079 1.280 (1.280–7.386) 0.014C-C-T-C 0.282 0.308 1.336 (0.896–1.995) 0.185 0.266 0.585 (0.585–1.592) 0.899 0.329 1.028 (1.028–2.788) 0.043C-C-T-T 0.016 0.038 2.974 (0.998–8.858) 0.065 0.024 0.321 (0.321–6.041) 0.701 0.055 1.522 (1.522–15.900) 0.008C-T-G-C 0.087 0.032 0.451 (0.202–1.005) 0.065 0.023 0.075 (0.075–0.887) 0.025 0.042 0.263 (0.263–1.774) 0.506C-T-G-T 0.000 0.017 14.850 (0.810–272.100) 0.015 0.028 1.098 (1.098–393.000) 0.009 0.001 N/AC-T-T-C 0.033 0.083 3.244 (1.478–7.120) 0.003 0.088 1.133 (1.133–6.844) 0.030 0.083 1.482 (1.482–9.187) 0.005C-T-T-T 0.031 0.002 0.135 (0.017–1.075) 0.030 0.009 0.029 (0.029–1.860) 0.182 0.000 0.008 (0.008–2.535) 0.119T-C-G-C 0.042 0.078 2.287 (1.094–4.782) 0.029 0.048 0.472 (0.472–3.309) 0.619 0.102 1.556 (1.556–8.089) 0.003T-C-G-T 0.006 0.013 2.703 (0.484–15.090) 0.407 0.030 0.824 (0.824–26.130) 0.078 0.000 0.029 (0.029–12.980) 1.000T-C-T-C 0.040 0.036 1.040 (0.437–2.477) 1.000 0.048 0.472 (0.472–3.309) 0.619 0.030 0.292 (0.292–3.068) 1.000T-C-T-T 0.026 0.000 0.079 (0.005–1.394) 0.022 0.000 0.008 (0.008–2.397) 0.107 0.000 0.010 (0.010–3.179) 0.200T-T-G-C 0.006 0.009 2.027 (0.332–12.390) 0.654 0.011 0.318 (0.318–16.920) 0.587 0.000 0.029 (0.029–12.980) 1.000T-T-T-C 0.002 0.000 0.450 (0.018–11.180) 1.000 0.001 N/A 0.003 0.041 (0.041–25.470) 1.000T-T-T-T 0.000 0.004 4.049 (0.163–100.600) 0.428 0.000 0.031 (0.031–19.210) 1.000 0.007 0.365 (0.365–229.200) 0.250
† The allele combination models were indicated by frequency. p-value calculated by Fisher’s exact test. p *—Osteoporosis versus Controls, p **—Non OVCF vs Controls, and p ***—OVCFvs Controls. OR, odds ratio; CI, confidence interval; OVCF, osteoporotic vertebral compression fracture.

Genes 2020, 11, 612 12 of 18
Table 4. Stratified analysis of osteoporosis incidence by interactions with age, hypertension, diabetes mellitus, and levels of vitamin B12, folate, and homocysteine.
Variables†CD320 rs9426 CC vs. CT+TT TCN2 rs10418 CC vs. CT+TT SLC19A1 rs1051296 GG vs. GT+TT SLC19A2 rs16862199 CC vs. CT+TT
AOR (95% CI) AOR (95% CI) AOR (95% CI) AOR (95% CI) AOR (95% CI) AOR (95% CI) AOR (95% CI) AOR (95% CI)
Age (years)<69 1.000 (reference) 0.698 (0.316–1.540) 1.000 (reference) 0.944 (0.486–1.835) 1.000 (reference) 2.731 (1.170–6.375) 1.000 (reference) 1.354 (0.577–3.176)≥69 1.050 (0.607–1.818) 2.399 (1.101–5.226) 0.936 (0.479–1.828) 1.848 (0.985–3.469) 4.105 (1.574–10.708) 2.740 (1.179–6.365) 1.361 (0.791–2.344) 1.943 (0.917–4.119)
HypertensionNo 1.000 (reference) 1.685 (0.832–3.412) 1.000 (reference) 2.210 (1.193–4.092) 1.000 (reference) 1.372 (0.674–2.792) 1.000 (reference) 2.488 (1.119–5.531)Yes 0.766 (0.441–1.328) 0.631 (0.272–1.465) 1.000 (0.510–1.960) 0.775 (0.397–1.513) 0.783 (0.325–1.884) 0.703 (0.332–1.491) 0.839 (0.486–1.450) 0.561 (0.245–1.288)
Diabetesmellitus
No 1.000 (reference) 1.330 (0.744–2.376) 1.000 (reference) 1.191 (0.724–1.959) 1.000 (reference) 1.293 (0.731–2.286) 1.000 (reference) 1.655 (0.891–3.076)Yes 1.726 (0.828–3.598) 1.721 (0.553–5.362) 0.800 (0.334–1.914) 3.413 (1.245–9.358) 1.810 (0.600–5.458) 1.595 (0.681–3.738) 2.111 (0.978–4.555) 1.193 (0.422–3.370)
Vitamin B12a
>395 pg/mL 1.000 (reference) 1.273 (0.738–2.196) 1.000 (reference) 1.200 (0.678–2.125) 1.000 (reference) 1.256 (0.723–2.182) 1.000 (reference) 1.200 (0.678–2.125)≤395 pg/mL 2.765 (1.198–6.382) 3.437 (0.646–18.278) 2.164 (0.936–5.004) 4.454 (0.893–22.208) 3.099 (0.713–13.470) 2.442 (0.939–6.353) 2.164 (0.936–5.004) 4.454 (0.893–22.208)
Folatea
>4.59 nmol/L 1.000 (reference) 1.325 (0.742–2.364) 1.000 (reference) 1.352 (0.826–2.212) 1.000 (reference) 1.000 (0.248–4.033) 1.000 (reference) 1.467 (0.788–2.734)≤4.59 nmol/L 1.961 (0.907–4.238) 2.157 (0.576–8.082) 1.392 (0.517–3.752) 2.475 (1.014–6.041) 1.000 (0.248–4.033) 2.019 (0.878–4.646) 2.032 (0.906–4.561) 1.837 (0.582–5.796)
Homocysteinea
<12.68 µmol/L 1.000 (reference) 0.936 (0.513–1.710) 1.000 (reference) 1.646 (1.001–2.707) 1.000 (reference) 1.484 (0.842–2.615) 1.000 (reference) 1.591 (0.857–2.954)≥12.68 µmol/L 1.293 (0.547–3.055) 5.019 (1.533–16.430) 3.411 (1.213–9.595) 1.837 (0.783–4.312) 5.385 (1.355–21.400) 1.831 (0.783–4.280) 2.646 (1.141–6.132) 1.569 (0.509–4.838)† Odds ratio adjusted by age, gender, hypertension, and diabetes mellitus. a Cut–offs were set at the bottom 15% for vitamin B12 (395 pg/mL) and folate (4.59 nmol/L) and at the top 15% forhomocysteine (12.68 umol/L) for both osteoporosis patients and controls.

Genes 2020, 11, 612 13 of 18
Table 5. Stratified analysis of OVCF incidence by interactions with age, hypertension, diabetes mellitus, and levels of vitamin B12, folate, and homocysteine.
Variables†CD320 rs9426 CC vs. CT+TT TCN2 rs10418 CC vs. CT+TT SLC19A1 rs1051296 GG vs. GT+TT SLC19A2 rs16862199 CC vs. CT+TT
AOR (95% CI) AOR (95% CI) AOR (95% CI) AOR (95% CI) AOR (95% CI) AOR (95% CI) AOR (95% CI) AOR (95% CI)
Age
<69 1.000 (reference) 0.383 (0.133—-1.104) 1.000 (reference) 1.257 (0.479–3.301) 1.000 (reference) 3.782(1.210–11.817) 1.000 (reference) 1.257 (0.479–3.301)
≥69 0.642 (0.334–1.234) 2.101 (0.907–4.868) 1.057 (0.557–2.004) 1.489 (0.638–3.473) 5.132 (1.468–17.939) 2.578 (0.810–8.208) 1.057 (0.557–2.004) 1.489 (0.638–3.473)Hypertension
No 1.000 (reference) 1.485 (0.640–3.446) 1.000 (reference) 2.125 (0.829–5.448) 1.000 (reference) 1.268 (0.517–3.110) 1.000 (reference) 2.125 (0.829–5.448)Yes 0.911 (0.469–1.768) 0.966 (0.372–2.512) 0.900 (0.469–1.726) 0.963 (0.392–2.367) 0.879 (0.289–2.670) 0.938 (0.372–2.367) 0.900 (0.469–1.726) 0.963 (0.392–2.367)
Diabetesmellitus
No 1.000 (reference) 1.270 (0.646–2.496) 1.000 (reference) 1.781 (0.881–3.600) 1.000 (reference) 1.257 (0.630–2.510) 1.000 (reference) 1.781 (0.881–3.600)Yes 0.851 (0.310–2.340) 1.273 (0.301–5.379) 1.301 (0.486–3.477) 0.543 (0.113–2.621) 1.492 (0.368–6.038) 0.847 (0.261–2.744) 1.301 (0.486–3.477) 0.543 (0.113–2.621)
Vitamin B12a
>395 pg/mL 1.000 (reference) 1.242 (0.653–2.362) 1.000 (reference) 1.259 (0.646–2.454) 1.000 (reference) 1.064 (0.561–2.018) 1.000 (reference) 1.259 (0.646–2.454)≤395 pg/mL 0.845 (0.215–3.313) 1.524 (0.129–18.010) 0.469 (0.098–2.255) 2.495 (0.331–18.782) N/A 0.784 (0.201–3.056) 0.469 (0.098–2.255) 2.495 (0.331–18.782)
Folatea
>4.59 nmol/L 1.000 (reference) 1.097 (0.520–2.315) 1.000 (reference) 1.575 (0.740–3.351) 1.000 (reference) 1.028 (0.498–2.120) 1.000 (reference) 1.575 (0.740–3.351)≤4.59 nmol/L 3.219 (1.418–7.307) 7.307 (1.975–27.033) 4.290 (1.911–9.629) 3.085 (0.914–10.411) 2.022 (0.469–8.730) 3.589 (1.440–8.950) 4.290 (1.911–9.629) 3.085 (0.914–10.411)
Homocysteinea
<12.68 µmol/L 1.000 (reference) 0.931 (0.456–1.900) 1.000 (reference) 1.810 (0.898–3.649) 1.000 (reference) 1.129 (0.570–2.237) 1.000 (reference) 1.810 (0.898–3.649)≥12.68µmol/L 1.020 (0.335–3.103) 5.760 (1.480–22.417) 2.911 (1.100–7.704) 0.861 (0.168–4.425) 3.100 (0.492–19.542) 1.286 (0.434–3.807) 2.911 (1.100–7.704) 0.861 (0.168–4.425)
† Odds ratio adjusted by age, gender, hypertension, and diabetes mellitus. OVCF, osteoporotic vertebral compression fracture. a Cut–offs were set at the bottom 15% for vitamin B12 (395pg/mL) and folate (4.59 nmol/L) and at the top 15% for homocysteine (12.68 umol/L) for both osteoporosis patients and controls.

Genes 2020, 11, 612 14 of 18
4. Discussion
Emerging evidence suggests that B–vitamins, in particular vitamin B1, B12 (cobalamin) andB9 (folate) exert bone–protective effects, whereas homocysteine has a detrimental effect on bonehealth [2–7]. It is also known that folate, vitamin B12, vitamin B6, and vitamin B2 (riboflavin) areinvolved in the homocysteine metabolism [20]. Therefore, folate and vitamin B12 deficiencies cancause increased serum levels of homocysteine contributing to osteoporosis and osteoporotic bonefractures. Cobalamin is first bound to cobalamin transport protein (TC II, encoded by TCN2 gene)and TC II–cobalamin complex then enters the cells via its interaction with TC II receptor (encodedby CD320 gene) on the cell surface [15,19,21]. Transport of thiamine and folate into cells can occurvia thiamine carrier 1 (TC1) (encoded by SLC19A2) and reduced folate carrier (encoded by SLC19A1),respectively [18]. B vitamins status can be associated mainly with SNPs in genes directly involved invitamin absorption/uptake (CD320) or transport (TCN2, SLC19A1, SLC19A2) and SNPs in these genesmay have a detrimental effect on bone health by individual action as vitamins and their action oninfluencing homocysteine concentration [2–7].
In the present study, we explored possible associations between SNPs located in the 3´–UTR ofthe CD320, TCN2, SLC19A1, and SLC19A2 genes and osteoporosis and OVCFs in 301 postmenopausalwomen. The main findings from this study are as follows:(1) Individuals with CD320 CT+TT genotypeand high homocysteine concentrations had a significantly increased risk of osteoporosis and OVCF;(2) the CD320 C –TCN2 T—SLC19A1 T—SLC19A2 C and CD320 T–TCN2 C–SLC19A1 G–SLC19A2C allele combinations was significantly associated with an increased risk of osteoporosis. Ourpatients with osteoporosis, particularly those patients with OVCFs, exhibit higher blood glucose levels,decreased folate levels, and lower BMIs compared to control subjects. These findings are in accordancewith results from previous osteoporosis studies. The risk for osteoporosis and osteoporotic fractures issignificantly associated with both type 1 and type 2 diabetes [22–24]. It has also been reported thatlow folate levels and high homocysteine levels in serum are significantly associated with osteoporoticfractures [25]. Low BMI is an additional important risk factor for low bone mass and increased risk ofosteoporotic fractures [26,27]. However, homocysteine levels did not exhibit a significant associationwith osteoporosis or OVCF in the current study.
A stratified analysis of osteoporosis and OVCF incidence revealed a significantly increased risk forboth osteoporosis (AOR = 5.019) and OVCF (AOR = 5.760) in patients with high homocysteine levels(≥12.68 µmol/L) and genotype CD320 CT+TT versus individuals with normal homocysteine levelsand genotype CD320 CC. These results highlight the relationship of genotypes with the incidence ofosteoporosis and OVCF in individuals with high homocysteine levels; notably, there was no significantdifference in homocysteine concentrations between the control and osteoporosis groups within thisstudy (Table 1). Although a dominant model failed to identify statistical differences in the stratifiedanalysis, a recessive model did identify an increased risk for osteoporosis and OVCF in specific subsetsof individuals with the recessive genotype (Tables 4 and 5).
Overall, the results of the present study indicate that the incidence of osteoporosis and OVCF issignificantly increased in a subset of patients who are carrying genotype CD320 CT+TT and have highhomocysteine levels. Stone et al. described that the SNP at the binding site of miR–136 is significantlyassociated with total homocysteine level and methylmalonic acid level [28]. The serum homocysteineconcentration in normal individuals ranges from 5 to 12 µmol/L. Mild hyperhomocysteinemia isdefined as a homocysteine concentration between 12–16 µmol/L [29]. In the present study, the cut–off
set at the top 15%, which equated to 12.68 µmol/L, was in accordance with this established rangefor elevated homocysteine levels. A nationally representative, cross–sectional survey revealed arelationship between elevated homocysteine concentrations and both bone turnover markers andtotal body and lumbar spine BMD in women ≥50 years of age [30]. Additionally, cross–sectional datafrom the BPROOF study and from two Rotterdam Study cohorts have reported a significant inverseassociation between elevated homocysteine levels in women and both bone ultrasound parametersindicative of lower bone quality and with lower BMD. It has been hypothesized that homocysteine

Genes 2020, 11, 612 15 of 18
might impede collagen cross–link formation within bone, thereby weakening bone strength in amanner independent of BMD [31]. Yang et al. reported that mildly elevated serum homocysteinelevels (>13 nmol/mL) in the general population are associated with increased risk of vertebral and hipfractures that is independent of conventional risk factors [32]. Methylation of DNA plays an importantrole in the regulation of gene expression, and the conversion of methionine to homocysteine involvesthe removal of a methyl group that could be subsequently donated to DNA. High homocysteinelevels could dampen this conversion, thereby reducing DNA methylation activity and altering geneexpression, which could influence expression of the CD320 gene.
Allele–allelic combination analysis revealed that the various combinations were significantlyassociated with osteoporosis and OVCF risk, suggesting putative gene–gene interactions. Among them,the combination of CD320 C-TCN2 T-SLC19A1 G-SLC19A2 T showed the strongest association withosteoporosis risk. Our analyses therefore suggest that the allelic combinations of CD320, TCN2,SLC19A1, and SLC19A2 genes could play a role in the pathogenesis of osteoporosis and OVCF.
Currently, there are no genetic studies in 3’–UTR polymorphisms associating osteoporosis withfolate and vitamin B12, and only a few clinical studies have evaluated the effects of folic acid andvitamin B12 on plasma homocysteine levels and bone health. In the Hordaland Homocysteine Study,folate was linked to BMD and a reduced fracture risk, but there was limited evidence to support adirect effect of folate on bone health [33,34]. In the current study, we identified significant differencesin folate and vitamin B12 levels between the control and osteoporosis groups, although the levels offolate and vitamin B12 were within the normal range for all groups. Even in the stratified analysis,the bottom 15% of folate and vitamin B12 levels were within the normal range. Therefore, we did notdraw substantial findings from these genetic analyses.
We used the LDlink (https://ldlink.nci.nih.gov/) to find out the SNPs linked to each SNPs andidentify other SNPs in the linkage disequilibrium (LD) relationship to the SNPS analyzed in the presentstudy. According to the LD link tool (LD proxy), there was no tightly linked variants associated withTCN2 rs10418 C> T and SLC19A2 rs16862199 C> T. By contrast, the CD320 rs9426 C> T and SLC19A1rs1051296G> T were reported to be tightly linked with CD320 rs2336573 variant and SLC19A2 rs12659,respectively [35,36].
There are several limitations of this study. First, the study included only Korean postmenopausalwomen, and our results cannot be generalized to other racial or ethnic groups because SNPs and allelecombinations vary among ethnic groups. Second, this was a hospital–based case–control study, and thesample size was relatively small. Thus, the present results should be replicated and validated in largerstudies that include diverse ethnic groups and men. Third, we could not conclusively exclude otherpotential confounding variables, such as exposure to different environmental factors (e.g., smoking,nutrition, calcium and vitamin intake), and this study was not a genome–wide association study;therefore, the additional genetic risk factors affecting osteoporosis and OVCF are unclear. Fourth,we did not identify the miRNAs of the target genes and did not perform in vitro studies. Lastly,we should consider the possible changes of analyzed genes due to change in miRNA action because weinvestigated SNPs located in 3´–UTR of B vitamin–related genes. Genetic variation in the 3´–UTR canaffect gene expression by interfering with miRNA binding [12,37,38]. Polymorphisms residing withinthe miRNA–binding site of the target genes may have their own disease onset effect, but changes in themiRNA binding efficiency also has to be considered [23,24]. Thus, our study does not rule out thepossibility that change in miRNA action could influence our results.
5. Conclusions
We have identified associations between four B vitamin–related SNPs in 3’–UTR, namelyCD320C>T (rs9426), TCN2C>T (rs10418), SLC19A1G>T (rs1051296), and SLC19A2C>T (rs16862199),and the occurrence of osteoporosis and OVCF in Korean postmenopausal women. Our findingssuggest that SNPs in the miRNA binding site within the 3’–UTR of the CD320 gene may contribute toosteoporosis and OVCF occurrences in some individuals with high homocysteine level. Although these

Genes 2020, 11, 612 16 of 18
findings do not broadly address the complex pathogenesis of osteoporosis, the data described here couldcontribute to the available pool of SNP variants needed for the individual assessment of osteoporosisand OVCF risk.
Supplementary Materials: The following are available online at http://www.mdpi.com/2073-4425/11/6/612/s1.Table S1: Stratified effects in the 3’-UTR polymorphisms of CD320, TCN2, SLC19A1, and SLC19A2 genes onosteoporosis risk; Table S2: Stratified effects in the 3’-UTR polymorphisms of CD320, TCN2, SLC19A1, and SLC19A2genes on incidence of OVCF.
Author Contributions: Conceptualization, N.K.K. and I.-B.H.; Data curation, H.J.A.; U.Y.C. and S.S.; Investigation,K.-T.K.; Methodology, H.S.P.; Resources, N.K.K. and I.-B.H.; Writing—original draft, T.-K.A. and J.O.K.;Writing—review & editing, T.-K.A., N.K.K. and I.-B.H. All authors have read and agreed to the publishedversion of the manuscript.
Funding: This study was supported by a grant of the Korea Healthcare Technology R&D Project, Ministry ofHealth and Welfare, Republic of Korea (HR16C0002, HI16C0106, HI20C0579, H18C1999) and National ResearchFoundation of Korea (NRF 2020R1A2C4001870).
Conflicts of Interest: The authors declare no conflict of interest.
References
1. Saito, M.; Marumo, K. The effects of homocysteine on the skeleton. Curr. Osteoporos. Rep. 2018, 16, 554–560.[CrossRef] [PubMed]
2. Ma, Q.; Liang, M.; Wang, Y.; Ding, N.; Wu, Y.; Duan, L.; Yu, T.; Lu, Y.; Xu, J.; Kang, F. Non–coenzyme role ofvitamin B1 in RANKL–induced osteoclastogenesis and ovariectomy induced osteoporosis. J. Cell. Biochem.2020. [CrossRef] [PubMed]
3. Bucciarelli, P.; Martini, G.; Martinelli, I.; Ceccarelli, E.; Gennari, L.; Bader, R.; Valenti, R.; Franci, B.;Nuti, R.; Mannucci, P.M. The relationship between plasma homocysteine levels and bone mineral density inpost–menopausal women. Eur. J. Intern. Med. 2010, 21, 301–305. [CrossRef] [PubMed]
4. McLean, R.R.; Jacques, P.F.; Selhub, J.; Fredman, L.; Tucker, K.L.; Samelson, E.J.; Kiel, D.P.; Cupples, L.A.;Hannan, M.T. Plasma B vitamins, homocysteine, and their relation with bone loss and hip fracture in elderlymen and women. J. Clin. Endocrinol. Metab. 2008, 93, 2206–2212. [CrossRef]
5. Baines, M.; Kredan, M.-B.; Usher, J.; Davison, A.; Higgins, G.; Taylor, W.; West, C.; Fraser, W.D.; Ranganath, L.R.The association of homocysteine and its determinants MTHFR genotype, folate, vitamin B12 and vitamin B6with bone mineral density in postmenopausal British women. Bone 2007, 40, 730–736. [CrossRef]
6. Morris, M.S.; Jacques, P.F.; Selhub, J. Relation between homocysteine and B–vitamin status indicators andbone mineral density in older Americans. Bone 2005, 37, 234–242. [CrossRef]
7. Dai, Z.; Koh, W.-P. B–vitamins and bone health–a review of the current evidence. Nutrients 2015, 7, 3322–3346.[CrossRef]
8. Ahmad, I.; Jafar, T.; Mahdi, F.; Arshad, M.; Das, S.K.; Waliullah, S.; Mahdi, A.A. Association of VitaminD Receptor (FokI and BsmI) Gene Polymorphism with Bone Mineral Density and Their Effect on25–Hydroxyvitamin D Level in North Indian Postmenopausal Women with Osteoporosis. Indian J. Clin.Biochem. 2018, 33, 429–437. [CrossRef]
9. Li, Y.; Xi, B.; Li, K.; Wang, C. Association between vitamin D receptor gene polymorphisms and bone mineraldensity in Chinese women. Mol. Biol. Rep. 2012, 39, 5709–5717. [CrossRef]
10. Abrahamsen, B.; Madsen, J.S.; Tofteng, C.L.; Stilgren, L.; Bladbjerg, E.M.; Kristensen, S.R.; Brixen, K.;Mosekilde, L. Are effects of MTHFR (C677T) genotype on BMD confined to women with low folate andriboflavin intake? Analysis of food records from the Danish osteoporosis prevention study. Bone 2005, 36,577–583. [CrossRef]
11. Lei, S.-F.; Papasian, C.J.; Deng, H.-W. Polymorphisms in Predicted miRNA Binding Sites and Osteoporosis.J. Bone Min. Res. 2011, 26, 72–78. [CrossRef] [PubMed]
12. Ahn, T.-K.; Kim, J.O.; Kim, H.W.; Park, H.S.; Shim, J.H.; Ropper, A.E.; Han, I.B.; Kim, N.K. 3’–UTRPolymorphisms of MTHFR and TS Associated with Osteoporotic Vertebral Compression FractureSusceptibility in Postmenopausal Women. Int. J. Mol. Sci. 2018, 19, 824. [CrossRef] [PubMed]
13. McLean, R.R.; Hannan, M.T. B vitamins, homocysteine, and bone disease: Epidemiology and pathophysiology.Curr. Osteoporos. Rep. 2007, 5, 112–119. [CrossRef] [PubMed]

Genes 2020, 11, 612 17 of 18
14. Lubec, B.; Fang–Kircher, S.; Lubec, T.; Blom, H.J.; Boers, G.H. Evidence for McKusick’s hypothesis ofdeficient collagen cross–linking in patients with homocystinuria. Biochim. Biophys. Acta 1996, 1315, 159–162.[CrossRef]
15. Fedosov, S.N. Physiological and molecular aspects of cobalamin transport. In Water Soluble Vitamins; Springer:Berlin/Heidelberg, Germany, 2012; pp. 347–367.
16. Matteini, A.M.; Walston, J.D.; Bandeen–Roche, K.; Arking, D.E.; Allen, R.H.; Fried, L.P.; Chakravarti, A.;Stabler, S.P.; Fallin, M.D. Transcobalamin–II variants, decreased vitamin B12 availability and increased riskof frailty. J. Nutr. Health Aging 2010, 14, 73–77. [CrossRef] [PubMed]
17. Quadros, E.V.; Sequeira, J.M. Cellular uptake of cobalamin: Transcobalamin and the TCblR/CD320 receptor.Biochimie 2013, 95, 1008–1018. [CrossRef] [PubMed]
18. Genant, H.K.; Wu, C.Y.; Van Kuijk, C.; Nevitt, M.C. Vertebral fracture assessment using a semiquantitativetechnique. J. Bone Miner. Res. 1993, 8, 1137–1148. [CrossRef]
19. Ryu, C.S.; Sakong, J.H.; Ahn, E.H.; Kim, J.O.; Ko, D.; Kim, J.H.; Lee, W.S.; Kim, N.K. Association study of thethree functional polymorphisms (TAS2R46G>A, OR4C16G>A, and OR4X1A>T) with recurrent pregnancyloss. Genes Genom. 2019, 41, 61–70. [CrossRef]
20. Fratoni, V.; Brandi, M.L. B vitamins, homocysteine and bone health. Nutrients 2015, 7, 2176–2192. [CrossRef]21. Quadros, E.V.; Nakayama, Y.; Sequeira, J.M. Targeted delivery of saporin toxin by monoclonal antibody to
the transcobalamin receptor, TCblR/CD320. Mol. Cancer Ther. 2010, 9, 3033–3040. [CrossRef]22. Giangregorio, L.M.; Leslie, W.D.; Lix, L.M.; Johansson, H.; Oden, A.; McCloskey, E.; Kanis, J.A. FRAX
underestimates fracture risk in patients with diabetes. J. Bone Miner. Res. 2012, 27, 301–308. [CrossRef][PubMed]
23. Leslie, W.D.; Rubin, M.R.; Schwartz, A.V.; Kanis, J.A. Type 2 diabetes and bone. J. Bone Miner. Res. 2012, 27,2231–2237. [CrossRef] [PubMed]
24. Kurra, S.; Siris, E. Diabetes and bone health: The relationship between diabetes and osteoporosis–associatedfractures. Diabetes/Metab. Res. Rev. 2011, 27, 430–435. [CrossRef] [PubMed]
25. Gjesdal, C.G.; Vollset, S.E.; Ueland, P.M.; Refsum, H.; Drevon, C.A.; Gjessing, H.K.; Tell, G.S. Plasma totalhomocysteine level and bone mineral density: The Hordaland Homocysteine Study. Arch. Intern. Med. 2006,166, 88–94. [CrossRef]
26. Barrera, G.; Bunout, D.; Gattás, V.; de la Maza, M.P.; Leiva, L.; Hirsch, S. A high body mass index protectsagainst femoral neck osteoporosis in healthy elderly subjects. Nutrition 2004, 20, 769–771. [CrossRef]
27. Ravn, P.; Cizza, G.; Bjarnason, N.H.; Thompson, D.; Daley, M.; Wasnich, R.D.; McClung, M.; Hosking, D.;Yates, A.J.; Christiansen, C. Low body mass index is an important risk factor for low bone mass and increasedbone loss in early postmenopausal women. J. Bone Miner. Res. 1999, 14, 1622–1627. [CrossRef]
28. Stone, N.; Pangilinan, F.; Molloy, A.M.; Shane, B.; Scott, J.M.; Ueland, P.M.; Mills, J.L.; Kirke, P.N.; Sethupathy, P.;Brody, L.C. Bioinformatic and genetic association analysis of microRNA target sites in one–carbon metabolismgenes. PLoS ONE 2011, 6. [CrossRef]
29. Perna, A.F.; Ingrosso, D.; Violetti, E.; Luciano, M.G.; Sepe, I.; Lanza, D.; Capasso, R.; Ascione, E.; Raiola, I.;Lombardi, C. Progress in Uremic Toxin Research: Hyperhomocysteinemia in Uremia—A Red Flag in aDisrupted Circuit. In Proceedings of the Seminars in Dialysis; Wiley Online Library: Hoboken, NJ, USA, 2009;Volume 22, pp. 351–356.
30. Bailey, R.L.; Looker, A.C.; Lu, Z.; Fan, R.; Eicher–Miller, H.A.; Fakhouri, T.H.; Gahche, J.J.; Weaver, C.M.;Mills, J.L. B–vitamin status and bone mineral density and risk of lumbar osteoporosis in older females in theUnited States. Am. J. Clin. Nutr. 2015, 102, 687–694. [CrossRef]
31. Enneman, A.W.; Swart, K.M.; Zillikens, M.C.; van Dijk, S.C.; van Wijngaarden, J.P.; Brouwer–Brolsma, E.M.;Dhonukshe–Rutten, R.A.; Hofman, A.; Rivadeneira, F.; van der Cammen, T.J. The association betweenplasma homocysteine levels and bone quality and bone mineral density parameters in older persons. Bone2014, 63, 141–146. [CrossRef]
32. Yang, J.; Hu, X.; Zhang, Q.; Cao, H.; Wang, J.; Liu, B. Homocysteine level and risk of fracture: A meta–analysisand systematic review. Bone 2012, 51, 376–382. [CrossRef]
33. Cagnacci, A.; Bagni, B.; Zini, A.; Cannoletta, M.; Generali, M.; Volpe, A. Relation of folates, vitamin B12 andhomocysteine to vertebral bone mineral density change in postmenopausal women. A five–year longitudinalevaluation. Bone 2008, 42, 314–320. [CrossRef] [PubMed]

Genes 2020, 11, 612 18 of 18
34. Gjesdal, C.G.; Vollset, S.E.; Ueland, P.M.; Refsum, H.; Meyer, H.E.; Tell, G.S. Plasma homocysteine, folate,and vitamin B12 and the risk of hip fracture: The Hordaland Homocysteine Study. J. Bone Miner. Res. 2007,22, 747–756. [CrossRef] [PubMed]
35. Durie, B.G.M.; Van Ness, B.; Ramos, C.; Stephens, O.; Haznadar, M.; Hoering, A.; Haessler, J.; Katz, M.S.;Mundy, G.R.; Kyle, R.A. Genetic polymorphisms of EPHX1, Gsk3β, TNFSF8 and myeloma cell DKK–1expression linked to bone disease in myeloma. Leukemia 2009, 23, 1913–1919. [CrossRef]
36. Kurnat–Thoma, E.L.; Pangilinan, F.; Matteini, A.M.; Wong, B.; Pepper, G.A.; Stabler, S.P.; Guralnik, J.M.;Brody, L.C. Association of transcobalamin II (TCN2) and transcobalamin II–receptor (TCblR) geneticvariations with cobalamin deficiency parameters in elderly women. Biol. Res. Nurs. 2015, 17, 444–454.[CrossRef] [PubMed]
37. An, H.J.; Kim, J.H.; Ahn, E.H.; Kim, Y.R.; Kim, J.O.; Park, H.S.; Ryu, C.S.; Kim, E.-G.; Cho, S.H.; Lee, W.S.3′–UTR Polymorphisms in the Vascular Endothelial Growth Factor Gene (VEGF) Contribute to Susceptibilityto Recurrent Pregnancy Loss (RPL). Int. J. Mol. Sci. 2019, 20, 3319. [CrossRef] [PubMed]
38. Kim, J.O.; Park, H.S.; Ryu, C.S.; Shin, J.-W.; Kim, J.; Oh, S.H.; Kim, O.J.; Kim, N.K. Interplay between 3′–UTRpolymorphisms in the methylenetetrahydrofolate reductase (MTHFR) gene and the risk of ischemic stroke.Sci. Rep. 2017, 7, 1–10. [CrossRef] [PubMed]
© 2020 by the authors. Licensee MDPI, Basel, Switzerland. This article is an open accessarticle distributed under the terms and conditions of the Creative Commons Attribution(CC BY) license (http://creativecommons.org/licenses/by/4.0/).