3.0 the eureka county economy - yucca … · 3.0 the eureka county economy ... analysis bureau,...
TRANSCRIPT

Eureka County, Nevada Socioeconomic Conditions and Trends – UPDATE 2014 Page 3-1
3.0 THE EUREKA COUNTY ECONOMY
As shown in Table 3-1, mining jobs continue to surpass all other Eureka County jobs combined, with 4,252 of the total 4,743 jobs in
the county reported by the Nevada Department of Employment Training and Rehabilitation in 2013. The employment figures in Table
3-1 are covered employment Mining employment has remained relatively stable from 2007 to 2013. Peak employment occurred in
2007 and reached just over 5,000 employees in Eureka County (Figure 3-1).
Government is the second-largest employment category in the County, with 210 jobs reported in 2013. Within government sector,
local government is the largest employer, with 100 jobs in 2013. Government employment increased slightly from 2011 to 2013.
Accommodation and food service jobs have remained relatively constant over the last several years. The retail and wholesale trade
in Eureka County is very limited. Many local residents shop outside the area for goods and services.
Table 3-1 Employment in Eureka County, 2002-2013
2002 2003 2004 2005 2006 2007 2008 2009 2010 2011 2012 2013
Total Employment* 3,641 3,528 3,569 3,806 4,290 5,023 4,450 4,494 4,294 4,413 4,736 4,743
Agriculture 31 29 18 12 7 10 7 10 9 9 10 30
Mining 3,307 3,180 3,211 3,466 3,699 3,907 3,951 4,007 3,841 3,958 4,245 4,252
Retail Trade 30 30 30 26 30 32 36 36 32 28 27 26
Transportation and Warehousing 3 2 2 - - - - - 20 29 - 32
Accommodation and Food Service 25 25 38 38 39 45 45 43 44 38 48 58
Other Services except public admin. - 8 7 8 9 8 14 12 7 5 9 6
Government 204 188 192 178 194 198 204 211 212 203 198 210
All Other** 41 66 71 78 312 823 193 175 28 143 170 129
**Due to confidentiality some individual industry data is suppressed, but is still part of the total. These numbers are included in this item.
SOURCE: Nevada Department of Employment Training and Rehabilitation (DETR), Nevada Workplace Informer, Data Analysis, "Quarterly Employment and Wages," Eureka County, 2002-2013

Eureka County, Nevada Socioeconomic Conditions and Trends – UPDATE 2014 Page 3-2
2002 2003 2004 2005 2006 2007 2008 2009 2010 2011 2012 2013
All Other** 41 66 71 78 312 823 193 175 28 143 170 129
Other Services except public admin. 8 7 8 9 8 14 12 7 5 9 6
Transportation and Warehousing 3 2 2 - - - - - 20 29 - 32
Accomodation and Food Service 25 25 38 38 39 45 45 43 44 38 48 58
Agriculture 31 29 18 12 7 10 7 10 9 9 10 30
Retail Trade 30 30 30 26 30 32 36 36 32 28 27 26
Government 204 188 192 178 194 198 204 211 212 203 198 210
Mining 3,307 3,180 3,211 3,466 3,699 3,907 3,951 4,007 3,841 3,958 4,245 4,252
-
1,000
2,000
3,000
4,000
5,000
6,000
Num
ber
of
Jobs
Figure 3-1. Mining Continues to Dominate Eureka County Employment
SOURCE: Nevada Department of Employment Training and Rehabilitation, Nevada Workplace Informer, Data Analysis, "Quarterly Employment and Wages," Eureka County, 2002-2013
**NOTE:in order to maintain employer confidentiality some individual industry data are surpressed, but are still part of the total. These numbers are included in "All Other"

Eureka County, Nevada Socioeconomic Conditions and Trends – UPDATE 2014 Page 3-3
In the 20-year period shown in Figure 3-2, the unemployment rate in Eureka County peaked at 10.7 percent in 1994, well above state
and national unemployment rates. The unemployment rate fell to a low of 2.5 percent in 2000, then rose again to 6.0 percent in 2012
making the County's 2012 unemployment rate lower than the national and state rate. The mining sector appears to affect not only the
unemployment rate in the county, but also the size of the labor force itself. The years 2006-2008 were the three highest years in the
county for mining employment, services and trade. From 1997 to 2007, unemployment rates in Eureka County were at or below
State and National unemployment rates. Beginning in 2008, Eureka County’s unemployment rate slipped below State and National
levels. Table 3-2 shows Eureka County employment, unemployment and unemployment rates for Nevada and the United States.
Employment, unemployment and population gains and declines are highly correlated. After 1998 mining employment began to
decline and the overall size of the labor force declined from the 1998 high of 950 to 672 in 2004. This decline in the overall size of the
labor force, then, contributed to a continued drop in the county unemployment rate. Fewer jobs were available, yet there were also
fewer workers seeking jobs. The reduction in the resident labor force was primarily due to suspension of operations at the Ruby Hill
Mine near the Town of Eureka. Since 2005, jobs and the resident labor force have increased.
Eureka County has more jobs than workers (Table 3-3). This is a result of the location of the county's biggest employers, Newmont
Mining Company's Carlin Operations, and Barrick’s Goldstrike Mine and Cortez area operations. Both these mines are in the far
northern end of the county, closer to the Lander County and Elko County population centers of Battle Mountain, Elko and Carlin. The
mines are headquartered in Elko County, and workers are transported to the mine sites from those towns. Figure 3-3 illustrates this
imbalance of jobs vs. resident labor force in Eureka County.

Eureka County, Nevada Socioeconomic Conditions and Trends – UPDATE 2014 Page 3-4
0
2
4
6
8
10
12
14
16
1993 1994 1995 1996 1997 1998 1999 2000 2001 2002 2003 2004 2005 2006 2007 2008 2009 2010 2011 2012 2013
Perc
ent U
nem
plo
yment
Figure 3-2. Comparison of Eureka County, Nevada, and National Unemployment Rate 1993-2013
Eureka County
United States Nevada

Eureka County, Nevada Socioeconomic Conditions and Trends – UPDATE 2014 Page 3-5
Table 3-2. Employment and Unemployment, 1993 - 2013
Eureka County Nevada United States
Labor Force Unemployment Percent Unemployment
Rate Unemployment Rate
(Percent) Unemployment Rate
(Percent)
1993 800 60 7 7.2 6.8
1994 670 80 10.7 6.2 6.1
1995 670 70 9.5 5.4 5.6
1996 740 60 7.5 5.4 5.4
1997 860 50 5.5 4.1 4.9
1998 900 50 5.3 4.3 4.5
1999 820 40 4.6 4.4 4.2
2000 780 20 2.5 4.0 4.0
2001 740 30 3.9 5.3 4.7
2002 730 30 3.9 5.5 5.8
2003 667 41 5.8 5.3 5.1
2004 640 32 4.8 4.6 5.5
2005 674 26 3.8 4.1 6.0
2006 662 34 4.9 4.0 4.6
2007 761 34 4.9 4.6 4.6
2008 793 43 5.6 7.0 5.8
2009 827 66 7.4 12.5 9.3
2010 1,082 82 7.6 13.7 9.6
2011 1,115 67 6.0 13.6 8.9
2012 1,122 67 6.0 11.1 8.1
2013 1,120 66 5.9 9.4 7.4
SOURCE: Nevada Department of Employment Training and Rehabilitation, Research and Analysis Bureau, Nevada Workforce Informer, Data Analysis, "Labor Force and Unemployment (LAUS)," Eureka County, Nevada, United States, 2003-2013

Eureka County, Nevada Socioeconomic Conditions and Trends – UPDATE 2014 Page 3-6
Table 3-3. Resident Labor Force vs. Jobs in Eureka County: 1993 to
2013
Resident Labor
Force Jobs Located in Eureka County
1993 860 4,772
1994 750 5,295
1995 740 4,885
1996 800 5,217
1997 910 5,324
1998 950 4,945
1999 860 4,602
2000 800 4,489
2001 770 4,336
2002 772 4,080
2003 709 4,005
2004 672 4,062
2005 674 3,806
2006 706 4,290
2007 795 5,023
2008 836 4,450
2009 893 4,494
2010 1,082 4,294
2011 1,115 4,413
2012 1,122 4,736
2013* 1,120 4,752
SOURCES: (for table and bar graph) U.S. Department of Commerce, Bureau of Economic Analysis, Regional Economic Accounts, "Total Full-Time and Part-time Employment by Industry, Eureka, NV" 1993-2005, Nevada Department of Employment Training and Rehabilitation, Research and Analysis Bureau, "Labor Force and Unemployment (LAUS)," Eureka County, Nevada, United States, 1993-2012, * 3rd quarter 2013

Eureka County, Nevada Socioeconomic Conditions and Trends – UPDATE 2014 Page 3-7
0
1000
2000
3000
4000
5000
6000
1993 1994 1995 1996 1997 1998 1999 2000 2001 2002 2003 2004 2005 2006 2007 2008 2009 2010 2011 2012 2013
Year
Figure 3-3. More Jobs in Eureka County Than Resident Workers
Jobs located in Eureka County
Resident Labor Force

Eureka County, Nevada Socioeconomic Conditions and Trends – UPDATE 2014 Page 3-8
Table 3-4 shows the Eureka County commuting patterns in 2000. Similar trends are anticipated with the majority of workers living
outside Eureka County and commuting to the County for work.
Table 3-4. Commuting Patterns in Eureka County, 2000
Area of Residence Area of workplace Number of workers
Elko County, NV Eureka County, NV 1,488 0 1,488
Eureka County, NV Eureka County, NV 630 630 0
Lander County, NV Eureka County, NV 54 0 54
Eureka County, NV Elko County, NV 50 50 0
White Pine County, NV Eureka County, NV 36 0 36
Washoe County, NV Eureka County, NV 23 0 23
Eureka County, NV Lander County, NV 9 9 0
Clark County, NV Eureka County, NV 6 0 6
Eureka County, NV Salt Lake County, UT 5 5 0
Eureka County, NV White Pine County, NV 5 5 0
Pershing County, NV Eureka County, NV 4 0 4
Eureka County, NV Churchill County, NV 3 3 0
Eureka County, NV Nye County, NV 3 3 0
Eureka County, NV San Diego County, CA 3 3 0
Eureka County, NV Douglas County , NV 2 2 0
Eureka County, NV San Mateo County, CA 2 2 0
Montrose County, CO Eureka County , NV 2 0 2
2,325 712 1,613
SOURCE: Nevada Department of Employment, Training & Rehabilitation, Research & Analysis Bureau

Eureka County, Nevada Socioeconomic Conditions and Trends – UPDATE 2014 Page 3-9
Eureka County Per Capita and Household Income
As shown in Table 3-5, per capita income in Eureka County has seen periods of increase and decline. Since 2007, the per capita
income of Eureka County is closing the gap and nearing the State’s per capita income level. In 2008, Eureka’s per capita income
exceeded the State’s for the first time since the early 1990s. The increase in per capita income is largely due to mining activity and
employment in the County. Figure 3-4 on the following page shows the 18 year relationship between Eureka County and the State of
Nevada per capita income. The per capita income declined in 2010 due to population adjustments and then rebounded in 2011.
Only small increases occurred from 2011 to 2012.
Table 3-5 Per Capita Income, 1993 - 2012 (Not adjusted for inflation)
1993 1994 1995 1996 1997 1998 1999 2000 2001 2002 2003 2004
Eureka County $25,433 $27,102 $26,199 $26,489 $24,131 $23,184 $22,990 $24,069 $27,014 $25,446 $28,860 $31,657
Nevada $22,949 $23,930 $24,897 $26,004 $26,789 $28,069 $28,655 $29,794 $31,183 $31,314 $32,669 $35,282
2005 2006 2007 2008 2009 2010 2011 2012
Eureka County $33,238 $33,944 $36,029 $40,876 $37,376 $32,876 $40,163 $40,304
Nevada $38,125 $39,241 $40,390 $40,038 $37,670 $36,928 $37,396 $38,221
SOURCE: U.S. Department of Commerce, Bureau of Economic Analysis, Regional Economic Accounts, "Personal Income by Major Source and Earnings by Industry 1993-2011"
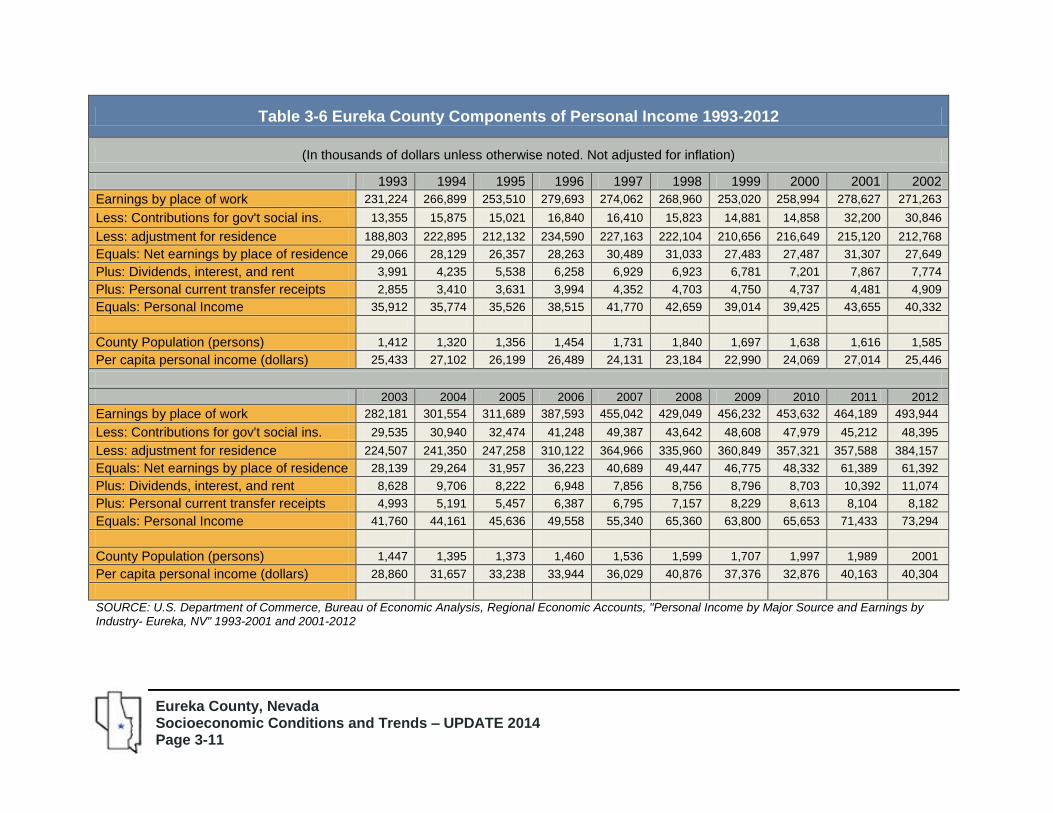
Per capita personal income in Eureka County is tied to earnings in the mining industry, but it also is influenced by other factors. The
components of personal income in Eureka County are shown Table 3-6. One of the components is an adjustment for place of
residence which reflects the fact that most mining income is earned by workers residing outside of Eureka County. In 2012 earnings
by the place of work in Eureka County totaled $494 million, approximately 80 percent was earned by workers employed in Eureka
County but residing outside the County.

Eureka County, Nevada Socioeconomic Conditions and Trends – UPDATE 2014 Page 3-10
-
5,000
10,000
15,000
20,000
25,000
30,000
35,000
40,000
45,000
1993 1994 1995 1996 1997 1998 1999 2000 2001 2002 2003 2004 2005 2006 2007 2008 2009 2010 2011 2012
Do
llars
Year
Figure 3-4 Nevada and Eureka County Per Capita Income Comparison
Eureka County Per Capita Income
Nevada Per Capita Income
Eureka County, Nevada Socioeconomic Conditions and Trends – UPDATE 2014 Page 3-11
Table 3-6 Eureka County Components of Personal Income 1993-2012
(In thousands of dollars unless otherwise noted. Not adjusted for inflation)
1993 1994 1995 1996 1997 1998 1999 2000 2001 2002
Earnings by place of work 231,224 266,899 253,510 279,693 274,062 268,960 253,020 258,994 278,627 271,263
Less: Contributions for gov't social ins. 13,355 15,875 15,021 16,840 16,410 15,823 14,881 14,858 32,200 30,846
Less: adjustment for residence 188,803 222,895 212,132 234,590 227,163 222,104 210,656 216,649 215,120 212,768
Equals: Net earnings by place of residence 29,066 28,129 26,357 28,263 30,489 31,033 27,483 27,487 31,307 27,649
Plus: Dividends, interest, and rent 3,991 4,235 5,538 6,258 6,929 6,923 6,781 7,201 7,867 7,774
Plus: Personal current transfer receipts 2,855 3,410 3,631 3,994 4,352 4,703 4,750 4,737 4,481 4,909
Equals: Personal Income 35,912 35,774 35,526 38,515 41,770 42,659 39,014 39,425 43,655 40,332
County Population (persons) 1,412 1,320 1,356 1,454 1,731 1,840 1,697 1,638 1,616 1,585
Per capita personal income (dollars) 25,433 27,102 26,199 26,489 24,131 23,184 22,990 24,069 27,014 25,446
2003 2004 2005 2006 2007 2008 2009 2010 2011 2012
Earnings by place of work 282,181 301,554 311,689 387,593 455,042 429,049 456,232 453,632 464,189 493,944
Less: Contributions for gov't social ins. 29,535 30,940 32,474 41,248 49,387 43,642 48,608 47,979 45,212 48,395
Less: adjustment for residence 224,507 241,350 247,258 310,122 364,966 335,960 360,849 357,321 357,588 384,157
Equals: Net earnings by place of residence 28,139 29,264 31,957 36,223 40,689 49,447 46,775 48,332 61,389 61,392
Plus: Dividends, interest, and rent 8,628 9,706 8,222 6,948 7,856 8,756 8,796 8,703 10,392 11,074
Plus: Personal current transfer receipts 4,993 5,191 5,457 6,387 6,795 7,157 8,229 8,613 8,104 8,182
Equals: Personal Income 41,760 44,161 45,636 49,558 55,340 65,360 63,800 65,653 71,433 73,294
County Population (persons) 1,447 1,395 1,373 1,460 1,536 1,599 1,707 1,997 1,989 2001
Per capita personal income (dollars) 28,860 31,657 33,238 33,944 36,029 40,876 37,376 32,876 40,163 40,304
SOURCE: U.S. Department of Commerce, Bureau of Economic Analysis, Regional Economic Accounts, "Personal Income by Major Source and Earnings by Industry- Eureka, NV" 1993-2001 and 2001-2012

Eureka County, Nevada Socioeconomic Conditions and Trends – UPDATE 2014 Page 3-12
Median Household Income in Eureka County
Table 3-7 and Figure 3-5 show median household income for Eureka County over a 20-year period, both adjusted for inflation (2012
dollars) and unadjusted. A household is defined as all people who occupy a housing unit, whether related or not, and this income
measurement usually is lower than family income since households often consist of just one individual. Real, inflation-adjusted
income rose to its highest point in 1998, then fell again and did not begin to rebound until 2005. In real terms, incomes have declined
since 2009.
Table 3-7 Eureka County Median Household Income
Year Unadjusted Inflation Adjusted-2012
1989 $29,916 $55,273
1993 $37,555 $59,543
1995 $35,680 $53,638
1997 $45,572 $65,051
1998 $49,626 $69,752
1999 $43,224 $59,490
2000 $43,821 $58,302
2001 $44,623 $57,726
2002 $40,991 $52,202
2003 $40,910 $50,938
2004 $42,790 $51,897
2005 $45,240 $54,240
2006 $47,459 $55,674
2007 $54,107 $63,472
2008 $55,090 $64,625
2009 $56,815 $66,648
2010 $61,400 $64,510
2011 $61,908 $62,837
2012 $61,331

Eureka County, Nevada Socioeconomic Conditions and Trends – UPDATE 2014 Page 3-13
The decline in Eureka County median household income from 2001 to 2004 can again be traced to mining activity and more
specifically slow down of activity at the Ruby Hill mine near Eureka. The downward trend in median household income in Eureka
County is not unlike the nation as a whole.
Figure 3-6 shows a comparison of median household income in Nevada, Eureka County, and nationwide in 1999 and 2011. Median
household income in Nevada as a whole was significantly lower than in Eureka County in both years. The County's median
household income exceeds the nation as a whole in 1999 and 2011.
Figure 3-7 shows median household income comparisons for Eureka County and Nevada. In each category, Eureka County median
income was higher than the State of Nevada in 2011. The earnings of male, full-time, year-round workers were significantly higher in
Eureka County than in Nevada as a whole. Female full-time workers on the other hand, earned less than in Nevada as a whole. U.S.
Census 2010 shows the overall poverty rate for families in Eureka County at 9.9 percent, for individuals at 16.2 percent.
Corresponding figures for Nevada as a whole were 8.6 percent for families and 14.9 percent for individuals.
The majority of Eureka County households, approximately 60 percent, had a level of income between $50,000 and $150,000
annually. These income levels generally correspond to working age adults (Figure 3-8).

Eureka County, Nevada Socioeconomic Conditions and Trends – UPDATE 2014 Page 3-14
$-
$10,000
$20,000
$30,000
$40,000
$50,000
$60,000
$70,000
$80,000
1989 1993 1995 1997 1998 1999 2000 2001 2002 2003 2004 2005 2006 2007 2008 2009 2010 2011 2012
Figure 3-5 Eureka County Median Household Income: 1993-2012
Unadjusted Inflation Adjusted-2012

Eureka County, Nevada Socioeconomic Conditions and Trends – UPDATE 2014 Page 3-15
$44,581
$61,400 $61,908 $61,331
$41,994
$55,726 $55,553
$50,949
$41,417
$51,914 $52,762 $51,371
$-
$10,000
$20,000
$30,000
$40,000
$50,000
$60,000
$70,000
1999 2010 2011 2012
Figure 3-6 Median Household Income 1999 and 2012
Eureka Co. Nevada United States

Eureka County, Nevada Socioeconomic Conditions and Trends – UPDATE 2014 Page 3-16
$64,418
$55,726
$44,926
$35,255
$75,179
$61,400
$54,625
$42,321
Median Family Income Median Household Income Male, Full-time Workers Female, Full-time Workers
Figure 3-7 Income Comparisons, Nevada and Eureka County, 2010
Nevada Eureka County
SOURCE: U.S. Census Bureau, American Community Survey: 2010 Table DP03

Eureka County, Nevada Socioeconomic Conditions and Trends – UPDATE 2014 Page 3-17
1.4%
5.1%
7.4%
13.8%
6.2%
16.1%
20.7%
22.8%
2.8% 3.9%
0.0%
5.0%
10.0%
15.0%
20.0%
25.0%
Less Than $10,000
$10,000 to $14,999
$15,000 to $24,999
$25,000 to $34,999
$35,000 to $49,999
$50,000 to $74,999
$75,000 to $99,999
$100,000 to 149,999
$150,000 to $199,999
$200,000 and over
% o
f T
ota
l P
op
ula
tio
n
Figure 3-8 Eureka County Median Household Income Distribution, 2010
SOURCE: U.S. Bureau of the Census, American Community Survey, Table DP03

Eureka County, Nevada Socioeconomic Conditions and Trends – UPDATE 2014 Page 3-18
Mining
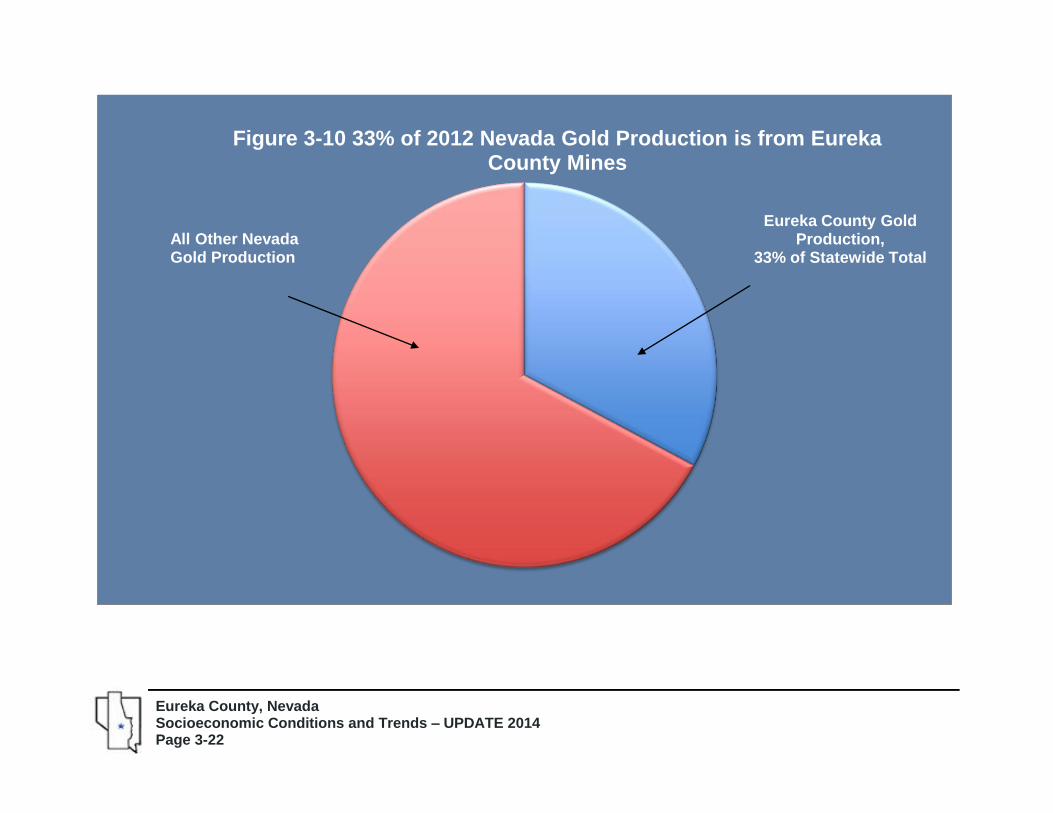
Gold mining continues as the principal economic engine of Eureka County. Over the period 1993 - 2012 there were three producing
gold mines in the county operating at different times. In 2002 Eureka County produced 37 percent of all gold produced in Nevada,
and in 2013 the county produced 33 percent of all Nevada gold. Two mine complexes in northern Eureka County continue to be
some of the most productive mines in Nevada and indeed in the entire country, with Newmont Mining Corporation's Carlin Trend
mines producing nearly 1.0 million ounces of gold in 2012, and Barrick Gold Corporation's Betze-Post Mine producing over .8 million
ounces in that year. Barrick is developing and has begun to mine deposits in the Cortez Hills and further south in Horse Canyon
area.
During the late 1990's, lower gold prices caused many Nevada mines to scale back exploration and to scale back or temporarily
close some operations. Since then the price of gold has again risen to over $600 per ounce in 2006 and reaching a peak of $1,900 in
2011. As a result of these higher gold prices, several Nevada gold mining operations are expanding both operations and exploration.
As of the end of 2012 Newmont Mining Corporation's Carlin trend mines had almost 18 million ounces of gold in proven and probable
reserves, an increase from 2010.
Barrick Gold Corporation describes the Goldstrike Property in northern Eureka County as its "flagship property." The mine is the
company's largest producer. The Goldstrike Property produced 892,000 ounces of gold in 2013 at all-in sustaining costs of $901 per
ounce. Goldstrike’s proven and probable mineral reserves as at December 31, 2013, were 10.7 million ounces of gold. In 2014, the
mine is expected to produce 865,000-915,000 of gold, which is consistent with 2013 levels. All-in sustaining costs are expected to be
in the range of $920-$950 per ounce.
The Ruby Hill mine is located on the Battle Mountain/Eureka gold trend, less than one kilometer from the town of Eureka and 193
kilometers south of the Goldstrike Property. Ruby Hill is an open-pit, heap leach operation. Ruby Hill produced 91,000 ounces of gold
in 2013 at all-in sustaining costs of $887 per ounce1. Proven and probable mineral reserves as at December 31, 2013, were 140,000
ounces of gold.
Barrick’s Cortez Hills located in southern Crescent Valley is producing gold from the leach pad and has started stripping the
pediment deposit that will join the Cortez Hills pit to make one open pit. The Cortez Pipeline project located just over the Eureka
County line in Lander County continues producing gold. The mine produced 1.34 million ounces of gold in 2013 at all-in sustaining
Eureka County, Nevada Socioeconomic Conditions and Trends – UPDATE 2014 Page 3-19
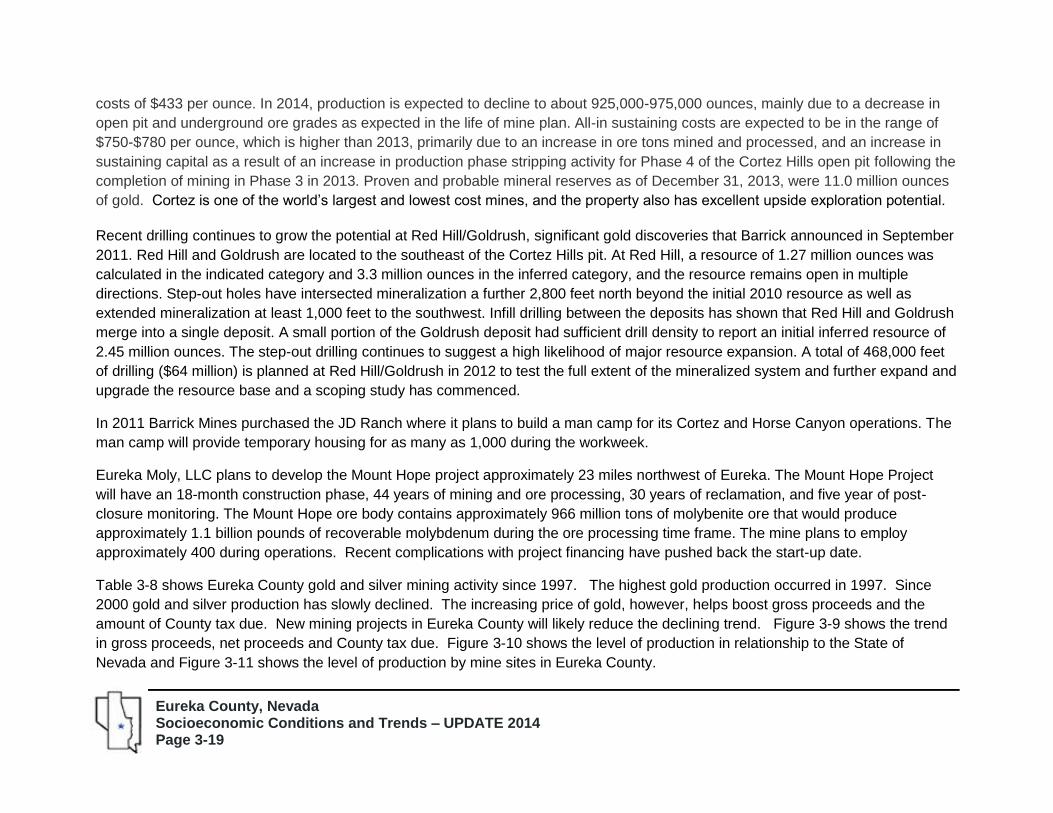
costs of $433 per ounce. In 2014, production is expected to decline to about 925,000-975,000 ounces, mainly due to a decrease in
open pit and underground ore grades as expected in the life of mine plan. All-in sustaining costs are expected to be in the range of
$750-$780 per ounce, which is higher than 2013, primarily due to an increase in ore tons mined and processed, and an increase in
sustaining capital as a result of an increase in production phase stripping activity for Phase 4 of the Cortez Hills open pit following the
completion of mining in Phase 3 in 2013. Proven and probable mineral reserves as of December 31, 2013, were 11.0 million ounces
of gold. Cortez is one of the world’s largest and lowest cost mines, and the property also has excellent upside exploration potential.
Recent drilling continues to grow the potential at Red Hill/Goldrush, significant gold discoveries that Barrick announced in September
2011. Red Hill and Goldrush are located to the southeast of the Cortez Hills pit. At Red Hill, a resource of 1.27 million ounces was
calculated in the indicated category and 3.3 million ounces in the inferred category, and the resource remains open in multiple
directions. Step-out holes have intersected mineralization a further 2,800 feet north beyond the initial 2010 resource as well as
extended mineralization at least 1,000 feet to the southwest. Infill drilling between the deposits has shown that Red Hill and Goldrush
merge into a single deposit. A small portion of the Goldrush deposit had sufficient drill density to report an initial inferred resource of
2.45 million ounces. The step-out drilling continues to suggest a high likelihood of major resource expansion. A total of 468,000 feet
of drilling ($64 million) is planned at Red Hill/Goldrush in 2012 to test the full extent of the mineralized system and further expand and
upgrade the resource base and a scoping study has commenced.
In 2011 Barrick Mines purchased the JD Ranch where it plans to build a man camp for its Cortez and Horse Canyon operations. The
man camp will provide temporary housing for as many as 1,000 during the workweek.
Eureka Moly, LLC plans to develop the Mount Hope project approximately 23 miles northwest of Eureka. The Mount Hope Project
will have an 18-month construction phase, 44 years of mining and ore processing, 30 years of reclamation, and five year of post-
closure monitoring. The Mount Hope ore body contains approximately 966 million tons of molybenite ore that would produce
approximately 1.1 billion pounds of recoverable molybdenum during the ore processing time frame. The mine plans to employ
approximately 400 during operations. Recent complications with project financing have pushed back the start-up date.
Table 3-8 shows Eureka County gold and silver mining activity since 1997. The highest gold production occurred in 1997. Since
2000 gold and silver production has slowly declined. The increasing price of gold, however, helps boost gross proceeds and the
amount of County tax due. New mining projects in Eureka County will likely reduce the declining trend. Figure 3-9 shows the trend
in gross proceeds, net proceeds and County tax due. Figure 3-10 shows the level of production in relationship to the State of
Nevada and Figure 3-11 shows the level of production by mine sites in Eureka County.

Eureka County, Nevada Socioeconomic Conditions and Trends – UPDATE 2014 Page 3-20
Table 3-8 Eureka County Gold and Silver Mining Profile, 1997-2012
Operations
Employees
Ounces Gold
Produced
Ounces Silver
Produced
Gross Proceeds
Net proceeds
County Tax Due
1997 3 3,615 3,441,551 183,716 $ 1,081,390,284 $ 263,248,542 $ 4,468,117.50
1998 3 3,321 3,190,574 216,836 $ 946,588,326 $ 185,631,362 $ 3,150,721.11
1999 3 2,794 2,619,801 295,582 $ 731,861,772 $ 117,763,439 $ 1,998,798.85
2000 3 3,056 3,480,498 152,154 $ 971,904,129 $ 185,654,627 $ 3,151,115.98
2001 3 2,668 3,095,696 375,426 $ 865,375,239 $ 81,252,216 $ 1,383,156.47
2002 3 2,678 2,880,734 414,460 $ 984,713,544 $ 76,095,179 $ 1,223,077.67
2003 3 2,681 2,664,962 318,273 $ 1,063,536,330 $ 207,305,771 $ 3,332,025.00
2004 3 2,756 2,518,569 451,412 $ 1,160,682,157 $ 248,186,052 $ 3,344,780.00
2005 3 3,040 2,913,598 341,406 $ 1,426,221,820 $ 270,408,434 $ 5,272,665.00
2006 3 3,371 2,742,956 290,245 $ 1,813,215,829 $ 458,613,325 $ 8,089,017.00
2007 3 3,423 2,680,304 418,166 $ 2,068,806,589 $ 568,268,997 $ 9,946,215.00
2008 3 3,491 2,704,022 309,712 $ 2,502,516,383 $ 898,248,335 $ 25,224,068.00
2009 3 3,310 2,178,305 385,277 $ 2,430,479,950 $ 773,595,408 $ 19,262,444.00
2010 3 3,694 1,899,864 251,637 $ 2,585,910,792 $ 996,181,387 $ 17,226,344.06
2011 3 3,958 1,766,596 214,264 $ 3,146,825,028 $1,289,232,577 $ 22,895,815.27
2012 3 4,245 1,841,908 327,157 $ 3,477,410,355 $1,618,768,722 $ 24,677,821.00 SOURCE: Nevada Department of Taxation, Net Proceeds of Minerals Bulletin Eureka County Assessor Nevada Bureau of Mines and Geology, Division of Minerals, Major Mines of Nevada 1998 – 2012
Overall, gold production and exploration in Eureka County will continue to be important over the next ten to twenty years. Producers
report increased costs, however, mostly due to energy costs. To address these rising costs, Newmont's Nevada operations built a
203- megawatt coal-fired power plant near the Carlin Trend. The company sells excess capacity from the plant.

Eureka County, Nevada Socioeconomic Conditions and Trends – UPDATE 2014 Page 3-21
$-
$5.0
$10.0
$15.0
$20.0
$25.0
$30.0
$-
$500.0
$1,000.0
$1,500.0
$2,000.0
$2,500.0
$3,000.0
$3,500.0
$4,000.0
1997 1998 1999 2000 2001 2002 2002 2003 2004 2005 2006 2007 2008 2009 2010 2011 2012
Co
un
ty T
ax D
ue (
$ m
illio
ns)
Go
rss a
nd
Net
Pro
ceed
s (
$ m
illio
ns)
Figure 3-9 Eureka County Proceeds of Minerals, 1997-2012
Gross Proceeds (Million) Net proceeds (Million) County Tax Due (Million)
SOURCE: Nevada Department of Taxation, Net Proceeds of Minerals Bulletins, 1997-2011
Eureka County, Nevada Socioeconomic Conditions and Trends – UPDATE 2014 Page 3-22
Figure 3-10 33% of 2012 Nevada Gold Production is from Eureka County Mines
All Other Nevada Gold Production
Eureka County Gold Production,
33% of Statewide Total

Eureka County, Nevada Socioeconomic Conditions and Trends – UPDATE 2014 Page 3-23
Figure 3-11 Gold Mining Output in Eureka County, 2012
Betze-Post Mine Eastern Nevada Operations-Carlin
Ruby Hill Mine

Eureka County, Nevada Socioeconomic Conditions and Trends – UPDATE 2014 Page 3-24
Other Mineral and Energy Resources
According to the Nevada Division of Minerals, Nevada's net oil production in 2013 was 335,671
down from 454,592 barrels (0.023% of total U.S. production) in 2006. There are 67 actively
producing wells in 16 fields in Railroad Valley (Nye County, 89.4%) and three fields in Pine Valley
(Eureka County, 10.6%). The North Willow Creek and Three Bars fields in Eureka County have
not produced oil in recent years (Table 3-9). Nevada ranked 28 out of the 32 oil producing states
in the country in 2012.
Eureka County's Blackburn Field was Nevada's fourth highest volume producer being surpassed
recently by Eagle Springs. The Blackburn field averaged 111 barrels of oil and per day.
According to the Nevada Bureau of Mines, discovery of oil in the "Wolverine" area of western Utah coupled with the high price of oil
has sparked renewed interest in oil exploration in eastern Nevada and western Utah. One of the larger projects is Eden Energy
Corporation's Noah Project. In 2004, Eden Energy of Vancouver, British Columbia, acquired a Participation Agreement with Nevada-
based Cedar Strat and also acquired about 211,000 acres in leases covering the Diamond Mountains along the border between
Eureka and White Pine Counties. From August 2004 to July 2008, Eden conducted an exploration program in Nevada, which
cumulated in the drilling of the Noah Federal #1 well in the spring of 2008. Though the well encountered its target formation, log
analysis and the lack of oil or gas shows did not support further testing the project was terminated. Subsequently, Eden assigned all
rights, title, and interests to partners in the project area.
Geothermal Energy
With a combination of extensive geothermal resources, producing geothermal power plants,
an ambitious state renewable portfolio standard (20% of electricity from renewable resources
by 2015) and federal production tax credits, Nevada is one of the most attractive states in the
country for geothermal power exploration and production.
Eureka County contains numerous warm and hot springs which may be potential geothermal
resources. A 2000 map prepared by the Nevada Bureau of Mines and Geology, Nevada
Geothermal Resources, shows over 40 hot or warm springs or wells in Eureka County.

Eureka County, Nevada Socioeconomic Conditions and Trends – UPDATE 2014 Page 3-25
Beowawe Power LLC operates a 16.6 megawatt geothermal power plant at Beowawe. It produced 136,717 mega watt hours in 2011.
The plant is situated on the Lander/Eureka County line. While a part of the facility is in Eureka County, the main building is in Lander
County, and the company holds a business license in Lander County.
Table 3-9 Oil Production in Eureka County (barrels)
Field (year Discovered) 1993 1994 1995 1996 1997 1998 1999 2000 2001 2002 2003 2004 Total*
Blackburn (1982) 599,85
7 576,85
3 435,97
5 239,93
4 151,15
1 112,008 89,400 78,136 68,899 62,412 54,623 51,371 5,045,734
Tomera Ranch (1987) 2,140 1,970 1,405 387 659 574 398 488 - 11,901 1,981 124 36,348
North Willow Creek (1988)
3,928 3,736 6,419 3,619 1,478 1,502 123 146 144 573 349 476 45,436
Three Bar (1990) 1,961 229 - - - - - - - - - - 23,837
* Includes pre-1993 production
SOURCE: Nevada Bureau of Mines and Geology Special Publication MI-2004, The Nevada Mineral Industry 2004
Oil Production in Eureka County (barrels)
Field (year Discovered) 2005 2006 2007 2008 2009 2010 2011 2012 2013 Total*
Blackburn (1982) 45,369 41,491 39,477 43,600 77,730 57,260 43,198 38,004 40,392 5,472,255
Tomera Ranch (1987) - - - - - - - 11,705 3,757 51,810
North Willow Creek (1988) 2,064 2,552 1,256 56 - - - - - 51,364
Three Bar (1990) - - - - - - - - - 23,837
* Includes pre-1993 production
SOURCE: Nevada Bureau of Mines and Geology Special Publication MI-2004, The Nevada Mineral Industry 2013

Eureka County, Nevada Socioeconomic Conditions and Trends – UPDATE 2014 Page 3-26
Agriculture
As shown in Table 3-10, principal agricultural commodities produced in Eureka County are cattle and hay. There were 86 farms or
ranches in the county in 2007 up from 73 farms in 2002, producing about $25 million in agricultural products. The total product sold is
nearly double in value as compared to 2002. The average per farm/ranch market value of agricultural products sold in 2002 was
$173,412 increasing to $290,877 in 2007.
The average estimated value of farm/ranch land, buildings and equipment per farm/ranch in 2002 was $967,886 compared to
$1,305,630 in 2007. There were 86 farm operators in the county, up from 85 in 1987. Sixty-five (65) of them reported farming as their
principal occupation, and 21 of them worked at least some days off the farm/ranch.
The Eureka County cattle and calves inventory fluctuated slightly between 25,000 and 26,000 head from 2008 to 2012 based upon
information collected by the National Agricultural Statistics. Alfalfa hay production declined from 2007 to 2012. Total production
declined from 104,000 tons in 2007 to 77,000 tons in 2011 with 4,000 fewer acres harvested. Also see the natural resources section
(Section 7.0) for data on livestock and crop production.

Eureka County, Nevada Socioeconomic Conditions and Trends – UPDATE 2014 Page 3-27
Table 3-10 Eureka County Agricultural Statistics, 1987, 1992, 1997, 2002, and 2007
Item 2007 2002 1997 1992 1987
Farms (number) 86 73 84 79 85
Land in farms (acres) 783,440 266,427 214,966 235,826 202,363
Land in farms - average size of farm (acres) 9,110 3,650 2,559 2,985 2,381
Estimated market value of land and buildings, average per farm (dollars) $1,305,630 $815,230 $881,263 $694,213 $455,800
Estimated market value of all machinery/equipment, avg./ farm (dollars) $218,521 $152,656 $117,875 $92,671 $81,250
Farms less than 500 acres 44 30 46 40 48
Farms more than 500 acres 42 43 38 39 37
Total cropland, harvested cropland (acres) 50,875 29,115 26,807 21,410 27,566
Irrigated land (acres) 34,340 42,034 48,530 23,917 28,606
Market value of agricultural products sold ($1,000) $25,015 $12,659 $13,133 $8,198 $8,603
Market value of agricultural products sold, average per farm (dollars) $290,877 $173,412 $156,344 $103,774 $101,210
Market value of crops sold ($1,000) (D) $8,945 $6,932 $4,869 $4,099
Market value of livestock sold ($1,000) (D) $3,714 $6,201 $3,329 $4,504
Farms by value of sales: less than $100,000 $36 $35 $48 $52 $59
Farms by value of sales: $100,000 or more $50 $38 $36 $27 $26
Total farm production expenses ($1,000) $17,847 9,646 8,590 6,656 6,967
Total farm production expenses, average per farm (dollars) $207,523 128,613 102,263 84,251 81,971
Net cash return from agricultural sales ($1,000) $7,697 (D) 4,543 1,542 1,635
Net cash return from agricultural sales, average per farm (dollars) $89,497 (D) 54,080 19,522 19,239
Operators by principal occupation: Farming 65 58 56 66 70
Operators by principal occupation: Other 21 15 28 13 15
Number of operators working some days off the farm 41 26 56 45 48
Livestock and poultry: Cattle and calves inventory (number) 24,384 17,207 23,908 14,940 15,337
Beef cows (number) 15,674 40 14,749 8,738 9,146
Milk cows (number) 9 (D) 11 10 26
Cattle and calves sold (number) 15,904 43 13,905 6,812 8,436
Hay- (acres) 34,940 29,070 26,917 20,542 26,136
Hay- (tons, dry) 144,135 105,788 99,604 74,054 75,326 SOURCE: National Agricultural Statistics Service, 2007, 2002 & 1997 Census of Agriculture (D) Withheld to avoid disclosing data for individual farms

Eureka County, Nevada Socioeconomic Conditions and Trends – UPDATE 2014 Page 3-28
Taxable Sales
Total taxable sales in Eureka County fluctuate with mining activity and general economic conditions. In FY 2006-07 taxable sales in
Eureka hit an all-time high exceeding $500 million. Since that time, taxable sales have declined to around $370 million annually
(Figure 3-12). In 2013 (June 30, 2013), taxable sales reached $370.5 million. Mining related sectors drive the largest gains in taxable
sales. The traditional and local generators of taxable sales such as wholesale and retail trade are not well developed in Eureka
County.
Taxable sales in Eureka County with an overall increase over a ten -year period were metal mining, chemicals and allied products,
business services, miscellaneous repair services, business services, and automotive repair and services (Table 3-11). As shown in
the Table 3-11, many of Eureka County’s top taxable sales generators are associated with mining activity. Within the State of Nevada
wholesale and retail trade, food and beverage and general merchandise account for most of the taxable sales. In Eureka County,
those economic sectors are not well developed which also results in a significant amount of retail leakage as residents purchase
goods and services outside the County.

Eureka County, Nevada Socioeconomic Conditions and Trends – UPDATE 2014 Page 3-29
-
100
200
300
400
500
600
FY 95-96
FY 96-97
FY 97-98
FY 98-99
FY 99-00
FY 00-01
FY 01-02
FY 02-03
FY 03-04
FY 04-05
FY 05-06
FY 06-07
FY 07-08
FY 08-09
FY 09-10
FY 10-11
FY 11-12
FY12-13
Taxable
Sale
s (
Mill
ions)
Fiscal Year
Figure 3-12 Eureka County Taxable Sales, FY 95-96 to FY 12-13
Metal Mining
Total Taxable Sales All Others

Eureka County, Nevada Socioeconomic Conditions and Trends – UPDATE 2014 Page 3-30
Table 3-11 Top 30 Taxable Sales Activity by Business Sector Eureka County 2006 - 2013 Category 2006 2007 2008 2009 2010 2011 2012 2013
Mining (except Oil and Gas) $99,462,555 $116,960,524 $88,080,806 $81,496,869 $73,643,530 $79,770,728 $117,891,205 $102,257,308
Machinery Manufacturing $89,968,479 $163,813,161 $39,787,426 $27,810,942 $27,321,275 $29,856,288 $35,527,847 $36,079,912
Chemical Manufacturing $22,279,597 $20,174,457 $25,785,619 $26,690,852 $28,571,199 $36,190,283 $38,559,883 $41,218,478
Merchant Wholesalers, Durable Goods $21,575,476 $47,530,107 $46,479,638 $36,210,857 $32,020,859 $33,104,070 $60,132,116 $50,025,111
Administrative and Support Services $15,642,430 $5,083,317 $1,475,296 $615,762 $608,154 $605,899 $400,494 $1,032,375
Repair and Maintenance $11,426,513 $3,605,135 $3,423,617 $2,997,756 $3,400,555 $2,624,199 $5,449,049 $3,829,760
Specialty Trade Contractors $ 8,224,934 $34,403,181 $16,346,967 $8,636,650 $4,755,173 $9,595,075 $9,227,891 $9,408,531
Motor Vehicle and Parts Dealers $ 7,771,320 $9,269,390 $8,260,995 $13,285,281 $10,096,478 $16,413,589 $20,648,125 $23,898,894
Miscellaneous Manufacturing $ 7,161,255 $23,429,091 $27,038,872 $27,326,543 $22,553,262 $23,574,701 $29,930,977 $35,530,068
Support Activities for Mining $ 4,295,462 $61,464,751 $25,634,326 $25,751,587 $27,660,320 $34,325,374 $2,370,327 $5,070,496
Miscellaneous Store Retailers $ 3,805,734 $335,839 $1,052,874 $1,294,434 $517,733 $487,376 $322,914 $311,446
Nonmetallic Mineral Product Mfg. $ 3,758,546 $3,925,206 $885,165 $2,708,866 $4,794,420 $4,263,754 $8,364,732 $12,346,573
Merchant Wholesalers, Nondurable Goods $ 3,325,771 $2,797,607 $4,799,038 $6,047,961 $5,404,715 $5,716,510 $8,785,364 $7,753,778
Building Material & Garden Equip. and Sup $ 3,227,708 $3,622,500 $4,271,390 $4,388,198 $3,333,992 $4,160,994 $5,328,532 $8,354,543
Utilities $ 2,488,464 $1,787,565 $2,042,519 $2,321,160 $721,454 $1,660,777 $717,294 $357,927
Fabricated Metal Product Manufacturing $ 2,014,425 $29,610,605 $11,283,832 $3,063,303 $2,192,101 $2,915,142 $3,039,490 $4,929,452
Heavy and Civil Engineering Construction $ 1,614,837 $570,148 $1,069,257 $383,250 $2,029,152 $116,173 $1,412,353 $1,266,088
Oil and Gas Extraction $ 1,231,374 $- $- $- $- $- $6,792 $2,589
Food Services and Drinking Places $968,507 $688,225 $731,065 $1,170,274 $1,410,778 $1,159,640 $1,204,949 $1,324,537
Rental and Leasing Services $915,083 $3,408,577 $1,960,604 $2,393,812 $1,992,197 $3,596,345 $2,636,553 $4,130,287
Food and Beverage Stores $794,938 $1,074,182 $859,833 $1,118,268 $1,095,498 $1,183,155 $1,345,699 $1,406,729
Amusement, Gambling, and Rec.Industries $565,639 $636,288 $718,263 $449,822 $38,955 $ 92,751 $54,521 $5,255
Support Activities for Transportation $466,370 $7,012,963 $5,634,214 $1,295 $ 5,603 $3,334 $21,982 $3,057
Motion Picture and Sound Recording Ind. $461,091 $2,464,955 $144,297 $109,385 $82,331 $208,506 $- $
Rail Transportation $447,120 $1,163,085 $832,581 $672,202 $1,102,196 $1,622,754 $1,086,828 $1,479,761
Construction of Buildings $336,076 $257,965 $671,324 $200,703 $255,429 $302,028 $964,127 $5,482,286
Health and Personal Care Stores $167,078 $3,733,110 $1,864,095 $2,546,422 $344,242 $229,042 $148,695 $85,059
General Merchandise Stores $166,563 $668,551 $971,335 $502,567 $301,352 $172,729 $232,590 $265,709
Non-store Retailers $134,413 $2,738,778 $3,173,172 $1,696,952 $3,009,661 $3,692,404 $3,410,236 $2,966,298
Professional, Scientific, and Tech.Services $ 81,563 $1,397,810 $498,498 $298,203 $289,027 $272,694 $1,116,723 $654,195
Petroleum and Coal Products Mfg. $ 44,264 $334,664 $1,054,578 $830,515 $1,129,103 $626,425 $561,941 $224,566

Eureka County, Nevada Socioeconomic Conditions and Trends – UPDATE 2014 Page 3-31
Travel, Tourism and Economic Development
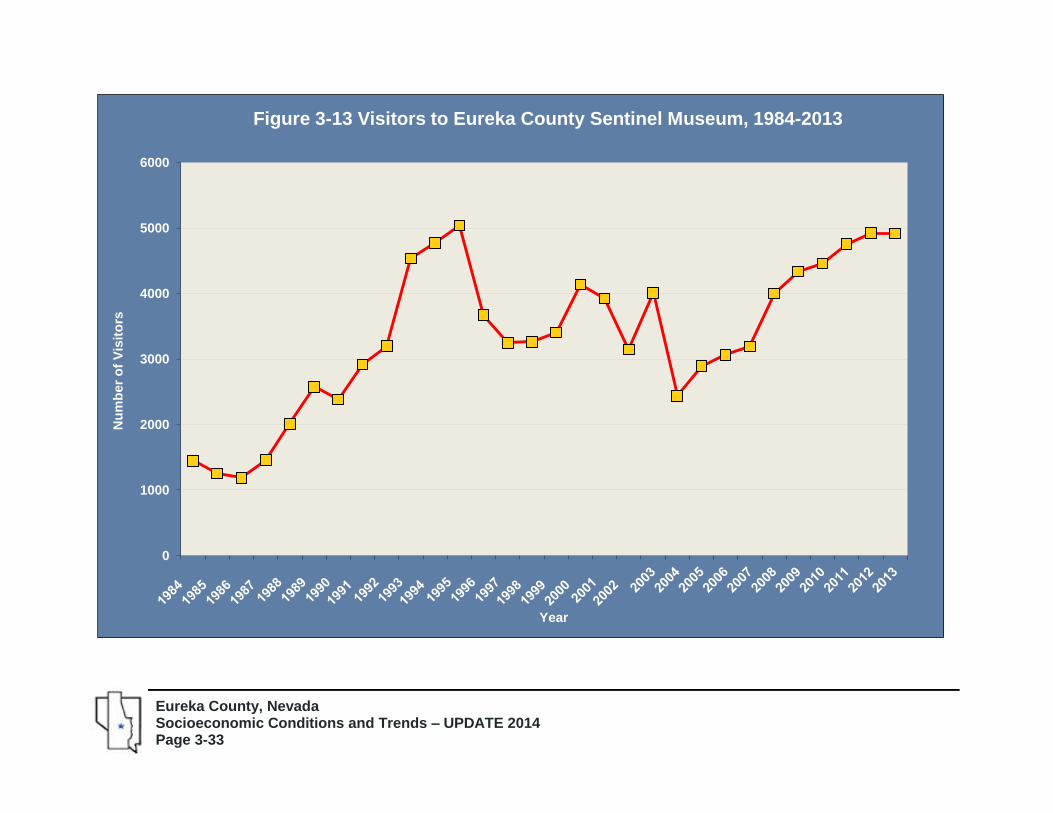
The Eureka Sentinel Museum is located in the 1879 Eureka Sentinel Newspaper Building, site of
the town's longest running newspaper. The museum displays artifacts from Eureka's 1870s
mining era and contains a complete nineteenth century press room. The ground floor of the
building was made into a county historical museum in 1982, and in the year 2000 the museum
expanded to include both floors of the building. The museum is open seven days a week from
May through October. Visitation to the museum has been increasing over the two decades since
its opening, but not steadily. Visitation to the museum reached a high of 5,083 visitors in 1995,
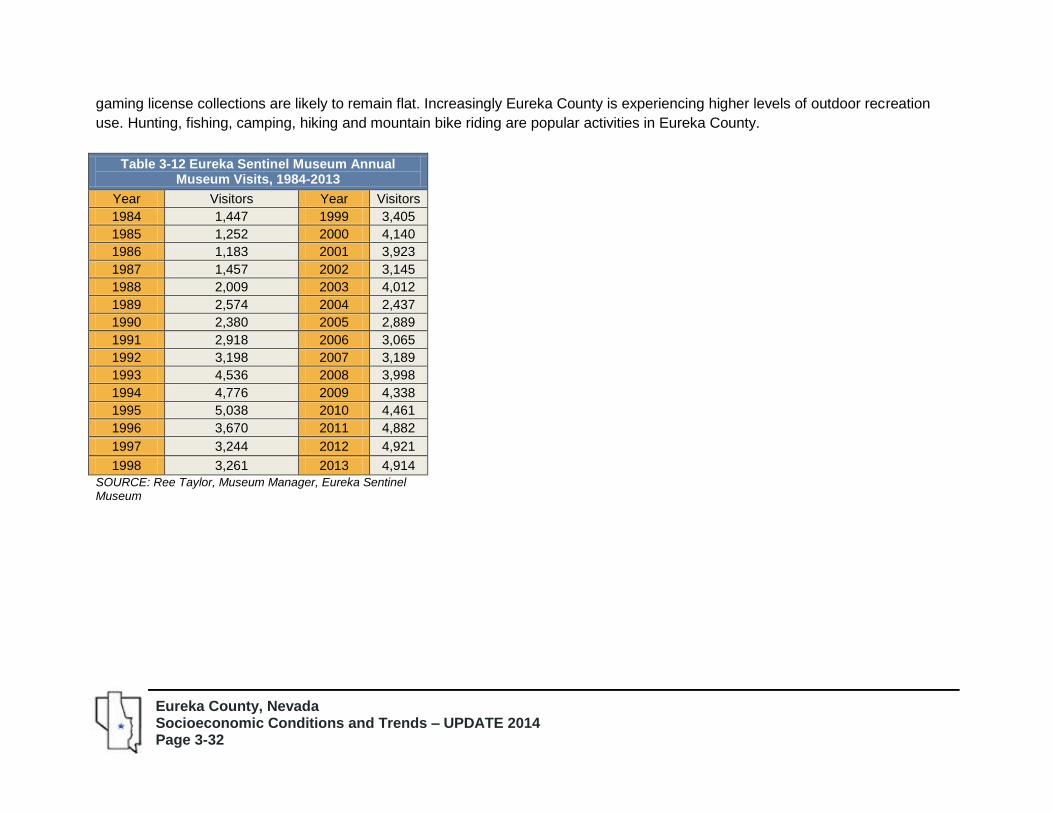
and then declined in subsequent years. In 2013, total visitation reached 4,914 (Table 3-12). The
trend in visitation is shown in Figure 3-13. It should be noted that approximately one-third of all
visitors do not sign into the museum. As a result, total visitation is probably understated.
The museum is an important part of Eureka's historical and architectural heritage, and as such serves as an indicator of the potential
for development of historical tourism in the region. Visitation to the museum also is a rough indicator of the current level of tourism in
the town. The museum is within the Eureka Historic District, designated in 1973. Also in the historic district is the Eureka Opera
House, built in 1880 and restored in 1994.
Eureka County continues to pursue diversified economic development. In Eureka County's 2011 Comprehensive Annual Report this
effort is summarized as follows: "The County continues to look to other industries such as tourism and agriculture for possible
economic development. With the preservation of many historic buildings, the County hopes tourism will be enhanced. The County is
still providing the community with Internet access and a county web page is available at www.co.eureka.nv.us.
Two other measures of county economic activity are room tax (Table 3-13), gaming license collections (Table 3-14) and real estate
sales. Eureka County has 88 motel rooms, 6 eating establishments, 5 gaming and entertainment establishments, and 3 RV parks.
Room tax collections continue to climb nearing $100,000 annually. Future increases in room tax revenues will depend upon the total
number of hotel rooms in the County and the rates charged. In 2011, occupancy rates were very high due to mining exploration,
construction and operating activity.
Gaming license collections have remained steady, albeit with a large jump in collections in 2001. Unless increased licensing occurs,
Eureka County, Nevada Socioeconomic Conditions and Trends – UPDATE 2014 Page 3-32
gaming license collections are likely to remain flat. Increasingly Eureka County is experiencing higher levels of outdoor recreation
use. Hunting, fishing, camping, hiking and mountain bike riding are popular activities in Eureka County.
Table 3-12 Eureka Sentinel Museum Annual Museum Visits, 1984-2013
Year Visitors Year Visitors
1984 1,447 1999 3,405
1985 1,252 2000 4,140
1986 1,183 2001 3,923
1987 1,457 2002 3,145
1988 2,009 2003 4,012
1989 2,574 2004 2,437
1990 2,380 2005 2,889
1991 2,918 2006 3,065
1992 3,198 2007 3,189
1993 4,536 2008 3,998
1994 4,776 2009 4,338
1995 5,038 2010 4,461
1996 3,670 2011 4,882
1997 3,244 2012 4,921
1998 3,261 2013 4,914
SOURCE: Ree Taylor, Museum Manager, Eureka Sentinel Museum
Eureka County, Nevada Socioeconomic Conditions and Trends – UPDATE 2014 Page 3-33
0
1000
2000
3000
4000
5000
6000
Nu
mb
er
of
Vis
ito
rs
Year
Figure 3-13 Visitors to Eureka County Sentinel Museum, 1984-2013

Eureka County, Nevada Socioeconomic Conditions and Trends – UPDATE 2014 Page 3-34
Figure 3-14 and Table 3-15 show the average daily traffic counts on Eureka County highways. U.S. Highway 50 serves central and
southern Eureka County, accommodating not only local traffic, but long-distance travel through central Nevada. State Route 278, the
Eureka-Carlin Road, serves as a link between northern and southern Eureka County, as well as access to Interstate Highway 80 and
the City of Elko. State Route 306 provides access to Crescent Valley. Interstate 80, in the northern section of the county, is one of
the nation's principle interstate highways. Highway 50 traffic increased annually with periodic declines. Peaks in traffic volume
typically correspond to mining activity in the area. Traffic on SR 278 increased to 2001, then decreased again by 2004. Average daily
traffic on Interstate 80 grew until 2000, and then diminished somewhat in subsequent years before rebounding.
Table 3-14 Eureka County Gaming Tax & License Collections, 1993-2013
License Gaming Tax
1993 $ 1,875 -
1994 $ 2,461 -
1995 $ 1,755 -
1996 $ 2,470 -
1997 $ 1,785 -
1998 $ 2,467 -
1999 $ 2,422 -
2000 $ 2,077 $95,761
2001 $ 13,424 $158,732
2002 $ 2,835 $163,194
2003 $ 2,500 $157,847
2004 $ 2,958 $161,137
2005 $ 3,000 $158,346
2006 $ 2,972 $154,252
2007 $ 2,856 $163,674
2008 $ 2,276 $153,686
2009 $ 2,112 $150,085
2010 $ 2,340 $147,320
2011 $ 2,220 $115,338
2012 $2,340 $174,203
2013 $2,339 $139,572
SOURCE: County of Eureka Comprehensive Annual Financial Report, 1993-2013
Table 3-13 Eureka County Room Tax Collections, 1993-2013
1993 $ 22,411
1994 $ 24,219
1995 $ 28,450
1996 $ 22,450
1997 $ 31,744
1998 $ 31,946
1999 $ 43,608
2000 $ 49,688
2001 $ 54,795
2002 $ 59,600
2003 $ 50,854
2004 $ 60,441
2005 $ 59,771
2006 $ 71,351
2007 $ 100,110
2008 $ 98,389
2009 $ 84,589
2010 $ 93,524
2011 $ 98,769
2012 $101,632
2013 $97,461 SOURCE: County of Eureka Comprehensive Annual Financial Report, 1993 - 2013

Eureka County, Nevada Socioeconomic Conditions and Trends – UPDATE 2014 Page 3-35
-
1,000
2,000
3,000
4,000
5,000
6,000
7,000
8,000
1993 1994 1995 1996 1997 1998 1999 2000 2001 2002 2003 2004 2005 2006 2007 2008 2009 2010 2011 2012
Veh
icle
s
Year
Figure 3-14 Annual Average Daily Traffic 1993-2012 Eureka County Roads/Highways
Interstate 80
U.S. 50 Eureka Town
U.S. 50 Rural
State Route 278
State Route 306

Eureka County, Nevada Socioeconomic Conditions and Trends – UPDATE 2014 Page 3-36
Table 3-15 Annual Average Daily Traffic (AADT) Counts on Selected Eureka County Roads
U.S. 50 Rural
(1) U.S. 50 Eureka Town
(2) State Route 278, Eureka-Carlin Road
(3) Interstate 80 (4)
State Route 306 Gold Acres Road (5)
1993 690 1,645 365 5,435 305
1994 700 1,890 450 5,660 365
1995 775 1,760 360 5,745 445
1996 750 1,810 425 6,005 860
1997 750 1,810 590 5,955 575
1998 790 2,150 590 6,020 480
1999 750 2,250 520 6,790 440
2000 720 1,900 570 6,770 450
2001 870 1,900 650 6,550 450
2002 740 2,150 490 6,610 470
2003 720 1,800 600 6,500 870
2004 660 1,800 530 6,600 1,050
2005 740 1,900 640 6,600 900
2006 760 1,950 580 6,850 800
2007 720 2,000 600 7,600 880
2008 720 1,900 740 6,500 920
2009 770 2,000 610 6,800 1,500
2010 750 2,000 490 7,200 1,300
2011 790 2,000 510 7,200 1,300
2012 800 1,200* 500 6,900 1,500
*

Eureka County, Nevada Socioeconomic Conditions and Trends – UPDATE 2014 Page 3-37
Fluctuations in traffic counts also reflect national economic conditions and factors which directly affect vehicle traffic such as fuel
prices. The recession of 2008 has had long lasting impacts on average daily traffic counts. At the same time, mining activity in the
region has increased offsetting some of the impacts from national economic conditions. The traffic counts on the rural section of the
highway, therefore, more closely represent through traffic on U.S. Highway 50. Since this traffic count would include recreationists,
tourists, and other travelers, it is a possibly a measure of previous economic development efforts targeting out-of-area visitors, as
well as one estimate of the size of market for any potential visitor-or-tourism-related economic development efforts. In comparison to
other rural principal arterials in Nevada, U.S. Highway 50 in the Eureka vicinity receives a mid-range of traffic. Table 3-16 shows
traffic counts on selected sections of other rural Nevada arterials.
Table 3-16 Traffic Counts on Selected Rural Nevada Arterials, 2002, 2004, 2010 and 2012
Location 2002 Average Annual Daily Traffic
2004 Average Annual Daily Traffic
2010 Average Annual Daily Traffic
2012 Average Annual Daily
Traffic
US 93, White Pine County S. of US 6 & 50 430 480 330 350
U.S. 6, Nye County by Tonopah Test Site 210 210 220 250
US 50, Eureka County 740 660 750 800
US 95, Humboldt County S. of McDermitt 1,550 1,850 2,200 2,100
US 95, Mineral County N. of Schurz 2,170 2,600 2,500 2,300
SOURCE: Nevada Department of Transportation, Annual Traffic Report

Eureka County, Nevada Socioeconomic Conditions and Trends – UPDATE 2014 Page 3-38
References:
1. Eureka County Employment Regional Economic Accounts. U.S. Department of Commerce, Bureau of Economic Analysis QWI Nevada County Pivot Reports, Eureka - Quarterly Workforce Indicators. Last revised June 19, 2006. U.S. Census Bureau, Local Employment Dynamics, QWI Online (NAICS), LEHD State of Nevada County Reports - (Selected: Year, industry, Total Employement, years 2001-2005). 31 July 2006. http://lehd.dsd.census.gov/led/datatools/qwiapp.html Quarterly Census of Employment and Wages, Eureka County, Years 2002-2011. Nevada Department of Employment Training and Rehabilitation, Nevada Workplace Informer, Annual, NAICS. http://www.nevadaworkforce.com/cgi/dataanalysis/?PAGEID=94> 2. Labor Force Data & Resident Labor Force vs. Jobs in Eureka County Employment, Labor Force, Unemployment, Unemployment Rate, Eureka County, Annual, 2002-2011. Nevada Department of Employment Training and Rehabilitation (DETR), Information Development & Processing Division, Research & Analysis Bureau, "Nevada Workforce Informer" web page. http://www.nevadaworkforce.com/ Unemployment Rate, United States and Nevada, Annual, 2002-2011. Nevada Department of Employment Training and Rehabilitation (DETR), Information Development & Processing Division, Research & Analysis Bureau, "Nevada Workforce Informer" web page. http://www.nevadaworkforce.com/ Labor Force Eureka County 1993-2011. Nevada Department of Employment, Training & Rehabilitation, Nevada Workforce Informer, Data Analysis, Labor Force and Unemployment. 1 August 2006. http://www.nevadaworkforce.com/cgi/dataanalysis/?PAGEID=94 Total Full Time and Part Time Employment by Industry, Eureka, NV. 25 April 2006. U.S. Department of Commerce, Bureau of Economic Analysis, Regional Economic Accounts, Annual Estimates for Counties, Interactive Tables. 1 August 2006. http://www.bea.gov/bea/regional/data.htm
Eureka County, Nevada Socioeconomic Conditions and Trends – UPDATE 2014 Page 3-39
3. Commuting Patterns in Eureka County Historical Data for Commuting Patterns in Eureka County. Nevada Department of Employment, Training & Rehabilitation, (updated every 10 years) Nevada Workforce Informer, Workforce Info, Eureka County Profile. 1 August 2006. http://www.nevadaworkforce.com/cgi/dataanalysis/?PAGEID=94&SUBID=115 4. Eureka County Components of Personal Income & Per Capita Income Personal Income by Major Source and Earning by Industry. 2010. U.S. Department of Commerce, Bureau of Economic Analysis, Regional Economic Accounts. 1 August 2006. http://www.bea.gov/bea/regional/data.htm 5. Eureka County Median Household Income Median Household Income, Eureka County, NV. Nevada Department of Employment, Training & Rehabilitation, Nevada Workforce Informer, Workforce Info, Eureka County Profile. 17 August 2006. http://www.nevadaworkforce.com/cgi/dataanalysis/
6. Gold Mining Profile
The Nevada Mineral Industry, 2004 & 2005. Nevada Bureau of Mines and Geology, Special Publication MI-2004. David A. Davis. 2
August 2006
Major Mines of Nevada, 2010. Nevada Bureau of Mines and Geology, Special Publication P-22. Doug Driesner and Alan Coyner,
2011
Net Proceeds of Materials Bulletin, 2004 -2011. 20 April 2006. Nevada Department of Taxation. 2 August 2006.
http://tax.state.nv.us/documents/AnnualReport_FY11_final.pdf
http://tax.state.nv.us/DOAS_FORMS/2012-2013%20Redbook.pdf

Eureka County, Nevada Socioeconomic Conditions and Trends – UPDATE 2014 Page 3-40
Investing in the 21st Century (2005 Annual Report) Newmont Mining Corporation
Barrick Gold Corporation — Global Operations, North America, Goldstrike, East Archimedes
7. Other Minerals and Energy Resources The Nevada Mineral Industry 2004, Nevada Bureau of Mines and Geology Special Publication MI-2004 Nevada Geothermal Power Plants, May 5, 2006, Nevada Division of Minerals Nevada Geothermal Update, August 2006, Nevada Division of Minerals Nevada Geothermal Resources (map) Shevenell, Lisa, Larry Garside and Ronald H. Hesse, Nevada Bureau of Mines and Geology, 2000. IGMI Projects information, Mount Hope, Idaho General Mines, Inc, http://www.eurekamoly.com/ http://www.nbmg.unr.edu/dox/mi/10.pdf 8. Eureka County Agricultural Statistics 2007, 2002, 1997 & 1992 Census of Agriculture. U.S. Department of Agriculture, National Agriculture Statistics Service. http://www.agcensus.usda.gov/Publications/2007/index.php
http://www.nass.usda.gov/Statistics_by_State/Nevada/index.asp 9. Eureka County Taxable Sales Combined Sales/Use Tax Statistical Report, FY97-FY12. July 2012. Nevada Department of Taxation, Department of Taxation Publications, Annual Taxable Sales Statistics.
http://tax.state.nv.us/documents/SUT_Stat_July_12.pdf

Eureka County, Nevada Socioeconomic Conditions and Trends – UPDATE 2014 Page 3-41
10. Eureka Sentinel Museum Visitors Source: Colleen Nielsen, Director, and Ree Taylor, Museum Manager. Eureka Sentinel Museum http://www.co.eureka.nv.us/tourism/museum01.htm 11. Room Tax and Gaming Tax Collections Comprehensive Annual Financial Report, County of Eureka, State of Nevada 2003-2011. 30 June 2003 - 30 June 2011. Mike Rebaleati, Eureka County Recorder/Auditor Department.
12. Annual Average Daily Traffic Counts on Selected Eureka County Roads & Traffic Counts on Selected Rural Nevada
Arterials
Annual Traffic Report. Nevada Department of Transportation, Reports and Publications, Annual Traffic Report. Various years.