3.1 company history - thesis.binus.ac.idthesis.binus.ac.id/doc/bab3/bab 3_09-161.pdfdependence on...
TRANSCRIPT

28
CHAPTER III COMPANY’S BACKGROUND AND
RESEARCH METHODOLOGY
3.1 Company History
PT Pura Daya Prima (PDP) is an Independent Power Producer (IPP) that was
established on March 30, 2005 based on Company Deed No. 34. This
Company was formed to fulfill the need for electric power in Sumatera area,
particularly to support power system capacity balance of PT PLN (Persero)
WS2JB, which was determined as power crisis area based on the Regulation
of the Minister of Energy and Mineral Resources No. 482-12/40/600.2/2006.
In addition, the Government through PT PLN (Persero) tried to reduce
dependence on diesel fuel power plant with gas fuel power plant or other
renewable energy.
Based on the contract on sale and purchase of power between PT PLN
(Persero) WS2JB and PDP, PDP is obliged to distribute power energy with
capacity of 13.83 MW for 20 years. In order to fulfill its obligation, the
company entered into a contract of EPC Gas Turbine 3 x 4.7 MW with
Turbomach, which is a subsidiary of Caterpillar that is engaged in power
generation field and domiciled in Swiss. To operate its generator, PDP uses

29
gas fuel from Pertamina EP based on the Agreement on Sale and Purchase of
Gas (PJBG) executed on May 30, 2006.
This gas electric power plant (PLTG) 13.83 MW is situated at Jl. Yusuf
Singadikane Km 10.7, Jembatan Musi II, Kertapati Sub-district, Palembang
Municipality. Since its location was close to Musi 2 bridge, this power plant
was named PLTG Musi 2. PLTG Musi 2 started its commercial operation on
June 24, 2006 by distributing its power energy to Palembang and its
surroundings.
As we know, the main fuel for PLTG Musi 2 operation is gas. The gas is
obtained from gas fields of PT Pertamina situated in the local area and
distributed to PLTG Musi 2 through the existing line (pipeline) owned by PT
Pertamina that is used to supply fuel to the fertilizer plant PT PUSRI
(Persero). In order to fulfill the need for fuel, PDP has obtained confirmation
on gas availability from PT Pertamina for 10 years that is extendible.
In order to maintain reliability of operation and power quality of PLTG Musi
2, PDP entered into a Full Maintenance Contract with Turbomach for 15
years. The contract covers planned maintenance every 4000 hours of
operation, maintenance during trouble/preventive maintenance, and gas
turbine overhaul performed after the power plant operates for 30,000 hours.

30
At present, the company is developing. The capacity of PLTG 13.83 MW is
increased to become a Combined Cycle Power Plant with capacity of 19.83
MW, by adding steam turbine engine that the fuel thereof uses exhaust heat
from the existing gas turbine. This is performed by the company with the
purpose of improving efficiency of the power plant and increasing power
energy supply in Palembang.
Company’s Vision:
To become a leading national-scale company in power and energy field.
Company’s Mission:
1. To give maximum contribution to the State of Indonesia in overcoming
power and energy crisis;
2. To improve power availability and quality;
3. To open employment opportunities and improve living standard of
surrounding people.
31
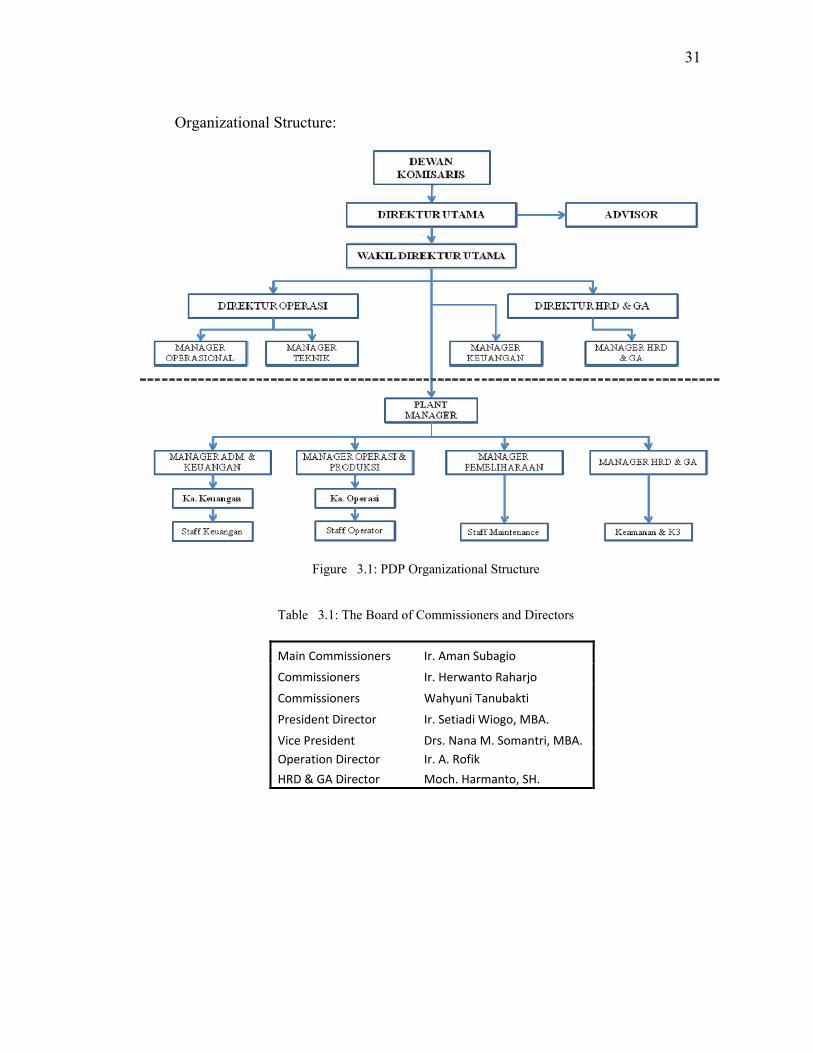
Organizational Structure:
Figure 13.1: PDP Organizational Structure
Table 13.1: The Board of Commissioners and Directors
Main Commissioners Ir. Aman Subagio
Commissioners Ir. Herwanto Raharjo
Commissioners Wahyuni Tanubakti
President Director Ir. Setiadi Wiogo, MBA.
Vice President Drs. Nana M. Somantri, MBA. Operation Director Ir. A. Rofik
HRD & GA Director Moch. Harmanto, SH.

32
3.2 Industrial Background
3.2.1 Electricity System in Indonesia
Indonesian Electricity Overview:
o Indonesia Electricity Ratio in 2004 is 54.8%.
o Total power plant in Indonesia is 25.218 MW which consist of 21.768
MW (86,3%) owned by PLN and 3.450 MW (13,7%) owned by
Independent Power Producer
o The electricity demand grows about 6 -9% each year in the past 10
years.
o In 2004, kWh production composition that uses oil for fuel
consumption is 27%, but reaches 65% of the total cost of fuel.
o Efficiency is higher by changing fuel oil with another fuel like gas,
coal and biofuel.
To give a brighter picture of the Indonesian electricity, we give the
following picture which is an Electricity Map from National
Coalaboration Seminar 2006, by Mr Tomy Agus, Prime Energy Director
Deputy PT PLN (Persero)

33
Figure 23.2: Indonesia Electricity Map 2004, 2010
3.2.2 Current Condition of Sumatra Power System 2000-2005
3.2.2.1 Installed Capacity of Southern Sumatera
Generation installed capacity of PLN Southern Sumatera System in
2005 is 1,799.4 MW with a growth of 2.31% from 2000. From the
figure, 385.3 MW or 21.5 % are generated by isolated power plants,
operated by PLN regions. The generated power in 2005 consists of
485.0 MW (27.0%) by steam PP, 390.5 MW (21.7 %) by hydro PP,

34
314.8 MW (17.5%) by gas PP and the rest by diesel PP. Table 3.2.
shows the growth of generation capacity in South Sumatera System.
Table 23.2: Installed Capacity of PLN Southern Sumatera 2000 – 2005
Plant Type
Unit 2000 2001 2002 2003 2004 2005
Hydro PP MW 272.5 362.5 390.5 390.5 390.5 390.5% 17.0 21.2 22.7 22.6 22.0 21.7
Diesel PP MW 240.0 241.1 219.8 218.4 283.8 219.8% 15.0 14.1 12.8 12.6 16.0 12.2
Gas PP MW 213.5 234.8 234.8 234.8 210.8 314.8% 13.3 13.7 13.7 13.6 11.9 17.5
CC PP MW - - - - - -% - - - - - -
Steam PP MW 485.0 485.0 485.0 485.0 485.0 485.0% 30.3 28.3 28.2 28.1 27.4 27.0
PLN Regions
MW 390.66 389.70 387.39 398.78 402.11 385.31% 24.4 22.7 22.6 23.1 22.7 21.5
TOTAL MW 1,601.6 1,713.1 1,717.4 1,727.5 1,772.2 1,795.4% 100.0 100.0 100.0 100.0 100.0 100.0
3.2.2.2 Energy Production of Southern Sumatera
The growth of energy production of Southern Sumatera System,
included power produced by diesel PP operated by PLN Region,
from 2000 – 2005 is only 5.59%, i.e., from 5,723.6 GWh to 7,512.0
GWh. Energy production of the region from period 2000 – 2005 is
shown as Table 3.2. The table also shows owing to deficit in
generation, PLN South Generation has to purchase energy from third

35
parties, from only 22.3 GWh in 2003 to 338.7 GWh in 2005. For the
future Southern Sumatera, have more advantage to become the bigger
energy product area in Sumatera System because of fuel resources in
there.
Table 33.3: Southern Sumatera Energy Production 2000 – 2005
Fuel Type Unit 2000 2001 2002 2003 2004 2005
Oil GWh 1,044.7 1,019.1 1,259.6 1,045.8 1,307.8 524.5 % 18.3 16.1 19.3 15.4 17.7 7.0 Hydropower GWh 965.4 1,195.8 1,106.4 1,699.7 1,563.1 1,688.6 % 16.9 18.9 16.9 25.1 21.2 22.5 Coal GWh 2,598.4 2,767.4 2,713.3 2,367.2 2,313.3 2,932.3 % 45.4 43.7 41.5 34.9 31.4 39.0 Geothermal GWh - - - - - 790.5 % - - - - - 10.5 Natural Gas GWh 38.8 199.0 285.4 439.4 683.9 788.7 % 0.7 3.1 4.4 6.5 9.3 10.5 Purchased GWh - 1.2 - 22.3 306.8 338.7 % - 0.0 - 0.3 4.2 4.5 PLN Region - Oil GWh 1,049.9 1,140.6 1,051.8 1,101.3 1,130.5 1,192.2 % 18.3 18.0 16.1 16.3 15.3 15.9 - Hydropower GWh 2.6 0.9 1.7 0.1 0.1 0.3 % 0.0 0.0 0.0 0.0 0.0 0.0 - Purchased GWh 23.8 13.3 112.2 98.2 67.2 45.0 % 0.4 0.2 1.7 1.4 0.9 0.6 TOTAL GWh 5,723.6 6,337.3 6,530.3 6,773.8 7,372.8 7,512.0 % 100.0 100.0 100.0 100.0 100.0 100.0
3.2.2.3 Energy Sales of Southern Sumatera
Sumatera energy sales are growth with the rate of 6.70%, from 9,006
GWh to 12,453 GWh, in the period of 2000-2005. It is higher than
the growth of energy production of the same period. Ratio of

36
residential consumer to total in the period is almost the same, i.e.,
from 50.2% in 2000 to become 50.5 % in 2005. The growth of
energy sales in Sumatera is display as Table 3.4 as follows:
Table 43.4: Sumatera Energy Sales 2000-2005
Category Unit 2000 2001 2002 2003 2004 2005
Residential GWh 4,522 5,068 5,215 5,503 5,955 6,286
% 50.2 52.1 52.3 52.1 51.3 50.5
Industrial GWh 2,749 2,854 2,832 2,931 3,094 3,213
% 30.5 29.4 28.4 27.7 26.7 25.8
Commercial GWh 1,178 1,206 1,280 1,396 1,646 1,914
% 13.1 12.4 12.8 13.2 14.2 15.4
Others GWh 557 595 638 738 904 1,040
% 6.2 6.1 6.4 7.0 7.8 8.3
TOTAL GWh 9,006 9,722 9,965 10,568 11,599 12,453
% 100.0 100.0 100.0 100.0 100.0 100.0
3.2.2.4 Electrification Ratio
Electrification ratio in Sumatera during the period of 2000-2005 is
still low. It only increases from 47.08 % to 48.78%. The highest
electrification ratio is North Sumatera Province and the lowest is
Jambi Province. Table 3.5. displays the electrification ratio of the 9
(nine) provinces of Sumatera. The electrical distribution systems of
the nine provinces are operated by the 7 (seven) PLN Regions
(Wilayah), where PLN Region South Sumatera, Jambi & Bengkulu
operates distribution system of South Sumatera, Jambi and Bengkulu
Provinces.

37
Table 53.5: Sumatera Electrification Ratio 2000-2005 [%]
Region 2001 2002 2003 2004 2005
NAD 56.16 56.30 56.79 58.80 57.67
North Sumatera 64.94 65.79 66.26 67.43 68.51
West Sumatera 58.16 59.37 60.57 62.74 63.58
Riau 34.23 35.26 34.82 34.73 40.07
S2JB 36.91 37.15 37.23 38.79 39.47
- South Sumatera 38.37 38.69 38.57 39.71 40.36
- Jambi 29.31 29.90 30.84 33.92 34.93
- Bengkulu 43.38 42.66 42.16 42.97 43.18
Bangka Belitung 55.18 56.19 55.05 54.38 53.28
Lampung 29.80 31.06 36.29 35.33 37.63
Sumatera 47.08 45.68 46.50 47.45 48.78
3.2.3 Power Plant Demand and Supply in Sumatra for the
2007 – 2016 periods
As already mentioned above, for several years electrical systems in
Sumatera has suffered from power shortage. The growth of generation
availability is not comparable with the highly demand in electricity. The
existing Power Plants have been operated for more than 15 year and they
are already in deteriorating condition. Also, during dry seasons the
Hydropower Plant, mainly located in the West Sumatera Region, are only
capable of supplying 60-70 % of normal capacity. As a consequence, a

38
limitation on new consumer’s registration, also a limitation on the use of
electricity, has taken place. Generator installed capacity of West Sumatera
System and South Sumatera System for period 2007-2016 is shown in
Table 3.6.
Table 63.6: Installed Capacity of West and Southern Sumatera Systems 2007-2016 [MW]

39
3.2.4 IPP Business
Based on above, the need for electric power throughout Indonesia keeps
increasing each year with growth rate ranges between 6 ~ 10%. This quite
high growth rate requires a considerable amount of fund to anticipate it.
Meanwhile, electrification ratio of 55% means that the obligation to
supply electric power in the future is still extensive. The funds of the
Government and PLN are very limited to fulfill the people’s increasing
need for electric power.
In order to anticipate the growth of electric power sector, PT PLN
(Persero) gave an opportunity to IPP to develop the power generation and
transmission network facility throughout Indonesia, together with PT
PLN (Persero), by giving priority to non-fuel and environmentally
friendly power plant.
The involvement of IPP started in 2005 with the Power Purchase
Agreement (PPA), among others for PLTP (geothermal electric power
plant) Salak, PLTU (steam-fired power plant) Paiton, PLTGU (combined
cycle power plant) Cikarang, and so forth. Based on the Regulation of the
Minister of Energy and Mineral Resources No. 01 of 2006, the IPP
procurement must conform to the Electric Power Supply Business Plan
40
(RUPTL) that was prepared based on the National General Plan on
Electric Power.
At present, there are 4 (four) units of small-scale IPP operating at PT PLN
(Persero) WS2JB, namely PLTG Musi 2 with capacity of 13.83 MW,
PLTMG Prabumulih 12 MW, PLTMG Sako 12 MW, and PLTG Tanjung
Jabung with power of 6 MW. In addition to being contained in the
national RUPTL, these four power plants operate in different areas;
therefore, there is no competition between them.
More than 55% of operating cost for IPP is for fuel. Therefore, if power
energy reserve is abundant in Palembang area, with fuel more
inexpensive than gas, it may reduce power energy sale from the IPP using
gas as fuel.
The term of the contract on power sale and purchase entered into by PT
PLN to the IPP is the life cycle of the generator engine itself. The life
cycle of the power generator is 20-30 years, during which the company is
required to prepare a properly programmed maintenance so as to keep the
operation reliable at anytime. Damaged production machine may lose the
company’s opportunity to sell its power energy and the opportunity is
irreplaceable in the future. Therefore, the company is demanded to keep
that a power plant operates in maximum condition at anytime. There are

41
many ways that can be performed by the company for maintenance
among others, entering into a full maintenance contract with a third party
with availability level guarantee agreed. This can impose a considerable
charge to the company, compared with the other companies not entering
into a full maintenance contract.
3.3 Outline
Just like any other industry, the IPP industry also facing many operational
risks. In case of the risk that PDP facing is how to maintain the stability of
their cash inflow and outflow which caused by the revenue which is in IDR
and the reoccurred expenses such as the gas supply payment to Pertamina and
full maintenance expense to Turbomach which both are in USD.
Based on the company operational data since January 2007 to October 2008,
Gas Fuel Cost is 57% of the total revenue and for Machinery and Spare parts
Repair and Maintaining Cost is 7% of the total revenue.
To anticipate the above-mentioned risks, currently PDP is applying open
position and does not make hedging. The company only makes speculation
against USD currency purchase and it has caused significant loss when there
is turmoil to USD/IDR rate.

42
By knowing the importance of hedging to minimize risk faced by PDP, then
PDP has yet to identify some possible alternatives to overcome currency
exchange rate exposure.
The possible options are:
1. Hedging by using Forward contract
2. Hedging by using Money Market Hedge
3. Hedging by using Options
Those solutions are chosen by considering currency exchange rate risk, hedging
cost and other requirements to apply them as well as real condition faced by the
company now.
Based on the three alternatives, the writer applies the three hedging products into
company operational transaction to pay gas fuel and full maintenance in the
period of 2007 and 2008; so that it seems that the company applies forward
contract or money market hedge for the same transaction period. To obtain
optimum result for PDP the writer use historical data of 2007 and 2008 from
existing forward product and money market hedge.
After rate of profit/loss using forward product and money market hedge, a
comparison of profit/loss using real forward product and money market hedge is
conducted or by not using hedging (open position) for 2007 and 2008. Moreover
the writer is trying to make simulation of the two hedging product for period of
2009.

43
Based on the comparison of using and not using hedging, the writer will make
conclusion from the analyze result which has been conducted to minimize
exchange rate risk. Eventually it is the company decision whether or not they use
hedging in overcoming exchange rate exposure.
Figure 33.3: Research Framework Scheme
Exchange rate exposure PT. PURA
DAYA PRIMA
Fuel gas payment to Pertaminadue to the different time of invoice received and time of
payment settled denominated in USD
Maintenance payment to Turbomach due to the different time of invoice received and time of payment settled denominated
in USD
Strategy to mitigate Foreign Exchange Risk:
• Hedging with currency derivatives or other mitigation strategy• Un‐hedge = open position
Hedging Cost with Interest Rate Parity Theorem (IPRT):
Ef ‐ Es/Es = iR –iV for Product A,B, C
Cost of Open position Risk which used by PDP
Proyeksi 2009 menggunakanproduk hedging
Conclusion
Suggestion
Compare the 2 above strategy into Gain/Loss Forex Statement PDP 2007 &
2008
44
3.4 Analysis Model and Method
The analysis model and method applied by the writer in this thesis is strategic
problem solving according to The McKinsey Mind (Ethan M. Rasiel and Paul
N. Friga, 2001) concerning problem solving process divided into three parts,
namely managing, analyzing, and presenting.
The IPP Industry is currently on its prime periods as more and more demand
of electricity supply every year.
In order to attain the target, each company is forced to improve its capacities
each year. This lead into more gas supply needed in order to keep up with the
requirement demand. As we all know that the price of gas commodity is
floating and on the other hand the price of electricity is fixed. To affirm that
the strategy adopted by the company is correct and capable to minimize the
risks in currency, there are 3 measures taken as a problem solving method,
namely:
1. To disclose all of the flow included in the related process (from invoice
receive date until the settlement date);
2. To analyze issues and targets determined by the company;
3. To expose issues and draw a solution and calculate risks encountered by
the Company those are being implemented.
The success of the hedging implementation itself will highly depend on the
decision applied by the organization. This problem solving process itself will
certainly need accurate data and intuition on the situation to encounter.

45
3.5 Data Collection Method
The data are collected to know issues and find solutions to the issues.
Therefore, we interact with the relevant management and working level of the
relevant company in the following manners:
1. Direct interview with source persons (management or working level or
expert in relevant sector);
2. Communication via telephone and e-mail;
3. Literature study through journals available at the library and online
media;
4. Inspection of the company’s financial statement of each semester;
5. Direct data collection from the company’s internal application (web);
6. Arrangement of relevant simulations.
Analysis Model and Method
Validity and reliability of GFP highly depend on how far the proposals filed
can be applied by the management for improvement of aspects that become
GFP objects. In this case, how far the proposals given in the hedging
application by the management of PDP are applied to improve the
management’s capability against the existing currency risks, which eventually
will improve the future and current cash flow performance of PDP.