3.1 discipline science results - titan
TRANSCRIPT

C A S S I N I F I N A L M I S S I O N REP O R T 2 01 9 1
TITAN Until the Cassini-Huygens mission, very little was known about Saturn’s largest moon Titan, except that
it was a Mercury-sized world whose surface was veiled beneath a thick, nitrogen-rich atmosphere. But
Cassini mapped Titan’s surface, studied its atmospheric reactions, discovered liquid seas there and
even sent the Huygens probe to the moon’s surface, completely rewriting our understanding of this
remarkable world, including the detection of a large internal ocean deep below the surface. By the
conclusion of the mission, Cassini-Huygens had revealed a complex Titan surface with a striking
resemblance to the total geomorphology of the Earth, including dunes, rivers, gullies, lakes, seas,
volcanic constructs, and mountains.
The Titan Discipline Working Group and Science Teams accomplished all surface and
atmospheric science objectives in the traceability matrices for the mission. The Titan Observation
Science Team (TOST) coordinated every Titan observation and planned all 127 close Titan flybys to
ensure that Cassini Titan objectives were met. The Titan Atmospheric Modeling Working Group
(TAMWG), comprised of experts in Titan’s upper atmosphere and members of the engineering team,
was formed to characterize Titan’s uppermost atmosphere and its variation with seasons to give
advice to the project on how close the spacecraft could approach Titan.

2 V OL U M E 1 : M I S S I O N OV E RVI EW & S CI E N CE OBJ E C TI V ES A N D RE S ULT S
CONTENTS TITAN ................................................................................................................................................................................ 1
Executive Summary................................................................................................................................................ 4 Top 10–20 List of Scientific Discoveries/Accomplishments .................................................................................... 5 Key Science Objectives for Titan ............................................................................................................................ 7 Titan CSM Traceability Matrix Objectives ............................................................................................................... 8 Titan DWG System Results .................................................................................................................................... 8
Titan ............................................................................................................................................................. 8 Titan’s great seas (TC1a) T_AO2) [Hayes, Lorenz, Lunine] ............................................................. 8 Titan’s global seasons (TC1b) [Teanby et al. 2017] ........................................................................ 10 Titan-magnetosphere interaction (TC2a) [Strobel et al. 2009; Strobel and Cui 2014; Simon et al. 2010] ............................................................................................................................................... 13 Titan’s surface (TN1a) (T_AO4) ...................................................................................................... 16 Titan’s interior (TN1b) (T_AO4) ....................................................................................................... 26 Titan atmospheric composition (TN1c) (T_AO2) ............................................................................. 28 Titan atmospheric structure (TN2a) (T_AO5) .................................................................................. 30 Titan’s icy shell (TN2b) (T_AO2) ..................................................................................................... 36 Titan meteorology (TN2c) (T_AO3) ................................................................................................. 36 Other Titan science not in CSM TM: Titan as a system – its origin and mysteries ......................... 38 Open questions for Titan science .................................................................................................... 40
Acronyms.............................................................................................................................................................. 42 References ........................................................................................................................................................... 43
Figures Figure TITAN-1. Schematic of dynamical processes thought to be important in Titan’s winter north polar region. ........ 11 Figure TITAN-2. Global mosaic of emissivity of Titan at the 2 cm wavelength of the Cassini RADAR........................... 17 Figure TITAN-3. Predicted and observed maps of scattering from Titan’s surface. ....................................................... 18 Figure TITAN-4. Dunes on Titan as seen by the Cassini SAR ....................................................................................... 22 Figure TITAN-5. Nine probable impact craters observed on Titan by Cassini RADAR .................................................. 24 Figure TITAN-6. Cassini measurements of Titan surface height above a reference sphere of 2575 km. ...................... 27 Figure TITAN-7. A model consistent with Cassini gravity and figure measurements, assuming isostatic compensation.
........................................................................................................................................................................ 28 Figure TITAN-8. Titan possesses a mostly stable troposphere with a well-defined tropopause and a lower stratosphere
with a high static stability. ................................................................................................................................ 31 Figure TITAN-9. CIRS zonal mean temperatures (K) from limb and nadir spectra recorded between July 2004 and
September 2006. ............................................................................................................................................. 32 Figure TITAN-10. Pressure/latitudes maps of temperature as a function of season from northern winter through late
spring. ............................................................................................................................................................. 33 Figure TITAN-11. A cartoon of complex ion/neutral chemistry in Titan’s upper atmosphere (950-1000 km) as observed
by the Cassini INMS on flyby T16. .................................................................................................................. 34

C A S S I N I F I N A L M I S S I O N REP O R T 2 01 9 3
Tables Table TITAN-1. Science Assessment. .............................................................................................................................. 7 Table TITAN-2. Titan energy source magnitudes. .......................................................................................................... 15 Table TITAN-3. Titan upper atmosphere and its induced magnetosphere. .................................................................... 15

4 V OL U M E 1 : M I S S I O N OV E RVI EW & S CI E N CE OBJ E C TI V ES A N D RE S ULT S
EXECUTIVE SUMMARY
By the conclusion of the mission Cassini-Huygens had revealed a complex Titan surface with a striking resemblance to the total geomorphology of the Earth. Dunes, rivers, gullies, lakes, seas, volcanic constructs, mountains, are all present. Titan’s methane cycle, analogous to the Earth’s hydrologic cycle, drives processes including sedimentary transport that lead to the most geologically diverse surface after that of the Earth. Most spectacular was the discovery of several
polar seas and hundreds of lakes, covering multiple hundreds of thousands of square kilometers. Some of the coastlines appear very Earth-like, with bays, cliffs, coves and river estuaries, while other boundaries are puzzling and may reflect a tectonic origin of the sea basins. Changes in two of the seas have been seen, suggesting dynamic processes driven by seasonal or other influences. Bathymetry and compositional measurements by Cassini lead to a liquid hydrocarbon inventory of about 70,000 square kilometers, mostly methane.
Cassini and the close-up images provided by Huygens establish fluvial erosion and rainfall as important processes tying together Titan’s surface and atmosphere. A variety of cloud and weather patterns, including those generating rain, occur in the lower atmosphere. Comparison of cloud patterns with general circulation models supports the presence of a substantial amount of liquid methane in Titan’s crust. From a variety of Cassini data, a surface age between ~0.5–1 billion years is derived. Although Cassini has not detected emission of methane from the crust, various indirect lines of evidence from Cassini point to episodic release of methane from the deep crust, with ethane soaked up by the ice in the form of clathrate hydrate or other trapping mechanisms.
Cassini measured Titan’s gravity field and dynamic tidal response, indicating (together with Huygens electric field data) the presence of a deep subsurface water ocean, one denser than liquid water and thus possibly salty. A relatively low density, possibly hydrated, core was detected. The measurement of isotopic argon in the atmosphere supports significant outgassing over Titan’s history, while the low abundance of primordial argon along with other isotopic measurements support ammonia as the original parent molecule of Titan’s atmospheric nitrogen.
At the end of the Cassini-Huygens Nominal Mission, we had a good first order knowledge of the density and thermal structure of the atmosphere except for the ~ 500–950 km region, variously called the ignorosphere, agnostosphere, etc. Although Huygens Atmospheric Structure Instrument (HASI) inferred the thermal structure at equatorial latitudes through this region, it did not yield a pronounced mesopause as was widely expected from theory. Composite Infrared Spectrometer (CIRS) data provided detailed altitudinal and latitudinal composition and temperature
The entire duration of the Cassini Mission exceeded 13 years, permitting observations over close to half of a seasonal cycle (almost half of Saturnian year) on Titan and revealed that seasonal variations are not symmetrical.

C A S S I N I F I N A L M I S S I O N REP O R T 2 01 9 5
measurements of the stratosphere. The latter allowed the derivation of stratospheric zonal winds at substantial super-rotation speeds.
The Cassini Equinox and Solstice Missions enabled the study of seasonal variations of composition, temperatures and inferred zonal winds to understand the transition from summer in the southern hemisphere to equinoctial conditions to summer in the northern hemisphere, especially as the northern polar region emerges out of the polar winter night and its strong circumpolar vortex was breaking up. The entire duration of the Cassini Mission exceeded 13 years, permitting observations over close to half of a seasonal cycle (almost half of Saturnian year) on Titan and revealed that seasonal variations are not symmetrical. The eccentricity of Saturn’s orbit and the obliquity of its rotational pole is sufficient to produce the observed asymmetry in Titan’s seasonal response. But its entire stratosphere is tilted by several degrees from the rotational pole. Seasonal variations in composition, density, and thermal structure of Titan’s upper atmosphere were characterized in particular by Ion and Neutral Mass Spectrometer (INMS) with complementary data from Ultraviolet Imaging Spectrograph (UVIS) measurements.
Cassini data determined that the thermosphere is a chemical factory that initiates the formation of complex positive and negative ions in the high thermosphere as a consequence of magnetospheric-ionospheric-atmospheric interaction involving solar extreme ultraviolet (EUV) and ultraviolet (UV) radiation, energetic ions and electrons. This factory produces very heavy positive and negative ions and large molecules, which condense out and are detectable in solar and stellar UV occultations at ~1000 km and initiate the haze formation process. As these particles fall through the 500–950 km region and grow, they become detectable by remote sensing: UVIS at ~1000 km, Imaging Science Subsystem (ISS) at ~500 km and eventually become ubiquitous throughout the stratosphere. These haze particles are strong absorbers of solar UV and visible radiation, play a fundamental role in heating Titan’s stratosphere and mesosphere and provide a surface for heterogeneous reactions. The differential heating with latitude drives wind systems in Titan’s middle atmosphere, much as ozone does in the Earth’s middle atmosphere.
In summary the Titan Discipline Working Group and Science Teams accomplished all surface and atmospheric science objectives in the traceability matrices for the mission.
TOP 10–20 LIST OF SCIENTIFIC DISCOVERIES/ACCOMPLISHMENTS
• Cassini measured the shape of Titan’s gravity field, including the tidal response. Cassini-Huygens discovered a global ocean of liquid water below a thick crust, and a relatively low density (hence hydrated?) core were discovered. Gravity and rotational data hint at the ocean being over dense and hence salty.
• Cassini-Huygens measured argon (36, 40Ar) in the atmosphere. Primordial argon was very low, indicating ammonia as the origin of the nitrogen atmosphere. Radiogenic argon indicated communication of the interior with the surface.
6 V OL U M E 1 : M I S S I O N OV E RVI EW & S CI E N CE OBJ E C TI V ES A N D RE S ULT S
• Cassini-Huygens revealed a complex Titan surface with a striking resemblance to the total geomorphology of Earth. Dunes, rivers, gullies, lakes, seas, volcanic constructs, mountains, are all present. Titan’s methane cycle, analogous to the Earth’s hydrologic cycle, drives processes including sedimentary transport that lead to the most geologically diverse surface after that of Earth.
• Cassini discovered that Titan has several polar seas and hundreds of lakes, covering hundreds of thousands of square kilometers. Cassini determined the composition and bathymetry of the seas and a few lakes. The marine coastlines are very Earth-like, with bays, coves, cliffs and river estuaries, and dynamic changes occur in the seas. The total observable liquid hydrocarbon inventory was constrained (70,000 cubic km).
• Cassini-Huygens determined a range of crustal ages on Titan’s surface; the average age is hundreds of millions to a billion years.
• Cassini-Huygens observed dynamic meteorology in cloud behavior and rainstorms, changes in the lakes and seas, and evaporation of liquids from the surface.
• Cassini-Huygens discovered a variety of weather patterns, including rainstorms, in Titan’s lower atmosphere and documented seasonal changes therein.
• Cassini further explored the evolution and composition of the winter circumpolar vortex that switches hemispheres seasonally. Titan has strong parallels to Earth with strong winter polar vortices.
• Cassini discovered the entire stratosphere is tilted by several degrees from the rotational pole.
• Cassini discovered ice condensate clouds in the stratosphere.
• Cassini discovered complex, heavy molecules and ions (both positive and surprisingly, negative) in the upper atmosphere, pointing to active chemistry and a link to the initiation of haze formation. The richness and complexity (going up to hundreds, maybe thousands of species) of the heavy molecules.
• Cassini-Huygens discovered Enceladus as one possible source for oxygen compounds in Titan’s atmosphere.
• Cassini discovered Titan’s thermosphere to be highly variable, contradicting model predictions.
• Cassini firmly established no intrinsic magnetic field.
• Cassini-Huygens came up with the surprising result that lightning is absent despite observed methane moist convection.
Table TITAN-1 shows the assessment of data collected to satisfy an objective. It is not as assessment of the status of data analysis/publications.
C A S S I N I F I N A L M I S S I O N REP O R T 2 01 9 7
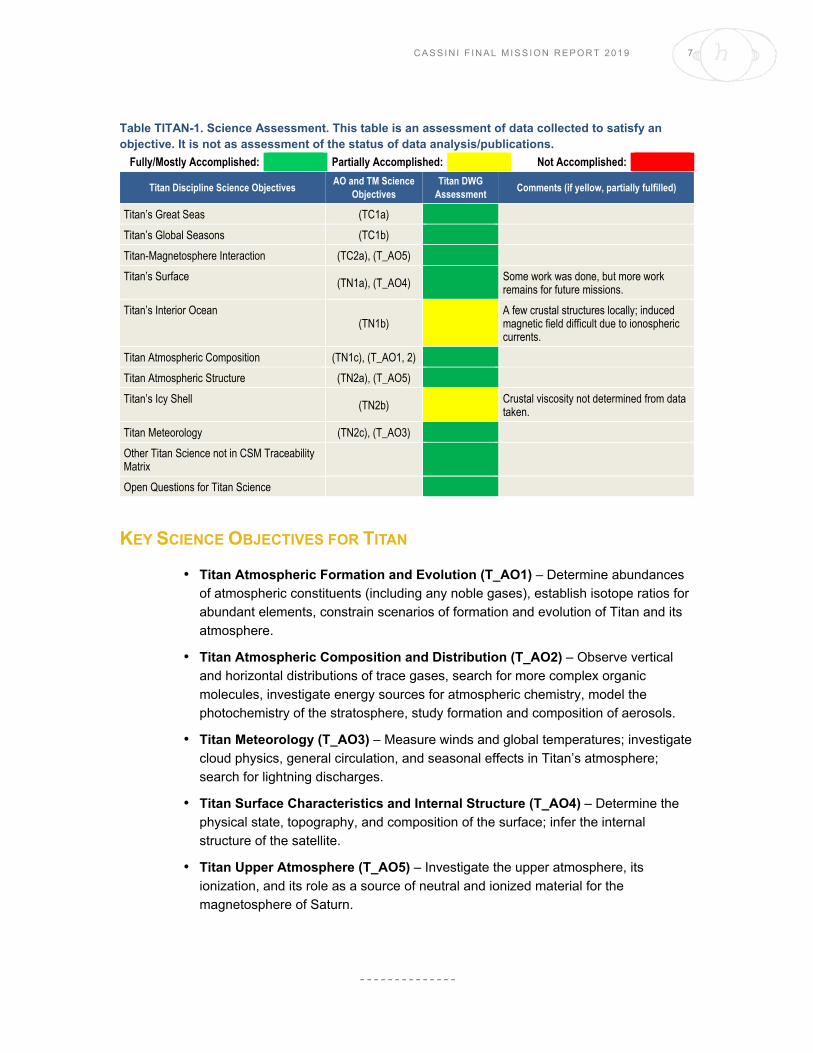
Table TITAN-1. Science Assessment. This table is an assessment of data collected to satisfy an objective. It is not as assessment of the status of data analysis/publications.
Fully/Mostly Accomplished: Partially Accomplished: Not Accomplished:
Titan Discipline Science Objectives AO and TM Science
Objectives Titan DWG
Assessment Comments (if yellow, partially fulfilled)
Titan’s Great Seas (TC1a)
Titan’s Global Seasons (TC1b)
Titan-Magnetosphere Interaction (TC2a), (T_AO5)
Titan’s Surface (TN1a), (T_AO4) Some work was done, but more work remains for future missions.
Titan’s Interior Ocean (TN1b)
A few crustal structures locally; induced magnetic field difficult due to ionospheric currents.
Titan Atmospheric Composition (TN1c), (T_AO1, 2)
Titan Atmospheric Structure (TN2a), (T_AO5)
Titan’s Icy Shell (TN2b) Crustal viscosity not determined from data taken.
Titan Meteorology (TN2c), (T_AO3)
Other Titan Science not in CSM Traceability Matrix
Open Questions for Titan Science
KEY SCIENCE OBJECTIVES FOR TITAN
• Titan Atmospheric Formation and Evolution (T_AO1) – Determine abundances of atmospheric constituents (including any noble gases), establish isotope ratios for abundant elements, constrain scenarios of formation and evolution of Titan and its atmosphere.
• Titan Atmospheric Composition and Distribution (T_AO2) – Observe vertical and horizontal distributions of trace gases, search for more complex organic molecules, investigate energy sources for atmospheric chemistry, model the photochemistry of the stratosphere, study formation and composition of aerosols.
• Titan Meteorology (T_AO3) – Measure winds and global temperatures; investigate cloud physics, general circulation, and seasonal effects in Titan’s atmosphere; search for lightning discharges.
• Titan Surface Characteristics and Internal Structure (T_AO4) – Determine the physical state, topography, and composition of the surface; infer the internal structure of the satellite.
• Titan Upper Atmosphere (T_AO5) – Investigate the upper atmosphere, its ionization, and its role as a source of neutral and ionized material for the magnetosphere of Saturn.

8 V OL U M E 1 : M I S S I O N OV E RVI EW & S CI E N CE OBJ E C TI V ES A N D RE S ULT S
TITAN CSM TRACEABILITY MATRIX OBJECTIVES
• Titan’s Great Seas (TC1a) – Determine seasonal changes in the methane-hydrocarbon hydrological cycle: of lakes, clouds, aerosols, and their seasonal transport.
• Titan’s Global Seasons (TC1b) – Determine seasonal changes in the high-latitude atmosphere, specifically the temperature structure and formation and breakup of the winter polar vortex.
• Titan-Magnetosphere Interaction (TC2a) – Observe Titan’s plasma interaction as it goes from south to north of Saturn’s solar-wind-warped magnetodisk from one solstice to the next.
• Titan’s Surface (TN1a) – Determine the types, composition, distribution, and ages, of surface units and materials, most notably lakes (i.e., filled versus dry and depth; liquid versus solid and composition; polar versus other latitudes and lake basin origin).
• Titan’s Interior Ocean (TN1b) – Determine internal and crustal structure: Liquid mantle, crustal mass distribution, rotational state of the surface with time, intrinsic and/or internal induced magnetic field.
• Titan Atmospheric Composition (TN1c) – Measure aerosol and heavy molecule layers and properties.
• Titan Atmospheric Structure (TN2a) – Resolve current inconsistencies in atmospheric density measurements (critical to a future Flagship mission).
• Titan’s Icy Shell (TN2b) – Determine icy shell topography and viscosity.
• Titan Meteorology (TN2c) – Determine the surface temperature distribution, cloud distribution, and tropospheric winds.
TITAN DWG SYSTEM RESULTS
Titan
Titan’s great seas (TC1a) T_AO2) [Hayes, Lorenz, Lunine]
Titan’s lakes and seas encompass 1% of the total surface area and are restricted to latitudes poleward of ~55° [Hayes 2016]. The majority (97% by area) of surface liquids reside in the north polar region, with 80% of all liquid-filled surface area contained in three large seas; Kraken Mare (5.0 × 10⁵ km2), Ligeia Mare (1.3 × 10⁵ km2), and Punga Mare (6.1 × 10⁴ km2). The only large liquid body in the south polar region is Ontario Lacus (1.6 × 10⁴ km2), although several large empty basins that encompass an area similar to the northern Maria (7.6 × 10⁵ km2) have been identified and interpreted as paleoseas [Birch et al. 2018; Hayes et al. 2010, 2011]. While a few small lakes have
C A S S I N I F I N A L M I S S I O N REP O R T 2 01 9 9
been observed to disappear or brighten in both the north and south over the thirteen years of Cassini observations, no large-scale changes have been reported in the shorelines of the northern seas [Hayes et al. 2011]. Although confirmed and stable liquid deposits are currently restricted to polar terrain, the equatorial features Hotei and Tui Regiones have been interpreted as possible low-latitude paleoseas [Moore and Howard 2011]. Both regions are surrounded by fluvial networks that appear to converge on a field of radar-bright, lobate, depressions that are morphologically similar to high-latitude lakes [Moore and Howard 2011]. Dark flow-like features identified adjacent to the radar-bright depressions have been interpreted as cryovolcanic deposits [Barnes et al. 2006; Wall et al. 2009], suggesting that both paleo-lakes and cryovolcanic flows may be present at Tui Regio and Hotei Regio [Lopes et al. 2013]. The existence of modern equatorial lakes has been proposed based on the longevity of low albedo localities observed by Cassini Visual and Infrared Imaging Spectrometer (VIMS) [Griffith et al. 2012; Vixie et al. 2015], although none of these features have been confirmed by higher-resolution Synthetic Aperture Radar (SAR) or altimetry datasets.
For the majority of the Cassini mission, the surfaces of the Titan’s lakes and seas were observed to be incredibly flat, with maximum average surface deviations of order millimeters, suggesting little to no wind or currents capable of ruffling liquid surfaces [Grima et al. 2017; Stephan et al. 2010; Wye et al. 2009; Zebker et al. 2014]. As northern spring approached, evidence for surface waves and other transient features began to emerge [Barnes et al. 2014; Hofgartner et al. 2014]. This increase in activity has been attributed to the increase in solar insolation and surface winds expected with the changing seasons [Hayes et al. 2013; Lorenz and Hayes 2012]. Prior to northern springtime, surface winds were presumably below the threshold for wind-wave generation in hydrocarbon liquids (~0.4 m/s) [Hayes et al. 2013].
During an observation designed to look for surface waves on Ligeia Mare, the Cassini Titan Radar Mapper (RADAR) acquired altimetry echoes that displayed two distinct returns, one from the surface of Ligeia Mare and one from its seabed [Mastrogiuseppe et al. 2014]. The difference in received timing between these returns was a measure of Ligeia Mare’s depth (160 m), while their relative intensity provided a measurement of the microwave loss-tangent (i.e., absorbance) of the liquid (tan Δ = ε″/ε′= 4.4 ± 0.8 × 10⁻⁵, where ε is the complex dielectric constant). Following the identification of Ligeia Mare’s seabed, several of the final radar passes of Titan were modified to repeat the experiment over Punga Mare, Kraken Mare, and several small lakes [Mastrogiuseppe et al. 2016, 2017]. As a result, bathymetry measurements over all three of Titan’s maria and several small lakes are now available. When combined with SAR observations that also penetrate the shallower seas and assuming a maximum depth of ~300 m for Kraken Mare [Lorenz et al. 2014; 2008b], for which a reflection from the bottom was not observed, the volume of Titan’s lakes and seas is estimated at 70,000 km3 [Hayes 2016]. This represents only ~1/7 the volume of atmospheric methane suggesting that, unlike on Earth, Titan’s seas have little influence on the global climate.
For the majority of the Cassini mission, the surfaces of the Titan’s lakes and seas were observed to be incredibly flat, …, suggesting little to no wind or currents capable of ruffling liquid surfaces … .

1 0 V OL U M E 1 : M I S S I O N OV E RVI EW & S CI E N CE OBJ E C TI V ES A N D RE S ULT S
This also means that the lakes and seas are not plausible as a long-term resupply reservoir of atmospheric methane.
Laboratory experiments [Mitchell et al. 2015] demonstrated that the microwave loss-tangents measured by Cassini require methane-dominated liquids. If higher-order hydrocarbons (e.g., propane) are considered in addition to ethane, then the loss-tangents measured over Ligeia, Punga, and Kraken Mare require near pure methane-nitrogen mixtures. If a methane-nitrogen-ethane ternary mixture is considered, Ligeia’s loss tangent is consistent with 71% methane and 12% ethane by volume [Mastrogiuseppe et al. 2016]. These abundances are generally consistent with predicted equilibrium compositions [Glein and Shock 2013; Tan et al 2015], although higher-order components (e.g., propane) were not taken into account. The loss-tangent of Punga Mare and Kraken are similar (to within error) to Ligeia Mare, while Ontario Lacus was observed to be more absorbent, consistent with a greater ethane content or an increased abundance of more involatile hydrocarbons (e.g., propane). Regardless, the primary constituent of Ontario must still be methane in order to match the derived loss tangent [Mastrogiuseppe et al. 2017]. Earlier in the Cassini mission, VIMS infrared spectra were used to identify the presence of ethane in Ontario [Brown et al. 2008]. The fact that Titan’s seas are methane-dominated further exacerbates the long-standing mystery of Titan’s missing ethane [Lunine et al. 1983].
Titan’s global seasons (TC1b) [Teanby et al. 2017]
Determine seasonal changes in the high-latitude atmosphere, specifically the temperature structure and formation and breakup of the winter polar vortex.
To understand the structure of Titan’s atmosphere one must keep in mind certain basic facts from solar system dynamics. First, the axial tilt of Saturn and Titan is 26.73°; and second, Saturn’s orbital eccentricity is 0.05415, which yield variations in the distance from the Sun from 9.04 to 10.07 AU and in the total solar flux of ~20 %. Titan’s atmospheric seasonal evolution is driven by three mechanisms: the seasonal change in solar declination, the orbital eccentricity of Saturn with Titan receding from the Sun since 2002, and the solar cycle variation of the Sun with activity increasing from its minimum in late 2009 to peak solar activity for cycle 24 in April 2014. Perihelion last occurred in February 25, 2003. Summer solstice in Titan’s southern hemisphere was March 17, 2002; summer solstice in the northern hemisphere was on May 24, 2017 after spring equinox on August 11, 2009.
The variation in solar distance and thus solar flux will be most important in the troposphere, stratosphere, and mesosphere, whereas the much larger solar cycle variations in UV and EUV solar radiation will overwhelm the smaller eccentricity effects in situ in the thermosphere. But the contraction and expansion of the underlying stratosphere/mesosphere with increasing and decreasing solar distance must be considered in determining thermospheric seasonal changes. The Voyager spacecraft flybys were at high solar activity, whereas orbit insertion of the Cassini spacecraft in July 2004 was during the descending phase from peak activity, which occurred in April 2000, to deep solar minimum conditions in the August–November 2009 timeframe.

C A S S I N I F I N A L M I S S I O N REP O R T 2 01 9 1 1
Accordingly, the nominal Cassini-Huygens Mission was mostly at low solar activity. Peak solar activity for cycle 24 occurred in April 2014.
When the Cassini spacecraft arrived at Titan, there was a well-developed winter polar vortex in the northern hemisphere inferred from the stratospheric temperatures with peak zonal wind velocities on the order of 200 m/s [Achterberg et al. 2008a]. From July 1, 2004 to September 15, 2017, the spacecraft made a total of 127 Titan flybys, spanning nearly half of Titan’s 29.5-year orbit around the Sun that allowed observations of the detailed evolution and breakup of Titan’s northern winter polar vortex and the formation and early evolution of Titan’s southern winter polar vortex (Figure TITAN-1). The former was characterized by the decrease in the upper stratospheric temperatures, weakening of the zonal winds, and the reduction in the enhancement of photochemically produced compounds [Vinatier et al. 2010, 2015; Achterberg et al. 2011].
“Associated with the polar vortex was a meridional circulation dominated by a single pole-to-pole cell that ascended at southern and equatorial latitudes and subsided over the northern winter pole. Strong vortex winds formed a mixing barrier and effectively isolated the polar air mass, permitting a distinct temperature and composition within the vortex. Pre-equinox observations of the north polar region show the mid-winter vortex is characterized by: trace gas enrichment due to subsidence from upper-
Figure TITAN-1. Schematic of dynamical processes thought to be important in Titan’s winter north polar region. A single cell meridional circulation, a polar vortex of strong zonal winds, wave induced mixing by inferred equatorial barotropic and gravity waves. Figure from Teanby et al. [2008].

1 2 V OL U M E 1 : M I S S I O N OV E RVI EW & S CI E N CE OBJ E C TI V ES A N D RE S ULT S
atmosphere photochemical source regions, a cold lower stratosphere due to long-wave radiative cooling and a lack of insolation; and a hot stratopause/mesosphere due to subsidence and adiabatic heating with a peak temperature of ~200 K. Pre-equinox observations detail the nominal configuration of the mid-winter polar vortex, which is broadly consistent with results from numerical models” [Teanby et al. 2017].
“Following Titan’s 2009 northern spring equinox, peak solar heating moved to the northern hemisphere, initiating south-polar subsidence and winter south-polar vortex formation with reversal almost immediately of the vertical circulation at the south pole [Vinatier et al. 2015]. Throughout 2010–2011, strengthening subsidence produced a mesospheric hot-spot (~180 K at 300–400 km altitude) and caused extreme enrichment of high-altitude photochemically produced trace gases. The reversal was accompanied by a two-cell transitional global circulation, with upwelling around the equator and subsidence at both poles, which persisted for two years before a fully reversed single circulation cell was established [Vinatier et al. 2015]. The timing of these circulation changes is consistent with numerical models, which subsequently predicted a gradual evolution of the south polar vortex towards a state similar to that observed in the north prior to equinox.” [Teanby et al. 2017].
“However, contrary to expectations, in 2012 spectral features of HCN ice were identified at 300 km altitude over the southern winter pole with VIMS [de Kok et al. 2014]”.
In addition, CIRS detected C6H6 ice in the south polar cloud [Vinatier et al. 2018] and an undetermined 220 cm−1 spectral signature suddenly appeared as well in July 2012 but not February 2012 CIRS data set taken there [Jennings et al. 2012].
“This cloud was also observed in high spatial resolution images from ISS. The presence of HCN ice was surprising as it requires temperatures of ~125 K to form at 300 km altitude—over 50 K colder than temperatures observed in mid-2011 at similar altitudes and latitudes. Therefore, development of Titan’s winter south polar vortex is more complex than expected. There is not a simple monotonic increase of mesospheric temperatures following equinox to eventually mirror the ~200 K temperatures observed in northern winter at the start of the mission—instead rapid and unexpected cooling occurred accompanied by extreme trace gas enrichment within the polar vortex that dramatically increased mesospheric long-wave radiative cooling efficiency, causing unusually cold temperatures 2–6 years post-equinox. The long timeframe to reach a stable vortex configuration results from the high infrared opacity of Titan’s trace gases and the relatively long atmospheric radiative time constant. Whereas winter polar hotspots have been observed on other planets, detection of post-equinox cooling is so far unique to Titan.” [Teanby et al. 2017].

C A S S I N I F I N A L M I S S I O N REP O R T 2 01 9 1 3
Titan-magnetosphere interaction (TC2a) [Strobel et al. 2009; Strobel and Cui 2014; Simon et al. 2010]
Observe Titan’s plasma interaction as it goes from south to north of Saturn’s solar-wind-warped magnetodisk from one solstice to the next.
Titan’s ambient plasma conditions heavily depend on the properties of Saturn’s magnetodisk, which in turn is controlled by the solar wind pressure, Saturn seasons, and inner magnetospheric effects (periodicities and mass loading by rings + Enceladus). Thermal electron [Rymer et al. 2009], ion [Németh et al. 2011], energetic particle [Garnier et al. 2010], and field [Simon et al. 2010] flyby classifications are described extensively in Arridge et al. [2011]. Thermal ion composition in Saturn’s magnetodisk is also strongly dependent on magnetic latitude, with heavy (water group) ion density maximizing near Br = 0. [Szego et al. 2011].
The classification of Titan’s magnetospheric environment by energetic electrons relies on the four broad types identified by Rymer et al. [2009]: plasma sheet, lobe-like, magnetosheath, and bimodal, which result from variable solar wind pressure, day/night asymmetry, and the vertical flapping of the plasma sheet with respect to the equatorial plane. The plasma sheet region contains relatively high electron densities (~0.05 cm−3) and temperatures (~110 eV), whereas the lobe-like region has high temperatures (~110 eV), but much lower densities (~0.003 cm−3). Their respective energy fluxes into Titan’s atmosphere are ~1.6 × 10⁹ eV cm−2 s−1 (2.6 × 10⁻³ erg cm−2 s−1) and ~1.2 × 10⁸ eV cm−2 s−1 (1.9 × 10⁻⁴ erg cm−2 s−1). Higher thermospheric temperatures have been associated with the plasma sheet environment, which is consistent with the factor of 10 enhancements in electron density. The magnetosheath is encountered, of course only when Titan is outside of Saturn’s magnetosphere and characterized by high electron densities (~0.4 cm−3) but cold temperatures (~30 eV) with an energy flux of ~2.5 × 10⁹ eV cm−2 s−1 (4.0 × 10⁻³ erg cm−2 s−1). The bimodal regions have two distinct electron populations: the more energetic population being plasma sheet or lobe-like (electron densities (~0.004 cm−3) and temperatures (~350 eV)) and the less energetic population suggestive of local pick-up (electron densities (~0.1 cm−3) and temperatures (~10 eV)) [Rymer et al. 2009]. For bimodal regions the energy flux is approximately 1 × 10⁹ eV cm−2 s−1 (1.6 × 10⁻³ erg cm−2 s−1).
Titan’s location with respect to Saturn’s magnetodisk is also dependent on the phase of a rotating perturbation within Saturn’s inner magnetosphere [Southwood and Kivelson 2007]. In particular, Titan’s proximity to Saturn’s magnetodisk current sheet depends [Arridge et al. 2008; Bertucci et al. 2009] on the so-called Saturn Longitude System [Kurth et al. 2008] which organizes fields and particle periodicities inside Saturn’s magnetosphere. Vertical and radial excursions of the upstream plasma flow are expected to be influenced by this effect [Sillanpaa et al. 2011; Achilleos et al. 2014].
The solar wind dynamic pressure also influences Titan’s interaction by distorting Saturn’s magnetodisk into a bowl shape during off-equinox periods [Achilleos et al. 2014]; and in coincidence with the arrival of ICMEs and CIRs [Roussos et al. 2018], by controlling the location of Saturn’s magnetopause and bow shock [Kanani et al. 2010].

1 4 V OL U M E 1 : M I S S I O N OV E RVI EW & S CI E N CE OBJ E C TI V ES A N D RE S ULT S
During solar wind excursions [Bertucci et al. 2008, 2015] the orientation and strength bundles of draped magnetic field lines inside Titan’s magnetosphere suggest field lines take between 20 min to 3 h to travel across the interaction region in agreement with predictions [Neubauer et al. 2006]. The geometry of the magnetotail/magnetosphere agrees with upstream conditions for most orbits [Simon et al. 2010].
While a search for an intrinsic Titan magnetic field has yielded negative results, the magnetometer data show that the moon’s magnetic environment is strongly affected by its proximity to Saturn’s warped and highly dynamic magnetodisk [Simon et al. 2010]. In the nightside sector of Saturn’s magnetosphere, the magnetic field near Titan is controlled by intense vertical flapping motions of the magnetodisk current sheet, alternately exposing the moon to radially stretched lobe-type fields and to more dipolar, but highly distorted current sheet fields [Simon et al. 2010]. The upper limit to the intrinsic magnetic moment is 0.78 nT RT3 according to Wei et al. [2010].
Titan’s thermosphere and exosphere are also very dynamic and temporally variable. Qualitatively, Cassini in situ measurements point to an important role for Saturn’s magnetospheric interaction as a key driver of this observed variability. Quantitatively based on Cassini data, the measured and derived magnetospheric power inputs to the upper atmosphere are smaller than solar EUV and UV power input on a globally averaged, orbital averaged basis. Only on very rare occasions does magnetospheric power input equal solar
input. This leads to the conclusion that solar radiation mostly heats the upper atmosphere, whereas magnetospheric particle precipitation plays a more important role in the ionization of the atmosphere below the main ionosphere (z < 900 km). This is consistent with the absence of N2 ultraviolet signatures of magnetospheric power input to Titan’s upper atmosphere in nightside EUV spectra [Ajello et al. 2007; West et al. 2012] and UV dayglow observations [Stevens et al. 2011] with UVIS.
On a related issue, we note that the evidences for a link between magnetospheric inputs and Titan’s ionosphere are scarce. The fact that an ionospheric response to magnetospheric inputs is harder to observe than a thermospheric response is associated with the different timescales involved. Characteristic ion-chemical time constants in Titan’s ionosphere are ~ (10–1000) sec, shorter than or comparable to the time interval that the Cassini spacecraft typically spent below Titan’s exobase. This means any ionospheric response to Saturn’s magnetosphere can only be captured as it occurs luckily during a Titan encounter.
Analysis of Cassini data has not yielded any proven correlation between the temperature of Titan’s thermosphere and ionospheric signatures attributed to enhanced particle precipitation, which suggests that the correlation is not indicative of a physical connection. In summary based on all of Cassini observational data analyzed to date in conjunction with theoretical studies, an upper limit of 10% on the ratio of magnetospheric power input to solar EUV and far ultraviolet (FUV) power input into Titan’s upper atmosphere can be placed on an orbital, globally averaged basis.
Titan’s thermosphere and exosphere are also very dynamic and temporally variable.

C A S S I N I F I N A L M I S S I O N REP O R T 2 01 9 1 5
Table TITAN-2. Titan energy source magnitudes. Energy Source Reference r at peak
(km)
Energy Flux
(erg/cm^2/s)
Global Input
(GW)
Solar Lyman-alpha LASP- solar min 3400 0.017 2.4
Solar Lyman-alpha LASP- solar med 3400 0.022 3.2
Solar Lyman-alpha LASP- solar max 3400 0.027 4
Solar EUV SEE- solar min 3700 0.008 1.5
Solar EUV SEE- solar med 3700 0.018 3.1
Solar EUV SEE- solar max 3700 0.022 4
Mag e- PS Rymer [2009] 4000 0.0026 0.5
Mag e- Lobe Rymer [2009] 4000 0.0002 0.04
Mag e- MS Rymer [2009] 4000 0.004 0.8
Mag e- Bimodal Rymer [2009] 4000 0.0016 0.3
Mag i+ PS
Mag i+ Lobe
Mag i+ MS
Mag i+ Bimodal
ENAs Brandt [2001] 3400 0.008 1.1
O+ ions Shah [2009] 3500 0.01 1.4
The entries in Table TITAN-2 correct the UV entries in Sittler et al. [2009], Table 16.1 shown
in Table TITAN-3.
Table TITAN-3. Titan upper atmosphere and its induced magnetosphere. Table from Sittler et al. [2009], Table 16.1.1.
Energy Source Energy Flux
(erg/cm2/s)
Global Input
(Watts)d
Comments
Plasma protons 1.6e-4 3.4e7 Magnetized
Plasma electrons 1.6e-4 3.4e7 Magnetize
Plasma heavy ions 1.5e-3 3.2e8 Unmagnetized
Energetic ions 5.0e-4 to 1.0e-2 1.05e8 to 2.0e9 27 < Ep < 255 keVa
Energetic electrons 2.0e-4 4.0e7 28 < Ee < 533 keVa,b
UV airglow 1.6e-3 3.5e8 Altitude ~1,300 kmc
UV ionization 1.6e-4 3.4e7 Altitude ~1,300 kmc
Ohmic heating Not yet known
GCR 1.6e-4 to 2.7e-3 3.2e7 to 5.4e8 Integrated flux
Dust 1.8e-3 1.8e8 Interplanetary dust a Model by Ledvina et al. [2005] show some magnetic channeling of 50 keV protons. If heavy ions (0+) Unmagnetized. Expect energetic electrons to be more magnetized than protons. b Energetic electron energy flux derived from Krupp et al. [2005]. c For T0 at 90° phase angle UV absorption peaked at 1,325 km, while for TB at 0° phase angle absorption peaked at 1,095 km altitude. d Exobase at r ~4,000 km and 4π area 2 × 1018 cm2.

1 6 V OL U M E 1 : M I S S I O N OV E RVI EW & S CI E N CE OBJ E C TI V ES A N D RE S ULT S
Titan’s surface (TN1a) (T_AO4)
The Cassini-Huygens mission has revealed the surface of Titan in unprecedented detail, enabling us to discern the different geomorphologic units on the surface, constrain the relative times of emplacement and place constraints on composition. Titan has an icy crust, but water ice signatures are not easily detected due to atmospheric scattering and absorption that hamper the observations, as well as the presence of complex organic molecules on the surface. The extended, dense, and hazy N2−CH4 dominated atmosphere shields the surface from direct optical observations, except at certain wavelengths where the methane absorption is weak. These atmospheric windows are exploited by the Cassini VIMS to obtain compositional information and by VIMS and the ISS to map surface features. In addition, Cassini RADAR altimetry and SARTopo [Stiles et al. 2009] have documented elevations ranging over ~2300 m [Corlies et al. 2017; Lorenz et al. 2013] and put constraints on Titan’s global topography. Compared to the Moon’s or the Earth’s surfaces, off-nadir radar response from most of Titan’s surface is quite strong at Ku-band, indicating that more complex processes than simple surface scattering, such as a significant volume scattering component, have to be considered [Wye et al. 2007; Janssen et al. 2016]. Indeed, signals from Cassini RADAR Ku-band instrument, given the low Titan surface temperatures and the low loss tangent of material analogs relevant to Titan’s surface, should produce radar waves that can penetrate the surface down to a depth ranging from a few decameters, for an organic and compacted near-surface, Paillou et al. [2008], to several meters, for a pure water ice near-surface, Paillou et al. [2008], and have thus multiple opportunities to be scattered. The above referenced observations of Titan’s surface are themselves consistent with sub-surface and volume scattering processes, in addition to pure surface scattering. Scatterometer and radiometer measurements alike are even, in some locations, best fit using models where volume scattering is enhanced by coherent backscatter processes [Zebker et al. 2008; Janssen et al. 2011].
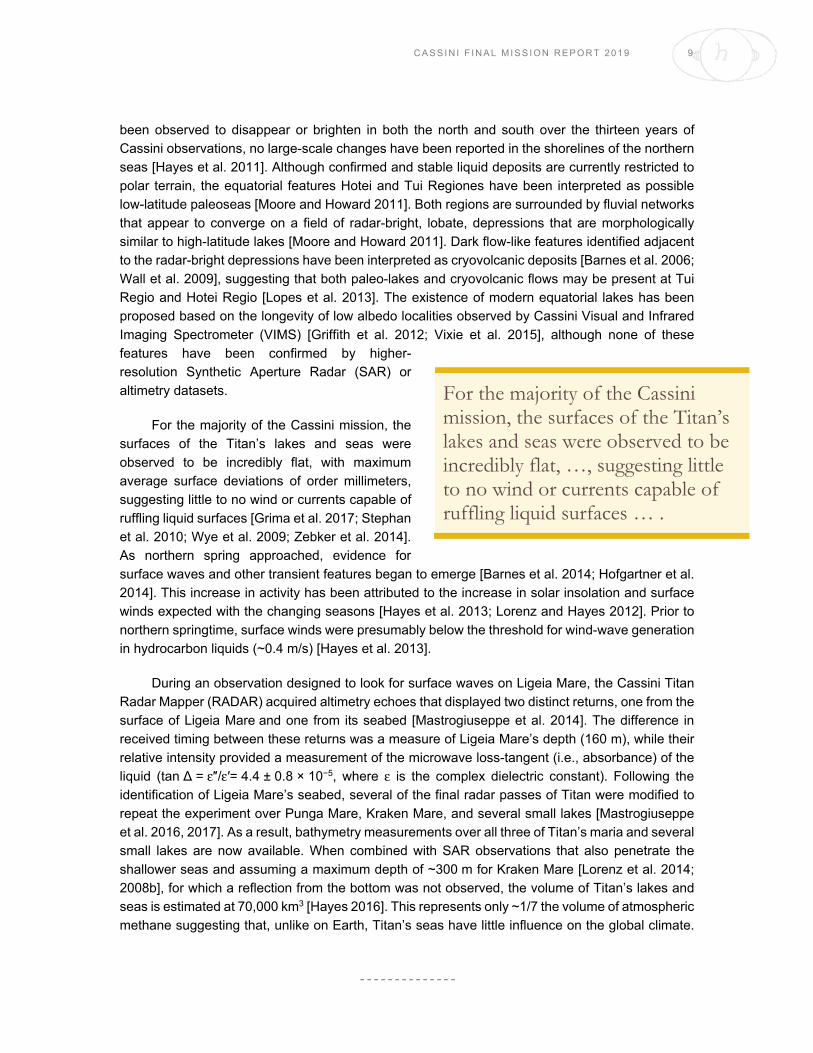
Janssen et al. [2016] further advance that a regionally enhanced degree of volume scattering is indicative of a higher abundance of water-ice in the near-surface, water-ice being more transparent to microwaves than organics and thus allowing for more opportunities for scattering. Based on this idea, about 10% of Titan’s near-surface is water ice-rich while the composition of the remaining terrains is dominated by more absorbing organic materials, by-products of the intense atmospheric photochemistry (Figure TITAN-2). The regions with a high degree of volume scattering include mountainous terrains, craters as well as fan-like features, possibly corresponding to flowing material resulting from cryovolcanism, the radar signature of which could be explained by a strong volume scattering effect in a thick water-ammonia ice layer using a two-layers scattering model [Paillou et al. 2006] as shown in Figure TITAN-3. Radar-bright sinuous channels in the southwest of Xanadu, showing very large radar cross-sections, are also consistent with the presence of icy low-loss rounded scatterers, acting as efficient natural retro-reflectors [Le Gall et al. 2010].
Weaker radar reflectors such as Titan’s dunes are most likely organic in nature, as also supported by VIMS [Soderblom et al. 2009]. However, we note that they exhibit high-amplitude scattering as compared to Earth analogs, which is consistent with a volume scattering component added to the surface component due to the radar wave penetration in aeolian sediments, implying that the dune material is either inhomogeneous or presents a high porosity [Paillou et al. 2014].

C A S S I N I F I N A L M I S S I O N REP O R T 2 01 9 1 7
Mega-yardang structures were observed on Titan, and they also present a much brighter radar signature than their terrestrial analogs, indicating that additional scattering processes, such as volume scattering, should occur [Paillou et al. 2016].
Figure TITAN-2. Global mosaic of emissivity of Titan at the 2 cm wavelength of the Cassini RADAR. This is the final result of the brightness temperature mapping of Titan incorporating all radiometric data obtained from Titan passes Ta through T98, a nearly ten-year span. The brightness temperature was measured as a function of position, polarization and time over a wide range of geometries and ranges and calibrated to about 1% absolute accuracy using Huygens probe and CIRS temperature measurements as described in Janssen et al. [2016]. The polarization data were used to construct a global mosaic of effective dielectric constant, enabling the conversion of all measured brightness temperatures to their equivalent values at normal incidence. The data were then folded into a massive least squares solution for the seasonally varying brightness temperature distribution of Titan over the time scale of the observations. Comparison with surface temperature measurements obtained in the infrared (IR) using Kirchhoff’s law then enabled the construction of the emissivity map shown.
1 8 V OL U M E 1 : M I S S I O N OV E RVI EW & S CI E N CE OBJ E C TI V ES A N D RE S ULT S
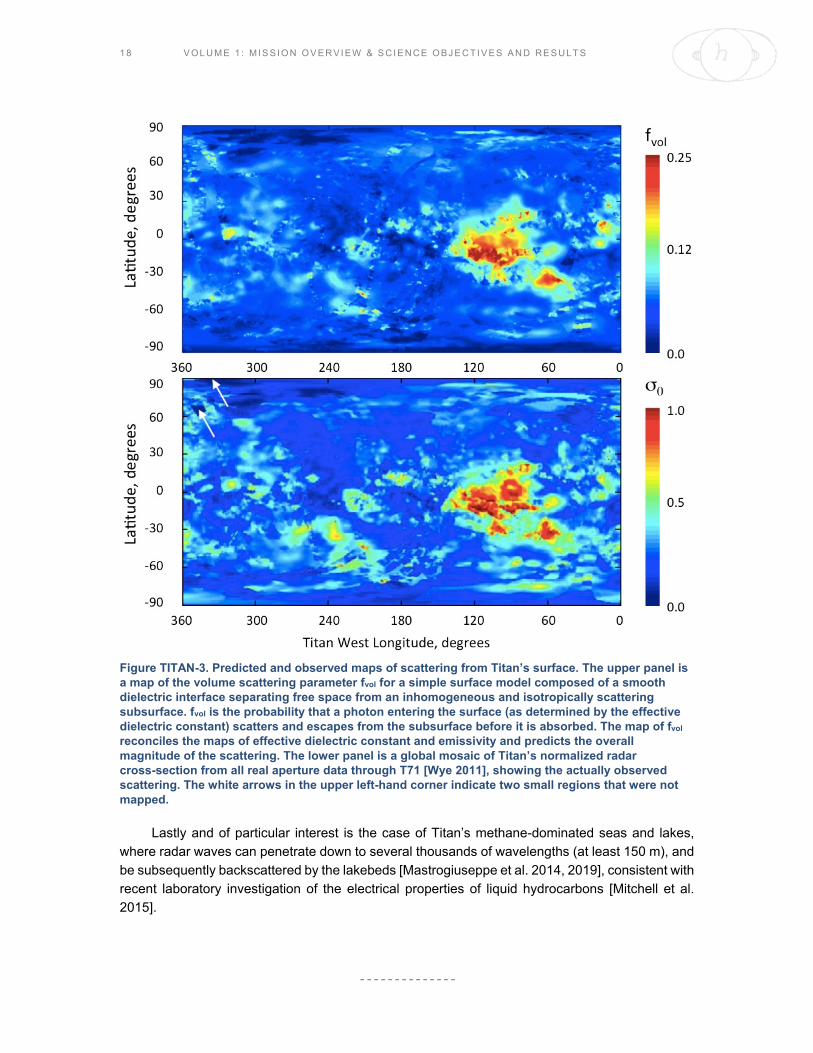
Figure TITAN-3. Predicted and observed maps of scattering from Titan’s surface. The upper panel is a map of the volume scattering parameter fvol for a simple surface model composed of a smooth dielectric interface separating free space from an inhomogeneous and isotropically scattering subsurface. fvol is the probability that a photon entering the surface (as determined by the effective dielectric constant) scatters and escapes from the subsurface before it is absorbed. The map of fvol reconciles the maps of effective dielectric constant and emissivity and predicts the overall magnitude of the scattering. The lower panel is a global mosaic of Titan’s normalized radar cross-section from all real aperture data through T71 [Wye 2011], showing the actually observed scattering. The white arrows in the upper left-hand corner indicate two small regions that were not mapped.
Lastly and of particular interest is the case of Titan’s methane-dominated seas and lakes, where radar waves can penetrate down to several thousands of wavelengths (at least 150 m), and be subsequently backscattered by the lakebeds [Mastrogiuseppe et al. 2014, 2019], consistent with recent laboratory investigation of the electrical properties of liquid hydrocarbons [Mitchell et al. 2015].

C A S S I N I F I N A L M I S S I O N REP O R T 2 01 9 1 9
Surface observations analyzed in view of deriving the surface albedo and determining the composition are rendered difficult on Titan due to the atmospheric interference with the main opacity due to methane and which allows direct access to the surface only at a few specific frequencies in the near-infrared where the methane absorption is weak—for example, Niemann et al. [2010]. Nonetheless, re-analysis of the entire ISS dataset acquired in the 938 nm methane window has yielded a complete global map of Titan’s surface at resolutions better than a few kilometers with albedos calibrated to Huygens Descent Imager/Spectral Radiometer (DISR) ranging from 0.25 in the dunes to 0.9 at Hotei Arcus [Karkoschka et al. 2017]. A combination of RADAR and spectral imaging data—VIMS—is required in order to distinguish and categorize the geomorphological features into units with distinct chemical compositions that remain to be identified. Several investigators have applied radiative transfer codes in addition to data set comparisons—for example, Hirtzig et al. [2013]; Solomonidou et al. [2014]; Lopes et al. [2016]. These studies allow definition of both the surface and the atmospheric contributions in VIMS spectral imaging data in the near-IR after performing the appropriate pixel selection of areas of interest with the help of SAR data.
The radiative transfer code application to the VIMS Titan data yields extracted weighted surface albedos in the seven methane windows tested against a variety of Titan candidate ice and organic constituents to provide constraints on the possible material present at various geomorphological units, as reported in Solomonidou et al. [2018]. An updated material library is being used based on Bernard et al. [2006]; Brassé et al. [2015]; Grenoble Astrophysics and Planetology Solid Spectroscopy and Thermodynamics (GhoSST) database [https://ghosst.osug.fr]. The library includes several materials at different grain sizes, such as ices of acetylene (C2H2), ethylene (C2H4), ethane (C2H6), propane (C3H8), cyanoacetylene (HC3N), water (H2O), ammonia (NH3), methane (CH4) and carbon dioxide (CO2), in addition to spectra of laboratory tholins [Bernard et al. 2006; Brassé et al. 2015], and spectra of dark materials such as asphalite, kerite, different types of anthraxolite and amorphous carbon, which have been proposed as capable of lowering the total surface albedo of Titan’s surface [Lellouch 2006; GhoSST]. Considering the different grain sizes, the library consists of 148 different constituent possibilities that can also be mixed. By using this constituent library spectral simulations are made and via an iterative process the best fit to the observations is obtained, bearing in mind that there is no unique solution for all of the mixtures. With these and other caveats described in Solomonidou et al. [2018], these authors have derived constraints on the possible major constituent for each geological unit and reported a latitudinal dependence of Titan’s surface composition, with water ice being the major constituent at latitudes poleward of 30° N and 30° S, while Titan’s equatorial region appears to be dominated partly by a tholin-like or by a very dark unknown material. The surface albedo differences and similarities among the various geomorphological units constrain the implications for the geological processes that govern Titan’s surface and interior (for example, aeolian, cryovolcanic, tectonic).
Data from SAR and other RADAR modes, aided by data from VIMS and ISS, have provided sufficient information on Titan’s surface to distinguish different types of geologic units [Lopes et al. 2010, 2016; Malaska et al. 2016] and establish the major geomorphologic unit classes on Titan and their relative ages using contacts between units. The classes of units are mountainous/ hummocky terrains, plains, dunes, labyrinthic terrains, craters and lakes. The oldest units are the

2 0 V OL U M E 1 : M I S S I O N OV E RVI EW & S CI E N CE OBJ E C TI V ES A N D RE S ULT S
mountainous/hummocky and the labyrinthic terrains; it is not possible with currently available data to differentiate the relative ages of these two oldest types of terrain. The mountainous/hummocky terrains consist of mountain chains and isolated radar-bright terrains. The labyrinthic terrains consist of highly incised dissected plateaus with medium radar backscatter. The plains are younger than both mountainous/hummocky and labyrinthic unit classes. Dunes and lakes of liquid hydrocarbons are the youngest unit classes on Titan. Additionally, we have identified individual features such as crater rims, channels, and candidate cryovolcanic features. Crater rims and candidate cryovolcanic features are locations more likely to expose materials from the icy crust, while the hummocky/mountainous materials are thought to be exposed remnants of the icy crust.
Characterization and comparison of the properties of the unit classes and the individual features with data from radar radiometry, ISS, and VIMS provides information on their composition and possible provenance. The hummocky/mountainous terrains and impact crater rim features have relatively low emissivity (and greater radar scattering) in radiometric data, consistent with more water ice near the surface. We can also use these correlations to infer global distribution on regions not covered by SAR. This is particularly important as SAR data will not provide complete
coverage of Titan by the end of the Cassini mission.
Matching the different surface units with specified mixtures of materials sheds light on the interconnection between the interior, the surface, and the atmosphere. In Solomonidou et al. [2018] three groups of compositional mixtures are reported, which include the major geomorphological units mentioned in the previous section, among three candidates (water ice, tholin, and a dark component). The units with spectral response similar to water ice are the labyrinth terrains and a
number of plains such as the streak-like, the scalloped, and the undifferentiated plains that are concentrated at the higher parts of the midlatitudes. The crater ejecta and the alluvial fans are part of a different compositional group in which a tholin-like material is dominant. Furthermore, the units covered with an unknown dark constituent are the hummocky/mountainous terrains, the variable plains, the dunes, and the undifferentiated plains that are close to the equator and possibly contaminated by dune material [Lopes et al. 2016; Solomonidou et al. 2018].
Plains are the most widespread type of terrain on Titan [Lopes et al. 2016]. Although there are several different types of plains, by far the most extensive are the Undifferentiated Plains, first mapped by Lopes et al. [2010]. These are vast expanses of radar-dark terrains that appear fairly uniform in SAR images, with no major topographic units, and are for this reason often referred to as blandlands. Lopes et al. [2016] mapped the distribution of the Undifferentiated Plains using SAR swaths up to flyby T92 (July 2013) and found that these terrains are located mainly at mid-latitudes. Their gradational boundaries and paucity of recognizable features in SAR data make geologic interpretation challenging, so Lopes et al. [2016] used all the RADAR datasets available, plus VIMS and ISS, to examine and evaluate different formation mechanisms including: (i) cryovolcanic origin, consisting of overlapping flows of low relief; or (ii) sedimentary origins, resulting from
Matching the different surface units with specified mixtures of materials sheds light on the interconnection between the interior, the surface, and the atmosphere.
C A S S I N I F I N A L M I S S I O N REP O R T 2 01 9 2 1
fluvial/lacustrine or aeolian deposition, or accumulation of photolysis products created in the atmosphere. Their analysis showed that the Undifferentiated Plains unit is consistent with a composition predominantly containing organic rather than icy materials and formed by depositional and/or sedimentary processes. They concluded that aeolian processes played a major part in the formation of the Undifferentiated Plains, although other processes (fluvial, deposition of photolysis products) are likely to have contributed, possibly in differing proportions depending on location. However, the distribution of Undifferentiated Plains, both at local and global scales, is consistent with aeolian deposition being the major process contributing to their formation. Spectral differences between the Plains and Dunes seen in VIMS data imply that the materials, at least on the top layers of the surface, are not exactly the same. Spectral differences in terms of surface albedo values between locations of Undifferentiated Plains [Lopes et al. 2016; Solomonidou et al. 2018] show that Plains at lower latitudes (closer to the dune seas) are more spectrally similar to dune materials, implying that they are related and supporting the idea that dunes materials are transported by wind to mid-latitudes. The Undifferentiated Plains appear to be composed of insoluble organic materials which may have been cemented by an organic substance and/or wetted by methane, causing them to become spectrally different from dune materials, at least at a surficial level. If the Undifferentiated Plains materials are the result of aeolian deposition, but contain liquids due to methane rain or fluids transported by channels, this would explain why they show relatively high emissivity (lower global dielectric constant, less efficient volume scattering) as well as why they are free of dunes (reduced sediment mobility). It would also be consistent with the high level of degradation of craters found at mid-latitudes—efficient erosion by fluvial/pluvial/subsurface flow activity, [Neish et al. 2016]. Le Gall et al. [2011] suggested that the latitudinal changes in dune-to-interdune ratio and possible variations in the thickness of the interdunal sand cover are likely related to changes in sediment availability at higher latitudes. These changes may be due to a decrease in sediment supply with distance from sediment source areas, an increased soil moisture content at higher latitudes (reflecting Titan’s climate integrated over several seasonal cycles), or an enhanced wind transport capacity.
DUNES
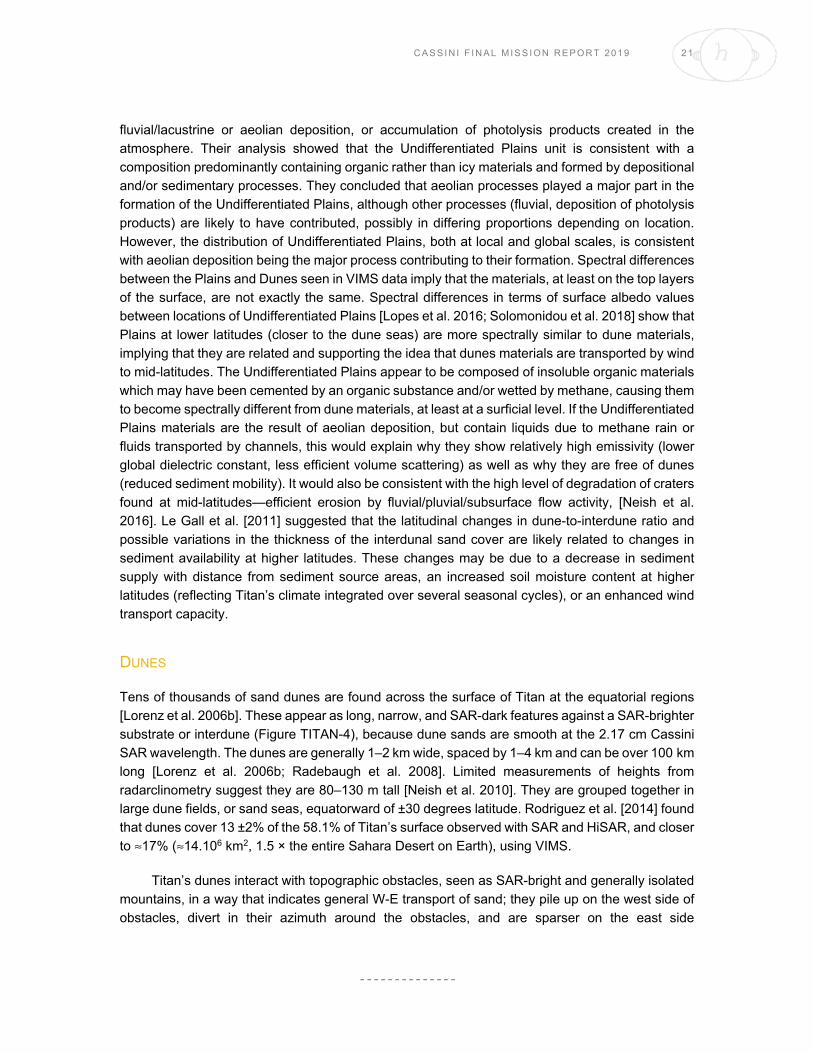
Tens of thousands of sand dunes are found across the surface of Titan at the equatorial regions [Lorenz et al. 2006b]. These appear as long, narrow, and SAR-dark features against a SAR-brighter substrate or interdune (Figure TITAN-4), because dune sands are smooth at the 2.17 cm Cassini SAR wavelength. The dunes are generally 1–2 km wide, spaced by 1–4 km and can be over 100 km long [Lorenz et al. 2006b; Radebaugh et al. 2008]. Limited measurements of heights from radarclinometry suggest they are 80–130 m tall [Neish et al. 2010]. They are grouped together in large dune fields, or sand seas, equatorward of ±30 degrees latitude. Rodriguez et al. [2014] found that dunes cover 13 ±2% of the 58.1% of Titan’s surface observed with SAR and HiSAR, and closer to ≈17% (≈14.106 km2, 1.5 × the entire Sahara Desert on Earth), using VIMS.
Titan’s dunes interact with topographic obstacles, seen as SAR-bright and generally isolated mountains, in a way that indicates general W-E transport of sand; they pile up on the west side of obstacles, divert in their azimuth around the obstacles, and are sparser on the east side

2 2 V OL U M E 1 : M I S S I O N OV E RVI EW & S CI E N CE OBJ E C TI V ES A N D RE S ULT S
[Lunine et al. 2008a; Radebaugh et al. 2010]. Their size, general morphology and relationship with underlying terrain and obstacles, and their style of collection are nearly identical to large, linear dunes in Earth’s sand seas of the Sahara, Arabia and Namibia [Lorenz et al. 2006b; Radebaugh et al. 2008; Le Gall et al. 2011, 2012]. Such dunes on Earth typically form under bimodal winds [Fryberger and Dean 1979; Tsoar 1983] or a dominant, slightly off-axis wind and a secondary wind causing sand flux down the dune long axis [Courrech du Pont et al. 2014; Lucas et al. 2014].
A fundamental challenge raised by the SAR observations of the dunes is the eastward direction of growth and sand transport [Lorenz et al. 2006b; Lorenz and Radebaugh 2009; Radebaugh et al. 2010]. This contrasts with expectations that low-latitude near-surface winds should generally blow to the west. The solution appears to be that the dunes reflect strong but infrequent eastward winds, either associated with vertical mixing in the atmosphere at equinox leading to strong westerly gusts [Tokano 2010] or methane rainstorms having a similar effect [Charnay et al. 2015]. Additionally, convergence of the meridional transport predicted in models—for example, Lucas et al. [2014] can further explain why Titan’s dunes are confined within ±30° latitudes, where sediment fluxes converge—see also Malaska et al. [2016].
Titan’s dune sands are not only dark to SAR but they are some of the darkest materials seen by ISS [Porco et al. 2005; Karkoschka et al. 2017] and have a low albedo and red slope as seen by VIMS, thus comprising the VIMS dark brown spectral unit, and highest-resolution VIMS images distinguish individual dunes as dark [Soderblom et al. 2007; Barnes et al. 2008; Clark et al. 2010; Rodriguez et al. 2014]. Volume scattering within the dunes is very low, consistent with smooth,
Figure TITAN-4. Dunes on Titan as seen by the Cassini SAR (wavelength 2.17 cm, with spatial resolution of 350 m) in the Belet Sand Sea, from the T61 (August 2009) swath on the equatorial leading hemisphere, at 11° S, 255° W. Dune surfaces are generally smooth and absorbing to SAR and thus appear as SAR-dark lines against a rougher and/or fractured, SAR-bright substrate. Open arrows indicate the direction of SAR illumination and incidence angle. Figure from Radebaugh et al. [2013].

C A S S I N I F I N A L M I S S I O N REP O R T 2 01 9 2 3
homogeneous surfaces in general, and lacking large voids or clasts [Janssen et al. 2009, 2016; Le Gall et al. 2011], although modeling by Paillou et al. [2014] suggests possible surface ripples and some volume scattering. The observations indicate the dunes cannot be composed of water ice, but rather must be made of organics, ultimately derived from photolytic processing of methane in the upper atmosphere and precipitation to the surface [Lorenz et al. 2006b, 2008a; Soderblom et al. 2007]. Sand sources could include river channels, as on Earth [Radebaugh 2013]; low-latitude evaporite deposits, which can show similar VIMS properties [Barnes et al. 2011]; or the midlatitude blandlands, though it is more likely that sands are being transported there from the equatorial regions [Lopes et al. 2016; Malaska et al. 2016]. The extent of the dunes indicates that sands have been generated and transported in great volumes across Titan and that processes have acted on the surface long enough to produce extensive and morphologically consistent landforms [Radebaugh 2013], with some evidence of change over time [Ewing et al. 2015].
In addition to dunes, other aeolian features and landforms on Titan’s surface include wind streaks and yardangs, or wind-carved ridges. The wind streaks are visible in ISS images as bright features that extend in the downwind direction from obstacles, for example, Porco et al. [2005]; Lorenz et al. [2006b]; Malaska et al. [2016]. SAR-bright, rough, elevated domes are crosscut by a series of parallel, long lineations ~1 km wide, spaced by a few km, and tens of kilometers long [Paillou et al. 2016]. They are similar in appearance and SAR brightness, radiometry and scatterometry to yardangs [Paillou et al. 2016]. These appear to have formed in easily eroded materials, similar to yardangs on Earth and Mars and further indicate the action of wind at moderate to high latitudes now or in the past. Craters: Before Cassini arrived at Saturn, the cratering history on Titan was unknown from direct observations. Estimates of the cratering rate were made by extrapolating the crater distributions observed on other Saturnian satellites, or by predicting impact rates by comet populations. Such estimates suggested that at least several hundred craters larger than 20 km in diameter should be present on Titan [Zahnle et al. 2003]; projectiles that create craters smaller than 20 km in diameter are expected to be disrupted by Titan’s thick atmosphere [O’Brien et al. 2005; Korycansky and Zahnle 2005]. However, Cassini observed an extreme paucity of craters compared to these predictions. Only 23 certain or nearly certain craters and ~10 probable craters have been documented on Titan in this size range, with a handful of smaller crater candidates [Wood et al. 2010; Neish and Lorenz 2012; Buratti et al. 2012; Neish et al. 2016]. This population suggests that Titan has a crater retention time of several hundred million years [Wood et al. 2010; Neish and Lorenz 2012], with the oldest regions located near the equator and the youngest regions located near the poles [Neish et al. 2016].
The craters that are observed on Titan all show evidence for extensive modification by exogenic processes (Figure TITAN-5.). River valleys are observed to cut through the ejecta blankets and floors of several impact craters [Wood et al. 2010; Soderblom et al. 2010; Neish et al. 2015]. Many of Titan’s impact craters are located in its equatorial sand seas, and also show evidence for extensive infilling by sand [Wood et al. 2010; Neish et al. 2013]. In addition to the morphologic evidence for erosion and burial, Titan’s craters are consistently shallower than similarly sized fresh craters on Ganymede (often by many hundreds of meters), suggestive of infill [Neish et al. 2013]. Given the distribution of depths, aeolian infilling appears to be the dominant modification process on Titan [Neish et al. 2013], but fluvial erosion seems to play an important

2 4 V OL U M E 1 : M I S S I O N OV E RVI EW & S CI E N CE OBJ E C TI V ES A N D RE S ULT S
secondary role [Neish et al. 2016]. Modification by viscous relaxation is expected to be minimal given the cold surface temperatures on Titan, although insulation by sand can enable some relaxation in Titan’s larger craters [Schurmeier and Dombard 2018].
In addition to being highly modified, Titan’s impact craters are not uniformly distributed across the moon. There is an almost complete absence of impact craters near Titan’s poles, with the majority of the craters found in the topographically high, equatorial sand seas [Neish and Lorenz 2014]. There have been several hypotheses advanced to explain this observation. Neish and Lorenz [2014] proposed the lack of craters near Titan’s poles may be indicative of marine impacts into a former ocean in this region. Moore et al. [2014] suggested that extreme climate change occurred in Titan’s recent past, causing global methane rainfall that produced sediment that settled in Titan’s topographically low poles, burying any craters there. Finally, Neish et al. [2016] suggested that an increased rate of fluvial erosion near the poles could degrade Titan’s craters to the point where they would be unrecognizable from orbit. In any case, it appears that Titan is an extremely dynamic world, and studying its impact craters can reveal much about the processes that have shaped it.
Cryovolcanism: The possibility of finding cryovolcanic features on Titan had been discussed prior to Cassini, for example, Lorenz [1993b, 1996a]. The case for cryovolcanism was strengthened by results from the Gas Chromatograph Mass Spectrometer (GCMS) instrument on board the Huygens probe, which detected the radiogenic isotope of Argon-40 in Titan’s atmosphere [Niemann et al. 2005] in concentrations suggesting that the atmosphere was in communication with a reservoir of the parent atom. Prior to the first Titan flyby using RADAR, VIMS imaged a bright feature (later named Tortola Facula) that Sotin et al. [2005] proposed to be cryovolcanic in origin, although SAR images obtained later in the mission showed Tortola Facula to be a local topographic high similar to others elsewhere on Titan [Lopes et al. 2013] and not a candidate for a cryovolcanic feature. Sotin et al. [2005] further suggested that the upwelling of large cryovolcanic plumes might be releasing sufficient methane into the atmosphere to account for the current atmospheric composition.
Figure TITAN-5. Nine probable impact craters observed on Titan by Cassini RADAR, from smallest (a) to largest (i). Impact craters on Titan show modification by exogenic processes such as fluvial erosion and infilling by sand. Figure from Neish et al. [2013].

C A S S I N I F I N A L M I S S I O N REP O R T 2 01 9 2 5
Cassini RADAR and VIMS revealed several features that have been interpreted as cryovolcanic in origin [Lopes et al. 2007, 2013; Soderblom et al. 2009; Wall et al. 2009; Solomonidou et al. 2016]. However, the interpretation has been the subject of some debate—for example, Moore and Pappalardo [2011]—and has not been entirely resolved by Cassini data [Nixon et al. 2018], primarily due to limitations in spectral resolution and coverage. The interpretations of RADAR—SAR, stereogrammetry [Kirk et. al. 2010], SARTopo [Stiles et al. 2009], and radiometry—and VIMS surface albedos and compositional constraints are based on morphology, albedo differences between the cryovolcanic areas, their surrounding terrains and several other geomorphological features, and temporal variations detected by VIMS [Solomonidou et al. 2014, 2016, 2018]. However, the Cassini mission did not reveal any hot spots, i.e., thermal enhancements that would have provided conclusive proof. The detection of thermal activity at Titan’s surface using radiometry data (which is sensitive to variations of ~1K) or VIMS, would require Cassini’s instruments to be observing the right locations at the right times and on multiple occasions, an unlikely scenario given the relatively small number of candidate-cryovolcanic features [Lopes et al. 2010].
The strongest evidence for cryovolcanic features on Titan was put forward by Lopes et al. [2013] who combined SAR imaging (including stereogrammetry) and VIMS data for a region that includes two mountains, Doom Mons (40.4° W, 14.7° S) and Erebor Mons (36.2° W, 5.0° S), as well as a depression, Sotra Patera (40.0° W, 14.5° S), and a region consisting of flow-like features, Mohini Fluctus (centered at 38.5° W, 11.8° S). Doom and Erebor Montes are high mountains (Doom being ~70 km in diameter and 1.45 ±0.2 km high), and Sotra Patera is the deepest depression found on Titan (1.7 ±0.2 km deep). It is non-circular, and interpreted as a collapse feature adjacent to Doom Mons. Mohini Fluctus appears to emerge from Doom Mons. Other non-circular, depressions are located between the two Montes, and flow-like features also surround Erebor Mons.
A criticism by Moore and Pappalardo [2011] of initial interpretations by RADAR of cryovolcanic candidates reported by Lopes et al. [2007] is that flow-like features could have been produced by fluvial activity, as channels are seen in areas such as Hotei Regio and Ganesa Macula (which topography later showed was not a shield or dome as initially interpreted). However, the Doom Mons-Sotra Patera-Erebor Mons region is totally devoid of fluvial channels, making a fluvial origin for Mohini Fluctus and other flows unlikely. Moreover, a vast dune field is located between Doom and Erebor Montes, indicating a dry region. The depressions seen in the region, including Sotra Patera, are not circular and are therefore unlikely to have had an impact origin [Lopes et al. 2013]. Additionally, analysis of VIMS data using a radiative transfer code [Solomonidou et al. 2014] showed that the surface albedo of the candidate cryovolcanic features is different from that of plains or dunes, indicating differences in composition [Solomonidou et al. 2014]. Following this, and using a radiative transfer code on a large selection of VIMS data, Solomonidou et al. [2016] revealed temporal changes for the Sotra Patera and Mohini Fluctus area, potentially brightening by up to a factor of two in terms of pure surface albedo and brightness during one year (2005–2006), while surrounding areas and the undifferentiated plains and dunes did not present any significant change for the same period of time. The surface albedo variations, together with the presence of volcanic morphological features, suggest possible relation to the deep interior via cryovolcanic processes. Additional support for the cryovolcanic origin of these features comes from interior structure models
2 6 V OL U M E 1 : M I S S I O N OV E RVI EW & S CI E N CE OBJ E C TI V ES A N D RE S ULT S
of Titan and corresponding calculations of the spatial pattern of maximum tidal stresses [Sohl et al. 2014], which indicate that the Sotra Patera-Doom Mons-Erebor Mons area is a likely region for cryovolcanic activity.
Titan’s interior (TN1b) (T_AO4)
Static and time-varying gravity field measurements [Iess et al. 2010, 2012], rotational dynamics measurements [Stiles et al. 2008, 2010; Meriggiola et al. 2016] and shape models [Zebker et al. 2009; Mitri et al. 2014; Corlies et al. 2017] are used to infer the interior structure of Titan. Magnetic field measurements have shown that an intrinsic magnetic field is not present on Titan [Wei et al. 2010]. The determination of the rotational dynamics from Cassini RADAR SAR images is key to constrain the interior structure of Titan. As described above, Cassini RADAR SAR coverage of Titan is dependent on orbit dynamics and competition for observation time. As a result, SAR swaths appear randomly distributed with coincidental overlaps (with only a few exceptions). Where overlap occurs, and assuming that the same surface features appear in both images, it has been possible to determine how the surface of Titan has moved between observations and thus estimate Titan’s pole location and spin rate [Stiles et al. 2008, 2010], analogous to previous work using Magellan SAR imagery to estimate the spin model of Venus [Davies et al. 1992]. First, a set of recognizable landmarks were selected that are observed in two different SAR images obtained at different times. A pixel is chosen in each SAR image that corresponds as closely as possible to the same point on the landmark, using several techniques to minimize landmark mismatches. These pixels are then located in a Titan-centered inertial, non-rotating (J2000) frame. Finally, spin state parameters are estimated by minimizing the misregistration error, i.e., the apparent movement in Titan body-fixed coordinates of the landmarks between observation times. Thus, estimates of Titan’s spin state parameters and their error bars are obtained. Using similar methodology, Meriggiola et al. [2016] also provided a rotational model of Titan estimating the spin pole location, the spin rate, the precession and the nutation. Further, these authors have shown that the pole location is compatible with the Cassini state 1.
Stiles et al. [2008] and Meriggiola et al. [2016] have provided an estimate of Titan’s obliquity (0.31°). The obliquity together with the quadrupole moment of the gravity field (J2 and C22) measurements [Iess et al. 2010, 2012] can be used to infer the moment of inertia of Titan and, consequently, the radial mass distribution of Titan [Bills and Nimmo 2011]. Bills and Nimmo [2011] and Meriggiola et al. [2016] have shown that the estimated obliquity is compatible with a deep interior decoupled from the outer ice shell by a global subsurface ocean. The presence of a subsurface ocean inferred from the rotational dynamics of Titan is consistent with the large tidal response of Titan (tidal Love number k2 = 0.589 ±0.150) [Iess et al. 2012], see also Mitri et al. [2014]. In agreement with this scenario, the Permittivity, Wave and Altimetry (PWA) instrument on board Huygens’ probe has measured a Schumann-like resonance, suggesting also the presence of a subsurface ocean [Bèghin et al. 2012]. In summary, the gravity, topography and rotational dynamics measurements in combination with thermal-evolution models indicate that Titan presents internal differentiation, with an outer ice shell, a subsurface ocean, a high-pressure layer at the base of the ocean, and a deep rocky interior [Hemingway et al. 2013; Mitri et al. 2014; Tobie et al. 2014].

C A S S I N I F I N A L M I S S I O N REP O R T 2 01 9 2 7
Bills and Nimmo [2011] next used these results, combined with low-degree gravity field derived from Cassini spacecraft Doppler tracking data [Iess et al. 2010], to suggest that Titan’s outer shell is mechanically decoupled from the deeper interior, plausibly an outer ice layer which is mechanically decoupled from the deeper interior by an ocean. Taking this conclusion together with other evidence, there is emerging consensus that Titan possesses an internal ocean. Implications for the crustal and internal composition and origin of Titan are discussed by Tobie et al. [2014].
Cassini radar observations in both its altimeter and SARTopo modes reveal its global shape and yield insights to its interior structure. The roughly 60 satellite-derived elevation surface traces (Figure TITAN-6) show that Titan’s polar radius is less and equatorial radii greater than predicted by its gravity field.
Figure TITAN-6. Cassini measurements of Titan surface height above a reference sphere of 2575 km. Clear triaxial ellipsoid shape implies a body not in hydrostatic equilibrium, suggesting that depth to a subsurface ocean is less at the poles than at the equator.
The ratio (a−c) / (b−c), which is exactly 4 for a spin-locked satellite in hydrostatic equilibrium, for Titan’s figure is thus observed to be only 2.65. The corresponding third-degree gravity hydrostatic ratio is 3.83. While the gravity field is consistent with a hydrostatically relaxed body, the figure does not. If both of these data constraints pertain, Titan’s interior do not conform to a set of spherically symmetric shells, as these data imply that the average satellite density at the equator is less than that at the poles. If Titan has a vast interior ocean of liquid water, then some ice layers (less dense than liquid water) are thinner at the poles than the equator. A simple model satisfying both sets of data and assuming isostatic compensation (Figure TITAN-7) could be the result of uneven heat dissipation in Titan’s interior, such as may result from tidal interaction with Saturn or its other moons.
Another simple model realizing these is greater precipitation of hydrocarbon snow or loosely packed particulates at the equator than at the poles, perhaps with a net equatorward transport from the poles. We note that this is consistent with the observation of 100 m tall dune structures near Titan’s equator, so that poorly consolidated material may indeed collect there. Several hundred m of deposition at the equator would match the mean equatorial radii of both models, but precipitation would have to preferentially occur in the directions toward and away from Saturn, which seems unlikely.

2 8 V OL U M E 1 : M I S S I O N OV E RVI EW & S CI E N CE OBJ E C TI V ES A N D RE S ULT S
Figure TITAN-7. A model consistent with Cassini gravity and figure measurements, assuming isostatic compensation. The thinner ice shell at the poles could result from uneven heat dissipation within Titan from tidal interactions, and the higher “geoid” at the poles is one explanation for the preponderance of lakes at the most northern and southern latitudes.
Further comparison of the gravity and shape observations constrain the depth of any outer ice shell enclosing a global subsurface ocean. While the exact value varies depending on how the spherical expansion is constrained, our observed gravity to topography ratio is 0.070 for the third order terms and 0.042 for fourth order. These imply ice shell thicknesses of 327 and 187 km, respectively, twice or more of the 100 km expected from thermal models [Sohl at al. 2003; Nimmo and Bills 2010]. Our solution yields a tidal Love number h2t of about 0.5, and a basal heat flow of 2.5 mW/m2. This would suggest that heat from Titan’s core is lower than often assumed, hence the amount of radiogenic material in the core is likely less as well.
These data also constrain the depth of Titan’s mantle and density of its core, placing added restrictions on its composition and evolution. Supposing that Titan has an undifferentiated ice/rock core beneath the ocean, and that its moment of inertia is most likely in the range 0.33–0.34 [Iess et al. 2010], a 200 km crust estimate from above, and Titan’s well-known mean density of 1.88 g cm−3 implies an ocean depth and core density ranging from 308 km and 2.74 g cm−3 (MOI = 0.33) to 226 km and 2.55 g cm−3 (MOI = 0.34).
Titan atmospheric composition (TN1c) (T_AO2)
Observe vertical and horizontal distributions of trace gases, search for more complex organic molecules. Determine abundances of atmospheric constituents (including any noble gases), derive isotope ratios for abundant elements. Measure aerosol and heavy molecule layers and properties. Investigate energy sources for atmospheric chemistry, model the photochemistry of the stratosphere, study formation and composition of aerosols.
The chemistry of Titan’s atmosphere is driven by CH4 photolysis in the thermosphere and catalytic reactions in the stratosphere, and by N2 dissociation due to both UV photons and energetic

C A S S I N I F I N A L M I S S I O N REP O R T 2 01 9 2 9
electrons. Ethane is the most abundant gas product and HCN is the dominant nitrile. The mixing ratios of all photochemical species, except C2H4, increase with altitude at equatorial and southern latitudes, indicative of transport from a high-altitude source to a condensation sink in the lower stratosphere. Poleward of 45°, most product compounds are enriched as a consequence of subsidence in the winter polar vortex, particularly for nitriles and more complex hydrocarbons than C2H6 and C2H2. Most products have lower increases with altitude at high latitudes than at low latitudes. The vertical and horizontal distribution of trace gases with season have been well-reported and documented in publications by Coustenis et al. [2007]; Vinatier et al. [2010, 2015]. The gases include hydrocarbons (12CH4, 13CH4, CH3D, C2H2, C2HD, C2H4, C2H6, C3H4, C3H8, C4H2, C6H6), nitriles (HCN, HC3N), H2O, CO, and CO2, as well as the detection of long sought after propene (C3H6) by Nixon et al. [2013] to remove a three-decade gap in the hydrocarbon sequence. Vuitton et al. [2019] give a detailed review of our current understanding of Titan’s atmospheric chemistry at the end of the Cassini Mission.
Measurements of C, H, N isotopes provide constraints on photochemical fractionation mechanisms. While the Huygens GCMS measured 36Ar, 40Ar, and possibly 22Ne, only upper limits were placed on Kr and Xe. As a consequence, the origin of CH4 in the solar versus Saturnian nebula or conversion of CO2 to CH4 in Titan’s interior remains unconstrained. Also, CIRS tracer gas distributions have been used to diagnose models of stratospheric dynamics [Crespin et al. 2008]. The carbon isotope ratio 12C/13C was determined in CH3D [Bézard et al. 2007]; in HCN [Vinatier et al. 2007]; in HC3N [Jennings et al. 2008]; in CO2 [Nixon et al. 2008]; in CH4, C2H2, C2H6 [Nixon et al. 2008, 2012]; in C4H2 [Jolly et al. 2010]. The hydrogen isotope ratio D/H was derived from CH4 by Bézard et al. [2007] and C2H2 by Coustenis et al. [2008], whereas Nixon et al. [2008] obtained the oxygen isotope ratio 16O/18O from CO2.
The thermosphere is a chemical factory that initiates the formation of complex positive and negative ions in the high thermosphere as a consequence of magnetospheric-ionospheric-atmospheric interaction involving solar EUV and UV radiation, energetic ions and electrons. This factory produces very heavy positive and negative ions and large molecules [Shebanits et al. 2016], for example, benzene, naphthalene, nitriles, which apparently condense out and are detectable in solar and stellar UV occultations at ~1000 km [Liang et al. 2007; Kammer 2015], and initiate the haze formation process [Lavvas et al. 2013]. As these particles fall through the agnostosphere/ ignorosphere/mesosphere and grow, they become detectable by remote sensing: UVIS at ~900 down to ~300 km, ISS at ~500 km and below and eventual become ubiquitous throughout the stratosphere. These haze particles are strong absorbers of solar UV and visible radiation and play a fundamental role in heating Titan’s stratosphere [Bézard et al. 2018] and probably the mesosphere [Lavvas et al. 2009]. The differential heating with latitude drives wind systems in Titan’s middle atmosphere, much as ozone does in the Earth’s middle atmosphere.
The Huygens Probe measurements, and the Cassini orbiter measurements over a significant fraction of the Titan season, in particular, were responsible for major advances. The Descent Imager/Spectral Radiometer (DISR) measured intensity and polarization from the near-UV to 1.6 microns in the near-IR. Haze density profiles along the descent path from the ground to 160 km altitude were derived from these measurements, along with tight constraints on the size of the

3 0 V OL U M E 1 : M I S S I O N OV E RVI EW & S CI E N CE OBJ E C TI V ES A N D RE S ULT S
monomers that make up aggregate particles, as well as the mean size of the aggregates [Tomasko et al. 2008, 2009; Doose et al. 2016].
All of the Cassini orbiter optical instruments contributed new measurements and insights regarding the Titan haze. Solar and stellar occultations by the UVIS and VIMS instruments provided detailed vertical profiles over near-surface to high altitude (>700 km) [Koskinen et al. 2011]. Limb measurements by the CIRS instrument revealed vertical profiles of haze opacity in the thermal-IR and identified two polar haze layers, probably condensate layers, with spectral signatures near 50 microns. The components of aerosol composition have been inferred from CIRS observed spectral signatures of functional group vibrational modes and compared with laboratory produced Titan tholins [Vinatier et al. 2012] The ISS and VIMS instruments detected a high-altitude winter polar HCN cloud that formed shortly after equinox. The ISS instrument measured Titan’s detached haze and followed its altitude changes over a significant part of the seasonal cycle [West et al. 2018].
Titan atmospheric structure (TN2a) (T_AO5)
Resolve current inconsistencies in atmospheric density measurements (critical to a future Flagship mission). Investigate the upper atmosphere, its ionization, and its role as a source of neutral and ionized material for the magnetosphere of Saturn (Titan Upper Atmosphere (T_AO5)).
Titan’s atmosphere is predominantly N2 with CH4 the next most abundant molecule. It has a mole fraction of 0.05 just above the surface decreasing to 0.014 in the stratosphere. Above the homopause (~800–850 km), it increases to 0.12 at the exobase. The third abundant molecule is H2 with a tropospheric mole fraction of 0.001 increasing to 0.004 at ~1000 km and ~0.02 at the exobase (~1500–1600 km). There is a large suite of hydrocarbons, nitriles, other nitrogen and also oxygen bearing compounds. Titan possesses a mostly stable troposphere with a well-defined tropopause (T ~70 K at ~44 km) and a lower stratosphere with a high static stability, which is extremely cold over the winter polar region and warm over the summer pole (Figure TITAN-8 and Figure TITAN-9). Remarkably in the middle stratosphere, the warmest temperatures occur at the equator and the largest meridional temperature gradients are found in the winter hemisphere. The stratopause from the summer pole to about 45° winter hemisphere remains at a relatively constant pressure of 0.1 mbar/300 km and then it rises rapidly upward to ~0.01 mbar/400 km at the winter north pole, where it is the warmest region in the entire atmosphere. One possible interpretation of the HASI temperature profile is that Titan’s atmosphere is essentially isothermal ~170 K from 500–1100 km, with large amplitude thermal waves (10 K) superimposed. The existence and location of a well-defined mesopause is an open question.
The Huygens HASI instrument provided along its trajectory essentially continuous profiles of mass density, pressure, and temperature from an altitude of 1350 km down to the surface. While
Remarkably in the middle stratosphere, the warmest temperatures occur at the equator and the largest meridional temperature gradients are found in the winter hemisphere.

C A S S I N I F I N A L M I S S I O N REP O R T 2 01 9 3 1
only at one time and location, it provided an important reference atmosphere to compare with measurements by other instruments of latitudinal and seasonal variations over the 13 years of active observations. But Lellouch et al. [2014] found that the CH4 mole fraction near 15 mbar (~85 km) varied from ~1.0 % at low latitudes, in disagreement with the Huygens GCMS measurement of 1.48 %, and near ±50–55°, but ~1.5 % at ±30–35° and polar latitudes. The retrieved thermal profile from CIRS is about 3–5 K colder than HASI in the 2–20 mbar region with CH4 = 1.48 % (cf. Figure TITAN-8). But with CH4 = 1.0 %, the CIRS derived temperature below 147 km altitude (2.7 mbar), agrees with the HASI direct measurements by its temperature sensor and would resolve the CIRS/HASI differences in the temperatures below 147 km at the Huygens landing site.
The chemistry of Titan’s atmosphere is driven by CH4 photolysis in the thermosphere and catalytic reactions in the stratosphere, and by N2 dissociation due to both UV photons and energetic electrons. Ethane is the most abundant gas product and HCN is the dominant nitrile. The mixing ratios of all photochemical species, except C2H4, increase with altitude at equatorial and southern latitudes, indicative of transport from a high-altitude source to a condensation sink in the lower stratosphere. In northern hemisphere winter northward of 45° N, most photochemically produced compounds are enriched as a consequence of subsidence in the polar vortex, particularly for nitriles
Figure TITAN-8. Titan possesses a mostly stable troposphere with a well-defined tropopause and a lower stratosphere with a high static stability. Black Lines: Comparison of Cassini-Huygens HASI density, pressure, and temperature profiles [Fulchignoni et al. 2005]. Red Lines: CIRS density and temperature profiles at 15 S [Vinatier et al. 2007]. Blue Lines: Average INMS Northern Hemisphere density profile mission with preflight calibration [Müller-Wodarg et al. 2008], needs to be increased by a factor of 2.2 [Teolis et al. 2015]. Green Lines: With the Voyager [Lellouch et al. 1989; Vervack et al. 2004] results, and the Yelle et al. [1997] engineering model, all as functions of altitude above surface.

3 2 V OL U M E 1 : M I S S I O N OV E RVI EW & S CI E N CE OBJ E C TI V ES A N D RE S ULT S
and more complex hydrocarbons than C2H6 and C2H2, and have lower increases with altitude at high latitudes than at low latitudes.
Figure TITAN-9. CIRS zonal mean temperatures (K) from limb and nadir spectra recorded between July 2004 and September 2006. Retrieved temperatures were averaged over 5° latitudinal intervals and smoothed three times with 10° boxcar function, Note that the north pole is on the left. [After Achterberg et al. 2008].
The thermosphere is a chemical factory that initiates the formation of complex positive and negative ions in the high thermosphere because of magnetospheric-ionospheric-atmospheric interaction involving solar EUV and UV radiation, energetic ions and electrons (Figure TITAN-11). This factory produces very heavy positive and negative ions and large molecules—for example, benzene, naphthalene, nitriles—which apparently condense out and are detectable in solar and stellar UV occultations at ~1000 km [Liang et al. 2007] and initiate the haze formation process [Lavvas et al. 2013]. As these particles fall through the mesosphere and grow, they become detectable by remote sensing: UVIS at ~1000 km, ISS at ~500 km and eventually become ubiquitous throughout the stratosphere. These haze particles are strong absorbers of solar UV and visible radiation and play a fundamental role in heating Titan’s stratosphere and perhaps the mesosphere [Lavvas et al. 2009]. The differential heating with latitude drives wind systems in Titan’s middle atmosphere, much as ozone does in the Earth’s middle atmosphere.

C A S S I N I F I N A L M I S S I O N REP O R T 2 01 9 3 3
Figure TITAN-10. Pressure/latitudes maps of temperature as a function of season from northern winter through late spring. Note that the north pole is on the right. Red marks on the horizontal scale give the latitudes where limb spectra were analyzed. White areas indicate regions where CIRS did not acquire limb spectra. White dashed lines show the levels above which the constraints on the thermal profiles are poor (typically because of a too low signal-to-noise ratio) [Vinatier et al. 2015].
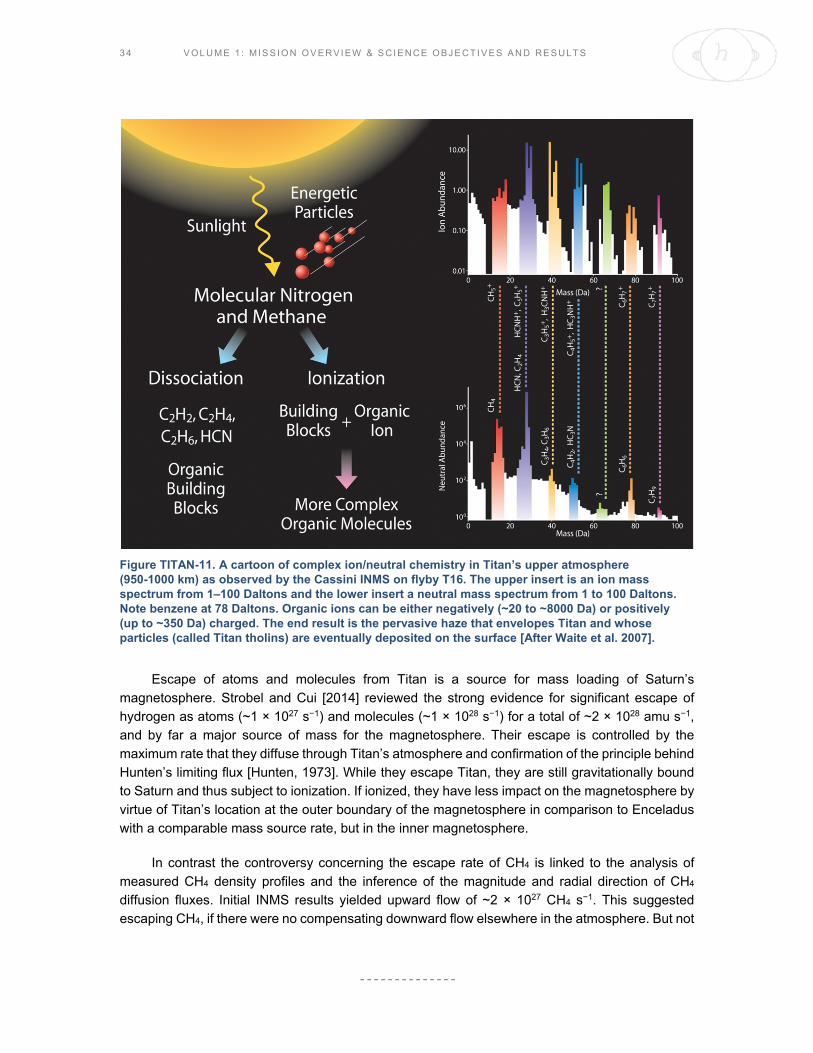
3 4 V OL U M E 1 : M I S S I O N OV E RVI EW & S CI E N CE OBJ E C TI V ES A N D RE S ULT S
Figure TITAN-11. A cartoon of complex ion/neutral chemistry in Titan’s upper atmosphere (950-1000 km) as observed by the Cassini INMS on flyby T16. The upper insert is an ion mass spectrum from 1–100 Daltons and the lower insert a neutral mass spectrum from 1 to 100 Daltons. Note benzene at 78 Daltons. Organic ions can be either negatively (~20 to ~8000 Da) or positively (up to ~350 Da) charged. The end result is the pervasive haze that envelopes Titan and whose particles (called Titan tholins) are eventually deposited on the surface [After Waite et al. 2007].
Escape of atoms and molecules from Titan is a source for mass loading of Saturn’s magnetosphere. Strobel and Cui [2014] reviewed the strong evidence for significant escape of hydrogen as atoms (~1 × 1027 s−1) and molecules (~1 × 1028 s−1) for a total of ~2 × 1028 amu s−1, and by far a major source of mass for the magnetosphere. Their escape is controlled by the maximum rate that they diffuse through Titan’s atmosphere and confirmation of the principle behind Hunten’s limiting flux [Hunten, 1973]. While they escape Titan, they are still gravitationally bound to Saturn and thus subject to ionization. If ionized, they have less impact on the magnetosphere by virtue of Titan’s location at the outer boundary of the magnetosphere in comparison to Enceladus with a comparable mass source rate, but in the inner magnetosphere.
In contrast the controversy concerning the escape rate of CH4 is linked to the analysis of measured CH4 density profiles and the inference of the magnitude and radial direction of CH4 diffusion fluxes. Initial INMS results yielded upward flow of ~2 × 1027 CH4 s−1. This suggested escaping CH4, if there were no compensating downward flow elsewhere in the atmosphere. But not

C A S S I N I F I N A L M I S S I O N REP O R T 2 01 9 3 5
every INMS flyby data set yielded high CH4 escape rates. In Cui et al. [2012], Table 5 and Strobel and Cui [2014], Table 10.1, occasionally, the CH4 flux is downward and/or indistinguishable from diffusion equilibrium, although about half of the orbits yielded preferentially strong upward flow of CH4. Titan’s upper atmosphere has shown considerably variability in the CH4 density profiles and temperature structure inferred from N2 density profiles from orbit to orbit—for example, Snowden et al. [2013]. Attempts to identify the drivers for this structure variability and inferred CH4 escape/loss rates yielded larger escape on the nightside over the dayside, whereas magnetospheric lobe-like conditions (factor of 10 reduction in energetic electron flux) yielded diffusive equilibrium, no net CH4 fluxes [Cui et al. 2012, Table 6], albeit in the latter case, it is the statistics of few flybys. Given this observed variability, one can question whether 1-D models are appropriate to derive only a single number: the globally averaged, Titan orbit averaged CH4 escape rate. Whereas one can present arguments that solar heating of Titan’s thermosphere is sufficient to support large CH4 escape rates, to date no models have been capable of accelerating a sufficient number of CH4 molecules in the collisional atmosphere to speeds that exceed the escape velocity at the exobase [Tucker and Johnson 2009].
Cassini INMS measurements based on roughly 100 Titan flybys during the Cassini mission yielded neutral and ion densities systematically lower, by factors approximately 2 to 3, than alternate methods to derive and infer densities, specifically, torque on the spacecraft measured by the Attitude and Articulation Control System (AACS) and the spacecraft atmospheric drag derived by the Navigation system [Teolis et al. 2015]. By correcting for an under-estimation of gas leakage out of the instrument into space by the original calibration model, and adjusting for the gain change, Teolis et al. [2015] developed a new calibration model that raises INMS densities upward by a constant detector sensitivity correction factor of 1.55 ±21%. With this new model the density ratio of AACS to INMS is now 1.47, but outside of the INMS error bars, and the density ratio of navigation (NAV) to INMS is now 1.16 and within the error bars. Although the three methods of determining atmospheric densities are much closer, one would want to know whether AACS or NAV is the more accurate method to derive densities.
The UVIS stellar and solar occultations are self-calibrating. In the case of the solar occultations one can retrieve density profiles in the altitude range 1120–1400 km for N2 and 850-1300 km for CH4, whereas UVIS stellar occultations are limited by interstellar hydrogen absorption to wavelengths above 91.1 nm. The CH4 dissociation cross-sections vary smoothly with wavelength and allow measurements of CH4 optical depths and densities, while complex N2 electronic band systems between 80–100 nm are not accessible to analysis with any confidence. T118 was the only flyby in the mission where UVIS and INMS observe Titan’s atmosphere simultaneously at the same latitude. UVIS sampled remotely by observing a solar occultation; INMS sampled the upper atmospheric density in situ with the hypersonic Cassini Spacecraft flying through the atmosphere at Mach 20–25.
The TAMWG report will discuss attempts to resolve current inconsistencies in atmospheric density measurements (critical to a future Flagship mission).
3 6 V OL U M E 1 : M I S S I O N OV E RVI EW & S CI E N CE OBJ E C TI V ES A N D RE S ULT S
Titan’s icy shell (TN2b) (T_AO2)
Work in this area is discussed in the section entitled Titan’s interior (TN1b) (T_AO4).
Titan meteorology (TN2c) (T_AO3)
Determine the surface temperature distribution, cloud distribution, and tropospheric winds. Measure winds and global temperatures; investigate cloud physics, general circulation, and seasonal effects in Titan’s atmosphere; search for lightning discharges.
Titan surface temperature maps from CIRS measurements over the period of 2004–2016 [Jennings et al. 2016] can be visualized at https://www.nasa.gov/image-feature/jpl/pia20020/titan-temperature-lag-maps-animation.
Winds were directly measured by the Doppler Wind Experiment (DWE) and inferred from DISR measurements during the descent of the Huygens Probe. From CIRS global mapping of stratospheric temperatures, zonal winds can be inferred via the gradient wind relationship from 10 mbar (~140 km) up to 0.001 mbar (~500 km) as a function of altitude and latitude with season. From the zonal winds one derives information on the location and structure of the polar vortex as a function of season. In conjunction with trace gas enrichment due to subsidence from upper-atmosphere photochemical source regions, the associated meridional circulation structure can be deduced as characteristically a single cell circulation with broad summer hemispheric upwelling and winter polar-confined subsidence or a two-cell transitional global circulation, with upwelling around the equator and subsidence at both poles, characteristic of equinoctial circulation reversal [Vinatier et al. 2015; Teanby et al. 2017]. Also, CIRS tracer gas distributions have been used to diagnose 2-D GCM models of stratospheric dynamics, for example, Crespin et al. [2008].
Cassini discovered not only that the polar vortices appear to be tilted by a few degrees relative to the spin axis of Titan but also that the entire stratosphere is tilted by a several degrees from the rotational pole [Achterberg et al. 2008b].
The radio occultation measurements by Radio Science Subsystem (RSS) have yielded density, pressure, and temperature radial profiles from the surface to ~ 300 km at discrete locations that yield information on the latitudinal structure of the atmosphere and can be coupled with the CIRS remote sensing data [Schinder et al. 2012]. The latitudinal temperature gradients in these radio occultation measurements imply that the velocity minimum in the zonal wind profile detected by the DWE between 70–80 km is a global phenomenon.
Guided by RSS and HASI measurements, Charnay and Lebonnois [2012] used a GCM to simulate the dynamics that governs the thermal structure of Titan’s planetary boundary layer, the lowermost atmosphere. From observations of dune spacing (~3 km) and the knowledge that the spacing is limited by the height of the planetary boundary layer [Andreotti et al. 2009], the boundary layer is ~3 km thick. The simulations yielded a convective boundary layer during the day, rising to an altitude of 800 m and a seasonal boundary of 2 km depth produced by the reversal of the Hadley

C A S S I N I F I N A L M I S S I O N REP O R T 2 01 9 3 7
cell at the equinox, with a dramatic impact on atmospheric circulation. Boundary layer clouds are a better interpretation of the previous discovery claim of fog at Titan’s south pole. They concluded that Titan’s troposphere possesses two boundary layers that control wind patterns, dune spacing and cloud formation at low altitudes.
Although liquids have flowed on the surface at Titan’s equator in the past, currently liquids are only found on the surface at polar latitudes. The vast expanses of dunes that dominate Titan’s equatorial regions require a predominantly arid climate.
VIMS near-infrared images of Titan’s clouds were acquired between July 2004 and September 2017 [Rodriguez et al. 2009, 2011; Turtle et al. 2018], following the evolution of clouds over 13 years including the equinox and northern summer solstice, greatly helping to further constrain global circulation models (GCMs). After four years of regular outbursts observed by Cassini between 2004 and 2008, southern polar cloud activity started declining. The extensive cloud system over the north pole, stable between 2004 and 2008, progressively fractionated and vanished as Titan entered into northern spring. At southern mid-latitudes, clouds were observed even after equinox, in a latitude band between 30 S and 60 S. Fewer clouds were observed closer to the equator, although they were slightly more frequent as equinox approached. As northern summer approached, cloud activity picked up at mid- and high northern latitudes as well.
ISS observations from April 2004 through September 2017 showed that clouds were generally more prevalent in the summer hemisphere, but revealed some surprises in locations and timing: with clouds remaining common at southern mid-latitudes longer than expected; north-polar clouds initially appearing much sooner than model predictions; and large north-polar summer convective systems not appearing before the mission ended, standing in marked contrast with south-polar activity observed over several years leading up to the southern summer solstice. Twice during the Cassini mission, ISS observations revealed changes in surface brightness consistent with methane rainfall darkening the surface [Turtle et al. 2009, 2011], first at Arrakis Planitia near the south pole in 2004–2005, Titan’s southern summer, and secondly along the southern boundary of the Belet dune field in 2010, following the equinox. Comparison of ISS and VIMS cloud observations to GCMs suggests that a polar-wetlands scenario, with subsurface reservoirs at both poles and relatively dry lower latitudes, better matches cloud locations and timing as well as the sporadic nature of the activity documented [Lora and Mitchell 2015; Mitchell and Lora 2016; Faulk et al. 2017; Turtle et al. 2018]. For a comprehensive discussion on weather, clouds, and storms on Titan from Cassini observations, see also Griffith et al. [2014].
Searches have been conducted for lightning by HASI, RPWS, and ISS with negative results. The full seasonality of the methane hydrological cycle has not been observed, in particular the pole to pole transport of methane, which may operate on the timescale of Milankovitch cycles [Aharonson et al. 2009].

3 8 V OL U M E 1 : M I S S I O N OV E RVI EW & S CI E N CE OBJ E C TI V ES A N D RE S ULT S
Other Titan science not in CSM TM: Titan as a system – its origin and mysteries
Titan Atmospheric Formation and Evolution (T_AO1) – Constrain scenarios of formation and evolution of Titan and its atmosphere.
Titan is the only moon in the solar system with an atmosphere so massive that it dominates the total volatile inventory in the surface-atmosphere system as well as providing strong radiative forcing and an active meteorology [Lorenz et al. 2005]. It also obscures the surface from view in both the optical and infrared, which is why the Cassini RADAR has been such a crucial tool. However, by the irreversible deposition of heavy hydrocarbons, nitriles, and other photochemical products from methane and nitrogen, the atmosphere also obscures the underlying surface geology to some extent. Were the current inventory of methane to condense onto the surface, it would form a layer 5 meters thick [Mitchell and Lora 2016], but a variety of evidence suggests that many times that number is present in various solid and liquid deposits of organics on and within the crust [Hayes et al. 2018].
Therefore, Titan’s geologic history is poorly constrained and in particular there is a significant uncertainty as to what fraction of body’s 4.5 billion year of existence is recorded in the surface. Observations relevant to its history include:
1. The low observed numbers of impact craters [Porco et al. 2005] yield an age of hundreds of millions of years, not billions [Lorenz et al. 2007; Wood et al. 2010; Neish and Lorenz 2012].
2. The rate of photodissociation of methane in Titan’s atmosphere implies that the current gaseous inventory will be depleted in some tens of millions of years [Yung et al. 1984].
3. Titan’s interior has at least partially differentiated, resulting in a rock-metal core, a high-pressure ice mantle of uncertain thickness, a liquid water ocean [Iess et al. 2010] perhaps with salts and ammonia [Mitri et al. 2014], and an ice crust 50 to 100 km thick. The core is either significantly hydrated [Castillo-Rogez and Lunine 2010], or there is a mixed rock-ice layer somewhere in the interior, see for example, Tobie et al. [2014].
4. A range of chemical and physical data from the atmosphere to the interior suggest that a significant event, or change in the way Titan evolves, occurred sometime between a few hundred million and a billion years ago [Hörst 2017].
The relatively youthful age of the surface, which may be the result of geologic activity or substantial burial in organic matter, or both, means that there is little if any geologic evidence of the first 3/4 of Titan’s history. Two unanswered questions are what was the process(es) that eroded or covered older impact craters and other landforms? and, Did the obscuration of features older than a few hundred million years occur continuously over time, or in some singular event?

C A S S I N I F I N A L M I S S I O N REP O R T 2 01 9 3 9
There is no evidence of the answer to the second question, but a theoretical model of the evolution of Titan’s interior by Tobie et al. [2006] provides an intriguing scenario that implies Titan had a significant change in the working of its interior, crust, and atmosphere about 500 million years ago [Wood 2018]. In the Tobie et al. [2006] model, Titan has a thin and rigid clathrate crust (with methane as the dominant guest species) up until 500 million to one billion years ago. During that earlier epoch, several major heating events resulted in the release of large (compared to the present atmospheric inventory) amounts of methane from the clathrate hydrate into the surface-atmosphere system. Within the last 500–1000 million years the interior has cooled sufficiently to allow an ice I crust to form underneath the buoyant clathrate hydrate crust, with diapirism in the thickening ice I crust providing one or several episodes of further release of methane into the surface-atmosphere system.
Wood [2018] called the onset of the ice I subcrust the “Great Crustal Thickening Event” and noted that the mode of geologic processes would change dramatically as Titan transitioned from a body with a thin rigid conductive crust over the ocean to one with a thicker and rheologically heterogenous crust.
This is but one model for Titan’s interior [Tobie et al. 2014]. What remains unresolved, however, is whether the methane hydrological cycle that we see today shaping so many aspects of Titan’s surface is ancient or recent, episodic [Lunine et al. 1998] or continuous. While the idea is commonly held that the source of the methane to resupply the atmosphere is in crustal clathrate hydrate, such a crust going back to pre-Voyager days [Lewis 1971], how the resupply works is unclear. Simple forcing out of the methane from the clathrate by the photochemically produced ethane eventually fails because of the stoichiometry (two methane molecules making one ethane), although this replacement could eventually weigh down the crust and cause an overturn because clathrate with predominantly ethane is heavier than ice I [Choukroun and Sotin 2012]. This could cause interesting geologic consequences in the present era when the clathrate is nominally underlain by warm ice I.
Birch et al. [2017] have pointed to geologic evidence (notably the presence of evaporite deposits seen in Cassini/VIMS data), for example, Mackenzie et al. 2014, suggesting that the present epoch of lakes and seas of methane, ethane, and nitrogen might have been preceded by one with a widespread ocean of methane and other hydrocarbons. However, it is not possible to constrain the longevity of such an ocean, and the implications in terms of tidal dissipation of the orbital eccentricity during ocean shrinkage [Sagan and Dermott 1982; Sears 1995] have yet to be evaluated for the known Titan topography. Finally, it is possible that Titan has run out of atmospheric and surface methane multiple times in its history, leading to dramatic atmospheric
… a theoretical model of the evolution of Titan’s interior by Tobie et al. [2006] provides an intriguing scenario that implies Titan had a significant change in the working of its interior, crust, and atmosphere about 500 million years ago … .

4 0 V OL U M E 1 : M I S S I O N OV E RVI EW & S CI E N CE OBJ E C TI V ES A N D RE S ULT S
changes [Lorenz et al. 1997] and possibly epochs in the which the surface is worked by liquid nitrogen seas and rivers [Charnay et al. 2014].
If Titan’s geologic and atmospheric nature have changed in a secular way over its history, it would join the other terrestrial planets—Venus, Earth, and Mars, in this regard. In each case, interior and surface-atmosphere changes over time have led to present-day characteristics that are likely to have been dramatically different from those in the past.
Open questions for Titan science
Some questions are taken directly from Hörst [2017], see also Nixon et al. [2018].
1. What are the abundances of the heavy noble gases in Titan’s atmosphere and surface?
2. What is the ice phase that dominates the crust?
3. How intimately coupled are the various atmospheric layers?
4. How do you go from the very heavy ions and molecular species to haze particles?
5. What is the role of heterogeneous reactions in determining the partitioning of gas phase molecules and the composition of haze particles?
6. The controversy concerning the escape rate of CH4 is linked to the analysis of INMS and UVIS measured CH4 density profiles and the inference of the magnitude and radial direction of CH4 diffusion fluxes.
7. What are the very heavy ions in the ionosphere, how do they form, and what are the implications for complexity of prebiotic chemistry?
8. How do the organic compounds produced in the atmosphere evolve on the surface?
9. What are the dynamics of Titan’s surface-atmosphere interactions? Fluvial erosion?
10. How variable is the climate over 104 years and longer?
11. How old is Titan’s current atmosphere and what happened on Titan 300–500 million years ago?
12. Is Titan’s atmospheric methane episodic, and what are the implications on habitability?
13. What are the origin of Titan’s methane and the fate of the photochemically produced ethane?

C A S S I N I F I N A L M I S S I O N REP O R T 2 01 9 4 1
14. What is controlling Titan’s H2 profile and potential spatial variations?
15. What is the organic and inorganic composition of the surface?
16. What is the circulation in the lakes and seas and how is it affected by the atmosphere?
17. What is the composition of the dune particles and how are they produced?
18. How did the lakes and sea basins form?
19. Does cryovolcanism occur on Titan?
20. What is the salinity and composition of the deep ocean and is it in contact with rock beneath?
21. Is there life in the deep ocean, and some exotic life in hydrocarbon solvents?
22. What are the characteristics of the methane meteorology (of often clouds form, how typical is the half Titan year that we observed, etc.)?
23. What is the nature of the asymmetry in seasonal effects?
24. What is the nature and extent of the exchange between the surface/atmosphere and deep subsurface and ocean?
25. What is the depth and thickness of the subsurface ocean?
26. To what extent is the surface fluvially dissected?
27. What is the role of heterogeneous reactions in determining the partitioning of gas phase molecules and the composition of haze particles?
28. What are the sources of the stratospheric tilt?
29. What is the origin of Xanadu as a distinct geologic province?
30. What are the origin, evolution, and ultimate fate of Titan’s atmosphere?
31. What is the impact of the influx of water and water vapor from Enceladus to Titan’s upper atmosphere?

4 2 V OL U M E 1 : M I S S I O N OV E RVI EW & S CI E N CE OBJ E C TI V ES A N D RE S ULT S
ACRONYMS
Note: For a complete list of Acronyms, refer to Cassini Acronyms – Attachment A.
AACS Attitude and Articulation Control System
AO Announcement of Opportunity
AU astronomical unit
CIRS Composite Infrared Spectrometer
CSM Cassini Solstice Mission
DISR Descent Imager/Spectral Radiometer
DWE Doppler Wind Experiment
DWG Discipline Working Group
EUV extreme ultraviolet
FUV far ultraviolet
GCMS Gas Chromatograph Mass Spectrometer
HASI Huygens Atmospheric Structure Instrument
INMS Ion and Neutral Mass Spectrometer
IR infrared
ISS Imaging Science Subsystem
PWA Permittivity, Wave and Altimetry
RADAR Titan Radar Mapper
RSS Radio Science Subsystem
SAR Synthetic Aperture Radar
TAMWG Titan Atmospheric Modeling Working Group
TM Traceability Matrix
TOST Titan Observation Science Team
UV ultraviolet
UVIS Ultraviolet Imaging Spectrograph
VIMS Visual and Infrared Imaging Spectrometer

C A S S I N I F I N A L M I S S I O N REP O R T 2 01 9 4 3
REFERENCES
Disclaimer: The partial list of references below correspond with in-text references indicated in this
report. For all other Cassini references, refer to Attachment B – References & Bibliographies;
Attachment C – Cassini Science Bibliographies; the sections entitled References contributed by
individual Cassini instrument and discipline teams located in Volume 1 Sections 3.1 and 3.2 Science
Results; and other resources outside of the Cassini Final Mission Report.
Achilleos, N., C. S. Arridge, C. Bertucci,P. Guio, N. Romanelli, N. Sergis, (2014), A combined
model of pressure variations in Titan’s plasma environment, Geophysical Research Letters, 41, 8730–8735, doi: 10.1002/2014GL061747.
Achterberg, R. K., P. J. Gierasch, B. J. Conrath, F. M. Flasar, C. A. Nixon, (2011), Temporal variations of Titan’s middle-atmospheric temperatures from 2004 to 2009 observed by Cassini/CIRS, Icarus 211, 686–698.
Achterberg, R. K., B. J. Conrath, P. J. Gierasch, F. M. Flasar, C. A. Nixon, (2008a), Titan’s middle-atmospheric temperatures and dynamics observed by the Cassini Composite Infrared Spectrometer, Icarus, 194, 263–277, doi: 10.1016/j.icarus.2007.09.
Achterberg, R. K., B. J. Conrath, P. J. Gierasch, F. M. Flasar, C. A. Nixon, (2008b), Observation of a tilt of Titan's middle-atmospheric superrotation, Icarus, 197, 549–555, doi: 10.1016/j.icarus.2008.05.014.
Ádámkovics, M., J. L. Mitchell, A. G. Hayes, P. M. Rojo, P. Collies, et al., (2016), Meridional variation in tropospheric methane on Titan observed with AO spectroscopy at Keck and VLT, Icarus, 270, 376–888.
Ádámkovics, M., J. W. Barnes, M. Hartung, I. de Pater, (2010), Observations of a stationary mid-latitude cloud system on Titan, Icarus, 208, 868–877.
Aharonson, O., A. G. Hayes, J. I. Lunine, R. D. Lorenz, M. D. Allison, C. Elachi, (2009), An asymmetric distribution of lakes on Titan as a possible consequence of orbital forcing, Nature Geoscience, 2, 851–854.
Ajello, J. M., M. H. Stevens, I. Stewart, K. Larsen, L. Esposito, J. Colwell, W. McClintock, G. Holsclaw, J. Gustin, W. Pryor, (2007), Titan airglow spectra from Cassini Ultraviolet Imaging Spectrograph (UVIS): EUV analysis, Geophysical Research Letters, 34, L24204, doi: 10.1029/2007GL031555.
Allen, M. R. and W. J. Ingram, (2002), Constraints on future changes in climate and the hydrologic cycle, Nature, 419, 224.
Andreotti, B., A. Fourriere, F. Ould-Kaddour, B. Murray, and P. Claudin, (2009), Giant Aeolian dune size determined by the average depth of the atmospheric boundary layer, Nature, 457, 1120–1123, doi: 10.1038/nature07787.
Arridge, C. S., N. André, C. L. Bertucci, P. Garnier, C. M. Jackman, Z. Németh, A. M. Rymer, N. Sergis, K. Szego, A.J . Coates, F. J. Crary, (2011), Upstream of Saturn and Titan, Space Science Reviews, 162, 1–4, 25–83, doi: 10.1007/s11214-011-9849-x.
4 4 V OL U M E 1 : M I S S I O N OV E RVI EW & S CI E N CE OBJ E C TI V ES A N D RE S ULT S
Arridge, C. S., N. André, N. Achilleos, K. K. Khurana, C. L. Bertucci, L. K. Gilbert, G. R. Lewis, A. J. Coates, M. K. Dougherty, (2008), Thermal electron periodicities at 20RS in Saturn's magnetosphere, Geophysical Research Letters, 35, L15107, doi: 10.1029/2008GL034132.
Artemieva, N. and J. Lunine, (2003), Cratering on Titan: impact melt, ejecta, and the fate of surface organics, Icarus, 164, 471–480.
Atreya, S. K., E. Y. Adams, H. B. Niemann, J. E. Demick-Montelara, T. C. Owen, et al., (2006), Titan's methane cycle, Planetary and Space Science, 54, 1177–1187.
Awal, M. and J. I. Lunine, (1994) Moist convective clouds in Titan atmosphere, Geophysical Research Letters, 21, 2491–2494.
Barnes, J., C. Sotin, J. Soderblom, R. Brown, A. Hayes, et al., (2014), Cassini/VIMS observes rough surfaces on Titan’s Punga Mare in specular reflection, Planetary Science, 3, 1–17, doi: 10.1186/s13535-014-0003-4.
Barnes, J. W., J. Bow, J. Schwartz, R. H. Brown, J. M. Soderblom, A. G. Hayes, G. Vixie, S. Le Mouelic, S. Rodriguez, C. Sotin, R. Jaumann, K. Stephan, L. A. Soderblom, R. N. Clark, B. J. Buratti, K. H. Baines, P. D. Nicholson, (2011), Organic sedimentary deposits in Titan’s dry lakebeds: Probable evaporate, Icarus, 216, 136–140.
Barnes, J. W., R. H. Brown, J. M. Soderblom, L. A. Soderblom, R. Jaumann, et al., (2009), Shoreline features of Titan's Ontario Lacus from Cassini/VIMS observations, Icarus, 201, 217–225.
Barnes, J. W., R. H. Brown, L. Soderblom, C. Sotin, S. Le Mouelic, S. Rodriguez, R. Jaumann, R. A. Beyer, R. Clark, P. Nicholson, (2008), Spectroscopy, morphometry, and photoclinometry of Titan’s dunefields from Cassini/VIMS, Icarus, 195, 400–414.
Barnes, J. W., R. H. Brown, J. Radebaugh, B. J. Buratti, C. Sotin, et al., (2006), Cassini observations of flow-like features in western Tui Regio, Titan, Geophysical Research Letters vol. 33, Issue 16, doi: 10.1029/2006GL026843.
Barth, E. L., S. C R. Rafkin, (2007), TRAMS: A new dynamic cloud model for Titan's methane clouds, Geophysical Research Letters 34.
Béghin, C., O. Randriamboarison, M. Hamelin, E. Karkoschka, C. Sotin, R.C. Whitten, J.-J. Berthelier, R. Grard, F. Simoes, (2012), Analytic theory of Titan’s Schumann resonance: Constraints on ionospheric conductivity and buried water ocean, Icarus, 218, 1028–1042.
Béghin, C., C. Sotin, M. Hamelin, (2010), Titan's native ocean revealed beneath some 45 km of ice by a Schumann-like resonance, Comptes Rendus Geoscience 342, 425–433.
Bernard, J.-M., E. Quirico, O. Brissaud, G. Montagnac, B. Reynard, B.P. McMillan, P. Coll, M.-J. Nguyen, F. Raulin, B. Schmitt, (2006), Reflectance spectra and chemical structure of Titan's tholins: Application to the analysis of Cassini Huygens observations, Icarus, 185, 301–307.
Bertucci, C., D. C. Hamilton, W. S. Kurth, G. Hospodarsky, D. Mitchell, N. Sergis, N. J. T. Edberg, M. K. Dougherty, (2015), Titan's interaction with the supersonic solar wind, Geophysical Research Letters, 42, 193–200, doi: 10.1002/2014GL062106.
C A S S I N I F I N A L M I S S I O N REP O R T 2 01 9 4 5
Bertucci, C., B. Sinclair, N. Achilleos, P. Hunt, M. K. Dougherty, C. S. Arridge, (2009), The variability of Titan's magnetic environment, Planetary and Space Science, 57, no. 14–15, 1813–1820.
Bertucci, C., N. Achilleos, M. K. Dougherty, R. Modolo, A. J. Coates, K. Szego, A. Masters, et al., (2008), The magnetic memory of Titan's ionized atmosphere, Science, 321, 5895, 1475–1478, doi: 10.1126/science.1159780.
Bézard, B., S. Vinatier, R. K. Achterberg, (2018), Seasonal radiative modeling of Titan's stratospheric temperatures at low latitudes, Icarus, 302, 437–450, doi 10.1016/j.icarus.2017.11.034.
Bézard, B., C. A. Nixon, I. Kleiner, D. E. Jennings, (2007), Detection of 13CH3D on Titan, Icarus, 191, 1, 397–400, doi: 10.1016/j.icarus.2007.06.004.
Bills, B. G. and F. Nimmo, (2011), Rotational dynamics and internal structure of Titan, Icarus, vol. 214, Issue 1, pp. 351–355.
Birch, S. P. D., A. G. Hayes, P. Corlies, E. R. Stofan, J. D. Hofgartner, R. M. C. Lopes, R. D. Lorenz, J. I. Lunine, S. M. MacKenzie, M. J. Malaska, C. A. Wood, Cassini RADAR Team, (2018), Morphologic evidence that Titan’s southern hemisphere basins are paleoseas, Icarus, 310, 140–148.
Birch, S. P. D., A. G. Hayes, W. E. Dietrich, A. D. Howard, C. S. Bristow, et al., (2017), Geomorphologic mapping of titan's polar terrains: Constraining surface processes and landscape evolution, Icarus, 282, 214–236.
Birch, S. P. D., A. G. Hayes, A. D. Howard, J. Moore, J. Radebaugh, (2016), Alluvial fan morphology, distribution, and formation on Titan, Icarus, 270, 238–247.
Black, B. A., J. T. Perron, D. Hemingway, E. Bailey, F. Nimmo, H. Zebker, (2017), Global drainage patterns and the origins of topographic relief on Earth, Mars, and Titan, Science, 356, 727–731.
Black, B. A., J. T. Perron, D. M. Burr, S. A. Drummond, (2012), Estimating erosional exhumation on Titan from drainage network morphology, Journal of Geophysical Research: Planets, vol. 117, Issue E8, doi: 10.1029/2012JE004085.
Brandt, P. C., K. Dialynas, I. Dandouras, D. G. Mitchell, P. Garnier, S. M. Krimigis, (2012), The distribution of Titan’s high-altitude (out to 50,000 km) exosphere from energetic neutral atom (ENA) measurements by Cassini/INCA, Planetary and Space Science, 60, 107–114, doi: 10.1016/j.pss.2011.04.014.
Brassé, C., O. Munoz, P. Coll, F. Raulin, (2015), Optical constants of Titan aerosols and their tholins analogs: Experimental results and modeling/observational data, Planetary and Space Science, vol. 109–110, pp. 159–174.
Brown, M. E., J. E. Roberts, E. L. Schaller, (2010), Clouds on Titan during the Cassini prime mission: A complete analysis of the VIMS data, Icarus, 205, 571–580.
Brown, R. H., L. A. Soderblom, J. M. Soderblom, R. N. Clark, R. Jaumann, et al., (2008), The identification of liquid ethane in Titan's Ontario Lacus, Nature, 454, 607–610.

4 6 V OL U M E 1 : M I S S I O N OV E RVI EW & S CI E N CE OBJ E C TI V ES A N D RE S ULT S
Brown, R. H., C. A. Griffith, J. I. Lunine, J. W. Barnes, (2006), Polar caps on Titan?, In European Planetary Science Congress, p. 602.
Brown, M. E., A. H. Bouchez, C. A. Griffith, (2002), Direct detection of variable tropospheric clouds near Titan's south pole, Nature, 420, no. 6917, p. 795.
Buratti, B. J., C. Sotin, K. Lawrence, R. H. Brown, S. Le Mouélic, J. M. Soderblom, et al., (2012), A newly discovered impact crater in Titan's Senkyo Cassini VIMS observations and comparison with other impact features, Planetary and Space Science, 60, 18–25.
Burr, D. M., N. T. Bridges, J. R. Marshall, J. K. Smith, B. R. White, J. P. Emery, (2015), Higher-than-predicted saltation threshold wind speeds on Titan, Nature, 517, 7532, p. 60.
Burr, D. M., S. A. Drummond, R. Cartwright, B. A. Black, J. T. Perron, (2013a), Morphology of fluvial networks on Titan: Evidence for structural control, Icarus, 226, 742–759.
Burr, D. M., J. T. Perron, M. P. Lamb, R. P. Irwin, G. C. Collins, et al., (2013b), Fluvial features on Titan: Insights from morphology and modeling, Geological Society of America Bulletin, 125, 299–321.
Burr, D. M., R. E. Jacobsen, D. L. Roth, C. B. Phillips, K. L. Mitchell, D. Viola, (2009), Fluvial network analysis on Titan: Evidence for subsurface structures and west-to-east wind flow, southwestern Xanadu, Geophysical Research Letters, 36.
Burr, D. M., J. P. Emery, R. D. Lorenz, G. C. Collins, P. A. Carling, (2006), Sediment transport by liquid surficial flow: Application to Titan, Icarus, 181, 235–242.
Castillo-Rogez, J. C. and J. I. Lunine, (2010), Evolution of Titan's rocky core constrained by Cassini observations, Geophysical Research Letters, 37, L20205, doi: 10.1029/2010GL044398.
Charnay, B., E. Barth, S. Rafkin, C. Narteau, S. Lebonnois, S. Rodriguez, S. C. Du Pont, A. Lucas, (2015), Methane storms as a driver of Titan’s dune orientation, Nature Geoscience, 8, 5, p. 362.
Charnay, B., F. Forget, G. Tobie, C. Sotin, R. Wordsworth, (2014), Titan’s past and future: 3D modeling of a pure nitrogen atmosphere and geological implications, Icarus, 241, 269–279.
Charnay, B. and S. Lebonnois, (2012), Two boundary layers in Titan's lower troposphere inferred from a climate model, Nature Geoscience, 5, 106–109, doi: 10.1038/ngeo1374.
Choukroun, M. and C. Sotin, (2012), Is Titan's shape caused by its meteorology and carbon cycle?, Geophysical Research Letters, 39.
Choukroun, M., O. Grasset, G. Tobie, C. Sotin, (2010), Stability of methane clathrate hydrates under pressure: Influence on outgassing processes of methane on Titan, Icarus, 205, 581–593.
Clark, R. N., J. M. Curchin, J. W. Barnes, R. Jaumann, L. Soderblom, D. P. Cruikshank, R. H. Brown, S. Rodriguez, J. Lunine, K. Stephan, T. M. Hoefen, (2010) Detection and mapping of hydrocarbon deposits on Titan, Journal of Geophysical Research: Planets, 115, E10, doi: 10.1029/2009JE003369.

C A S S I N I F I N A L M I S S I O N REP O R T 2 01 9 4 7
Corlies, P., A. G. Hayes, S. P. D. Birch, R. Lorenz, B. W. Stiles, R. Kirk, V. Poggiali, H. Zebker, L. Iess, (2017), Titan's topography and shape at the end of the Cassini mission, Geophysical Research Letters, 44, 23.
Courrech du Pont, S., C. Narteau, X. Gao, (2014), Two modes for dune orientation, Geology, doi: 10.1130/G35657.1.
Coustenis, A., D. E. Jennings, C. A. Nixon, (2010), Titan trace gaseous composition from CIRS at the end of the Cassini-Huygens prime mission, Icarus, 207, 461v476, doi: 10.1016/j.icarus.2009.11.027.
Coustenis, A., D. E. Jennings, A. Jolly, Y. Bénilan, C. A. Nixon, S. Vinatier, D. Gautier, et al., (2008), Detection of C2HD and the D/H ratio on Titan, Icarus, 197, 2, 539–548, doi: 10.1016/j.icarus.2008.06.003.
Coustenis, A. (2007), The atmospheric structure of Titan from Voyager to Cassini, American Geophysical Union (AGU) Spring Meeting Abstracts.
Crespin, A., S. Lebonnois, S. Vinatier, (2008), Diagnostics of Titan's stratospheric dynamics using Cassini/CIRS data and the 2-dimensional IPSL circulation model, Icarus, 197, 556–571, doi: 10.1016/j.icarus.2008.05.010.
Cui, J., R. V. Yelle, D. F. Strobel, I. C. F. Müller-Wodarg, D. S. Snowden, T. T. Koskinen, M. Galand, (2012), The CH4 structure in Titan’s upper atmosphere revisited, Journal of Geophysical Research, E11, doi: 10.1029/2012JE004222.
Davies, M. E., T. R. Colvin, P. G. Rogers, P. W. Chodas, W. L. Sjogren, E. L. Akim, V. A. Stepaniants, Z. P. Vlasova, A. I. Zakharov, (1992), The rotation period, direction of the north pole, and geodetic control network of Venus, Journal of Geophysical Research: Planets, vol. 97, Issue E8, pp. 13141–13151, doi: 10.1029/92JE01166.
de Kok, R. J., N. A. Teanby, L. Maltagliati, et al., (2014), HCN ice in Titan’s high-altitude southern polar cloud, Nature, 514, 65, doi: 10.1038/nature13789.
Doose, L. R., E. Karkoschka, M. G. Tomasko, et al., (2016), Vertical structure and optical properties of Titan's aerosols from radiance measurements made inside and outside the atmosphere, Icarus, 270, 355–375.
Durham, W. B., S. H. Kirby, L. A. Stern, W. Zhang, (2003), The strength and rheology of methane clathrate hydrate, Journal of Geophysical Research: Solid Earth, vol. 108, Issue B4, doi: 10.1029/2002JB001872.
Elachi, C., S. Wall, M. Allison, Y. Anderson, R. Boehmer, et al., (2005), Cassini radar views the surface of Titan, Science, 308, 970–974.
Elachi, C., M. D. Allison, L. Borgarelli, P. Encrenaz, E. Im, M. A. Janssen, W. T. K. Johnson, R. L. Kirk, R. D. Lorenz, J. I. Lunine, D. O. Muhleman, S. J. Ostro, G. Picardi, F. Posa, C. G. Rapley, L. E. Roth, R. Seu, L. A. Soderblom, S. Vetrella, S. D. Wall, C. A. Wood, H. A. Zebker, (2005), RADAR: The Cassini Titan Radar Mapper, Space Science Review, 117, 71–110.
Ewing, R. C., A. G. Hayes, A. Lucas, (2015), Sand dune patterns on Titan controlled by long-term climate cycles, Nature Geoscience, 8, 1, pp.15–19.

4 8 V OL U M E 1 : M I S S I O N OV E RVI EW & S CI E N CE OBJ E C TI V ES A N D RE S ULT S
Faulk, S. P., J. L. Mitchell, S. Moon, J. M. Lora, (2017), Regional patterns of extreme precipitation on Titan consistent with observed alluvial fan distribution, Nature Geoscience, 10, 827.
Flasar, F. M., (1983), Oceans on Titan?, Science, 221, 55–57. Fryberger, S. G. and G. Dean, (1979), Dune forms and wind regime, In A study of global sand
seas, U.S. Government Printing Office Washington, vol. 1052, pp. 137–169. Fulchignoni, M., F. Angrilli, G. Borouki W. Bianchini, (2005), Physical characterization of Titan
Atmosphere by the Huygens Atmospheric Structure Instrument (HASI), Thirty-Sixth Lunar and Planetary Science Conference, 14–18 March 2005, Houston, TX.
Garnier, P., I. Dandouras, D. Toublanc, E. C. Roelof, P. C. Brandt, D. G. Mitchell, S. M. Krimigis, N. Krupp, D. C. Hamilton, J.-E. Wahlund, (2010), Statistical analysis of the energetic ion and ENA data for the Titan environment, Planetary and Space Science, vol. 58, Issues 14–15, pp. 1811–1822, doi: 10.1016/j.pss.2010.08.009.
Grenoble Astrophysics and Planetology Solid Spectroscopy and Thermodynamics (GhoSST) v0.6, (2014), database service, https://ghosst.osug.fr.
Gibbard, S. G., B. Macintosh, D. Gavel, C. E. Max, I. de Pater, et al., (2004), Speckle imaging of Titan at 2 microns: surface albedo, haze optical depth, and tropospheric clouds 1996–1998, Icarus, 169, 429–439.
Glein, C. R. and E. L. Shock, (2013), A geochemical model of non-ideal solutions in the methane-ethane-propane-nitrogen-acetylene system on Titan, Geochimica Et Cosmochimica Acta, 115, 217–240.
Graves, S. D. B., C. P. McKay, C. A. Griffith, F. Ferri, M. Fulchignoni, (2008), Rain and hail can reach the surface of Titan, Planetary and Space Science, 56, 346–357.
Greeley, R. and J. D. Iversen, (1985), Wind as a geological process: on Earth, Mars, Venus and Titan, Cambridge Planetary Science Series, 4, Cambridge University Press.
Griffith, C., S. Rafkin, P. Rannou, and C. McKay, (2014), Storms, clouds, and weather, Chapter 6, In Titan: Interior, surface, atmosphere, and space environment, (eds.) I. Müller-Wodarg, C. Griffith, E. Lellouch, T. Cravens, Cambridge University Press, pp. 190–223, doi: 10.1017/CBO9780511667398.009.
Griffith, C. A., J. M. Lora, J. Turner, P. F. Penteado, R. H. Brown, et al., (2012), Possible tropical lakes on Titan from observations of dark terrain, Nature, 486, 237–239.
Griffith, C. A., P. Penteado, S. Rodriguez, S. Le Mouélic, K. H. Baines, et al., (2009), Characterization of clouds in Titan's tropical atmosphere, The Astrophysical Journal Letters, 702, L105-L9.
Griffith, C. A., P. Penteado, P. Rannou, R. Brown, V. Boudon, et al., (2006), Evidence for a polar ethane cloud on Titan, Science, 313, 1620.
Griffith, C. A., P. Penteado, K. Baines, P. Drossart, J. Barnes, et al., (2005), The evolution of Titan's mid-latitude clouds, Science, 310, 474–477.
Griffith, C. A., T. Owen, G. A. Miller, T. Geballe, (1998), Transient clouds in Titan's lower atmosphere, Nature, 395, 575–578.

C A S S I N I F I N A L M I S S I O N REP O R T 2 01 9 4 9
Grima, C., M. Mastrogiuseppe, A. G. Hayes, S. D. Wall, R. D. Lorenz, et al., (2017), Surface roughness of Titan's hydrocarbon seas, Earth and Planetary Science Letters, 474, 20–24.
Harper, J. M., G. D. McDonald, J. Dufek, M. J. Malaska, D. M. Burr, A. G. Hayes, J. McAdams, J. J. Wray, (2017), Electrification of sand on Titan and its influence on sediment transport, Nature Geoscience, 10, 4, p.260.
Hayes, A. G., R. D. Lorenz, J. I. Lunine, (2018) A post-Cassini view of Titan’s methane-based hydrologic cycle, Nature Geoscience, 11, no. 5, 306.
Hayes, A. G., S. P. D. Birch, W. E. Dietrich, A. D. Howard, R. Kirk, et al., (2017), Topographic constraints on the evolution and connectivity of Titan’s lacustrine basins, Geophysical Research Letters, vol. 44, Issue 23, pp. 11745–11753, doi: 10.1002/2017GL075468.
Hayes, A. G., (2016), The lakes and seas of Titan, Annual Review of Earth and Planetary Sciences, vol. 44, pp. 57–83, doi: 10.1146/annurev-earth-060115-012247.
Hayes, A. G., R. D. Lorenz, M. A. Donelan, M. Manga, J. I. Lunine, et al., (2013), Wind driven capillary-gravity waves on Titan’s lakes: Hard to detect or non-existent?, Icarus, 225, 403–412.
Hayes, A. G., O. Aharonson, J. I. Lunine, R. L. Kirk, H. A. Zebker, et al., (2011), Transient surface liquid in Titan’s polar regions from Cassini, Icarus, 211, 655–671.
Hayes, A. G., A. S. Wolf, O. Aharonson, H. Zebker, R. Lorenz, et al., (2010), Bathymetry and absorptivity of Titan's Ontario Lacus, Journal of Geophysical Research: Planets, 115.
Hayes, A., O. Aharonson, P. Callahan, C. Elachi, Y. Gim, et al., (2008), Hydrocarbon lakes on Titan: Distribution and interaction with a porous regolith, Geophysical Research Letters, 35.
Hemingway, D., F. Nimmo, H. Zebker, L. Iess, (2013), A rigid and weathered ice shell on Titan, Nature, 500, 550–552.
Hersant, F., D. Gautier, G. Tobie, J. I. Lunine, (2008), Interpretation of the carbon abundance in Saturn measured by Cassini, Planetary and Space Science, 56, 1103–1111.
Hirtzig, M., B. Bézard, E. Lellouch, A. Coustenis, C. de Bergh, P. Drossart, A. Campargue, V. Boudon, V. Tyuterev, P. Rannou, T. Cours, S. Kassi, A. Nikitin, D. Mondelain, S. Rodriguez,, S. Le Mouélic, (2013), Titan’s surface and atmosphere from Cassini/VIMS data with updated methane opacity, Icarus, 226, 470–486.
Hirtzig, M., A. Coustenis, E. Gendron, P. Drossart, A. Negrao, et al., (2006), Monitoring atmospheric phenomena on Titan, Astronomy & Astrophysics, 456, 761–774.
Hofgartner, J. D., A. G. Hayes, J. I. Lunine, H. Zebker, B. W. Stiles, et al., (2014), Transient features in a Titan sea, Nature Geoscience, 7, 493–496.
Hörst, S., (2017), Titan’s atmosphere and climate, Journal of Geophysical Research: Planets, 122, 432–482, doi: 10.1002/2016JE005240.
Horvath, D. G., J. C. Andrews-Hanna, C. E. Newman, K. L. Mitchell, B. W. Stiles, (2016), The influence of subsurface flow on lake formation and north polar lake distribution on Titan, Icarus, 277, 103–124.
Hueso, R., A. Sanchez-Lavega, (2006), Methane storms on Saturn's moon Titan, Nature, 442, 428–431.
5 0 V OL U M E 1 : M I S S I O N OV E RVI EW & S CI E N CE OBJ E C TI V ES A N D RE S ULT S
Hunten, D. M., (1973), The escape of H2 from Titan, Journal of the Atmospheric Sciences, 30, 726–732, doi: 10.1175/1520- 0469.
Iess, L., R. A. Jacobson, M. Ducci, D. J. Stevenson, J. I. Lunine, et al., (2012), The tides of Titan, Science, 337, 457–459, doi: 10.1126/science.1219631.
Iess, L., N. J. Rappaport, R. A. Jacobson, P. Racioppa, D. J. Stevenson, P. Tortora, J. W. Armstrong, S. W. Asmar, (2010), Gravity field, shape, and moment of inertia of Titan, Science, 327, 1367, doi: 10.1126/science.1182583.
Janssen, M. A., A. Le Gall, R. M. Lopes, R. D. Lorenz, M. J. Malaska, A. G. Hayes, C. D. Neish, A. Solomonidou, K. L. Mitchell, J. Radebaugh, S. J. Keihm, (2016) Titan’s surface at 2.18-cm wavelength imaged by the Cassini RADAR radiometer: Results and interpretations through the first ten years of observation, Icarus, 270, pp. 443–459.
Janssen, M. A., A. Le Gall, L. C. Wye, (2011), Anomalous radar backscatter from Titan’s surface?, Icarus, 212, 1, 321–328.
Janssen, M. A., R. D. Lorenz, R. West, F. Paganelli, R. M. Lopes, R. L. Kirk, C. Elachi, S. D. Wall, W. T. K. Johnson, Y. Anderson, R. A. Boehmer, P. Callahan, Y. Gim, G. A. Hamilton, K. D. Kelleher, L. Roth, B. Stiles, A. Le Gall, Cassini Radar Team, (2009), Titan’s surface at 2.2-cm wavelength imaged by the Cassini RADAR Radiometer: Calibration and first results, Icarus, 200, 222–239, doi: 10.1016/j.icarus.2008.10.017.
Jaumann, R., R. H. Brown, K. Stephan, J. W. Barnes, L. A. Soderblom, et al., (2008), Fluvial erosion and post-erosional processes on Titan, Icarus, 197, 526–538.
Jennings, D. E., V. Cottini, C. A. Nixon, R. K. Achterberg, F. M. Flasar, V. G. Kunde, P. N. Romani, R. E. Samuelson, A. Mamoutkine, N. J. P. Gorius, A. Coustenis, (2016), Surface temperatures on Titan during northern winter and spring, The Astrophysical Journal Letters, vol. 816, no. 1, doi: 10.3847/2041-8205/816/1/L17.
Jennings, D. E., C. M. Anderson, R. E. Samuelson, F. M. Flasar, C. A. Nixon, G. L. Bjoraker, P. N. Romani, et al., (2012), First observation in the south of Titan’s far-infrared 220 cm-1 Cloud, The Astrophysical Journal Letters, 761, 1, doi: 10.1088/2041-8205/761/1/l15.
Jennings, D. E., F. M. Flasar, V. G. Kunde, R. E. Samuelson, J. C. Pearl, C. A. Nixon, R. C. Carlson, et al., (2009) Titan’s surface brightness temperatures, The Astrophysical Journal, 691, 2, L103–L105.
Jennings, D. E., C. A. Nixon, A. Jolly, B. Bézard, A. Coustenis, S. Vinatier, P. G. J. Irwin, et al., (2008), Isotopic ratios in Titan's atmosphere from Cassini CIRS limb sounding: HC3N in the north, The Astrophysical Journal Letters, 681, 2, L109–L111, doi: 10.1086/590534.
Jolly, A., A. Fayt, Y. Benilan, D. Jacquemart, C. A. Nixon, D. E. Jennings, (2010), The v8 Bending mode of diacetylene: from laboratory spectroscopy to the detection of 13C isotopologues in Titan’s atmosphere, The Astrophysical Journal, 714, 1, 852–859, doi: 10.1088/0004-637X/714/1/852.
Kammer, J. A., (2015), Analyses of planetary atmospheres across the spectrum: From Titan to exoplanets Dissertation (Ph.D.), California Institute of Technology, doi: 10.7907/Z9GX48HD, http://resolver.caltech.edu/CaltechTHESIS:08312014-134619300.

C A S S I N I F I N A L M I S S I O N REP O R T 2 01 9 5 1
Kanani, S. J., C. S. Arridge, G. H. Jones, A. N. Fazakerley, H. J. McAndrews, N. Sergis, S. M. Krimigis, et al., (2010), A new form of Saturn’s magnetopause using a dynamic pressure balance model, based on in situ, multi‐instrument Cassini measurements, Journal of Geophysical Research, 115, A06207, doi: 10.1029/2009JA014262.
Karkoschka, E., A. McEwen, J. Perry, (2017), Creating the best global mosaic of Titan's surface albedo using Cassini images, American Astronomical Society (AAS), Division for Planetary Sciences (DPS), meeting 49, id 301.06.
Kasting, J. F., (1988), Runaway and moist greenhouse atmospheres and the evolution of Earth and Venus, Icarus, 74, 472–494.
Kirk, R. L., E. Howington-Kraus, A. G. Hayes, R. M. C. Lopes, R. D. Lorenz, J. I. Lunine, K. L. Mitchell, E. R. Stofan, S. D. Wall, (2010), La Sotra y los otros: Topographic evidence for (and against) cryovolcanism on Titan, American Geophysical Union (AGU) Fall Meeting, December 13–17, 2010, San Francisco, CA, abstract P22A-03.
Klinger, J., (1981), Some consequences of a phase transition of water ice on the heat balance of comet nuclei, Icarus, 47, no. 3, 320–324.
Korycansky, D. G. and K. J. Zahnle, (2005), Modeling crater populations on Venus and Titan, Planetary and Space Science, 53, 695–710.
Koskinen, T. T., R. V. Yelle, D. S. Snowden, P. Lavvas, B. R. Sandel, F. J. Capalbo, Y. Benilan, and R. A. West, (2011), The mesosphere and thermosphere of Titan revealed by Cassini/UVIS stellar occultations, Icarus, 216, 507–534.
Krupp, N., A. Lagg, J. Woch, S. M. Krimigis, S. Livi, D. G. Mitchell, E. C. Roelof, C. Paranicas, B. H. Mauk, D. C. Hamilton, T. P. Armstrong, M. K. Dougherty, (2005), The Saturnian plasma sheet as revealed by energetic particle measurements, Geophysical Research Letters, 32, L20S03, doi: 10.1029/2005GL022829.
Kuiper, G. P., (1944), Titan: A satellite with an atmosphere, The Astrophysical Journal, 100, 378–383, doi: 10.1086/144679.
Kurth, W. S., T. F. Averkamp, D. A. Gurnett, J. B. Groene, A. Lecacheux, (2008), An update to a Saturnian longitude system based on kilometric radio emissions, Journal of Geophysical Research, 113, A05222, doi: 10.1029/2007JA012861.
Langhans, M. H., R. Jaumann, K. Stephan, R. H. Brown, B. J. Buratti, et al., (2012), Titan's fluvial valleys: Morphology, distribution, and spectral properties, Planetary and Space Science, 60, 34–51.
Lavvas, P., R. V. Yelle, T. Koskinen, et al., (2013), Aerosol growth in Titan’s ionosphere, Proceedings of the National Academy of Sciences, 110, 8, 2729–2734, doi: 10.1073/pnas.1217059110.
Lavvas, P. P., R. V. Yelle, V. Vuitton, (2009), The detached haze layer in Titan’s mesosphere, Icarus, 201, 626–633, doi: 10.1016/j.icarus.2009.01.004.
Lavvas, P. P., A. Coustenis, I. M. Vardavas, (2008), Coupling photochemistry with haze formation in Titan's atmosphere, Part I: Model description, Planetary and Space Science, 56, 27–66.

5 2 V OL U M E 1 : M I S S I O N OV E RVI EW & S CI E N CE OBJ E C TI V ES A N D RE S ULT S
Le Gall, A., M. J. Malaska, R. D. Lorenz, M. A. Janssen, T. Tokano, A. G. Hayes, M. Mastrogiuseppe, J. I. Lunine, G. Veyssière, P.,Encrenaz, O. Karatekin, (2016), Composition, seasonal change and bathymetry of Ligeia Mare, Titan, derived from its microwave thermal emission, Journal of Geophysical Research: Planets, 121, 233–251.
Le Gall, A., A. G. Hayes, R. Ewing, M. A. Janssen, J. Radebaugh, C. Savage, P. Encrenaz, Cassini Radar Team, (2012), Latitudinal and altitudinal controls on Titan’s dune field morphometry, Icarus, 217, 231–242.
Le Gall, A., M. A. Janssen, L. C. Wye, A. G. Hayes, J. Radebaugh, C. Savage, H. Zebker, R. D. Lorenz, J. I. Lunine, R. L. Kirk, R. M. C. Lopes, S. Wall, P. Callahan, E. R. Stofan, T. Farr, Cassini Radar Team, (2011), Cassini SAR, radiometry, scatterometry and altimetry observations of Titan’s dune fields, Icarus, 213, 608–624.
Le Gall, A., M. A. Janssen, P. Paillou, R. D. Lorenz, S. D. Wall, (2010), Radar-bright channels on Titan, Icarus, vol. 207, pp. 948–958.
Ledvina, S. A., T. E. Cravens, K. Kecskemety, (2005), Ion distributions in Saturn’s magnetosphere near Titan, Journal of Geophysical Research: Space Physics, 110, A06211.
Lellouch, E., B. Bézard, F. M. Flasar, S. Vinatier, R. Achterberg, et al., (2014), The distribution of methane in Titan's stratosphere from Cassini/CIRS observations, Icarus 231, 323–337.
Lellouch, E., (2006), Titan's zoo of clouds, Science, vol. 311, Issue 5758, pp. 186–187, doi: 10.1126/science.1122628.
Lellouch, E., A. Coustenis, D. Gautier, F. Raulin, N. Dubouloz, C. Frere, (1989), Titans atmosphere and hypothesized ocean - a reanalysis of the Voyager-1 radio-occultation and IRIS 7.7-µm data, Icarus, 79, 328–349.
Leovy, C. B. and J. B. Pollack, (1973), First look at atmospheric dynamics and temperature variations on Titan, Icarus, 19, 195–201.
Lewis, J. S., (1971), Satellites of outer planets - their physical and chemical nature, Icarus, 15, 174–185.
Liang, M-C., Y. L. Yung, D. E. Shemansky, (2007), Photolytically generated aerosols in the mesosphere and thermosphere of Titan, The Astronomical Journal, 661, L199–L202.
Lindal, G. F., G. E. Wood, H. B. Hotz, D. N. Sweetnam, V. R. Eshleman, G. L. Tyler, (1983), The atmosphere of Titan - an analysis of the Voyager-1 radio occultation measurements, Icarus, 53, 348–363.
Lopes, R. M. C., M. J. Malaska, A. Solomonidou, A. LeGall, M. A. Janssen, C. Neish, E. P. Turtle, S. P. D. Birch, A. G. Hayes, J. Radebaugh, A. Coustenis, A. Schoenfeld, B. W. Stiles, R. L. Kirk, K. L. Mitchell, E. R. Stofan, K. J. Lawrence, Cassini RADAR Team, (2016), Nature, distribution, and origin of Titan’s undifferentiated plains, Icarus, 270, 162–182.
Lopes, R. M. C., R. L. Kirk, K. L. Mitchell, A. LeGall, J. W. Barnes, A. Hayes, J. Kargel, L. Wye, J. Radebaugh, E. R. Stofan, M. Janssen, C. Neish, S. Wall, C. A. Wood, J. I. Lunine, M. Malaska, (2013), Cryovolcanism on Titan: New results from Cassini RADAR and VIMS. Journal of Geophysical Research: Planets, 118, no. 3, 416–435.

C A S S I N I F I N A L M I S S I O N REP O R T 2 01 9 5 3
Lopes, R. M. C., E. R. Stofan, R. Peckyno, J. Radebaugh, K. L. Mitchell, G. Mitri, C. A. Wood, R. L. Kirk, S. D. Wall, J. I. Lunine, A. Hayes , R. Lorenz, T. Farr, L. Wye, J. Craig, R. J. Ollerenshaw, M. Janssen, A. LeGall, F. Paganelli, R. West, B. Stiles, P. Callahan, Y. Anderson, P. Valora, L. Soderblom, Cassini RADAR Team, (2010), Distribution and interplay of geologic processes on Titan from Cassini RADAR data, Icarus, 205, 540–588, doi: 10.1016/j.icarus.2009.08.010.
Lopes, R. M. C., K. L. Mitchell, E. R. Stofan, J. I. Lunine, R. Lorenz, F. Paganelli, R. L. Kirk, C. A. Wood, S. D. Wall, L. E. Robshaw, A. D. Fortes, C. D. Neish, J. Radebaugh, E. Reffet, S. J. Ostro, C. Elachi, M. D. Allison, Y. Anderson, R. Boehmer, G. Boubin, P. Callahan, P. Encrenaz, E. Flamini, G. Francescetti, Y. Gim, G. Hamilton, S. Hensley, M. A. Janssen, W. T. K. Johnson, K. Kelleher, D. O. Muhleman, G. Ori, R. Orosei, G. Picardi, F. Posa, L. E. Roth, R. Seu, S. Shaffer, L. A. Soderblom, B. Stiles, S. Vetrella, R. D. West, L. Wye, H. A. Zebker, (2007), Cryovolcanic features on Titan’s surface as revealed by the Cassini Titan RADAR Mapper, Icarus, 186, 395–412.
Lora, J. M. and M. Ádámkovics, (2017), The near-surface methane humidity on Titan, Icarus, 286, 270–279.
Lora, J. M., J. I. Lunine, J. L. Russell, (2015), GCM simulations of Titan's middle and lower atmosphere and comparison to observations, Icarus, 250, 516–528.
Lora, J. M. and J. L. Mitchell, (2015), Titan's asymmetric lake distribution mediated by methane transport due to atmospheric eddies, Geophysical Research Letters, 42, 6213–6220.
Lora, J. M., J. I. Lunine, J. L. Russell, A. G. Hayes, (2014), Simulations of Titan's paleoclimate, Icarus, 243, pp. 264–273.
Lorenz, R. D., R. L. Kirk, A. G. Hayes, Y. Z. Anderson, J. I. Lunine, et al., (2014), A radar map of Titan Seas: Tidal dissipation and ocean mixing through the throat of Kraken, Icarus 237, 9–15, doi: 10.1016/j.icarus.2014.04.005.
Lorenz, R. D. and Zimbelman, J. R., (2014), Dune worlds: How windblown sand shapes planetary landscapes, Springer, Science & Business Media.
Lorenz, R. D., (2014), Physics of saltation and sand transport on Titan: A brief review. Icarus, 230, pp.162–167.
Lorenz, R. D., B. W. Stiles, O. Aharonson, A. Lucas, A. G. Hayes, R. L. Kirk, H. A. Zebker, et al., (2013), A global topographic map of Titan, Icarus, 225, 367–377, doi: 10.1016/j.icarus.2013.04.002.
Lorenz, R. D. and A. G. Hayes, (2012), The growth of wind-waves in Titan’s hydrocarbon seas, Icarus, 219, 468–475.
Lorenz, R. D., (2012), Titan is to Earth's hydrological cycle what Venus is to its greenhouse effect, Comparative Climatology of Terrestrial Planets, Boulder, CO, June 25–28, 2012, LPI Contribution No. 1675, id 8053.
Lorenz, R. D., P. Claudin, B. Andreotti, J. Radebaugh, T. Tokano, (2010), A 3 km atmospheric boundary layer on Titan indicated by dune spacing and Huygens data, Icarus, 205, 2, pp. 719–721.

5 4 V OL U M E 1 : M I S S I O N OV E RVI EW & S CI E N CE OBJ E C TI V ES A N D RE S ULT S
Lorenz, R. D. and J. Radebaugh, (2009), Global pattern of Titan's dunes: radar survey from the Cassini prime mission, Geophysical Research Letters, 36, 3.
Lorenz, R. D., R. M. Lopes, F. Paganelli, J. I. Lunine, R. L. Kirk, K. L. Mitchell, L. A. Soderblom, E. R. Stofan, G. Ori, M. Myers, H. Miyamoto, J. Radebaugh, B. Stiles, S. D. Wall, C. A. Wood, Cassini RADAR Team, (2008a), Fluvial channels on Titan: Initial Cassini RADAR observations, Planetary and Space Science, 56, 1132–1144.
Lorenz, R. D., K. L. Mitchell, R. L. Kirk, A. G. Hayes, H. A. Zebker, P. Paillou, J. Radebaugh, J. I. Lunine, M. A. Janssen, S. D. Wall, R. M. Lopes, B. Stiles, S. Ostro, G. Mitri, E. R. Stofan, Cassini RADAR Team, (2008b), Titan’s Inventory of Organic Surface Materials, Geophysical Research Letters, 35, L02206, doi: 10.1029/2007GL032118.
Lorenz, R. D., C. A. Wood, J. I. Lunine, S. D. Wall, R. M. Lopes, K. L. Mitchell, F. Paganelli, Y. Z. Anderson, L. Wye, C. Tsai, H. Zebker, E. R. Stofan, (2007), Titan's young surface: Initial impact crater survey by Cassini RADAR and model comparison, Geophysical Research Letters, 34, L07204.
Lorenz, R. D., H. B. Niemann, D. N. Harpold, S. H. Way, J. C. Zarnecki, (2006a), Titan's damp ground: Constraints on Titan surface thermal properties from the temperature evolution of the Huygens GCMS inlet, Meteoritics & Planetary Science, 41, 1705–1714.
Lorenz, R. D., S. Wall, J. Radebaugh, G. Boubin, E. Reffet, M. Janssen, E. Stofan, R. Lopes, R. Kirk, C. Elachi, J. Lunine, F. Paganelli, L. Soderblom, C. Wood, L. Wye, H. Zebker, Y. Anderson, S. Ostro, M. Allison, R. Boehmer, P. Callahan, P. Encrenaz, G. G. Ori, G. Francescetti, Y. Gim, G. Hamilton, S. Hensley, W. Johnson, K. Kelleher, K. Mitchell, D. Muhleman, G. Picardi, F. Posa, L. Roth, R. Seu, S. Shaffer, B. Stiles, S. Vetrella, E. Flamini R. West, (2006b), The sand seas of Titan: Cassini RADAR observations of longitudinal dunes, Science, 312, 724–727.
Lorenz, R. D., C. A. Griffith, J. I. Lunine, C. P. McKay, N. O. Rennò, (2005), Convective plumes and the scarcity of Titan's clouds, Geophysical Research Letters, 32, 1.
Lorenz, R. D., G. Biolluz, P. Encrenaz, M. A. Janssen, R. D. West, D.O. Muhleman, (2003), Cassini RADAR: prospects for Titan surface investigations using the microwave radiometer, Planetary and Space Science, 51, 4–5, pp. 353–364.
Lorenz, R. D., (2000), Planetary science - The weather on Titan, Science, 290, 467–468. Lorenz, R. D., C. P. McKay, J. I. Lunine, (1997), Photochemically driven collapse of Titan’s
atmosphere, Science, 275, 642–644. Lorenz, R. D., (1996a), Pillow lava on Titan: expectations and constraints on cryovolcanic
processes, Planetary and Space Science, 44, no. 9, 1021–1028. Lorenz, R. D. and J. I. Lunine, (1996b), Erosion on Titan: Past and present, Icarus, 122, 79–91. Lorenz, R. D., J. I. Lunine, J. A. Grier, M. A. Fisher, (1995), Prediction of aeolian features on
planets: Application to Titan paleoclimatology, Journal of Geophysical Research: Planets, 100, E12, pp. 26377–26386.
Lorenz, R. D., (1993a), The life, death and afterlife of a raindrop on Titan, Planetary and Space Science, 41, 647–655.
C A S S I N I F I N A L M I S S I O N REP O R T 2 01 9 5 5
Lorenz, R. D., (1993b), The surface of Titan in the context of ESA’s Huygens probe, European Space Agency Journal, vol. 17, pp. 275–292.
Loveday, J. S., R. J. Nelmes, M. Guthrie, S. A. Belmonte, D. R. Allan, et al., (2001), Stable methane hydrate above 2-GPa and the source of Titan's atmospheric methane, Nature, 410, 661–663.
Lucas, A., S. Rodriguez, C. Narteau, B. Charnay, S. C. Pont, T. Tokano, A. Garcia, M. Thiriet, A. G. Hayes, R. D. Lorenz, O. Aharonson, (2014), Growth mechanisms and dune orientation on Titan, Geophysical Research Letters, 41, 17, pp. 6093–6100, doi: 10.1002/2014GL060971.
Lunine, J. I. and S. M. Hörst, (2011), Organic chemistry on the surface of Titan, Rendiconti Lincei-Scienze Fisiche E Naturali, 22, 183–189.
Lunine, J. I., C. Elachi, S. D. Wall, M. A. Janssen, M. D. Allison, Y. Anderson, et al., (2008a), Titan’s diverse landscapes as evidenced by Cassini RADAR’s third and fourth looks, Icarus, 195, 415–433.
Lunine, J. I. and S. K. Atreya, (2008b), The methane cycle on Titan, Nature Geoscience, 1, 159–164.
Lunine, J. I., R. D. Lorenz, W. K. Hartmann, (1998), Some speculations on Titan's past, present and future, Planetary and Space Science, 46, 1099–1107.
Lunine, J. I. and D. J. Stevenson, (1987), Clathrate and ammonia hydrates at high-pressure - application to the origin of methane on Titan, Icarus, 70, 61–77.
Lunine, J. I., D. J. Stevenson, Y. L. Yung, (1983), Ethane ocean on Titan, Science, 222, 1229–1230.
MacKenzie, S. M., J. W. Barnes, C. Sotin, J. M. Soderblom, S. Le Mouélic, S. Rodriguez, K. H. Baines, B. J. Buratti, R. N. Clark, P. D. Nicholson, T. B. McCord, (2014), Evidence of Titan’s climate history from evaporite distribution, Icarus, 243, pp. 191–207.
Malaska, M. J., R. M. Lopes, A. G. Hayes, J. Radebaugh, R. D. Lorenz, E. P. Turtle, (2016), Material transport map of Titan: The fate of dunes, Icarus, 270, pp. 183–196, doi: 10.1016/j.icarus.2015.09.029.
Mastrogiuseppe, M., V. Poggiali, A. G. Hayes, J. I. Lunine, R. Seu, G. Mitri, R. D. Lorenz, (2019), Depp and methane-rich lakes on Titan, Nature Astronomy, 3, 535–542.
Mastrogiuseppe, M., A. G. Hayes, V. Poggiali, J. I. Lunine, R. D. Lorenz, et al., (2017), Bathymetry and composition of Titan’s Ontario Lacus derived from Monte Carlo-based waveform inversion of Cassini RADAR altimetry data, Icarus, 300, 203–209.
Mastrogiuseppe, M., A. Hayes, V. Poggiali, R. Seu, J. I. Lunine, J. D. Hofgartner, (2016), Radar sounding using the Cassini altimeter: Waveform modeling and Monte Carlo approach for data inversion of observations of Titan's seas, IEEE Transactions on Geoscience and Remote Sensing, vol. 54, Issue 10, pp. 5646–5656, doi: 10.1109/TGRS.2016.2563426.
Mastrogiuseppe, M., V. Poggiali, A. Hayes, R. Lorenz, J. Lunine, G. Picardi, R. Seu, E. Flamini, G. Mitri, C. Notarnicola, P. Paillou, H. Zebker, (2014), The bathymetry of a Titan sea, Geophysical Research Letters, vol. 41, no. 5, pp. 1432–1437.
5 6 V OL U M E 1 : M I S S I O N OV E RVI EW & S CI E N CE OBJ E C TI V ES A N D RE S ULT S
McDonald, G. D., A. G. Hayes, R. C. Ewing, J. M. Lora, C. E. Newman, T. Tokano, A. Lucas, A. Soto, G. Chen, (2016) Variations in Titan’s dune orientations as a result of orbital forcing, Icarus, 270, pp.197–210.
McKay, C. P., J. B. Pollack, R. Courtin, (1989), The Thermal Structure of Titans Atmosphere, Icarus, 80, 23-53.
Meriggiola, R., L. Iess, B. W. Stiles, J. I. Lunine, G. Mitri, (2016), The rotational dynamics of Titan from Cassini RADAR images, Icarus, 275, 183–192.
Mitchell, J. L. and J. M. Lora, (2016), The climate of Titan, Annual Review of Earth and Planetary Sciences, vol. 44, 353–380, doi: 10.1146/annurev-earth-060115-012428.
Mitchell, K. L., M. B. Barmatz, C. S. Jamieson, R. D. Lorenz, J. I. Lunine, (2015), Laboratory measurements of cryogenic liquid alkane microwave absorptivity and implications for the composition of Ligeia Mare, Titan, Geophysical Research Letters, 42, 1340–1345.
Mitchell, J. L., M. Adamkovics, R. Caballero, E. P. Turtle, (2011), Locally enhanced precipitation organized by planetary-scale waves on Titan, Nature Geoscience, 4, 589–592.
Mitchell, J. L., (2008), The drying of Titan's dunes: Titan's methane hydrology and its impact on atmospheric circulation, Journal of Geophysical Research: Planets, 113, E8.
Mitri, G., R. Meriggiola, A. Hayes, L. Axel, G. Tobie, et al., (2014), Shape, topography, gravity anomalies and tidal deformation of Titan, Icarus, 236, 169–177.
Moore, J. M., A. D. Howard, A. M. Morgan, (2014), The landscape of Titan as witness to its climate evolution, Journal of Geophysical Research: Planets, 119, 2060–2077, doi: 10.1002/2014JE004608.
Moore, J. M. and Howard A. D., (2011), Are the basins of Titan's Hotei Regio and Tui Regio sites of former low latitude seas?, Geophysical Research Letters, vol. 38, L04201.
Moore, J. M. and R. T. Pappalardo, (2011), Titan: An Exogenic World?, Icarus, 212, 790–806. Mousis, O., M. Choukroun, J. I. Lunine, C. Sotin, (2014), Equilibrium composition between liquid
and clathrate reservoirs on Titan, Icarus, 239, 39–45. Müller‐Wodarg, I. C. F., R. V. Yelle, J. Cui, J. H. Waite, (2008), Horizontal structures and
dynamics of Titan's thermosphere, Journal of Geophysical Research: Planets, vol. 113, Issue E10, doi: 10.1029/2007JE003033.
NASA/JPL-Caltech/GSFC, (2016), Titan Temperature Lag Maps & Animation, https://www.nasa.gov/image-feature/jpl/pia20020/titan-temperature-lag-maps-animation.
Neish, C. D., J. L. Molaro, J. M. Lora, A. D. Howard, R. L. Kirk, P. Schenk, et al., (2016), Fluvial erosion as a mechanism for crater modification on Titan, Icarus, 270, 114–129.
Neish, C. D., J. W. Barnes, C. Sotin, S. MacKenzie, J. M. Soderblom, S. Le Mouélic, et al., (2015), Spectral properties of Titan’s impact craters imply chemical weathering ofits surface, Geophysical Research Letters, 42, 3746–3754.
Neish, C. D. and R. D. Lorenz, (2014), Elevation distribution of Titan's craters suggests extensive wetlands, Icarus, 228, 27–34.
Neish, C. D., R. L. Kirk, R. D. Lorenz, V. J. Bray, P. Schenk, B. W. Stiles, et al., (2013), Crater topography on Titan: Implications for landscape evolution, Icarus, 223, 82–90.

C A S S I N I F I N A L M I S S I O N REP O R T 2 01 9 5 7
Neish, C. D. and R. D. Lorenz, (2012), Titan’s global crater population: A new assessment, Planetary and Space Science, 60, 1, pp. 26–33.
Neish, C. D., R. D. Lorenz, R. L. Kirk, L. C. Wye, (2010), Radarclinometry of the sand seas of Africa’s Namibia and Saturn’s moon Titan, Icarus, 208, 385–394.
Németh, Z., K. Szego, Z. Bebesi, G. Erdős, L. Foldy, A. Rymer, E. C. Sittler, A. J. Coates, A. Wellbrock, (2011), Ion distributions of different Kronian plasma regions, Journal of Geophysical Research: Space Physics, vol. 116, Issue A9, doi: 10.1029/2011JA016585.
Neubauer, F. M., H. Backes, M. K. Dougherty, A. Wennmacher, C. T. Russell, A. Coates, D. Young, N. Achilleos, N. Andre, C. S. Arridge, C. Bertucci, G. H. Jones, K. K. Khurana, T. Knetter, A. Law, G. R. Lewis, J. Saur, (2006), Titan’s near magnetotail from magnetic field and electron plasma observations and modeling: Cassini flybys TA, TB and T3, Journal of Geophysical Research: Space Physics, vol. 111, Issue A10, doi: 10.1029/2006JA011676.
Niemann, H. B., S. K. Atreya, J. Demick, D. Gautier, J. Haverman, D. Harpold, W. Kasprzak, J. Lunine, T. Owen, F. Raulin, (2010), Composition of Titan's lower atmosphere and simple surface volatiles as measured by the Cassini-Huygens probe gas chromatograph mass spectrometer experiment, Journal of Geophysical Research, vol. 115, Issue E12, doi: 10.1029/2010JE003659.
Niemann, H. B., S. K. Atreya, S. J. Bauer, G. R. Carignan, J. E. Demick, et al., (2005), The abundances of constituents of Titan's atmosphere from the GCMS instrument on the Huygens probe, Nature, 438, 779–784, doi: 10.1038/nature04122.
Niemann, H. B., S. K. Atreya, S. J. Bauer, G. R. Carignan, J. E. Demick, R. L. Frost, D. Gautier, J. A. Haberman, D. N. Harpold, D. M. Hunten, G. Israel, J. I. Lunine, W. T. Kasprzak, T. C. Owen, M. Paulkovich, F. Raulin, E. Raaen, S. H. Way, (2005), Huygens probe gas chromatograph mass spectrometer: The atmosphere and surface of Titan, Nature, 438, 779–784.
Nimmo, F. and B. G. Bills, (2010), Shell thickness variations and the long-wavelength topography of Titan, Icarus, 208, 896–904.
Nixon, C., R. Clark, R. Courtin, A. Hayes, R. Lopes, R. Yelle, C. Sotin, A. Rymer, R. Johnson, R. Lorenz, M. Mastroguiseppe, H. Smith, D. Strobel, R. Achterberg, A. Buch, K. Mandt, D. Mitchell, F. Raulin, E. Turtle, L. Iess, V. Vuitton, A. Solomonidou, R. West, P. Coll, (2018), Titan’s cold case files – Outstanding questions after Cassini-Huygens, Planetary and Space Science, 155, pp. 50–72, doi: 10.1016/j.pss.2018.02.009.
Nixon, C. A., D. E. Jennings, B. Bézard, S. Vinatier, N. A. Teanby, K. Sung, T. M. Ansty, et al., (2013), Detection of propene in Titan’s stratosphere, The Astrophysical Journal Letters, vol. 776, no. 1, doi: 10.1088/2041-8205/776/1/L14.
Nixon, C. A., B. Temelso, S. Vinatier, N. A. Teanby, B. Bézard, et al., (2012), Isotopic ratios in Titan’s methan: Measurements and modeling, The Astrophysical Journal, 749, 2, doi: 10.1088/0004-637X/749/2/159.
Nixon, C. A., R. K. Achterberg, S. Vinatier, B. Bézard, A. Coustenis, P. G. J. Irwin, N. A. Teanby, et al., (2008), The 12C/13C isotopic ratio in Titan hydrocarbons from Cassini/CIRS infrared spectra, Icarus, 195, 2, 778–791, doi: 10.1016/j.icarus.2008.01.012.

5 8 V OL U M E 1 : M I S S I O N OV E RVI EW & S CI E N CE OBJ E C TI V ES A N D RE S ULT S
Nixon, C., D. Jennings, B. Bézard, et al., (2008), Isotopic ratios in Titan's atmosphere from Cassini CIRS limb sounding: CO2 at low and midlatitudes, The Astrophysical Journal Letters, 681, 2, L101-L103, doi: 10.1086/590553.
O'Brien, D. P., R. D. Lorenz, J. I. Lunine, (2005), Numerical calculations of the longevity of impact oases on Titan, Icarus, 173, 1, 243–253, doi: 10.1016/j.icarus.2004.08.001.
Osegovic, J. P., M. D. Max, (2005), Compound clathrate hydrate on Titan's surface, Journal of Geophysical Research: Planets, vol. 110, Issue E8, doi: 10.1029/2005JE002435.
Paillou, P., B. Seignovert, J. Radebaugh, S. Wall, (2016), Radar scattering of linear dunes and mega-yardangs: Application to Titan, Icarus, vol. 270, pp. 211–221.
Paillou, P., D. Bernard, J. Radebaugh, R. Lorenz, A. Le Gall, T. Farr, (2014), Modeling the SAR backscatter of linear dunes on Earth and Titan, Icarus, vol. 230, pp. 208–214.
Paillou, P., K. L. Mitchell, S. D. Wall, G. Ruffié, C.A. Wood, R. D. Lorenz, E. R. Stofan, J. I. Lunine, R. M. Lopes, P. Encrenaz, (2008), Microwave dielectric constant of liquid hydrocarbons: Application to the depth estimation of Titan's lakes, Geophysical Research Letters, vol. 35, Issue 5, doi: 10.1029/2007GL032515.
Paillou, P., M. Crapeau, C. Elachi, S. Wall, P. Encrenaz, (2006), Models of SAR backscattering for bright flows and dark spots on Titan, Journal of Geophysical Research, vol. 111, E11011, doi: 10.1029/2006JE002724.
Perron, J. T., M. P. Lamb, C .D. Koven, I. Y. Fung, E. Yager, M. Adamkovics, (2006), Valley formation and methane precipitation rates on Titan, Journal of Geophysical Research: Planets, 111, E11001.
Pierrehumbert, R. T., (2002), The hydrologic cycle in deep-time climate problems, Nature, 419, 191–198.
Poggiali, V., M. Mastrogiuseppe, A. G. Hayes, R. Seu, S. P. D. Birch, R. Lorenz, C. Grima, J. D. Hofgartner, (2016), Liquid-filled canyons on Titan, Geophysical Research Letters, 43, 7887–7894.
Porco, C. C., E. Baker, J. Barbara, K. Beurle, A. Brahic, J. A. Burns, S. Charnoz, N. Cooper, D. D. Dawson, A. D. DelGenio, T. Denk, L. Dones, U. Dyudina, M. W. Evans, S. Fussner, B. Giese, K. Grazier, P. Helfenstein, A. P. Ingersoll, R. A. Jacobson, T. V. Johnson, A. McEwen, C. D. Murray, G. Neukum, W. M. Owen, J. Perry, T. Roatsch, J. Spitale, S. Squyres, P. Thomas, M. Tiscareno, E. P. Turtle, A. R. Vasavada, J. Veverka, R. Wagner, R. West, (2005), Imaging of Titan from the Cassini spacecraft, Nature, 434, 159–168, doi: 10.1038/nature03436.
Radebaugh, J., D. Ventra, R. D. Lorenz, T. Farr, R. Kirk, et al., (2016), Alluvial and fluvial fans on Saturn's moon Titan reveal processes, materials and regional geology, Geological Society, London, Special Publications, 440, no. 1, 281–305.
Radebaugh, J., (2013), Dunes on Saturn’s moon Titan as revealed by the Cassini Mission, Aeolian Research, 11, 23–41.

C A S S I N I F I N A L M I S S I O N REP O R T 2 01 9 5 9
Radebaugh, J., R. Lorenz, T. Farr, P. Paillou, C. Savage, C. Spencer, (2010), Linear dunes on Titan and Earth: Initial remote sensing comparisons, Geomorphology, 121, 122–132, doi: 10.1016/j.geomorph.2009.02.022.
Radebaugh, J., R. D. Lorenz, J. I. Lunine, S. D. Wall, G. Boubin, E. Reffet, R. L. Kirk, R. M. Lopes, E. R. Stofan, L. Soderblom, M. Allison, Cassini Radar Team, (2008), Dunes on Titan observed by Cassini RADAR, Icarus, 194, 2, pp.690–703, doi: 10.1016/j.icarus.2007.10.015.
Rannou, P., F. Montmessin, F. Hourdin, S. Lebonnois, (2006), The latitudinal distribution of clouds on Titan, Science, 311, 5758, pp.201–205.
Rodriguez, S., A. Garcia, A. Lucas, T. Appéré, A. Le Gall, E. Reffet, L. Le Corre, S. Le Mouélic, T. Cornet, S. Courrech du Pont, C. Narteau, O. Bourgeois, J. Radebaugh, K. Arnold, J. W. Barnes, K. Stephan, R. Jaumann, C. Sotin, R. H. Brown, R. D. Lorenz, E. P. Turtle, (2014), Global mapping and characterization of Titan’s dune fields with Cassini: correlation between RADAR and VIMS observations, Icarus, 230, 168–179.
Rodriguez, S., S. Le Mouélic, P. Rannou, C. Sotin, R. H. Brown, et al., (2011), Titan's cloud seasonal activity from winter to spring with Cassini/VIMS, Icarus, 216, 89–110, doi: 10.1016/j.icarus.2011.07.031.
Rodriguez, S., S. Le Mouélic, P. Rannou, J.-P. Combe, L. Le Corre, G. Tobie, J. W. Barnes, et al., (2009), Fast forward modeling of Titan's infrared spectra to invert VIMS/Cassini hyperspectral images, IEEE First Workshop on Hyperspectral Image and Signal Processing: Evolution in Remote Sensing, pp. 1-4.
Roe, H. G., I. de Pater, B. A. Macintosh, C. P. McKay, (2002), Titan's clouds from Gemini and Keck adaptive optics imaging, The Astrophysical Journal, 581, 1399–1406.
Roussos, E., P. Kollmann, N. Krupp, C. Paranicas, K. Dialynas, N. Sergis, D. G. Mitchell, D. C. Hamilton, S. M. Krimigis, (2018), Drift-resonant, relativistic electron acceleration at the outer planets: Insights from the response of Saturn’s radiation belts to magnetospheric storms, Icarus, 305, 160–173, doi: 10.1016/j.icarus.2018.01.016.
Rubin, D. M. and P. A. Hesp, (2009), Multiple origins of linear dunes on Earth and Titan, Nature Geoscience, 2, 9, p. 653.
Rymer, A. M., H. T. Smith, A. Wellbrock, A. J. Coates, D. T. Young, (2009), Discrete classification and electron energy spectra of Titan’s varied magnetospheric environment, Geophysical Research Letters, 36, 15109, doi: 10.1029/2009GL039427.
Sagan, C. and S. F. Dermott, (1982) The tide in the seas of Titan, Nature, 300, 731–733. Savage, C. J., J. Radebaugh, E. H. Christiansen, R. D. Lorenz, (2014), Implications of dune
pattern analysis for Titan’s surface history, Icarus, 230, pp. 180–190. Schaller, E. L., H. G. Roe, T. Schneider, M. E. Brown, (2009), Storms in the tropics of Titan,
Nature, 460, 873–875. Schaller, E. L., M. E. Brown, H. G. Roe, A. H. Bouchez, C. A. Trujillo, (2006), Dissipation of
Titan's south polar clouds, Icarus, 184, 517–523.

6 0 V OL U M E 1 : M I S S I O N OV E RVI EW & S CI E N CE OBJ E C TI V ES A N D RE S ULT S
Schinder, P. J., F. M. Flasar, E. A. Marouf, et al., (2012), The structure of Titan's atmosphere from Cassini radio occultations: Occultations from the Prime and Equinox missions, Icarus, 221, 1020–1031, doi: 10.1016/j.icarus.2012.10.021.
Schneider, T., S. D. B. Graves, E. L. Schaller, M. E. Brown, (2012), Polar methane accumulation and rainstorms on Titan from simulations of the methane cycle, Nature, 481, 58–61.
Schurmeier, L. R. and A. J. Dombard, (2018), Crater relaxation on Titan aided by low thermal conductivity sand infill, Icarus, 305, 314–323.
Sears, W. D., (1995), Tidal dissipation in oceans on Titan, Icarus, 113, 1, 39–56, doi: 10.1006/icar.1995.1004.
Shah, M. B., C. J. Latimer, E. C. Montenegro, O. J. Tucker, R. E. Johnson, H. T. Smith, (2009), The implantation and interactions of O+ in Titan’s atmosphere: Laboratory measurements of collision-induced dissociation of N2 and modeling of positive ion formation, The Astrophysical Journal, 703, 1947–1954, doi: 10.1088/0004-637X/703/2/1947.
Shebanits, O., J.-E. Wahlund, N. J. T. Edberg, et al., (2016), Ion and aerosol precursor densities in Titan’s ionosphere: A multi-instrument case study, Journal of Geophysical Research: Space Physics, 121, 10075–10090, doi: 10.1002/2016JA022980.
Sillanpää, I., D. T. Young, F. Crary, M. Thomsen, D. Reisenfeld, J.-E. Wahlund, C. Bertucci, E. Kallio, R. Jarvinen, P. Janhunen, (2011), Cassini plasma spectrometer and hybrid model study on Titan’s interaction: Effect of oxygen ions, Journal of Geophysical Research, 116, A7, doi: 10.1029/2011JA016443.
Simon, S., A. Wennmacher, F. M. Neubauer, et al., (2010), Titan's highly dynamic magnetic environment: A systematic survey of Cassini magnetometer observations from flybys TA-T62, Planetary and Space Science, 58, 1230–1251, doi: 10.1016/j.pss.2010.04.021.
Singh, S., T. B. McCord, J. P. Combe, S. Rodriguez, T. Cornet, et al., (2016), Acetylene on Titan's surface, The Astrophysical Journal, vol. 828, no. 1, doi: 10.3847/0004-637X/828/1/55.
Sittler, E. C., R. E. Hartle, C. Bertucci, A. Coates, T. Cravens, I. Dandouras, D. Shemansky, (2009), Energy deposition processes in Titan’s upper atmosphere and its induced magnetosphere, Chapter 16, In Titan from Cassini-Huygens, (eds.) R. H. Brown, J. P. Lebreton, J. H. Waite, Springer, Dordrecht, pp. 393–453, doi: 10.1007/978-1-4020-9215-2_16.
Snowden, D., R. V. Yelle, J. Cui, J.-E. Wahlund, K. Ågren, N. J. T. Edberg, (2013), The thermal structure of Titan’s upper atmosphere, I: Temperature profiles from Cassini INMS observations, Icarus, 226, 522–582, doi: 10.1016/j.icarus.2013.06.006.
Soderblom, J. M., R. H. Brown, L. A. Soderblom, J. W. Barnes, R. Jaumann, S. Le Mouélic, et al., (2010), Geology of the Selk crater region on Titan from Cassini VIMS observations, Icarus, 208, 905–912.
Soderblom, L. A., R. H. Brown, J. M. Soderblom, J. W. Barnes, R. L. Kirk, C. Sotin, R. Jaumann, D. J. MacKinnon, D. W. Mackowski, K. H. Baines, B. J. Buratti, R. N. Clark, P. D. Nicholson, (2009), The geology of Hotei Regio, Titan: Correlation of Cassini VIMS and RADAR, Icarus, 204, 610–618, doi: 10.1016/j.icarus.2009.07.033.

C A S S I N I F I N A L M I S S I O N REP O R T 2 01 9 6 1
Soderblom, L. A., M. G. Tomasko, B. A. Archinal, T. L. Becker, M. W. Bushroe, et al., (2007) Topography and geomorphology of the Huygens landing site on Titan, Planetary and Space Science, 55, 2015–2024.
Soderblom, L., J. Anderson, K. Baines, J. Barnes, J. Barrett, R. Brown, B. Buratti, R. Clark, D. Cruikshank, C. Elachi, M. Janssen, R. Jaumann, R. Kirk, E. Karkoschka, S. Lemouelic, R. Lopes, R. Lorenz, J. Lunine, T. McCord, P. Nicholson, J. Radebaugh, B. Rizk, C. Sotin, E. Stofan, T. Sucharski, M. Tomasko, S. Wall, (2007), Correlations between Cassini VIMS spectra and RADAR SAR images: Implications for Titan’s surface composition and the character of the Huygens Probe landing site, Planetary and Space Science, 55, 2025–2036.
Sohl, F., A. Solomonidou, F.W. Wagner, A. Coustenis, H. Hussmann, D. Schulze-Makuch, (2014), Tidal stresses on Titan and implications for its geology and habitability, Journal of Geophysical Research, 119, 1013–1036.
Sohl, F., H. Hussmann, B. Schwentker, T. Spohn, R. D. Lorenz, (2003), Interior structure models and tidal Love numbers of Titan, Journal of Geophysical Research, 108, E12, 5130, doi: 10.1029/2003JE002044.
Solomonidou, A., A. Coustenis, R. M. C. Lopes, M. Malaska, S. Rodriguez, P. Drossart, C. Elachi, B. Schmitt, S. Philippe, M. Janssen, M. Hirtzig, S. Wall, C. Sotin, K. Lawrence, N. Altobelli, E. Bratsolis, J. Radebaugh, K. Stephan, R. H. Brown, S. Le Mouélic, A. Le Gall, E. V. Villanueva, J. F. Brossier, A. A. Bloom, O. Witasse, C. Matsoukas, A. Schoenfeld, (2018), The spectral nature of Titan’s major geomorphological units: Constraints on surface composition, Journal of Geophysical Research: Planets, 123, no. 2, 489–507.
Solomonidou, A., A. Coustenis, M. Hirtzig, S. Rodriguez, K. Stephan, R. M. C. Lopes, P. Drossart, C. Sotin, S. Le Mouélic, K. Lawrence, E. Bratsolis, R. Jaumann, R. H. Brown, (2016), Temporal variations of Titan’s surface with Cassini/VIMS, Icarus, 270, 85–99.
Solomonidou, A., M. Hirtzig, A. Coustenis, E. Bratsolis, S. Le Mouélic, S. Rodriguez, K. Stephan, et al., (2014), Surface albedo spectral properties of geologically interesting areas on Titan, Journal of Geophysical Research, 119, 1729–1747.
Sotin, C. R. Jaunmann, B. J. Buratti, R. H. Brown, R. N. Clark, L. A. Soderblom, K. H. Baines, G. Bellucci, J.-P. Bribing, F. Capaccioni, P. Cerroni, A. Coradini, D. P. Cruikshank, P. Drossart, V. Formisano, Y. Langevin, D. L. Matson, T. B. McCord, R. M. Nelson, P. D. Nicholson, B. Sicardy, S. LeMouelic, S. Rodriguez, K. Stephan, C. K. Scholz, (2005), Release of Volatiles from a possible cryovolcano from near-infrared imaging of Titan, Nature, 435, 786–789.
Southwood, D. J. and M. G. Kivelson, (2007), Saturnian magnetospheric dynamics: Elucidation of a camshaft model, Journal of Geophysical Research, vol. 112, Issue A12, doi: 10.1029/2007JA012254.
Stephan, K., R. Jaumann, R. H. Brown, J. M. Soderblom, L. A. Soderblom, et al., (2010), Specular reflection on Titan: Liquids in Kraken Mare, Geophysical Research Letters, 37.
Stevens, M. H., J. Gustin, J. M. Ajello, J. S. Evans, R. R. Meier, A. J. Kochenash, A. W. Stephan, A. I. F. Stewart, L. W. Esposito, W. E. McClintock, G. Holsclaw, E. T. Bradley, B. R. Lewis,

6 2 V OL U M E 1 : M I S S I O N OV E RVI EW & S CI E N CE OBJ E C TI V ES A N D RE S ULT S
A. N. Heays, (2011), The production of Titan’s ultraviolet nitrogen airglow, Journal of Geophysical Research: Space Physics, 116, A15, 5304, doi: 10.1029/2010JA016284.
Stiles, B. W., R. L. Kirk, R. D. Lorenz, S. Hensley, E. Lee, S. J. Ostro, M. D. Allison, P. S. Callahan, Y. Gim, L. Iess, P. Perci del Marmo, G. Hamilton, W. T. K. Johnson, R. D. West, Cassini RADAR Team, (2010), Erratum: Determining titan's spin state from Cassini radar images, (2008, AJ, 135, 1669), Published 2009 December 10 © 2010, The American Astronomical Society, The Astronomical Journal, vol. 139, no. 1, doi: 10.1088/0004-6256/139/1/311.
Stiles, B. W., S. Hensley, Y. Gim, D. M. Bates, R. L. Kirk, A. Hayes, J. Radebaugh, R. Lorenz, K. L. Mitchell, P. S. Callahan, H. Zebker, W. T. K. Johnson, S. D. Wall, J. I. Lunine, C. A. Wood, M. Janssen, F. Pelletier, R. D. West, C. Veeramachenenia, Cassini RADAR Team, (2009), Determining Titan surface topography from Cassini SAR data, Icarus, 202, 584–598.
Stiles, B. W., R. L. Kirk, R. D. Lorenz, S. Hensley, E. Lee, S. J. Ostro, M. D. Allison, et al., (2008), Determining Titan's spin state from Cassini RADAR images, The Astronomical Journal, 135, no. 5, 1669.
Stofan, E. R., C. Elachi, J. I. Lunine, R. D. Lorenz, B. Stiles, et al., (2007), The lakes of Titan, Nature, 445, 61–64.
Strobel, D. F. and J. Cui, (2014), Titan’s upper atmosphere/exosphere, escape processes and rates, Chapter 10, In Titan: Interior, Surface, Atmosphere and Space Environment, (eds.) I. Müeller-Wodarg, C. Griffith, E. Lellouch, T. Cravens, Cambridge University Press, pp. 355–375, doi: 10.1017/CBO9780511667398.013.
Strobel, D. F., S. K. Atreya, B. Bézard, F. Ferri, F. M. Flasar, M. Fulchignoni, E. Lellouch, I. Müller-Wodarg, (2009), Atmospheric structure and composition, Chapter 10, In Titan from Cassini-Huygens, (eds.) R. H. Brown, J. P. Lebreton, J. H. Waite, Springer, Dordrecht, pp. 235–257, doi: 10.1007/978-1-4020-9215-2_10.
Szego, K., Z. Nemeth, G. Erdos, L. Foldy, M. Thomsen, D. Delapp, (2011), The plasma environment of Titan: The magnetodisk of Saturn near the encounters as derived from ion densities measured by the Cassini/CAPS plasma spectrometer, Journal of Geophysical Research, vol. 116, Issue A10, doi: 10.1029/2011JA016629.
Tan, S. P., J. S. Kargel, D. E. Jennings, M. Mastrogiuseppe, H. Adidharma, G. M. Marion, (2015), Titan's liquids: Exotic behavior and its implications on global fluid circulation, Icarus, 250, 64–75.
Teanby, N. A. B. Bézard, S. Vinatier, (2017), The formation and evolution of Titan’s winter polar vortex, Nature Communications, 8, 1586, doi: 10.1038/s41467-017-01839-z.
Teanby, N.A., R. de Kok, P. G. J. Irwin, S. Osprey, S. Vinatier, P. J. Gierasch, P. L. Read, et al., (2008), Titan’s winter polar vortex structure revealed by chemical tracers, Journal of Geophysical Research, 113, E12003, doi: 10.1029/2008JE003218.
Teolis, B. D., H. B. Niemann, J. H. Waite Jr., et al., (2015), A revised sensitivity model for Cassini INMS: Results at Titan, Space Science Review, 190, 47–84, doi: 10.1007/s11214-014-0133-8.

C A S S I N I F I N A L M I S S I O N REP O R T 2 01 9 6 3
Tobie, G., J. Lunine, J. Monteux, O. Mousis, and F. Nimmo, (2014), The origin and evolution of Titan, In Titan: Interior, Surface, Atmosphere, and Space Environment, (eds.) I. Müller-Wodarg, C. Griffith, E. Lellouch, T. Cravens, Cambridge University Press, pp. 29–62), doi: 10.1017/CBO9780511667398.004.
Tobie, G., M. Choukroun, O. Grasset, S. Le Mouelic, J. I. Lunine, et al., (2009), Evolution of Titan and implications for its hydrocarbon cycle, Philosophical Transactions of the Royal Society A: Mathematical, Physical and Engineering Sciences, 367, 617–631, doi: 10.1098/rsta.2008.0246.
Tobie, G., J. I. Lunine, C. Sotin, (2006), Episodic outgassing as the origin of atmospheric methane on Titan, Nature, 440, 61–64.
Tokano, T., (2010), Relevance of fast westerlies at equinox for the eastward elongation of Titan’s dunes, Aeolian Research, vol. 2, Issues 2–3, pp.113–127, doi: 10.1016/j.aeolia.2010.04.003.
Tokano, T., (2008), Dune-forming winds on Titan and the influence of topography, Icarus, vol. 194, Issue 1, pp. 243–262, doi: 10.1016/j.icarus.2007.10.007.
Tokano, T., (2005), Meteorological assessment of the surface temperatures on Titan: Constraints on the surface type, Icarus, 173, 222–242.
Tomasko, M. G. and R. A. West, (2009), Aerosols in Titan's atmosphere, Chapter 12, In Titan from Cassini-Huygens, (eds.) R. H. Brown, J. P. Lebreton, J. H. Waite, Springer, Dordrecht, doi: 10.1007/978-1-4020-9215-2_12.
Tomasko, M. G., L. R. Doose, L. E. Dafoe, C. See, (2009), Limits on the size of aerosols from measurements of linear polarization in Titan's atmosphere, Icarus, 204, 271–283.
Tomasko, M. G., L. Doose, S. Engel, L. E. Dafoe, R. West, M. Lemmon, E. Karkoschka, C. See, (2008), A model of Titan's aerosols based on measurements made inside the atmosphere, Planetary and Space Science, 56, 669–707.
Tomasko, M., B. Archinal, T. Becker, B. Bézard, M. Bushroe, M. Combes, D. Cook, A. Coustenis, C. de Bergh, L. Dafoe, L. Doose, S. Douté, A. Eibl, S. Engel, F. Gliem, B. Grieger, K. Holso, E. Howington-Kraus, E. Karkoschka, H. Keller, R. Kirk, R. Kramm, M. Küppers, P. Lanagan, E. Lellouch, M. Lemmon, J. Lunine, E. McFarlane, J. Moores, M. Prout, B. Rizk, M. Rosiek, P. Rueffer, S. Schröder, B. Schmitt, C. See, P. Smith, L. Soderblom, N. Thomas, R. West, (2005), Rain, winds, and haze during the Huygens probe descent to Titan’s surface, Nature, 438, 765–778.
Toon, O. B., C. P. McKay, R. Courtin, T. P. Ackerman, (1988), Methane Rain on Titan, Icarus, 75, 255–284.
Tsoar, H., (1983), Dynamic processes acting on a longitudinal (seif) dune, Sedimentology, vol. 30, Issue 4, pp. 567–578, doi: 10.1111/j.1365-3091.1983.tb00694.x.
Tucker, O. J. and R. E. Johnson, (2009), Thermally driven atmospheric escape: Monte Carlo simulations for Titan’s atmosphere, Planetary and Space Science, vol. 57, Issues 14–15, pp. 1889–1894, doi: 10.1016/j.pss.2009.06.003.

6 4 V OL U M E 1 : M I S S I O N OV E RVI EW & S CI E N CE OBJ E C TI V ES A N D RE S ULT S
Turtle, E. P., J. E. Perry, J. M. Barbara, A. D. DelGenio, S. Rodriguez, S. Le Mouélic, C. Sotin, et al., (2018), Titan's meteorology over the Cassini Mission: Evidence for extensive subsurface methane reservoirs, Geophysical Research Letters, vol. 45, Issue 11, pp. 5320–5328, doi: 10.1029/2018GL078170.
Turtle, E. P., J. E. Perry, A. G. Hayes, R. D. Lorenz, J. W. Barnes, et al., (2011), Rapid and extensive surface changes near Titan’s equator: Evidence of April showers, Science, 331, 1414–1417, doi: 10.1126/science.1201063.
Turtle, E. P., J. E. Perry, A. S. McEwen, A. D. DelGenio, J. Barbara, et al., (2009) Cassini imaging of Titan's high-latitude lakes, clouds, and south-polar surface changes, Geophysical Research Letters, 36, no. 2.
Vervack Jr., R. J., B. R. Sandel, D. F. Strobel, (2004), New perspectives on Titan's upper atmosphere from a reanalysis of the Voyager 1 UVS solar occultations, Icarus, 170, 91–112.
Vinatier, S., B. Schmitt, B. Bézard, et al., (2018), Study of Titan's fall southern stratospheric polar cloud composition with Cassini/CIRS: Detection of benzene ice, Icarus, vol. 310, pp. 89-104, doi: 10.1016/j.icarus.2017.12.040.
Vinatier, S., B. Bézard, S. Lebonnois, et al., (2015), Seasonal variations in Titan’s middle atmosphere during the northern spring derived from Cassini/CIRS observations, Icarus, vol. 250, pp. 95–115, doi: 10.1016/j.icarus.2014.11.019.
Vinatier, S., P. Rannou, C. A. Anderson, et al., (2012), Optical constants of Titan’s stratospheric aerosols in the 70–1500 cm-1 spectral range constrained by Cassini/CIRS observations, Icarus, vol. 219, Issue 1, pp. 5–12, doi: 10.1016/j.icarus.2012.02.009.
Vinatier, S., B. Bézard, C. A. Nixon, A. Mamoutkine, R. C. Carlson, et al., (2010), Analysis of Cassini/CIRS limb spectra of Titan acquired during the nominal mission: I. Hydrocarbons, nitriles and CO2 vertical mixing ratio profiles, Icarus, vol. 205, Issue 2, pp. 559–570, doi: 10.1016/j.icarus.2009.08.013.
Vinatier, S., B. Bézard, C. A. Nixon, (2007), The Titan 14N/15N and 12C/13C isotopic ratios in HCN from Cassini/CIRS, Icarus, vol. 191, Issue 2, pp. 712–721, doi: 10.1016/j.icarus.2007.06.001.
Vixie, G., J. W. Barnes, B. Jackson, S. Rodriguez, S. Le Mouélic, et al., (2015), Possible temperate lakes on Titan, Icarus, vol. 257, pp. 313–323, doi: 10.1016/j.icarus.2015.05.009.
Vuitton, V., R. V. Yelle, S. J. Klippenstein, S. M. Hörst, P. Lavvas, (2019), Simulating the density of organic species in the atmosphere of Titan with a coupled ion-neutral photochemical model, Icarus, 324, 120–197, doi: 10.1016/j.icarus.2018.06.013.
Waite Jr., J. H., D. T. Young, T. E. Cravens, A. J. Coates, F. J. Crary, B. Magee, J. Westlake, (2007), The process of tholin formation in Titan's upper atmosphere, Science, 316, 870, doi: 10.1126/science.1139727.
Wall, S., A. Hayes, C. Bristow, R. Lorenz, E. Stofan, et al., (2010), Active shoreline of Ontario Lacus, Titan: A morphological study of the lake and its surroundings, Geophysical Research Letters, vol. 37, Issue 5, doi: 10.1029/2009GL041821.
C A S S I N I F I N A L M I S S I O N REP O R T 2 01 9 6 5
Wall, S. D., R. M. Lopes, E. R. Stofan, C. A. Wood, J. L. Radebaugh, et al., (2009), Cassini RADAR images at Hotei Arcus and western Xanadu, Titan: Evidence for geologically recent cryovolcanic activity, Geophysical Research Letters, vol. 36, Issue 4, doi: 10.1029/2008GL036415.
Ward, W. R. and D. P. Hamilton, (2004), Tilting Saturn: I. Analytic model. Astronomical Journal vol. 128, no. 5, pp. 2501–2509.
Wei, H. Y., C. T. Russell, M. K. Dougherty, F. M. Neubauer, Y. J. Ma, (2010), Upper limits on Titan’s magnetic moment and implications for its interior, J. Geophys. Res., 115, E10007, doi: 10.1029/2009JE003538.
Wei, H. Y., Russell, C. T., Dougherty, M. K., Neubauer, F. M., Ma, Y. J., (2010), Upper limits on Titan's magnetic moment and implications for its interior, Journal of Geophysical Research, vol. 115, Issue E10, doi: 10.1029/2009JE003538.
West, R., B. Seignovert, P. Rannou, P. Dumont, E. P. Turtle, J. Perry, M. Roy, A. Ovanessian, (2018), The seasonal cycle of Titan's detached haze, Nature Astronomy, 2, 495–500.
West, R. A., P. Lavvas, C. Anderson, H. Imanaka, (2014), Titan's Haze, Chapter 8, In Titan: Surface, Atmosphere and Magnetosphere, (eds.) I. Müller-Wodarg, C. Griffith, E. Lellouch, T. Cravens, Cambridge University Press, pp. 285–321.
West, R. A., J. M. Ajello, M. H. Stevens, D. F. Strobel, G. R. Gladstone, J. S. Evans, E. T. Bradley, (2012), Titan Airglow During Eclipse, Geophys. Res. Lett., 39, L18204, doi: 10.1029/2012GL053230.
Wilson, E. H. and S. K. Atreya, (2009), Titan’s carbon budget and the case of the missing ethane, The Journal of Physical Chemistry A, 113, 42, 11221–11226, doi: 10.1021/jp905535a.
Wood, C. A., (2018), Titan’s great crustal thickening event and recent geologic history, Lunar and Planetary Science Conference, vol. 49, 1343.
Wood, C. A., R. Lorenz, R. Kirk, R. Lopes, K. Mitchell, E. Stofan, (2010), Impact craters on Titan, Icarus, 206, 334–344.
Wye, L. C., (2011), Radar scattering from Titan and Saturn's icy satellites using the Cassini spacecraft, Ph.D. Thesis, Stanford University.
Wye, L. C., H. A. Zebker, R. D. Lorenz, (2009), Smoothness of Titan's Ontario Lacus: Constraints from Cassini RADAR specular reflection data, Geophysical Research Letters, vol. 36, Issue 16, doi: 10.1029/2009GL039588.
Wye, L. C., H. A. Zebker, S. J. Ostro, R. D. West, Y. Gim, R. D. Lorenz, Cassini RADAR Team, (2007), Electrical properties of Titan's surface from Cassini RADAR scatterometer measurements, Icarus, vol. 188, Issue 2, pp. 367–385, doi: 10.1016/j.icarus.2006.12.008.
Yelle, R. V., J. Cui, I. C. F. Müller-Wodarg, (2008), Methane escape from Titan's atmosphere, Journal of Geophysical Research: Planets, vol. 113, Issue E10, doi: 10.1029/2007JE003031.
Yelle, R. V., D. F. Strobel, E. Lellouch, D. Gautier, (1997), Engineering models for Titan's atmosphere, Huygens: Science, Payload and Mission, vol. 1177, pp. 243–256.

6 6 V OL U M E 1 : M I S S I O N OV E RVI EW & S CI E N CE OBJ E C TI V ES A N D RE S ULT S
Yu, X., S. M. Hörst, C. He, N. T. Bridges, D. M. Burr, J. A. Sebree, J. K. Smith, (2017), The effect of adsorbed liquid and material density on saltation threshold: Insight from laboratory and wind tunnel experiments, Icarus, 297, pp.97–109.
Yung, Y. L., M. Allen, J. P. Pinto, (1984) Photochemistry of the atmosphere of Titan - Comparison between model and observations, The Astrophysical Journal Supplement Series, 55, 465–506, doi: 10.1086/190963.
Zahnle, K., P. Schenk, H. Levison, L. Dones, (2003), Cratering rates in the outer Solar System, Icarus, 163, 263–289.
Zebker, H., A. Hayes, M. Janssen, A. Le Gall, R. Lorenz, L. Wye, (2014), Surface of Ligeia Mare, Titan, from Cassini altimeter and radiometer analysis, Geophysical Research Letters ,41, 308–313.
Zebker, H. A., B. Stiles, S. Hensley, R. Lorenz, R. L. Kirk, J. I. Lunine, (2009), Size and shape of Saturn’s moon Titan, Science, 324, 921–923.
Zebker, H., L. Wye, M. Janssen, Cassini Radar Team, (2008),Titan's surface from reconciled Cassini microwave reflectivity and emissivity observations, Icarus, vol. 194, Issue 2, pp. 704–710.