3.1 i ntroduction
TRANSCRIPT

Chapter 3 Mechanical properties of PFRPs: Effect of fibre/yarn and matrix type
DU Shah Page | 63
3 MECHANICAL PROPERTY CHARACTERISATION OF PLANT
YARN REINFORCED THERMOSET MATRIX COMPOSITES*
3.1 INTRODUCTION
Employing plant fibre yarns as continuous reinforcements for unidirectional
composites, this chapter evaluates the mechanical properties of aligned plant fibre
composites (PFRPs), against aligned E-glass composites (GFRPs), to appreciate the
true potential of biofibres as stiffness-inducing reinforcements. As composite
materials are heterogeneous, the reinforcement and matrix type will obviously affect
composite properties. Noting the effectiveness of aligned bast fibre reinforcements
(e.g. flax, hemp and jute) and thermoset matrices (e.g. unsaturated polyester and
epoxy) for load-bearing composites (as highlighted in Chapter 2), this study
examines the effect of plant yarn type/quality and thermoset matrix type on
composite properties.
3.2 EXPERIMENTAL METHODOLOGY
3.2.1 Reinforcement materials
Four commercially available plant fibre yarns/rovings were used as composite
reinforcements. The material properties of the four yarns are tabulated in Table 3.1,
and have been determined by the author of this thesis (Appendix A). Notes on
fibre/yarn processing are also provided in Table 3.1 Yarns have been named
according to the fibre type (denoted by first initial) followed by the twist level in
turns per meter (tpm); so, J190 is a jute yarn with a twist level of 190 tpm. The
selected yarns enable studying the effect of fibre/yarn type (jute, hemp and flax) and
fibre/yarn quality (F50 and F20) on PFRP mechanical performance. Note that fibre
* This chapter is based on the peer-reviewed journal article:
Shah DU, Schubel PJ, Clifford MJ, Licence P. Mechanical property characterization of
aligned plant yarn reinforced thermoset matrix composites manufactured via vacuum
infusion. Polymer-Plastics Technology and Engineering, 2014, 53(3): p. 239-253.

Chapter 3
Page | 64
quality is defined ‘qualitatively’ by the source of the fibre/yarn and the mechanical
properties of the resulting composite. Here, F20 is considered as a flax yarn with
high-quality fibres, while F50 is a flax yarn with low-quality fibres.
On a side note, Table 3.1 also presents the commercial price of these yarns at the
time of writing. Note that significant scales of economy are linked with bulk orders.
Nonetheless, it is clear that only jute yarn (produced in developing nations such as
Bangladesh) is able to compete against E-glass in terms of cost. Flax and hemp
yarns/rovings (often produced in China but processed in Europe [2]), are up to 10
times more expensive than E-glass. Clearly, yarns of temperate fibres (flax and
hemp) are not cost-viable substitutes to E-glass for composite reinforcement.
3.2.2 Production of unidirectional mats
For use as aligned reinforcements, the yarns were processed in the form of
unidirectional mats. The mats were prepared using a drum-winding system (Fig. 3.1).
The semi-continuous process involved automatic winding of yarns around a rotating
(~60 rpm) and traversing (~0.5 mm/sec) aluminium drum (Ø315 mm, 400 mm long)
with periodic manual adjustments of yarns to minimize inter-yarn spacing. Once the
drum length was covered, the monolayer winding was uniformly hand painted with
0.6 wt% aqueous hydroxyethylcellulose (HEC) solution and dried at 60 °C for 30
min. HEC was purchased from Dow Chemical (Cellosize HEC QP-52000H). The
mat was then recovered upon drying and cut to size (250×250 mm2). The HEC
binding agent ensured that the mat held together. Although the binding agent
application process is crude with little control over film thickness, the process
effectively allowed the production of unidirectional mats with a high degree of
alignment and controlled areal density (300-400 ± 32 gsm). The binding agent
accounted for 1-3 wt% of the mat. Importantly, the binding agent is cellulose-based
(i.e. with surface properties similar to plant fibres) and thus has no significant effect
on the properties of the resulting composite. This was confirmed (presented in
Appendix B) through tensile tests on F50/polyester composites manufactured with i)
mats produced using the technique outlined previously, and ii) stitched mats supplied
by Formax (UK) Ltd.

Table 3.1. List of plant fibre materials and their properties.
Yarn ID
Fibre type
Fibre density†
ρf [gcm-3]
Nominal linear
density [tex]
True linear
density† [tex]
Nominal twist level
T [tpm]
Surface twist
angle†
α [°]
Yarn diameter†
dy [mm]
Packing fraction†
Φ
Price* Cf
[£/kg] Supplier
Notes on yarn processing ψ
J190 Jute 1.433 ± 0.005 250 206 ± 21 190 20.5 ± 5.9 0.428 0.596 ~1.1 Janata and Sadat Jute Ltd (Bangladesh)
Water retted fibres; Z-twist ring spun (dry) yarns; batching oil
used as lubricant
H180 Hemp 1.531 ± 0.003 285 278 ± 17 180 19.5 ± 4.3 0.480 0.591 ~7.6 Safilin (Poland)
Dew retted fibres; Relatively higher shive content; Z-twist
ring spun (dry) yarns
F50 Flax 1.529 ± 0.003 250 229 ± 22 50 4.9 ± 3.8 0.437 0.421 ~10.0 Composites Evolution (UK)
Dew retted fibres; Z-twist core flax yarn with S-twist polyester
filament binder (13 wt%)
F20 Flax 1.574 ± 0.004 400 396 ± 16 20 0.5 ± 0.2 0.506 - ~13.3 Safilin (France)
Dew retted fibres; Z-twist ring spun (wet) rovings; fibres boiled in dilute NaOH prior to spinning
† Characterised and measured in Appendix A. Note that the measured fibre density is the absolute density (i.e. excluding the lumen) including moisture (typically 10 wt%). Also, the yarn diameter is based on a measured cross-sectional area (using pycnometry), and assuming circular cross-section. However, due to the low-twist and thus low packing fraction of F20, it is a roving with a non-circular cross-section.
* The price of yarn/roving quoted is approximate and based on small quantities. Prices reduce significantly with high quantities (>5 tonnes). For reference, the price of raw flax/hemp fibre ranges between 0.5-1.5 £/kg, while the price of E-glass is Cf ≈1.3 £/kg [1]. ψ Further notes on fibre/yarn processing: During the fibre extraction process, the tropical jute fibres have undergone water retting (a more controlled but water-polluting process), while fibres from the temperate region (flax and hemp) have undergone dew/field retting (a strictly natural process influenced by actual weather conditions). Different batches of fibres were mixed, to ensure consistent yarn quality. All yarn batches consisted of several bobbins of yarn. None of the yarns were dyed or coated with wax to facilitate any subsequent dyeing process. Textile yarns J190 and H180 were obtained in high twist. For the former, ‘jute batching oil’ was used as a lubricant to increase yarn regularity during the drafting process. F50 is a low-twist flax with a polyester binder yarn, while F20 is a flax roving. F20 is the only yarn produced in a wet-spun process, where the fibres are soaked in a hot dilute solution of NaOH before spinning; this process improves defibration and yarn regularity.

Mechanical properties of PFRPs: Effect of fibre/yarn and matrix type
Page | 66
Fig. 3.1. Developed unidirectional mat fabrication process: a) Automatic winding of yarn around a drum; b) close-up of yarn guide and roller; c) manual shifting of yarn (if required) to produce a completed mono-layer winding; d) recovered mat after applying HEC binding agent and drying; e) single layer mat (250×250 mm2).
3.2.3 Manufacture of composites
Unidirectional PFRP laminates (250×250 mm2, 3–3.5 mm thick) were fabricated
using the vacuum infusion technique (Fig. 3.2). For each plaque, four layers of the
reinforcement mat were used as-produced (without any preconditioning, such as
drying). The mould tool includes a transparent Perspex top, a steel picture frame (~3
mm thick) and an aluminium base (Fig. 3.2a). Resin infusion was carried out at 70-
80% vacuum (200-300 mbar absolute) at ambient temperature. The Perspex top had
central and side resin injection/evacuation ports. Preliminary tests illustrated that due
to the unidirectional fibre architecture, central injection produced non-isotropic
ovular resin flow. On the other hand, line-gate injection perpendicular to the yarn
axis generated uniform axial resin flow. Hence, the latter was the preferred method
of resin injection (Fig. 3.2b).
Two standard thermoset resins were used as matrices for composite fabrication: i)
unsaturated polyester (UP) type 420-100 (mixed with 0.25 wt% NL49P accelerator
(1% Cobalt solution) and 1 wt% Butanox M50 MEKP initiator), and ii) low-viscosity
a)
e)d)
c) b)

Mechanical properties of PFRPs: Effect of fibre/yarn and matrix type
Page | 67
Epoxy Prime 20LV (mixed with its fast hardener at a 100:26 mass ratio). For both
resin systems, post cure was carried out at 55 °C for 6 h after ambient curing for 16
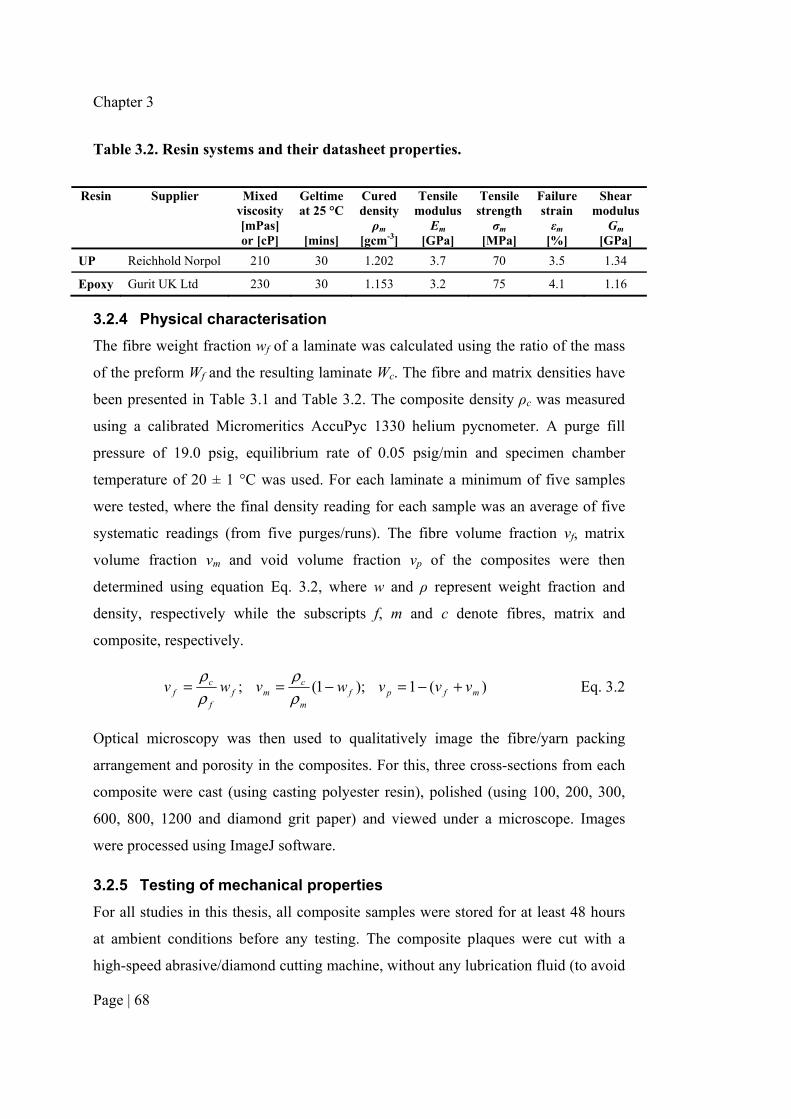
h. Table 3.2 presents datasheet properties of the cured resin systems. Note the
similarity in properties of the two thermosetting matrices. The matrix shear modulus
Gm is estimated using Eq. 3.1, assuming a matrix Poisson’s ratio νm of 0.38 [3-5].
( )m
mm
EG
ν+=
12 Eq. 3.1
Using stitched unidirectional E-glass fabric (1200 ± 32 gsm) obtained from Formax
(UK) Ltd, aligned GFRPs were similarly manufactured as reference materials.
Fig. 3.2. Composite manufacturing process: a) schematic of the mould tool, images of b) the infusion process, and c) the produced composite laminates.
b) c)
a) Injection Port (from resin pot)
Evacuation Port (to resin trap and vacuum pump)
Aluminium Base
Steel Picture Frame
O-ring
Perspex Top Plug
Fibre mats
300 mm250 mm
Chapter 3
Page | 68
Table 3.2. Resin systems and their datasheet properties.
Resin Supplier Mixed viscosity [mPas] or [cP]
Geltime at 25 °C
[mins]
Cured density ρm
[gcm-3]
Tensile modulus
Em [GPa]
Tensile strength
σm [MPa]
Failure strain εm
[%]
Shear modulus
Gm [GPa]
UP Reichhold Norpol 210 30 1.202 3.7 70 3.5 1.34
Epoxy Gurit UK Ltd 230 30 1.153 3.2 75 4.1 1.16
3.2.4 Physical characterisation
The fibre weight fraction wf of a laminate was calculated using the ratio of the mass
of the preform Wf and the resulting laminate Wc. The fibre and matrix densities have
been presented in Table 3.1 and Table 3.2. The composite density ρc was measured
using a calibrated Micromeritics AccuPyc 1330 helium pycnometer. A purge fill
pressure of 19.0 psig, equilibrium rate of 0.05 psig/min and specimen chamber
temperature of 20 ± 1 °C was used. For each laminate a minimum of five samples
were tested, where the final density reading for each sample was an average of five
systematic readings (from five purges/runs). The fibre volume fraction vf, matrix
volume fraction vm and void volume fraction vp of the composites were then
determined using equation Eq. 3.2, where w and ρ represent weight fraction and
density, respectively while the subscripts f, m and c denote fibres, matrix and
composite, respectively.
)(1);1(; mfpfm
cmf
f
cf vvvwvwv +−=−==
ρρ
ρρ
Eq. 3.2
Optical microscopy was then used to qualitatively image the fibre/yarn packing
arrangement and porosity in the composites. For this, three cross-sections from each
composite were cast (using casting polyester resin), polished (using 100, 200, 300,
600, 800, 1200 and diamond grit paper) and viewed under a microscope. Images
were processed using ImageJ software.
3.2.5 Testing of mechanical properties
For all studies in this thesis, all composite samples were stored for at least 48 hours
at ambient conditions before any testing. The composite plaques were cut with a
high-speed abrasive/diamond cutting machine, without any lubrication fluid (to avoid

Mechanical properties of PFRPs: Effect of fibre/yarn and matrix type
Page | 69
moisture intake), to produce specimens for testing. All mechanical testing was
conducted under ambient conditions (typically, 15-25 °C and 60-90% relative
humidity).
3.2.5.1 Short-beam shear test
Short-beam shear tests were carried out according to ASTM D2344, where un-
notched specimens were loaded in a three-point bending configuration at a cross-
head speed of 1 mm/min. An Instron 5969 testing machine equipped with a 2 kN
load cell was used for these tests. The width b and length l of the test specimen was
kept at 2 and 6 times the thickness t, respectively. A span-to-thickness (L0/t) ratio of
4:1 was used; the chosen L0/t ratio encourages failure of specimen through
interlaminar shear along the neutral axis, rather than inelastic deformation or flexural
failure in compression/tension on the surface. The ‘apparent’ interlaminar shear
strength τ was calculated using Eq. 3.3, where P is the maximum applied load. Six
specimens were tested for each type of composite.
bt
P
4
3=τ Eq. 3.3
3.2.5.2 Tensile test
Longitudinal tensile tests were conducted according to ISO 527-4:1997 using an
Instron 5985 testing machine equipped with a 100 kN load cell and a 50 mm
extensometer. Six 250 mm long and 15 mm wide specimens were tested for each
type of composite at a cross-head speed of 2 mm/min. ‘Specimen Protect’ was used
to ensure that the specimens weren’t damaged during gripping. The tensile modulus
Ec (in the strain range of 0.025–0.100%), ultimate tensile strength σc, and tensile
failure strain εc were measured from the stress-strain curve.
3.2.5.3 Impact test
The impact properties of the composites were determined using an Avery Denison
pendulum Charpy testing machine according to ISO 179:1997. The un-notched
specimens were loaded flat-wise with weighted hammers at a point perpendicular to
the direction of the unidirectional fabric plane. A 2.7 J hammer was used for PFRPs

Chapter 3
Page | 70
while a 15 J hammer was used for GFRPs. A striking velocity of 3.46 ms-1 was used.
Six specimens (100 mm long and 10 mm wide) were tested for each type of
composite. The impact strength (or work of fracture) was determined by dividing the
measured fracture energy with the specimen cross-sectional area.
3.3 RESULTS AND DISCUSSION
3.3.1 Manufacturing properties
3.3.1.1 Physical properties
Density and fibre volume fraction
Physical properties of the manufactured laminates are presented in Table 3.3. Matrix
type has little effect on composite density as the matrices used in this study have very
similar densities. As expected, due to the 40-50% lower density of plant fibres
compared to E-glass, PFRPs are significantly lighter (30-40%) than GFRPs.
Table 3.3. Physical properties of manufactured laminates (mean ± stdev).
Unidirectional reinforcement
Resin System
Fibre weight
fraction wf
[%]
Composite density ρc
[gcm-3]
Fibre volume fraction
vf [%]
Void volume fraction
vp [%]
Cost of composite
panel† Cc [£]
E-glass Epoxy 63.7 1.782 ± 0.009 42.6 ± 0.2 1.3 ± 0.5 1.62
J190 Epoxy 40.5 1.236 ± 0.006 34.9 ± 0.2 1.3 ± 0.5 1.47
H180 Epoxy 40.6 1.259 ± 0.009 33.4 ± 0.3 1.8 ± 0.7 2.22
F50 Epoxy 32.9 1.249 ± 0.002 26.9 ± 0.1 0.5 ± 0.2 2.45
F20 Epoxy 36.9 1.273 ± 0.004 29.9 ± 0.1 0.5 ± 0.3 2.26
E-glass UP 63.6 1.793 ± 0.035 42.8 ± 0.8 2.9 ± 1.9 0.63
J190 UP 37.1 1.226 ± 0.010 31.7 ± 0.3 4.2 ± 0.8 0.46
H180 UP 41.9 1.303 ± 0.004 35.6 ± 0.2 1.3 ± 0.4 1.09
F50 UP 33.0 1.282 ± 0.004 27.7 ± 0.1 0.9 ± 0.3 1.25
F20 UP 37.3 1.304 ± 0.008 30.9 ± 0.2 1.0 ± 0.6 1.64 †The materials cost is estimated using Cc = Wc(Cfwf + Cm(1-wf)), where the cost of the matrix Cm is taken to be 2.50 and 10.00 £/kg for polyester and epoxy, respectively. Note that the cost is ‘normalised’ for composite volume, where the volume is approximately equal at 3×250×250 mm3.

Mechanical properties of PFRPs: Effect of fibre/yarn and matrix type
Page | 71
For the composites produced (Table 3.3), the fibre volume fraction of unidirectional
GFRPs (~43%) is higher than that of PFRPs (27–36%). These findings are in
agreement with other studies in literature. Producing composites by compression
moulding, Madsen et al. [6] report that for a constant compaction pressure,
unidirectional flax yarn and E-glass composites have a fibre volume fraction of 56%
and 71%, while random flax fibre and E-glass composites have a fibre volume
fraction of 38% and 52%, respectively. Goutianos et al. [7] also find that when
employing liquid moulding processes (specifically, hand lay-up and RTM), GFRPs
produce higher fibre volume fractions than PFRPs. In essence, random fibre
composites produce lower fibre volume fractions than aligned fibre composites, and
PFRPs produce lower fibre volume fractions than GFRPs.
Madsen et al. [6] argue that fibre alignment and degree of fibre separation affect the
compact-ability of a preform. Synthetic fibre assemblies have higher packing-ability
than plant fibre assemblies [6, 8]. This is because unidirectional synthetic fibre
assemblies are made of rovings with continuous, parallel and uniform (diameter)
fibres that are well-separated, while unidirectional plant fibre assemblies are made of
yarns with discontinuous, twisted and non-uniform (diameter) fibres that are
typically in bundles/clusters. This is confirmed through optical microscopy images
(Fig. 3.3a and d).
Typically, the maximum attainable fibre volume fraction for unidirectional GFRPs is
of the order of 70-80% [4]. The upper limit for unidirectional PFRPs is in the range
of 50–60% [8]. This lower maximum attainable fibre volume fraction is a set-back
for PFRPs as composite mechanical properties generally improve with fibre volume
fraction.
It is important to note that the manufacturing technique also has a significant effect
on achievable fibre volume fractions. For instance, compression moulding or hot-
pressing would produce higher fibre volume fractions than vacuum infusion and even
RTM (as discussed in Chapter 2). This is because in compression moulding the
compaction pressure and preform mass can be adjusted to achieve a pre-desired
laminate thickness and fibre volume fraction. Commercially, PFRPs are primarily

Chapter 3
Page | 72
produced via compression moulding [2]. However, this study employs vacuum
infusion as it enables the cost-effective manufacture of large geometrically-intricate
components, such as wind turbine blades, in low volumes. As an extension to this
study, the possibilities of using vacuum-assisted RTM or prepregging for the
manufacture of higher fibre content (and lower void content) PFRPs could be
considered. For instance, Weyenberg et al. [9] and Baets et al. [10] have been able to
produce flax/epoxy composites with vf ≈ 50% using prepreg technology.
Table 3.3 also presents the deviations in the measured readings of density and fibre
volume fraction. The standard deviations for PFRPs are low (~1% of the mean
values) and comparable to GFRPs, implying that they are producible with consistent
and uniform fibre distribution. This is valuable if PFRPs are to be considered for
structural applications.
Reinforcement packing
Fig. 3.3 shows micrographs of cross-sections in a) J190, b) H180, and c) F20 yarn
PFRPs. While it is observed that on a macro-scale yarn bundles in high-twist yarn
PFRPs (J190/H180) are distributed relatively uniformly within the matrix and the
fibres in the yarn are well impregnated (Fig. 3.3a and b), on a meso-scale the fibre
distribution is distinctly heterogeneous. That is, the distribution of fibres within the
compact yarn is concentrated/clustered and there are noticeable resin-rich regions.
On the other hand, in low twist-low compaction F20 yarn preforms (Fig. 3.3c), inter-
yarn spaces are comparable to intra-yarn spaces. In fact, individual rovings are
difficult to distinguish. Hence, fibre distribution is more uniform and the fibres are
well-separated. This is similar to the distribution of fibres in unidirectional GFRPs
(Fig. 3.3d). Such homogeneity in fibre distribution would allow better distribution of
stresses/strains upon loading.

Mechanical properties of PFRPs: Effect of fibre/yarn and matrix type
Page | 73
Fig. 3.3. Microscopy images of a) J190 and b) H180 epoxy composites showing the large difference in inter-yarn and intra-yarn spacing and inhomogeneous fibre distribution compared to c) F20 and d) E-glass epoxy composites. Also notice the constant diameter of E-glass, but non-uniform cross-sectional shape and width of plant fibres.
Porosity
The void content of aligned PFRPs is found to be in the range of 0.5-2%, with the
exception of J190/polyester, which has a higher void content of 4.2%. Nonetheless,
the void content of PFRPs is comparable to that of GFRPs (1-3%). Typically, void
contents of <1% are required for aerospace applications, but void contents of up to
5% are acceptable for other less demanding applications (e.g. automotive and
marine) [11-13].
In literature [8, 14, 15], PFRPs are often quoted to have high void content. Typically,
the void volume fraction is up to 5% for PFRPs with a fibre volume fraction below
40% [8, 16-20]. However, when the fibre volume fraction exceeds 40%, void content
increases drastically and can even approach 20% [8, 17-19, 21]. Nonetheless, there
are some studies [16, 22] which conclude that there is no obvious relationship
between PFRP fibre volume fraction and void volume fraction. From the literature

Chapter 3
Page | 74
survey, it is suggested that issues of high porosity in PFRPs are usually related, but
not confined, to i) sisal fibre composites due to the large lumen size in sisal fibres
which remain unfilled after resin infusion [20, 21], ii) structural porosity in
(particularly, high weight fraction) compression-moulded thermoplastic PFRPs due
to insufficient amount of matrix to fill the free space between the yarns [8], and iii)
randomly-oriented short-fibre PFRPs. In this work, comparatively lower void
contents have been observed which is in agreement with other studies that use
thermoset resins in a vacuum infusion process [20]. Perhaps, the low viscosity of
thermoset resins (Table 3.2) allows better impregnation of plant fibre assemblies. In
fact, Madsen et al. [6] show that porosity in hemp yarn reinforced thermoplastics
increases linearly (R2 = 0.98) with the logarithm of the matrix processing viscosity.
As the viscosity of thermosets is several orders of magnitude lower than that of
thermoplastics, the lower void content in thermoset-based PFRPs is understandable.
This study uses yarns as a form of continuous reinforcement with controlled
orientation. It is has been suggested that the twisted nature of such yarns leads to a
tightened/compact structure (as observed in Fig. 3.3a), which may cause reduced
permeability, hindered impregnation, and thus void formation [16, 23].
Consequently, increasing yarn twist is likely to worsen these issues. However, in
their experimental study, Zhang et al. [16] found no correlation between composite
porosity and yarn structure. Even at different fibre volume fractions, the porosity
content in PFRPs composing ring-spun yarns (surface twist angle of 30°) and
commingled natural fibre/polypropylene yarns (surface twist angle of 0°) was similar
and in the range of 1.4 to 5.2%. Indeed, in this study, the void content of yarn
reinforced PFRPs is found to be low as well (0.5-4.2%).
While there may not be an obvious relationship between yarn structure and void
content, the yarn structure may dictate the type of voids that form, particularly due to
its effects on reinforcement packing and resin-flow dynamics. Madsen et al. [8] have
described three categories of porosity in PFRPs: i) fibre-related porosity, ii) matrix-
related porosity (characteristic of liquid moulding processes), and iii) structural
porosity (characteristic of thermoplastic moulding processes). Fibre-related porosity
can be broken down into further sub-components: a) luminal porosity (in the fibre

Mechanical properties of PFRPs: Effect of fibre/yarn and matrix type
Page | 75
lumen), b) interface porosity (at the fibre/matrix interface) and c) impregnation
porosity (between fibre bundles).
In this study, qualitative analysis suggests that fibre porosity related to unfilled
luminal cavities in fibres make a larger contribution to the total porosity in jute
composites, compared to hemp and flax composites (Fig. 3.4). This observation is in
agreement with the literature [1, 8]. Noting that the typical diameter of jute fibres is
almost double that of flax/hemp [1, 24, 25], the size of the luminal cavity in
flax/hemp and jute fibres is typically 2-11% [1, 6, 8, 26] and 10-14% [1, 8, 27] of
their cross-sectional area. However, it is arguable that luminal porosities may not be
detrimental to the performance of PFRPs as they do not encourage stress
concentration or fibre debonding [8]. In contrast, Baley et al. [28] find that the lumen
encourages crack initiation, when a unidirectional PFRP is loaded in the transverse
direction.
Fig. 3.4. Luminal spaces in fibres of jute (left) are larger than that in flax (right).
Microscopy of composite cross-sections also shows that porosity in high-twist yarn
J190/H180 composites is primarily associated with impregnation porosity (Fig. 3.5a).
Impregnation porosity is due to inadequate or poor matrix impregnation of the yarns
[8] and in this case may be a result of high compaction of fibres and low permeability
within the yarn. On the other hand, low-twist yarn F50/F20 composites are not
susceptible to impregnation porosity due to the low compaction of fibre within the
yarn/roving and thus a yarn permeability that is comparable to the preform
permeability. Rather, low-twist yarn composites are primarily affected by interface

Chapter 3
Page | 76
porosity (Fig. 3.5b). Although this is suggestive of poorer fibre/matrix compatibility
in low-twist yarn PFRPs, this is not true because both low- and high-twist yarn
PFRPs compose of hydrophilic plant fibres and hydrophobic matrices. A possible
explanation is that high-twist yarns, particularly jute, are observed to consist of large
fibre sub-assemblies (fibre bundles) within yarns (Fig. 3.3 and Fig. 3.5) while low-
twist yarns, particularly flax, are more defibrillated into single fibres due to low
compaction (Fig. 3.3 and Fig. 3.5). This means that in low-twist yarn PFRPs, the
matrix needs to wet-out a relatively larger surface area of small fibre bundles (if not
single fibres) as compared to smaller surface area of large fibre bundles.
Fig. 3.5. Microscopy images of J190 (left) and F20 (right) epoxy composites. High-twist yarn J190 composites have impregnation-related porosities while low twist yarn F20 composites have interface-related porosities (indicated by arrows). High-twist yarns (particularly jute) consist of large fibre bundles, while fibres in low-twist yarns (particularly flax) are well-separated.
3.3.1.2 Materials cost
Table 3.3 presents the materials cost for each type of composite. It is clearly
observed that i) epoxy composites are more expensive than polyester composites due
to the significantly higher cost of epoxy matrix, and ii) PFRPs are more expensive
than GFRPs. While raw plant fibres are cost-competitive to E-glass, plant fibre
yarns/rovings (particularly from temperate fibres) are not cost-viable substitutes to E-
glass for composite reinforcement. As cost is often a critical design criterion for
industrial applications, employing such yarns for commercial PFRP applications is
not foreseeable in the short-term future, unless plant yarn reinforcements become
significantly cheaper.

Mechanical properties of PFRPs: Effect of fibre/yarn and matrix type
Page | 77
3.3.2 Mechanical properties
3.3.2.1 Apparent interlaminar shear strength
Results from short-beam shear tests are presented in Fig. 3.6. Note that the
determined results are not absolute values, but purely for relative comparison. The
‘apparent’ interlaminar shear strength τ is a measure of the strength of the matrix plus
the interface. From Fig. 3.6, it is observed that epoxy composites display higher
interlaminar shear strength compared to polyester composites. This is possibly
because epoxy has a marginally higher estimated matrix shear strength (using Tresca
criteria, τm = σm/2) than polyester. In addition, the better adhesive properties of epoxy
may make it more compatible with hydrophilic plant fibres and thus provide a
stronger interface. This is in agreement with the results from impact tests and tensile
tests (discussed in later sections).
0
5
10
15
20
25
30
35
40
45
50
E-glass J190 H180 F50 F20
Inte
rlam
inar
she
ar s
tren
gth
[MPa
] UP Epoxy
Fig. 3.6. Interlaminar shear strength of composites. Error bars denote 1 standard deviation.
It is observed that aligned GFRPs have 20-30% higher interlaminar shear strengths
(40-42 MPa) than aligned PFRPs (ranging from 27-36 MPa). The study by Goutianos
et al. [7] is in agreement with this finding. The higher interlaminar shear strength of
GFRPs is a sign of better fibre/matrix adhesion. This is expected as i) synthetic fibres
are often surface-treated after manufacture in order to improve the interfacial bond,
ii) plant fibres are highly polar and form a weak interface with typically non-polar

Chapter 3
Page | 78
matrices, and iii) unlike plant fibres whose surface energy is similar to that of the
matrix, the surface energy of E-glass is significantly higher than that of the matrix
facilitating good wet-out.
Amongst PFRPs, high-twist J190 yarn composites exhibit best interfacial properties
while low-twist F20 composites display lowest properties. This is possibly due to the
high content of interface-related porosities in F20 composites (as discussed in
Section 3.3.1.1.3). It is also possible that the yarn construction (specifically, twist
level) affects the composite interlaminar shear strength. Naik et al. [29] show that
twisted resin-impregnated yarns show higher shear strength than straight
impregnated yarns due to higher transverse pressure in twisted yarns. However, more
investigations are necessary to elucidate the differences in the governing mechanisms
of (shear) stress development in a single impregnated yarn compared to a yarn
reinforced laminate.
Critical fibre length
The critical fibre length lc and fibre aspect ratio lf/df are important parameters that
dictate mechanical properties of a composite. In particular, they define the fibre
length efficiency factor; that is, the ability of the fibre to transfer strength and
stiffness to the composite. Sub-critical length fibres (lf < lc) will not carry the
maximum possible load. To efficiently utilise the fibre properties, either the critical
fibre length lc should be decreased below the fibre length lf (by improving interfacial
properties), or the reinforcing fibre length lf (and thus aspect ratio) should be
increased much above the critical fibre length lc.
The critical fibre length lc is defined by Eq. 3.4, where σf is the fibre tensile strength
(at the critical fibre length), df is the fibre diameter, and τ is the interfacial strength.
The estimated critical fibre length lc for all the composites produced in this study is
presented in Table 3.4. As inputs in Eq. 3.4, typical fibre strength σf and diameter df
have been used from various sources.
τσ
2ff
c
dl = Eq. 3.4

Table 3.4. Estimating the critical fibre length and fibre length efficiency factors for composite stiffness and strength.
Unidirectional reinforcement
Resin System
Fibre stiffness
Ef
[MPa]
Fibre strengthσf
[MPa]
Fibre diameter
df
[μm]
Gauge length
l [mm]
Source of single fibre
properties
Typical fibre
aspect ratio† lf/df
Critical fibre
length lc
[mm]
Length efficiency
for stiffness
ηlE
Length efficiency
for strength
ηlS E-glass Epoxy 78.5 1956 13.8 50 [30] >3000 0.320 0.999 0.996
J190 Epoxy 32.5 558 53.9 6 [25] 100 0.421 0.976 0.961
H180 Epoxy 24.7 636 27.6 8 [31] 900 0.283 0.998 0.994
F50 Epoxy 56.0 1099 17.5 10 [32] 1750 0.278 0.998 0.995
F20 Epoxy 56.0 1099 17.5 10 [32] 1750 0.323 0.998 0.995
E-glass UP 78.5 1956 13.8 50 [30] >3000 0.335 0.999 0.996
J190 UP 32.5 558 53.9 6 [25] 100 0.515 0.977 0.952
H180 UP 24.7 636 27.6 8 [31] 900 0.314 0.998 0.994
F50 UP 56.0 1099 17.5 10 [32] 1750 0.321 0.998 0.995
F20 UP 56.0 1099 17.5 10 [32] 1750 0.352 0.998 0.994 † Typical fibre aspect ratios are from [1, 6].

Chapter 3
Page | 80
The critical fibre length lc for epoxy composites is lower than that for polyester
composites. Furthermore, the critical fibre length lc for PFRPs is found to be in the
range of 0.28-0.52 mm, which is comparable to that of GFRPs (0.32-0.34 mm). The
estimated lc for GFRPs is in agreement with values typically quoted in literature [4].
While there are some studies that determine lc for PFRPs to be >2 mm [33-36], other
studies report a smaller critical length lc, similar to values found in this study, of 0.4-
0.9 mm [33, 35, 37-39].
While plant fibres are naturally discontinuous, fibres employed in the production of
yarns/rovings have lengths >25 mm [35, 40, 41]. Hence, in this study, the plant fibre
reinforcements have high aspect ratios and are much longer than the critical length.
Fibre length efficiency factor
It is common for scientists working on plant fibre composites to assume that length
efficiency factors are unity, when back-calculating fibre properties or predicting
composites properties (for instance, [9, 10, 17, 21, 42]). However, it is important to
assess if this claim is valid. The calculated critical fibre lengths lc and typical values
of fibre aspect ratio (length/diameter) lf/df can be used to determine the length
efficiency of the reinforcements. Cox’s shear lag model [43] can be used for the
calculation of the fibre length efficiency factor for stiffness ηlE, assuming iso-strain
conditions, axial loading of fibres and elastic stress transfer between fibre and matrix.
ηlE is given by Eq. 3.5, where Gm is the shear stiffness of the matrix, Ef is the stiffness
of the fibre, and vf,max,FRP is the maximum achievable fibre volume fraction.
Assuming square packing arrangement of continuous and parallel fibres, vf,max,FRP of
π/4 (=78.5%) can be used. For the calculation of the fibre length efficiency factor for
strength ηlS, Kelly-Tyson’s model [44] can be used (Eq. 3.6), with lf > lc.
( )fFRPff
m
f
ff
f
f
lEvvE
G
d
ll
l
l
/ln
2
2,
2
2tanh
1max,,
=
−=β
β
β
η Eq. 3.5
≤
≥−=
cfcf
cffc
lS llforll
llforll
2/
2/1η Eq. 3.6

Mechanical properties of PFRPs: Effect of fibre/yarn and matrix type
Page | 81
The calculated fibre length efficiency factors for stiffness and strength are found to
be very close to unity for all the composites (Table 3.4). This is expected as high
aspect ratio fibres (lf/df > 100) are being used and the critical fibre length is very
small (lf/lc > 50000). Madsen et al. [14] show that fibre aspect ratios of lf/df > 50
would yield ηlE > 0.93 for plant fibre composites, and further increase in aspect ratio
would asymptotically increase ηlE towards unity. Sawpan et al. [38] also determine
ηlS to be 0.96 for their short-fibre (l ≈ 2-3 mm) hemp/polyester composites. These
results confirm that like E-glass, plant fibres, particularly in the form of yarns, can
deliver high length efficiency factors and thus, good load-transferring capabilities.
Therefore, ηlE = ηlS = 1 is used for analysis in this thesis.
3.3.2.2 Tensile properties
The measured tensile properties of the composites are presented in Table 3.5. It is
encouraging to note that although mechanical properties of single plant fibres are
known to have high variability, at a composite scale, the tensile properties of PFRPs
are consistent and with a small coefficient of variation of up to 6%, which is similar
to that of GFRPs.
From the composite properties, the tensile stiffness Ef and strength σf of the
reinforcing fibres has been ‘back-calculated’ using the rule of mixtures (Eq. 3.7, Eq.
3.8). The back-calculated fibre properties are useful in evaluating the reinforcing
potential of plant fibres and comparing the tensile performance of the various
composites at the same fibre volume fraction (vf = 100%). In light of the results from
Section 3.3.2.1, the fibre length efficiency factors (ηlE and ηlS) have been taken to be
unity. As in other studies [9, 10, 17, 42], the fibre orientation efficiency factor ηo is
assumed to be unity for yarn reinforced unidirectional PFRPs and unidirectional
GFRPs. In Eq. 3.8, σ’m is the matrix stress at fibre failure strain εf. Assuming iso-
strain conditions, the fibre failure strain εf is equal to the composite failure strain εc.
σ’m is then estimated using Hooke’s law to be σ’m = Emεc [9].
folE
mmcf v
EvEE
ηη−
= Eq. 3.7

Chapter 3
Page | 82
folS
mmcf v
v
ηησσσ '−
= Eq. 3.8
Table 3.5. Tensile properties of manufactured composite laminates (measured; mean ± stdev) and fibres (back-calculated; mean).
Unidirectional reinforcement
Resin System
Fibre volume fraction
vf [%]
Composite tensile
modulus Ec
[GPa]
Fibre tensile
modulus Ef
[GPa]
Composite tensile
strength σc
[MPa]
Fibre tensile
strength σf
[MPa]
Composite failure strain εc
[%] E-glass Epoxy 42.6 ± 0.2 34.0 ± 2.1 75.6 705.7 ± 34.0 1603.7 1.3 ± 0.4
J190 Epoxy 34.9 ± 0.2 15.0 ± 1.4 37.0 185.8 ± 16.2 441.1 1.6 ± 0.0
H180 Epoxy 33.4 ± 0.3 19.0 ± 1.1 50.7 195.1 ± 8.9 477.3 1.7 ± 0.1
F50 Epoxy 26.9 ± 0.1 14.2 ± 0.3 44.3 163.5 ± 3.0 449.6 1.8 ± 0.1
F20 Epoxy 29.9 ± 0.1 24.6 ± 0.4 75.1 281.4 ± 3.8 809.6 1.8 ± 0.1
E-glass UP 42.8 ± 0.8 36.9 ± 1.4 81.6 825.7 ± 49.1 1843.0 1.9 ± 0.9
J190 UP 31.7 ± 0.3 16.1 ± 0.8 43.4 175.1 ± 10.3 442.4 1.5 ± 0.2
H180 UP 35.6 ± 0.2 17.0 ± 0.5 41.2 171.3 ± 6.5 368.8 1.7 ± 0.1
F50 UP 27.7 ± 0.1 15.6 ± 0.9 47.0 143.0 ± 6.8 368.2 1.6 ± 0.0
F20 UP 30.9 ± 0.2 23.4 ± 0.3 67.6 277.4 ± 8.2 760.5 1.7 ± 0.3
Effect of matrix type
There is some disagreement on the effect of matrix type on PFRP tensile
performance in literature. Joffe et al. [45] find that while the difference in tensile
properties of thermoset matrices (polyester, epoxy and vinylester) is large, the
resulting randomly-oriented short-fibre flax composites have fairly indistinguishable
tensile properties. They suggest that the fibre/matrix interface, and thus load transfer
mechanisms and reinforcement efficiency, differ for different fibre/matrix
combinations. On the other hand, Madsen et al. [17] observe that the noticeable
difference in tensile properties of unidirectional hemp yarn reinforced thermoplastics
can be correlated to the matrix type (PE, PP, PET). Madsen et al. [17] also report that
the potential difference in fibre/matrix bonding, due to employing a different matrix,
does not result in a visible effect on composite tensile properties or back-calculated
fibre properties. Part of the discrepancy can be explained by the fact that compared to
random composites, the fibres in unidirectional composites bear a much larger

Mechanical properties of PFRPs: Effect of fibre/yarn and matrix type
Page | 83
fraction of the load, and hence interfacial properties would have little effect on
longitudinal tensile properties [4].
In this study, there is no clear dependence of composite tensile performance on
matrix type (Table 3.5), particularly due to the similar tensile properties of the
thermoset matrices (Table 3.2). Comparing the back-calculated fibre tensile
properties, it is observed that while E-glass and J190 reinforcements perform up to
15% better in a polyester matrix, H180, F50 and F20 reinforcements perform up to
20% better in an epoxy matrix. This implies that the reinforcing efficiency of the
fibres and perhaps the fibre/matrix interfaces differ for the different matrices. It has
been previously shown (Fig. 3.6) that all epoxy composites have higher ‘apparent’
interlaminar shear strength and thus presumably better fibre/matrix adhesion,
compared to polyester composites. Hence, epoxy composites should display better
longitudinal tensile properties. This, however, is not observed in the presented tensile
test results.
Fig. 3.7. Tensile fracture surface of a) epoxy- and b) polyester-based PFRPs.
Notably, the failure characteristics are different for epoxy- and polyester-based
PFRPs (Fig. 3.7), which possibly relate to the difference in fibre/matrix interface
properties [6]. It has been previously shown that the ‘apparent’ interlaminar shear
strength of epoxy composites is better than that of polyester composites. Tensile
a) b)
J190 H180 F50 F20 J190 H180 F50 F20

Chapter 3
Page | 84
fracture specimens of epoxy composites display a fairly flat brittle fracture surface
with little fibre pull-out resulting from matrix crack growth transverse to the fibre
direction. On the other hand, fracture specimens of polyester composites display a
more serrated failure surface with extensive fibre pull-out, and even delamination
and longitudinal splitting, resulting from shear-induced micro-crack growth along the
weaker fibre/matrix interface (that is, along the fibre axis) followed by macro-crack
propagation through the micro-voids.
Effect of reinforcement type
Comparison of PFRPs with GFRPs
Comparing the effect of reinforcement type on tensile properties (keeping in mind
the differences in fibre volume fractions), it is found that unidirectional GFRPs
outperform unidirectional PFRPs in terms of tensile strength and stiffness (Table
3.5). E-glass composites are observed to have a tensile strength and stiffness of about
700-825 MPa and 34-37 GPa, respectively. This is considerably higher than the
tensile strength and stiffness of PFRPs, which ranges between 140-285 MPa and 14-
25 GPa, respectively. Notably, PFRPs and GFRPs have a similar tensile failure
strain. It is worth pointing out that the better mechanical properties of unidirectional
GFRPs (in comparison to unidirectional PFRPs) is not only due to the superior
mechanical properties of the reinforcing E-glass fibres (in comparison to plant
fibres), but also due to critical structural differences in the reinforcements. While
aligned GFRPs employ continuous fibres that are almost perfectly aligned/parallel,
aligned PFRPs employ yarns/rovings that have discontinuous fibres that are twisted.
An advantage of plant fibres over E-glass fibres for reinforcements is their 40-50%
lower density. Hence, the specific properties of the composites are of interest;
particularly as specific tensile modulus Ec/ρc and strength σc/ρc are often used as
material selection criteria for components loaded in pure tension [46]. Fig. 3.8 plots
the specific tensile properties of epoxy-based PFRPs relative to E-glass/epoxy
composites. It is clearly observed that the density of PFRPs is about 40% lower than
that of GFRPs. In addition, the specific tensile modulus Ec/ρc of J190, H180 and F50
composites is 60-80% that of unidirectional GFRPs, whereas F20 composites have a

Mechanical properties of PFRPs: Effect of fibre/yarn and matrix type
Page | 85
specific tensile modulus that is similar to unidirectional GFRPs. Similarly, while the
specific tensile strength σc/ρc of J190, H180 and F50 composites is ~40% that of
unidirectional GFRPs, F20 composites have a specific tensile strength that is ~60%
that of unidirectional GFRPs. Note that increasing the fibre volume fractions of the
PFRPs would improve the specific tensile performance of PFRPs further.
Nonetheless, the findings suggest that while high-quality unidirectional PFRPs may
offer comparable specific stiffness performance to unidirectional GFRPs, the specific
strength performance of PFRPs is poor.
0.00
0.20
0.40
0.60
0.80
1.00
1.20
1.40
1.60
1.801/ρ
Spec. UTSc
Spec. UTSf
Spec. Ec
Spec. Ef
E-glass (UD) J190 H180 F50 F20
Fig. 3.8. Specific tensile properties of epoxy composites (measured) and fibres (back-calculated) relative to E-glass composite properties.
Back-calculated fibre properties have also been determined (Table 3.5). E-glass is
estimated to have a tensile stiffness and strength in the range of 76-82 GPa and 1600-
1850 MPa, respectively. This in agreement with typically reported literature values
[1, 4, 30]. The results show that J190, H180 and F50 reinforcements have a tensile
stiffness and strength in the range of 35-50 GPa and 360-480 MPa, respectively. This
1/ρc
σc/ρc
σf/ρf
Ef/ρf
Ec/ρc
Chapter 3
Page | 86
is much lower than that of E-glass, but in the range of typically reported literature
values [1]. Impressively, F20 flax reinforcements have a tensile stiffness which is
comparable to that of E-glass at 67-75 MPa, and a tensile strength half that of E-glass
at about 800 MPa. This is indeed a revelation and proof that flax has the reinforcing
potential to replace E-glass in stiffness-critical structural applications.
Using the back-calculated fibre properties, specific tensile properties of plant fibres,
relative to E-glass, are presented in Fig. 3.8. It is clearly observed that the specific
stiffness performance of single plant fibres Ef/ρf is comparable to or even
significantly outperforms that of E-glass, while the specific strength of plant fibres
can range from 50-90% of E-glass. These findings confirm that at the same fibre
volume fraction, plant fibres can provide a light and stiff alternative to E-glass
reinforcements.
Effect of plant yarn reinforcement
All PFRPs have very similar tensile failure strain. In terms of tensile stiffness and
strength, F20 composites clearly outperform the other PFRPs (Table 3.5).
Comparatively, J190 and H180 composites have similar tensile properties, while F50
composites have the poorest tensile properties. While F20 composites have a tensile
stiffness and strength of 23-25 GPa and 275-285 MPa, the other PFRPs have lower
tensile stiffness and strength of 14-19 GPa and 140-200 MPa, respectively.
The dissimilarity in mechanical properties of the PFRPs may be a result of several
factors. Firstly, the plant fibre type will affect the composite properties. Although
plant fibre properties are subject to significant natural variation, typically, flax fibres
have better mechanical properties than jute and hemp fibres (Table 3.6). As jute and
hemp have better or similar cellulose content, cellulose crystallinity, degree of
polymerisation (DP) and microfibril angle (MFA) in comparison to flax (Table 3.6),
perhaps the significantly higher fibre aspect ratio of flax results in a higher fibre
tensile strength. McLaughlin et al. [47] and Mukherjee et al. [48] have demonstrated
the strong correlation between the structure (cellulose content, MFA and aspect ratio)
and tensile properties (strength, modulus and failure strain) of plant fibres. Secondly,
fibre/yarn quality will have an inevitable effect on composite properties. For instance,

Mechanical properties of PFRPs: Effect of fibre/yarn and matrix type
Page | 87
although both F20 and F50 composites have similar volumetric composition and are
made from low-twist flax rovings/yarns, there is a 40% difference in their tensile
strength. Madsen et al. [49, 50] and Baets et al. [10] have shown that an increasing
number of defects and an increasing number of processing steps can reduce
fibre/yarn quality and thus composite properties. Thirdly, reinforcement construction
will have an effect on the properties of the resulting composite. For instance, the
hampered performance of F50 composites may be due to the inclusion of polyester as
a filament binder in F50 yarn. It is also suggested that increasing yarn twist reduces
composite mechanical properties like an off-axis laminate [23]. (This is studied in
more detail in Chapter 5.) The F20 flax rovings have a significantly lower twist level
than J190/H180 yarns, and thus F20 composites would bear minimal effects of
reinforcement misorientation. As the yarn construction of J190 and H180 is similar
(Table 3.1), and the mechanical properties of jute and hemp fibres are similar (Table
3.6), the comparable mechanical properties of J190 and H180 composites are likely.
Table 3.6. Structural and mechanical properties of bast fibres [1, 6, 51].
Fibre type
Cellulose content
Cellulose crystallinity
DP*
MFA† Aspect ratio
Tensile modulus
Tensile strength
Failure strain
[%] [%] [°] [GPa] [MPa] [%] Flax 64–71 50-70 2420 5–10 1750 30–70 400–1100 2.7–3.2 Hemp 70–74 50-70 2300 2–6 900 30–60 300–800 1.3–2.7 Jute 61–72 50-70 1920 8 100 20–55 200–600 1.4–3.1
*DP = degree of polymerization †MFA = microfibril angle
The estimated fibre properties (Table 3.5) are found to be in the range of literature
values (Table 3.6). While fibres from J190, H180 and F50 yarns have a tensile
stiffness and strength in the range of 35-50 GPa and 360-480 MPa, respectively, F20
reinforcements have a tensile stiffness of 65-75 MPa and a tensile strength of about
800 MPa. It is noteworthy that such high mechanical properties of the plant fibres,
particularly F20 flax fibres, have been transferred to the composites without any
active fibre surface treatment.

Chapter 3
Page | 88
A literature survey of tensile properties of unidirectional bast fibre reinforced
composites is presented in Table 3.7. The measured tensile properties of aligned
PFRPs obtained in this study are generally comparable with the results reported in
literature. However, some flax composites are observed to have much higher tensile
properties than those observed in this study. For instance, Baets et al. [10] report a
tensile strength and stiffness of 378 MPa and 39.9 GPa for unidirectional flax/epoxy
composites (vf = 42%). They employed minimally-processed (i.e. low defect count)
hackled flax. Oksman et al. [52] also produce flax/epoxy composites (vf = 42%) with
high strength and stiffness of 280 MPa and 35 GPa. They used flax fibres that were
extracted in a biotechnical retting process using enzymes and microbial cultures. The
extraction process is more environmentally friendly than traditional retting processes
and produces fibres that are of uniform quality and more suitable for composites
applications. Both studies employed slivers, as a more aligned reinforcement than a
roving or a yarn, at high fibre content. In addition, no fibre surface modification
techniques, to enhance interfacial properties, were employed in either study.
The back-calculated fibre properties presented in literature (Table 3.7) are also
comparable to those obtained in this study (Table 3.5). It is of interest to note that
while jute and hemp reinforcements have a tensile stiffness in the range of 30-55
GPa, flax reinforcements consistently deliver higher stiffness; usually in excess of 60
GPa, and up to 90 GPa. Furthermore, flax fibres offer higher reinforcement strength
in the composite. Indeed, in this study, F20 flax reinforcements have an impressive
back-calculated fibre stiffness and strength of up to 75 GPa and 800 MPa,
respectively.
Hence, it is proposed that using minimally-processed flax slivers (or rovings),
processed specifically for composites applications rather than textile applications, as
reinforcements in an epoxy matrix is a good starting point for producing high-quality
PFRPs. Furthermore, employing prepregging technology for composite manufacture
would enable the production of high fibre content and thus high-performance PFRPs.
In addition, plant fibre surface treatment is not entirely necessary to achieve high
PFRP mechanical properties.

Table 3.7. Tensile properties of unidirectional (long bast fibre reinforced) PFRPs reported in literature.
Unidirectional composite
Manufacturing technique
Fibre volume fraction
vf
[%]
Tensile modulus
Ec
[GPa]
Fibre tensile
modulus†
Ef
[GPa]
Tensile strengthσc
[MPa]
Fibre tensile
strength†
σf
[MPa] Source
Jute yarn/epoxy Filament winding * 40 15 32 155 - [53]
Jute sliver/polyester Compression moulding 32 20 56 170 442 [22]
Hemp yarn/PET Compression moulding 34 18 51 205 538 [17]
Flax yarn/epoxy Prepregging 50 32 61 315 600 [10]
Flax roving/epoxy Prepregging 48 37 73 377 751 [10]
Flax sliver/epoxy Prepregging 42 40 90 378 860 [10]
Flax sliver/epoxy Prepregging 48 32 63 268 505 [9]
Flax sliver/epoxy RTM 42 35 79 280 710 [52]
Flax sliver/polyester Compression moulding 35 14 37 210 496 [54]
Flax yarn/vinylester RTM 37 24 60 248 - [7] † The fibre properties have been ‘back-calculated’ by the authors of the respective articles. * Typically, samples are compression/press moulded after filament winding.

Chapter 3
Page | 90
3.3.2.3 Impact properties
Impact energy is typically dissipated by fibre and/or matrix fracture, debonding and
fibre pull-out. Fibre pull-out dissipates more energy than fibre fracture [55].
Importantly, the former indicates weak interfacial properties, while the latter
indicates good fibre/matrix adhesion [55]. The impact strength of the composite
laminates is presented in Fig. 3.9. Noticeably, epoxy composites exhibit 10-30%
lower impact strength than polyester composites. As improved fibre/matrix adhesion
is known to affect impact strength adversely [55], this indicates that plant fibres are
more compatible with epoxy than polyester. This is consistent with the fracture
surfaces of impact-tested specimens, where epoxy composites exhibit considerably
less fibre pull-out than polyester composites, and the fact that the former display
higher ‘apparent’ interlaminar shear strength (Fig. 3.6).
0
50
100
150
200
250
300
350
400
E-glass J190 H180 F50 F20
Impa
ct S
tren
gth
[kJ/
m2 ]
UP Epoxy
Fig. 3.9. Impact strength of PFRPs compared to E-glass composites.
The impact properties of PFRPs compare poorly to GFRPs, even when compared in
terms of specific impact strength. Where unidirectional GFRPs have impact strengths
of 300-350 kJ/m2, unidirectional PFRPs have 5 to 10 times lower impact strengths of
30-60 kJ/m2. Typically, short random PFRPs have impact strengths in the range of
10-25 kJ/m2 [20, 55].
It is generally accepted that the toughness of a composite is mainly dependent on the
fibre stress-strain behaviour, as well as the interfacial bond strength [55, 56]. E-glass

Mechanical properties of PFRPs: Effect of fibre/yarn and matrix type
Page | 91
fibres are stronger than bast fibres with similar failure strain, and hence they may
impart high work to fracture on the composites. In addition, while E-glass fibres are
isotropic due to a 3-dimensional network of SiO2, plant fibres are anisotropic with
oriented cellulose microfibrils. Furthermore, synthetic E-glass has uniform
properties, while natural fibres have non-uniform properties, particularly due to the
presence of various defects (such as kinks). These are the prime reasons for the
poorer impact properties of PFRPs [56-58].
Amongst PFRPs, F20 composites have best impact properties. It is interesting to note
that impact strength of PFRPs reduces with increasing yarn twist level (Fig. 3.9). It is
proposed that yarn construction and composite porosity are key factors in PFRP
impact properties. High-twist yarn PFRPs have large intra-yarn voids, which can act
as stress-raisers and likely sites for crack propagation. Furthermore, fibres are well-
separated (‘defibrillated’) in low-twist yarn PFRPs, particularly flax F20, while fibre
distribution is inhomogeneous in high-twist yarn PFRPs, resulting in resin rich zones
(Fig. 3.3). Essentially, the crack path is likely to be more complex in low-twist yarn
PFRPs, resulting in a higher work to fracture.
The inferior impact properties of PFRPs can be used as indicators of possible
applications. Alternatively, the impact properties can be improved by i) using hybrid
reinforcements (e.g. flax/E-glass or flax/coir) [57, 59], or ii) employing alternate
textile architectures (e.g. mutliaxial non-wovens/wovens) and ply stacking sequence
[4, 59]. In a hybrid reinforcement, fibres with good impact resistance (such as, E-
glass or plant fibre with high microfibril angles such as coir and sisal) can be
combined with bast fibres to produce improved impact properties ([57, 59] and
references therein).
3.4 CONCLUSIONS
This study on the mechanical properties of aligned plant yarn reinforced thermoset
composites has several key conclusions. Plant fibre reinforcements in the forms of
yarns/rovings offer high length efficiency factors to the resulting composite due to
low critical fibre lengths and high fibre aspect ratios. The manufactured PFRPs are
well-impregnated and have low void content and consistent mechanical properties.

Chapter 3
Page | 92
Considering the effect of thermoset matrix type, it is found that epoxies form a
stronger interface with plant fibres than polyesters do. However, the effects of matrix
type on longitudinal tensile properties of yarn reinforced PFRPs are inconclusive.
PFRPs consistently have lower fibre volume fractions than GFRPs, due to the low
packing-ability of plant fibre preforms. Apart from the expected (30-40%) lower
density of PFRPs, they have 20-30% lower interlaminar shear strength, 5-10 times
lower impact strength, 60-80% lower tensile strength and 30-60% lower tensile
stiffness than GFRPs. Hence, GFRPs clearly outperform PFRPs in terms of absolute
mechanical properties. However, PFRPs have comparable specific stiffness
performance to GFRPs.
Amongst the various yarn reinforced PFRPs studied, composites reinforced with flax
rovings exhibit exceptional properties, with a back-calculated fibre tensile modulus
in the range of 65-75 GPa (comparable to that of E-glass) and fibre tensile strength of
about 800 MPa (half that of E-glass). These properties are achieved without using
any active fibre surface treatment. Not only the fibre type, but yarn construction
(twist level and packing fraction) and fibre/yarn quality are also found to have a
significant impact on the mechanical properties of the resulting composite.
It is proposed that using minimally-processed flax rovings/slivers, processed
specifically for composites rather than textile applications, as reinforcements in an
epoxy matrix is a good starting point for producing high-quality PFRPs.
Furthermore, fibre surface modification, for improved fibre/matrix adhesion, is not
thought to be compulsory in achieving high mechanical properties.
3.5 REFERENCES
1. Lewin M. Handbook of fiber chemistry. Third ed, 2007. Boca Raton: CRC Press LLC.
2. Carus M. Bio-composites: Technologies, applications and markets, in 4th International Conference on Sustainable Materials, Polymers and Composites. 6-7 July 2011. Birmingham, UK.
3. Aly M, Goda IGM, Hassan GA. Experimental investigation of the dynamic characteristics of laminated composite beams. International Journal of Mechanical & Mechatronics, 2011, 10(3): p. 59-68.
4. Harris B. Engineering composite materials, 1999. London: The Institute of Materials.

Mechanical properties of PFRPs: Effect of fibre/yarn and matrix type
Page | 93
5. Cichocki JF, Thomason JL. Thermoelastic anisotropy of a natural fiber. Composites Science and Technology, 2002, 62: p. 669-678.
6. Madsen B. Properties of plant fibre yarn polymer composites - An experimental study. PhD, 2004. Technical University of Denmark: Lyngby, Denmark.
7. Goutianos S, Peijs T, Nystrom B, Skrifvars M. Development of flax fibre based textile reinforcements for composite applications. Applied Composite Materials, 2006, 13(4): p. 199-215.
8. Madsen B, Thygesen A, Lilholt H. Plant fibre composites - Porosity and volumetric interaction. Composites Science and Technology, 2007, 67: p. 1584-1600.
9. Weyenberg I, Chitruong T, Vangrimde B, Verpoest I. Improving the properties of UD flax fibre reinforced composites by applying an alkaline fibre treatment. Composites Part A: Applied Science and Manufacturing, 2006, 37: p. 1368-1376.
10. Baets J, Plastria D, Ivens J, Verpoest I. Determination of the optimal flax fibre preparation for use in UD-epoxy composites, in 4th International Conference on Sustainable Materials, Polymers and Composites. 6-7 July 2011. Birmingham, UK.
11. Boey F, Lye SW. Void reduction in autoclave processing of thermoset composites: Part 1: High pressure effects on void reduction. Composites, 1992, 23(4): p. 261-265.
12. Anderson J, Altan MC. Properties of composite cylinders fabricated by bladder assisted composite manufacturing. Journal of Engineering Materials and Technology, 2012, 134: p. 1-7.
13. Ghiorse S. Effect of void content on the mechanical properties of carbon/epoxy laminates, in SAMPE Quarterly, 1993. p. 54-59.
14. Madsen B, Thygesen, A, Liholt, H. Plant fibre composites - Porosity and stiffness. Composites Science and Technology, 2009, 69: p. 1057-1069.
15. Madsen B, Lilholt H. Physical and mechanical properties of unidirectional plant fibre composites - an evaluation of the influence of porosity. Composites Science and Technology, 2003, 63: p. 1265-1272.
16. Zhang L, Miao M. Commingled natural fibre/polypropylene wrap spun yarns for structured thermoplastic composites. Composites Science and Technology, 2010, 70: p. 130-135.
17. Madsen B, Hoffmeyer P, Lilholt H. Hemp yarn reinforced composites – II. Tensile properties. Composites Part A: Applied Science and Manufacturing, 2007, 38: p. 2204-2215.
18. Lee B, Kim HJ, Yu WR. Fabrication of long and discontinuous natural fiber reinforced polypropylene biocomposites and their mechanical properties. Fibers and Polymers, 2009, 10(1): p. 83-90.
19. Zarate C, Aranguren MI, Reboredo MM. Influence of fiber volume fraction and aspect ratio in resol-sisal composites. Journal of Applied Polymer Science, 2003, 89: p. 2714-2722.
20. Rodríguez E, Petrucci R, Puglia D, Kenny JM, Vazquez A. Characterization of composites based on natural and glass fibers obtained by vacuum infusion. Journal of Composite Materials, 2005, 39(5): p. 265-282.
21. Oksman K, Wallstrom L, Berglund LA, Filho RDT. Morphology and mechanical properties of unidirectional sisal-epoxy composites. Journal of Applied Polymer Science, 2002, 84: p. 2358-2365.
22. Roe P, Ansell MP. Jute-reinforced polyester composites. Journal of Materials Science, 1985, 20: p. 4015-4020.
23. Goutianos S, Peijs T. The optimisation of flax fibre yarns for the development of high-performance natural fibre composites. Advanced Composites Letters, 2003, 12(6): p. 237-241.

Chapter 3
Page | 94
24. Baley C. Analysis of the flax fibres tensile behaviour and analysis of the tensile stiffness increase. Composites Part A: Applied Science and Manufacturing, 2002, 33: p. 939-948.
25. Virk A, Hall W, Summerscales J. Tensile properties of jute fibres. Materials Science and Technology, 2009, 25(10): p. 1289-1295.
26. Thygesen A. Properties of hemp fibre polymer composites - An optimisation of fibre properties using novel defibration methods and fibre characterisation. PhD, 2006. The Royal Agricultural and Veterinary University of Denmark: Roskilde, Denmark.
27. Lilholt H, Bjerre AB. Composites based on jute-fibres and polypropylene matrix, their fabrication and characterization, in 18th Risø international symposium on materials science. Polymeric composites – expanding the limits. 1997. Roskilde, Denmark: Risø National Laboratory.
28. Baley C, Perrot Y, Busnel F, Guezenoc H, Davies P. Transverse tensile behaviour of unidirectional plies reinforced with flax fibres. Materials Letters, 2006, 60: p. 2984-2987.
29. Naik N, Singh MN. Twisted Impregnated Yarns: Shear strength. Journal of the Textile Institute, 2001, 92(2): p. 164-183.
30. Fu S, Lauke B, Mader E, Yue CY, Hu X. Tensile properties of short-glass-fiber- and short-carbon-fiber-reinforced polypropylene composites. Composites Part A: Applied Science and Manufacturing, 2007, 31: p. 1117-1125.
31. Placet V, Trivaudey F, Cisse O, Gucheret-Retel V, Boubakar ML. Diameter dependence of the apparent tensile modulus of hemp fibres: A morphological, structural or ultrastructural effect? Composites Part A: Applied Science and Manufacturing, 2012, 43(2): p. 275-287.
32. Charlet K, Jernot JP, Moussa G, Baley C, Bizet L, Breard J. Morphology and mechanical behaviour of a natural composite: the flax fiber, in 16th International Conference on Composite Materials (ICCM-16). 2007. Kyoto, Japan.
33. Awal A, Cescutti G, Ghosh SB, Mussig J. Interfacial studies of natural fibre/polypropylene composites using single fibre fragmentation test (SFFT). Composites Part A: Applied Science and Manufacturing, 2011, 42: p. 50-56.
34. Garkhail S, Heijenrath RWH, Peijs T. Mechanical properties of natural-fibre-mat-reinforced thermoplastics based on flax fibres and polypropylene. Applied Composite Materials, 2000, 7: p. 351-372.
35. Bos H. The potential of flax fibres as reinforcement for composite materials. PhD, 2004. Technische Universiteit Eindhoven: Eindhoven, Netherlands.
36. Mwaikambo L, Tucker N, Clark AJ. Mechanical properties of hemp-fibre-reinforced euphorbia composites. Macromolecular Materials and Engineering, 2007, 292: p. 993-1000.
37. Bos H, Mussig J, van den Oever MJA. Mechanical properties of short-flax-fibre reinforced compounds. Composites Part A: Applied Science and Manufacturing, 2006, 37: p. 1591-1604.
38. Sawpan M, Pickering KL, Fernyhough A. Analysis of mechanical properties of hemp fibre reinforced unsaturated polyester composites. Journal of Composite Materials, 2012, (In Press). doi:10.1177/0021998312449028.
39. Vallejos M, Espinach FX, Julián F, Torres LI, Vilaseca F, Mutjé P. Micromechanics of hemp strands in polypropylene composites. Composites Science and Technology, 2012, 72: p. 1209-1213.
40. Weyenberg I, Ivens J, Coster A, Kino B, Baetens E, Verpoest I. Influence of processing and chemical treatment of flax fibres on their composites. Composites Science and Technology, 2003, 63: p. 1241-1246.
41. Franck R, ed. Bast and other plant fibres. 2005. CRC Press LLC: Boca Raton.

Mechanical properties of PFRPs: Effect of fibre/yarn and matrix type
Page | 95
42. Virk A, Hall W, Summerscales J. Modulus and strength prediction for natural fibre composites. Materials Science and Technology, 2012, 28(7): p. 864-871.
43. Cox H. The elasticity and strength of paper and other fibrous materials. British Journal of Applied Physics, 1952, 3: p. 72-79.
44. Kelly A, Tyson WR. Tensile properties of fibre-reinforced metals: Copper/tungsten and copper/molybdenum. Journal of the Mechanics and Physics of Solids, 1965, 13(6): p. 329-350.
45. Joffe R, Wallstrom L, Berglund LA. Natural fibre composites based on flax - matrix effects, in International Scientific Colloquium - Modelling for Saving Resources. 2001. Riga, Latvia.
46. Ashby M. Materials selection in mechanical design, 1992. Oxford, UK: Pergamon Press.
47. McLaughlin E, Tait RA. Fracture mechanism of plant fibres. Journal of Materials Science, 1980, 15: p. 89-95.
48. Mukherjee P, Satyanarayana KG. An empirical evaluation of structure-property relationships in natural fibres and their fracture behaviour. Journal of Materials Science, 1986, 21: p. 4162-4168.
49. Madsen B, Mehmood S, Aslan M. Variability in properties of natural fibres, in NATEX Workshop. 2012. Chesterfield, UK.
50. Hanninen T, Thygesen A, Mehmood S, Madsen B, Hughes M. Mechanical processing of bast fibres: The occurrence of damage and its effect on fibre structure. Industrial Crops and Products, 2012, 39: p. 7-11.
51. Pickering K, ed. Properties and performance of natural-fibre composites. 2008. CRC Press LLC: Boca Raton.
52. Oksman K. High quality flax fibre composites manufactured by the resin transfer moulding process. Journal of Reinforced Plastics and Composites, 2001, 20(7): p. 621-627.
53. Gassan J, Bledzki AK. Possibilities for improving the mechanical properties of jute/epoxy composites by alkali treatment of fibres. Composites Science and Technology, 1999, 59: p. 1303-1309.
54. Charlet K, Jernot JP, Gomina M, Bizet L, Bréard J. Mechanical properties of flax fibers and of the derived unidirectional composites. Journal of Composite Materials, 2010, 44(24): p. 2887-2896.
55. Wambua P, Ivens J, Verpoest I. Natural fibres: can they replace glass in fibre reinforced plastics? Composites Science and Technology, 2003, 63: p. 1259-1264.
56. Pavithran C, Mukherjee PS, Brahmakumar M, Damodaran AD. Impact properties of natural fibre composites. Journal of Materials Science Letters, 1987, 6: p. 882-884.
57. Santulli C. Impact properties of glass/plant fibre hybrid laminates. Journal of Materials Science, 2007, 42: p. 3699-3707.
58. Yuanjian T, Isaac, DH. Impact and fatigue behaviour of hemp fibre composites. Composites Science and Technology, 2007, 67: p. 3300-3307.
59. Nunna S, Chandra PR, Shrivastava S, Jalan AK. A review on mechanical behavior of natural fiber based hybrid composites. Journal of Reinforced Plastics and Composites, 2012, 31: p. 759-769.