3.2 overview of assessment modeling based on data availability assessment... · swfsc, frd july...
TRANSCRIPT

SWFSC, FRD
July 2013
3.2 Overview of Assessment Modeling
Based on Data Availability Kevin Piner
U.S. Department of Commerce | National Oceanic and Atmospheric Administration | NOAA Fisheries | Page 2
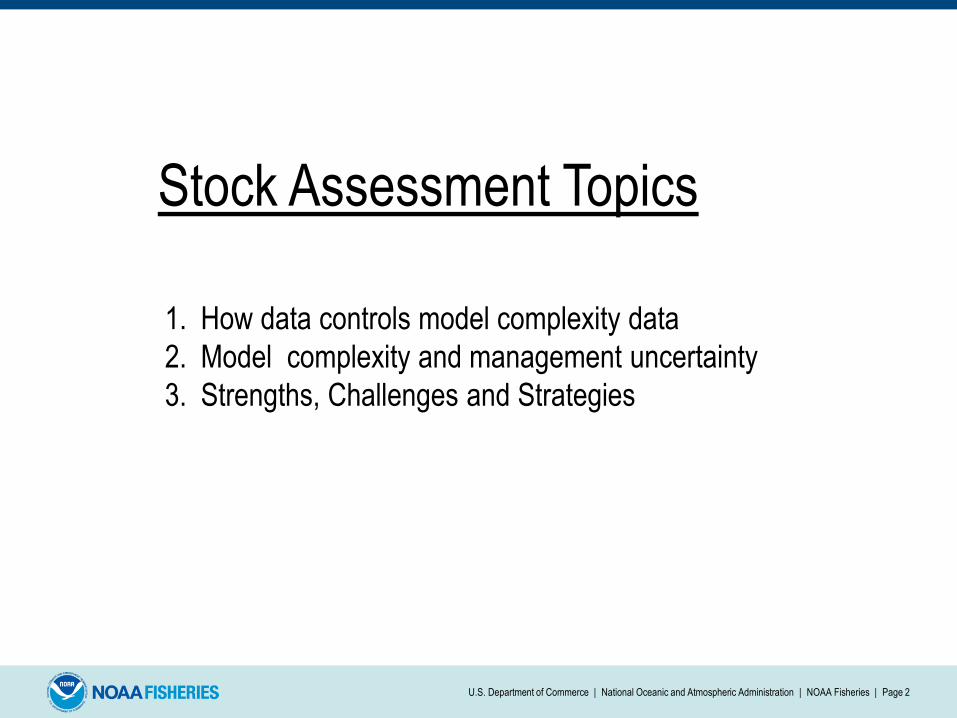
Stock Assessment Topics
1. How data controls model complexity data
2. Model complexity and management uncertainty
3. Strengths, Challenges and Strategies
U.S. Department of Commerce | National Oceanic and Atmospheric Administration | NOAA Fisheries | Page 3
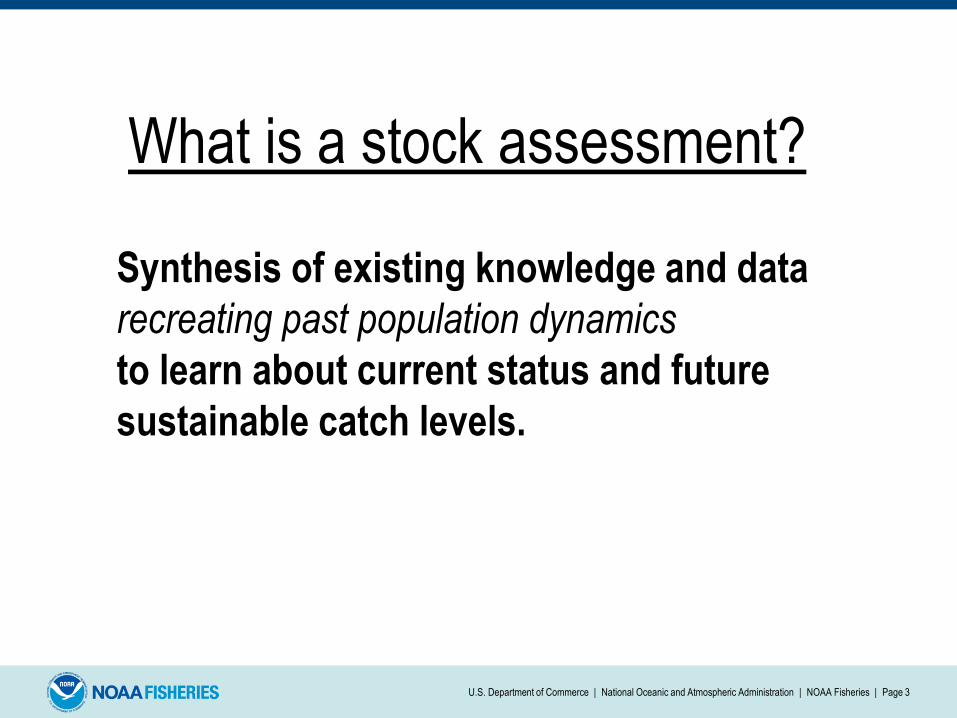
What is a stock assessment?
Synthesis of existing knowledge and data
recreating past population dynamics
to learn about current status and future
sustainable catch levels.
U.S. Department of Commerce | National Oceanic and Atmospheric Administration | NOAA Fisheries | Page 4
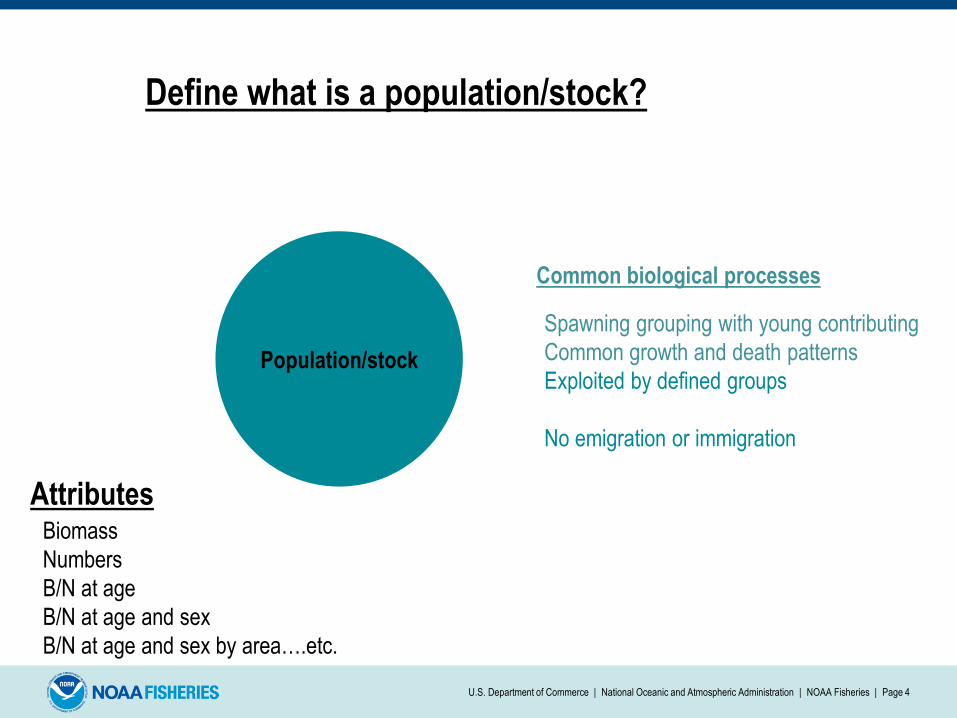
Population/stock
Define what is a population/stock?
Common biological processes
Spawning grouping with young contributing
Common growth and death patterns
Exploited by defined groups
No emigration or immigration
Attributes Biomass
Numbers
B/N at age
B/N at age and sex
B/N at age and sex by area….etc.

U.S. Department of Commerce | National Oceanic and Atmospheric Administration | NOAA Fisheries | Page 5
Population
additions subtractions
Stock Assessments are Population Models
Processes controls
dynamics
Parameters control
process
U.S. Department of Commerce | National Oceanic and Atmospheric Administration | NOAA Fisheries | Page 6
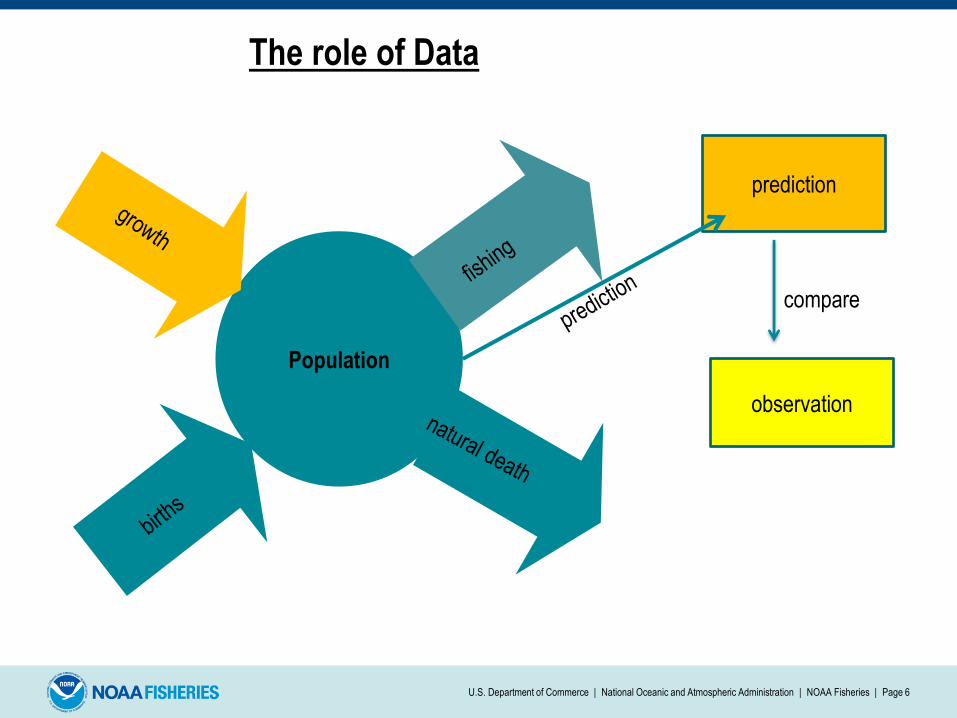
Population
The role of Data
observation
prediction
compare

U.S. Department of Commerce | National Oceanic and Atmospheric Administration | NOAA Fisheries | Page 7
Population
Dynamic Population Models
year 1 year 2 year 3 year 4………………….year n
observation
expectation
compare
dynamics

U.S. Department of Commerce | National Oceanic and Atmospheric Administration | NOAA Fisheries | Page 8
The Basics…….
Catch
and
Index of Abundance

U.S. Department of Commerce | National Oceanic and Atmospheric Administration | NOAA Fisheries | Page 9
Catch : what have we removed from the population
Population
Catch=Kills Includes fish not kept!
Blue Shark “catch”

U.S. Department of Commerce | National Oceanic and Atmospheric Administration | NOAA Fisheries | Page 10
Indices of abundance: Tell us how population abundance changes
Population
Fishery Independent vs Fishery Dependent
Absolute vs Relative
Pacific Bluefin Tuna CPUE

U.S. Department of Commerce | National Oceanic and Atmospheric Administration | NOAA Fisheries | Page 11
Population Intrinsic rate of
increase catch
• Data (minimal): catch and index of abundance
• Complexity/Realism: Incorporates all processes
(recruitment, growth, and natural mortality) into a single
aggregate function of production
• Few but Strong assumptions
Biomass Dynamic (production models)

U.S. Department of Commerce | National Oceanic and Atmospheric Administration | NOAA Fisheries | Page 12
Additional Data
Nt+1 = Nt e -Zt
age
num
ber
0 5 10 15 20 0
10
20
30
40
50
60
70
80
leng
th
age
Population
Life History:
How fast do they grow
when are they mature
How quickly do they die naturally
Assume this process!
Spawners
Rec
ruits
U.S. Department of Commerce | National Oceanic and Atmospheric Administration | NOAA Fisheries | Page 13
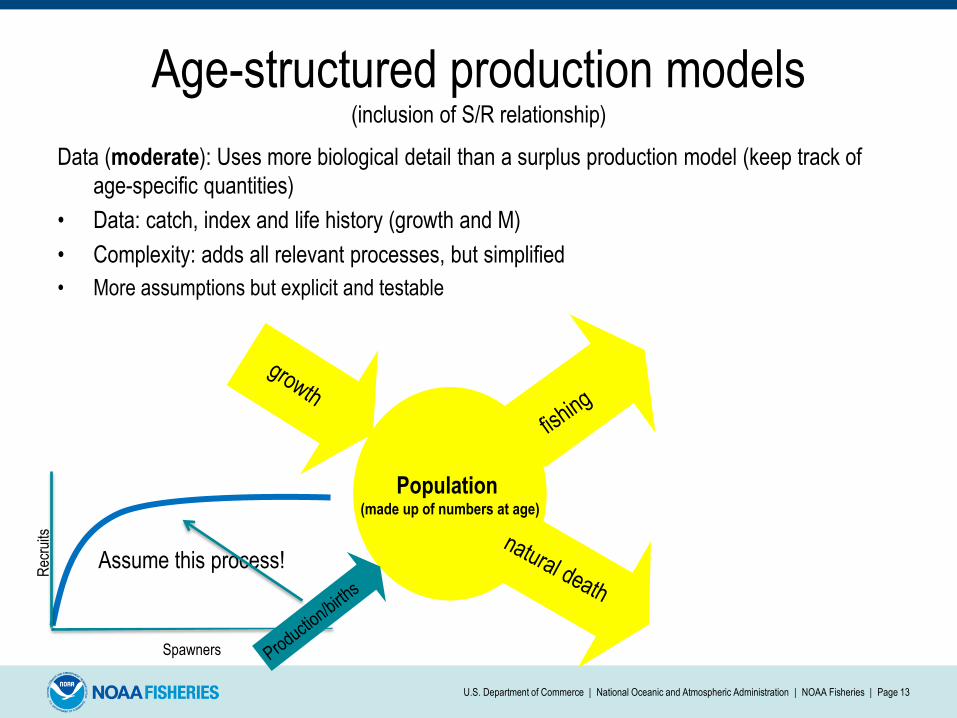
Age-structured production models (inclusion of S/R relationship)
Data (moderate): Uses more biological detail than a surplus production model (keep track of
age-specific quantities)
• Data: catch, index and life history (growth and M)
• Complexity: adds all relevant processes, but simplified
• More assumptions but explicit and testable
Population (made up of numbers at age)

age
1977
0.01
0.02
0.03
0.04
0.05
0.06
1980
0.02
0.04
0.06
0.08
0.10
1983
0.02
0.04
0.06
0.08
0.10
0.12
1989 0.02
0.04
0.06
0.08
1992
0.02
0.04
0.06
0.08
0.10
0.12
0.14
1995
0.01
0.02
0.03
0.04
0.05
0.06
2001
0 5 15 25
0.02
0.04
0.06
0.08
0.10
0.12
0.14
Age compositions
U.S. Department of Commerce | National Oceanic and Atmospheric Administration | NOAA Fisheries | Page 14
Biological data: demographics of the population
Population

U.S. Department of Commerce | National Oceanic and Atmospheric Administration | NOAA Fisheries | Page 15
• Data (rich)- catch, index, life history and composition
• Complexity: With appropriate data, almost all processes can be modeled explicitly
• Assume that the processes match reality
• Full dynamics can be estimated- e.g. Year-specific births
Age Structured Models
Population (made up of numbers at age
Spawners
Rec
ruits

U.S. Department of Commerce | National Oceanic and Atmospheric Administration | NOAA Fisheries | Page 16
Truly data intensive models!
Spatial patterns and movement
Multi-species and Ecosystem

U.S. Department of Commerce | National Oceanic and Atmospheric Administration | NOAA Fisheries | Page 17
• TRULY Data intensive- Need all the information of previous models and MOVEMENT between areas
Spatially Structured models
Population Population movement
Things common to areas
Area 1 Area 2
U.S. Department of Commerce | National Oceanic and Atmospheric Administration | NOAA Fisheries | Page 18
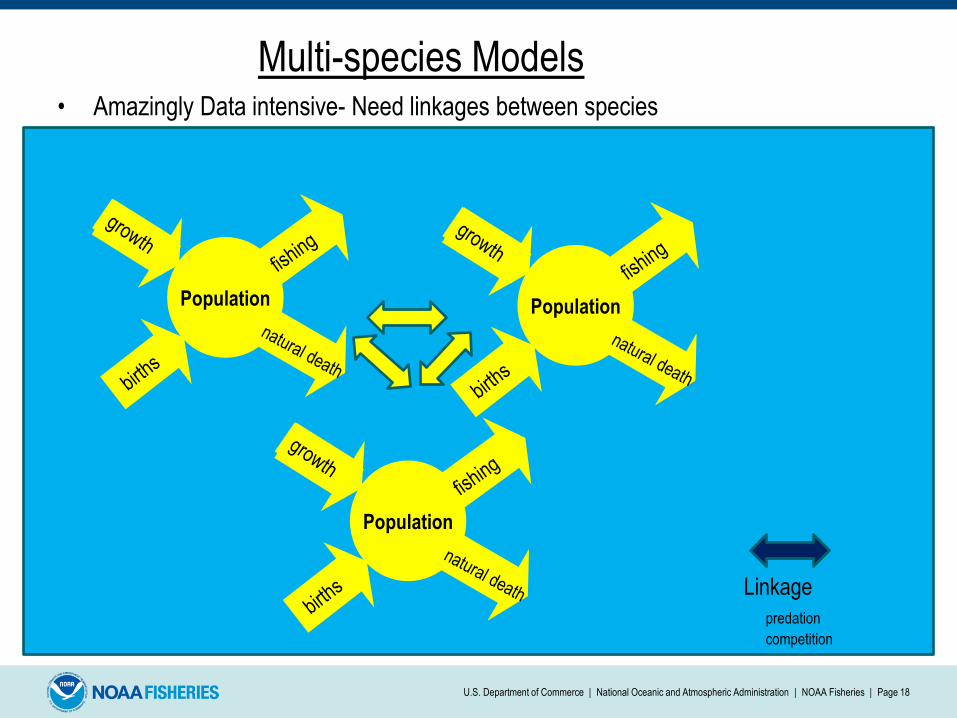
• Amazingly Data intensive- Need linkages between species
Multi-species Models
Population Population
Population
Linkage
predation
competition

U.S. Department of Commerce | National Oceanic and Atmospheric Administration | NOAA Fisheries | Page 19
Population models are a tradeoff of complexity and realism
Simple models
Complex models
Data needed Model realism Assumptions

U.S. Department of Commerce | National Oceanic and Atmospheric Administration | NOAA Fisheries | Page 20
ADDED INFORMATION (Complexity and Costs)
RE
CO
MM
EN
DE
D
CA
TC
H L
EV
EL
^ ^
^ ^
^
Why does assessment complexity/realism matter…………
^ ^

Strengths
U.S. Department of Commerce | National Oceanic and Atmospheric Administration | NOAA Fisheries | Page 21
Challenges
Strategies
Range of models to match data complexity
Models contain enough process to match most situations
Increasing our understanding of how to use model process
to emphasize important data types and minimize others- e.g. time varying selection
Data for important model processes still missing- e.g. movement
Improve understanding of biology and improved data collection to better incorporate
relevant model process