3.2 tanglewood i - montgomery county maryland · 3.2-1 3.2 tanglewood i regional stormwater pond...
TRANSCRIPT

Potomac River

Anacostia River

Little Paint Branch

3.2-1
3.2 Tanglewood I Regional Stormwater Pond Retrofit
3.2.1 Introduction The Tanglewood I Regional Stormwater Pond retrofit project was constructed in 2001. The Tanglewood stormwater pond drains into an unnamed tributary of Little Paint Branch, which has been classified as a Use I stream in the Tanglewood subwatershed of the larger Little Paint Branch watershed (Figure 3.2.1). The project site is located downstream of the Beethoven Boulevard crossing of the Fairland tributary to Little Paint Branch. The goal of the project was to upgrade the existing dry pond facility into a wet pond facility in order to reduce peak storm flows and velocities, and thereby reduce bank erosion, and improve fish habitat. The project also increases wetland coverage in the area.
Subwatershed facts
Subwatershed Drainage Area: 644 acres Subwatershed Imperviousness: 23 percent
Project Facts
Project Area: The Tanglewood I stormwater management pond is an in-line facility located downstream of the Beethoven Boulevard crossing of the Fairland tributary to Little Paint Branch. This pond captures drainage from the residential areas located east of Old Columbia Pike, north of Fairland Road, and south of the Intercounty Connector (MD 200). Costs: Structural ($705,508) Funded in part by United States Army Corps of Engineers (USACE) and the Maryland Department of Natural Resources (MD DNR) Completion Date: January 2001 Property Ownership: Private
Project Selection
The Anacostia River Watershed Restoration Agreement of 1987 committed Montgomery County and other local and state governments to take steps to restore streams within the Anacostia River basin that have been damaged by intense urbanization. Some sections of Little Paint Branch and its tributaries have experienced impairments to stream aquatic biodiversity as watershed development has caused changes in the volume of water in Little Paint Branch during storms, leading to streambank erosion and reduced water quality. Studies conducted under the Anacostia watershed restoration effort identified seventeen potential sites in Little Paint Branch where remedial projects could be undertaken. The Tanglewood I pond retrofit project is one of the projects that was identified.
Pre-Restoration Conditions
Prior to the pond retrofit of Tanglewood I, the pond filled during storms and drained down over a period of one to three days. At times other than immediately after a storm, the pond was dry except for the perennial stream flowing through the pond bottom.

3.2-2
Figure 3.2.1 – Vicinity Map of Tanglewood I and II Restoration Projects

3.2-3
Restoration Actions Taken
The modifications of Tanglewood I included excavation of a permanent wet pond and wetland marsh within the dry pond area. Wetland forebays were constructed at the storm drain outfalls. Figure 3.2.2 shows aerial images of the pond before and after the retrofit occurred. The pond maintenance benches serve a dual purpose of providing maintenance access and extending the flow path for storm flows entering the pond from storm drain outfalls. This increases detention time and improves pollutant removal. Modifications were also made to the pond control structure to reduce maintenance needs and improve the safety of the pond.
Figure 3.2.2 – Tanglewood I Regional Stormwater Pond Retrofit, aerial images from 1998 (pre-retrofit) and 2010 (post-retrofit)
Pond safety, aesthetics and fish and wildlife habitat enhancement opportunities were carefully considered and addressed in the pond design. For example, pond shoreline areas were gently configured to limit the maximum steepness of adjacent slopes to 3:1 (horizontal:vertical). A fence around the pond was required to meet County codes. The wet pond and marsh provide habitat for water fowl and the establishment of wetland plants. The establishment of these plants improves the overall aesthetic appearance of the pond and increases its wildlife habitat value. Trees (such as red maple, pin oak, etc) were planted to create a visually pleasing and diverse landscape and to increase the amount of forested wetlands in the watershed. Figures 3.2.3 and 3.2.4 show images of the pond before and after its retrofit.
1998 2010

3.2-4
Figure 3.2.3 – Tanglewood I Stormwater Pond in 1998 (Pre-Retrofit)
Figure 3.2.4 – Tanglewood I Stormwater Pond in 2009 (Post-Retrofit)
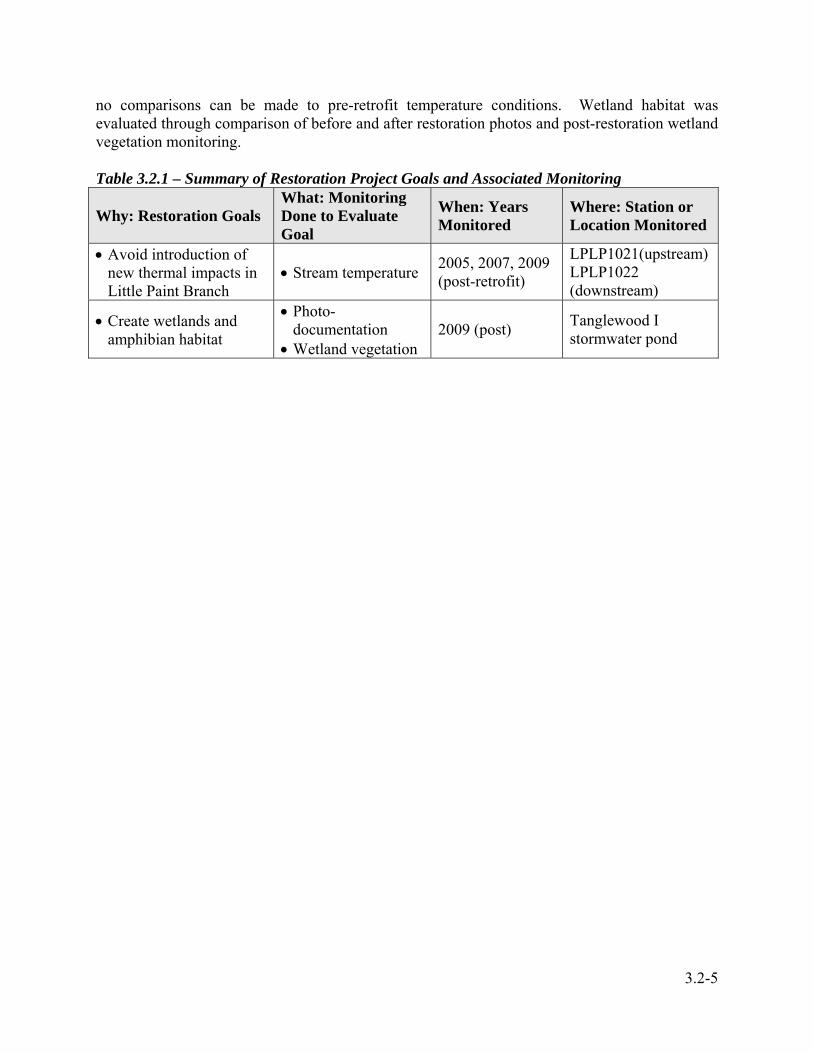
3.2.2 Restoration Goals Restoration goals were defined during the planning and implementation of the Tanglewood I project. This is a fifth year monitoring report and summarizes the post-restoration conditions within the project area. Table 3.2.1 below presents the restoration goals, monitoring performed to evaluate the success of the goals, and when and where the monitoring occurred.
3.2.3 Methods to Measure Project Goals The restoration monitoring examined whether the stormwater facility retrofit contributed any temperature impacts and evaluated the creation of wetlands and amphibian habitat (Table 3.2.1). Data were collected within the pond itself and at two sites in the vicinity of the restoration project, LPLP1021, located upstream of the retrofitted pond and LPLP1022, located downstream of the pond (Figure 3.2.5). However, pre-restoration temperature data were not available, thus
3.2-5
no comparisons can be made to pre-retrofit temperature conditions. Wetland habitat was evaluated through comparison of before and after restoration photos and post-restoration wetland vegetation monitoring. Table 3.2.1 – Summary of Restoration Project Goals and Associated Monitoring
Why: Restoration Goals What: Monitoring Done to Evaluate Goal
When: Years Monitored
Where: Station or Location Monitored
• Avoid introduction of new thermal impacts in Little Paint Branch
• Stream temperature 2005, 2007, 2009 (post-retrofit)
LPLP1021(upstream) LPLP1022 (downstream)
• Create wetlands and amphibian habitat
• Photo-documentation
• Wetland vegetation 2009 (post) Tanglewood I
stormwater pond

3.2-6
Figure 3.2.5 – Map of Monitoring Locations at Tanglewood I and II Stormwater Ponds

3.2-7
3.2.4 Results and Analysis
Temperature
Pre-construction stream temperature data was not collected in the vicinity of the Tanglewood I Stormwater Pond. In the post-construction period, two data loggers were deployed at sites LPLP1021 and LPLP1022, in 2005, 2007, and 2009. LPLP1021 was located upstream of the stormwater pond, while LPLP1022 was placed downstream of the pond outfall. Table 3.2.2 provides minimum, maximum, and average temperatures at both stations, and the differences between these values in 2005, 2007, and 2009. None of the temperature readings exceeded the Use Class I temperature standard of 90°F. In 2005, the average temperatures at LPLP1021 and LPLP1022 were 64.5°F and 69.9°F, respectively. In 2007, average temperatures at LPLP1021 and LPLP1022 were 68.4°F and 76.3°F, respectively. In 2009, average temperatures at LPLP1021 and LPLP1022 were 67.7°F and 75.2°F, respectively. A paired t-test was performed on the 2009 data, comparing the means between the upstream site (LPLP1021) and the downstream site (LPLP1022) yielding a highly significant difference (p value <0.0001), with the stream temperatures downstream having a statistically higher mean than upstream of the pond.
Table 3.2.2 – Post-retrofit Minimum, Maximum, and Average Stream Temperatures Upstream (LPLP1021) and Downstream (LPLP1022) of the Tanglewood I Stormwater Pond
Date 2005 2007 2009 Location US DS ∆* US DS ∆* US DS ∆*
Min Temp (°F) 56.0 61.1 5.1 58.8 63.5 4.7 58.3 62.4 4.1Max Temp (°F) 76.5 78.4 1.8 77.4 86.2 8.8 76.9 83.8 6.9
Average Temp (°F) 64.5 69.9 5.4 68.4 76.3 7.9 67.7 75.2 7.5* The delta symbol (∆) is used to represent change in temperature from upstream to downstream
Post-retrofit temperature profiles from 2005, 2007, and 2009 are plotted and presented below in Figures 3.2.6 - 3.2.9. The graphs display temperature data from upstream and downstream of the stormwater pond, local air temperature, and total daily rainfall. Rainfall data were obtained from the Weather Underground KMDSILVE11 weather station located in Calverton, MD, approximately one mile from the pond. In all three years after the retrofit of the Tanglewood I stormwater pond, temperatures were higher downstream than upstream, but reflected similar warming and cooling patterns. Additionally, most stream warming and cooling that occurred corresponded to increases or decreases in summer air temperature; this is particularly evident in 2009. In 2007, summer stream temperatures were warmer overall than in 2005 and 2009; although, average air temperatures were warmer in 2005 than in 2007 and 2009. In 2005, approximately 10 inches of rain fell in the summer, 8 inches of rain fell in 2007, and 18 inches of rain fell in the summer of 2009. In 2005, average stream temperatures were lower than in other years. In 2007, when rainfall totals were lowest of all years, stream temperatures were higher than in all other years.

3.2-8
Figure 3.2.6 – 2005 Stream Temperature Upstream and Downstream of Tanglewood I Stormwater Pond
Figure 3.2.7 – 2007 Stream Temperature Upstream and Downstream of Tanglewood I Stormwater Pond
45
50
55
60
65
70
75
80
85
90
95
06/01/0500:24:00.0
06/09/0508:24:00.0
06/17/0516:24:00.0
06/26/0500:24:00.0
07/04/0508:24:00.0
07/12/0516:24:00.0
07/21/0500:24:00.0
07/29/0508:24:00.0
08/06/0516:24:00.0
08/15/0500:24:00.0
08/23/0508:24:00.0
08/31/0516:24:00.0
09/09/0500:24:00.0
09/17/0508:24:00.0
09/25/0516:24:00.0
Date/Time
Stre
am T
empe
ratu
re (°
F)
0
0.5
1
1.5
2
2.5
Tota
l Dai
ly R
ainf
all (
inch
es)
RainfallUpstreamDownstreamAirUse Class I (90°F)
45
50
55
60
65
70
75
80
85
90
95
06/09/0707:36:00.0
06/17/0715:36:00.0
06/25/0723:36:00.0
07/04/0707:36:00.0
07/12/0715:36:00.0
07/20/0723:36:00.0
07/29/0707:36:00.0
08/06/0715:36:00.0
08/14/0723:36:00.0
08/23/0707:36:00.0
08/31/0715:36:00.0
09/08/0723:36:00.0
09/17/0707:36:00.0
09/25/0715:36:00.0
Date/Time
Stre
am T
empe
ratu
re (°
F)
0
0.5
1
1.5
2
2.5
Rai
nfal
l (in
ches
)
RainfallUpstreamDownstreamAirUse Class I (90°F)

3.2-9
Figure 3.2.8 – Stream Temperature Upstream and Downstream of Tanglewood I Stormwater Pond from June 1st through July 31st, 2009
Figure 3.2.9 – Stream Temperature Upstream and Downstream of Tanglewood I Stormwater Pond from August 1st through September 30th 2009
In addition to analyzing average temperatures over the summer sampling period, two storm events were analyzed to determine the impact of the stormwater pond on the downstream receiving waters. For each storm event, stream temperature readings at both sites were plotted
Tanglewood I Stormwater Pond Temperature Data from June 1, 2009 through July 31, 2009
45
50
55
60
65
70
75
80
85
90
95
6/1/20
09
6/3/20
09
6/5/20
09
6/7/20
09
6/9/20
09
6/11
/200
9
6/13
/200
9
6/15
/200
9
6/17
/200
9
6/19
/200
9
6/21
/200
9
6/23
/200
9
6/25
/200
9
6/27
/200
9
6/29
/200
9
7/1/20
09
7/3/20
09
7/5/20
09
7/7/20
09
7/9/20
09
7/11
/200
9
7/13
/200
9
7/15
/200
9
7/17
/200
9
7/19
/200
9
7/21
/200
9
7/23
/200
9
7/25
/200
9
7/27
/200
9
7/29
/200
9
7/31
/200
9
Date
Tem
pera
ture
(°F
)
0
0.25
0.5
0.75
1
1.25
1.5
1.75
2
2.25
2.5
Prec
ipita
tion
(in)
Precipitation
LPLP1021 (US)
LPLP1022 (DS)
Air Temp.
Tanglewood I Stormwater Pond Temperature Data from August 1, 2009 through September 30, 2009
45
50
55
60
65
70
75
80
85
90
95
8/1/20
09
8/3/20
09
8/5/20
09
8/7/20
09
8/9/20
09
8/11
/200
9
8/13
/200
9
8/15
/200
9
8/17
/200
9
8/19
/200
9
8/21
/200
9
8/23
/200
9
8/25
/200
9
8/27
/200
9
8/29
/200
9
8/31
/200
9
9/2/20
09
9/4/20
09
9/6/20
09
9/8/20
09
9/10
/200
9
9/12
/200
9
9/14
/200
9
9/16
/200
9
9/18
/200
9
9/20
/200
9
9/22
/200
9
9/24
/200
9
9/26
/200
9
9/28
/200
9
9/30
/200
9
Date
Tem
pera
ture
(°F
)
0
0.25
0.5
0.75
1
1.25
1.5
1.75
2
2.25
2.5
Prec
ipita
tion
(in)
Precipitation
LPLP1021 (US)
LPLP1022 (DS)
Air Temp.
3.2-10
together. Air temperature and precipitation were also plotted, including at least 12 hours prior to the storm period where no rainfall occurred and through the day of the storm.
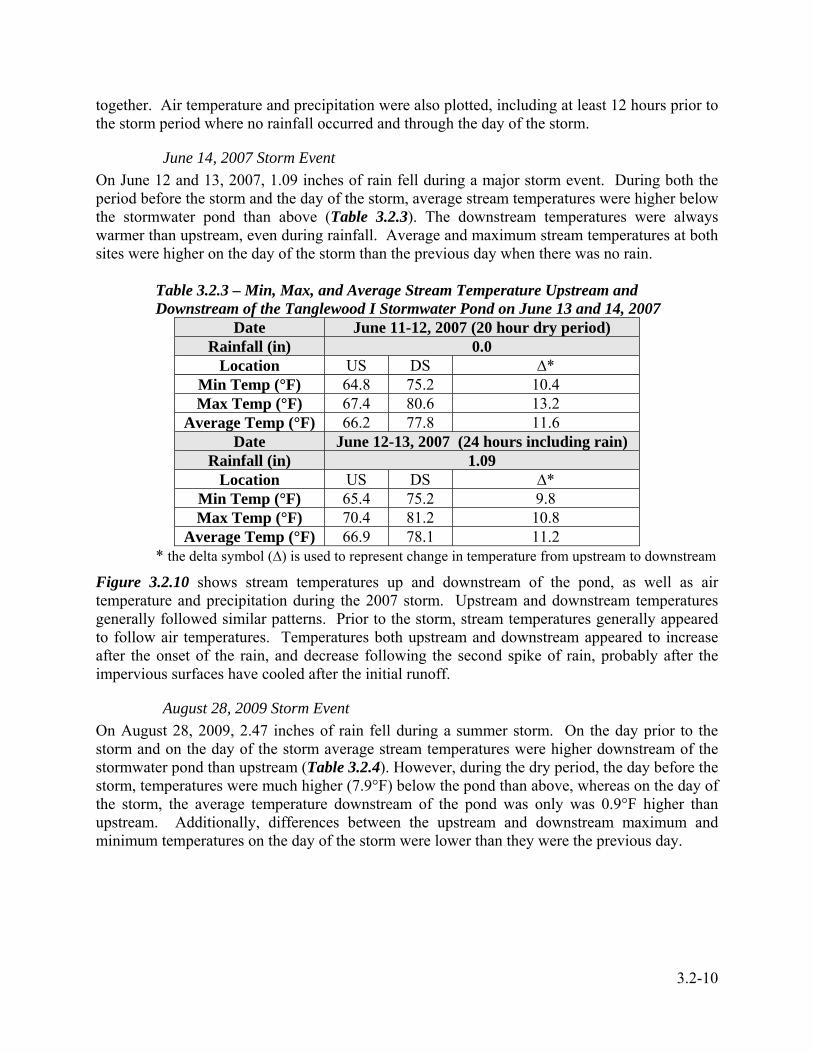
June 14, 2007 Storm Event On June 12 and 13, 2007, 1.09 inches of rain fell during a major storm event. During both the period before the storm and the day of the storm, average stream temperatures were higher below the stormwater pond than above (Table 3.2.3). The downstream temperatures were always warmer than upstream, even during rainfall. Average and maximum stream temperatures at both sites were higher on the day of the storm than the previous day when there was no rain.
Table 3.2.3 – Min, Max, and Average Stream Temperature Upstream and Downstream of the Tanglewood I Stormwater Pond on June 13 and 14, 2007
Date June 11-12, 2007 (20 hour dry period) Rainfall (in) 0.0
Location US DS ∆* Min Temp (°F) 64.8 75.2 10.4 Max Temp (°F) 67.4 80.6 13.2
Average Temp (°F) 66.2 77.8 11.6 Date June 12-13, 2007 (24 hours including rain)
Rainfall (in) 1.09 Location US DS ∆*
Min Temp (°F) 65.4 75.2 9.8 Max Temp (°F) 70.4 81.2 10.8
Average Temp (°F) 66.9 78.1 11.2 * the delta symbol (∆) is used to represent change in temperature from upstream to downstream
Figure 3.2.10 shows stream temperatures up and downstream of the pond, as well as air temperature and precipitation during the 2007 storm. Upstream and downstream temperatures generally followed similar patterns. Prior to the storm, stream temperatures generally appeared to follow air temperatures. Temperatures both upstream and downstream appeared to increase after the onset of the rain, and decrease following the second spike of rain, probably after the impervious surfaces have cooled after the initial runoff.
August 28, 2009 Storm Event On August 28, 2009, 2.47 inches of rain fell during a summer storm. On the day prior to the storm and on the day of the storm average stream temperatures were higher downstream of the stormwater pond than upstream (Table 3.2.4). However, during the dry period, the day before the storm, temperatures were much higher (7.9°F) below the pond than above, whereas on the day of the storm, the average temperature downstream of the pond was only was 0.9°F higher than upstream. Additionally, differences between the upstream and downstream maximum and minimum temperatures on the day of the storm were lower than they were the previous day.

3.2-11
Figure 3.2.10 – Stream Temperature and Rainfall Data Upstream and Downstream of the Tanglewood I Stormwater Pond on June 11 and 13, 2007
Table 3.2.4 – Min, Max, and Average Stream Temperature Upstream and Downstream of the Tanglewood I Stormwater Pond on June 13 and 14, 2007
Date August 27, 2009 Rainfall (in) 1.12
Location US DS ∆* Min Temperature (°F) 70.3 77.5 7.2 Max Temperature (°F) 73.5 81.7 8.2
Average Temperature (°F) 71.8 79.7 7.9 Date August 28, 2009
Rainfall (in) 0.05 Location US DS ∆*
Min Temp (°F) 72.0 73.0 1.0 Max Temp (°F) 76.9 81.1 4.2
Average Temp (°F) 74.5 75.4 0.9 Figure 3.2.11 shows stream temperatures up and downstream of the pond, as well as air temperature and precipitation rate. As shown in the graph below, the upstream and downstream temperatures followed similar patterns. Downstream temperatures were always a several degrees warmer compared to those upstream, prior to the storm. After the onset of the rain, a slight spike in temperature occurred at both sites. Following the initial spike, stream temperatures cooled at
55
60
65
70
75
80
85
90
95
06/11/0714:24:00.0
06/11/0718:24:00.0
06/11/0722:24:00.0
06/12/0702:24:00.0
06/12/0706:24:00.0
06/12/0710:24:00.0
06/12/0714:24:00.0
06/12/0718:24:00.0
06/12/0722:24:00.0
06/13/0702:24:00.0
06/13/0706:24:00.0
06/13/0710:24:00.0
Date
Stre
am T
empe
ratu
re (°
F)
0
0.05
0.1
0.15
0.2
0.25
0.3
0.35
0.4
0.45
0.5
Rai
nfal
l (in
ches
)
Rain
Air
Upstream
Downstream

3.2-12
both sites and remained in a similar temperature range, with the upstream site often having higher temperatures than the downstream site. Also, the air temperature was cooler during the storm event, which may have been a factor in lowering stream temperatures during this time.
Figure 3.2.11 – Stream Temperature and Rainfall Data Upstream and Downstream of the Tanglewood I Stormwater Pond on August 27th and 28th, 2009
Wetland Vegetation
Pre-restoration wetland vegetation data were not available for this site as the pond was only sparsely vegetated before its retrofit (Figure 3.2.3). The retrofitted Tanglewood I stormwater pond was only monitored for wetland vegetation in 2009. While conducting the 2009 wetland vegetation monitoring, various turtles and frogs were found within the created wetland. Three types of wetlands were observed in 2009, palustrine open water (POW), palustrine emergent (PEM), and palustrine scrub-shrub (PSS) (Figure 3.2.12 and 3.2.13). The two vegetated wetland areas (PEM and PSS) were assessed separately and a total score for the entire site was calculated based on a weighting of the two vegetated wetland area sub-scores determined be the area of each zone (Table 3.2.5). The POW portion accounted for approximately 65 percent area cover within the center of the created wetland, while PEM and PSS wetland vegetation, respectively, comprised 20 and 15 percent cover across the saturated zone at the pond edge. The wettest portions of the vegetated area generally contained herbaceous vegetation, while woody species mostly occurred on slightly raised ground. Based on the dominant species observed, future vegetative cover was estimated to be 20 percent PEM and 30 percent PSS. The total score for the entire site was 89.8 out of a possible 100. All three areas within the site were determined to be wetlands based on vegetation, soils, and hydrology.

3.2-13
Table 3.2.5 – Post-restoration Wetland Vegetation Assessment (2009)
Area Vegetation
Score (out of 30)
Soil Score (out of 20)
Hydrology Score
(out of 30)
Wetland Functional
Gains Score
(out of 20)
Area Total Score (out of 100)
Proportion of Total Credit
(based on sub-area)
Sub-Score
PEM 27 20 25 17 89 0.6 53.4 PSS 24 20 30 17 91 0.4 36.4
Total 89.8 In 2009, the PEM zone was characterized by Juncus effusus (common rush), Hibiscus moscheutos (crimsoneyed rosemallow), Carex sp. (unknown sedge), and Symphyotrichum pilosum (hairy white oldfield aster). Cover estimates for these species were 30, 25, 20, and 12 percent, respectively. The vegetation within the PEM portion of the wetland scored 27 out of 30, the with expected growth of the vegetation individual score rating lower than other individual scores due to the presence of invasives and evidence of beaver. Woody plants were relatively abundant as the wetland fringe has developed into a scrub-shrub zone. The dominant woody plant throughout the wetland in 2009 was Salix nigra (black willow), which accounted for about five percent cover in the PEM zone and 85 percent cover in the PSS zone. Most black willow individuals were above ten feet tall, although the range of heights was observed between three to 20 feet tall. Beaver cuttings were evident on many of the black willows, indicating the future success of these trees may be limited. Several herbaceous plants were dominant in the PSS zone, including Lersia oryzoides (rice cutgrass), pilea pumila (Canadian clearweed), and crimsoneyed rosemallow. Cover estimates for these species were 20, 10, and five percent, respectively. The vegetation within the PSS portion of the wetland scored 24 out of 30, with the diversity of the planned wetland type and expected growth of the plants individual scores rating lower than other individual scores.
Figure 3.2.12 – Tanglewood I Stormwater Pond PEM and PSS Zones (2009, post-retrofit)

3.2-14
Invasive plants were present in both vegetation zones, but did not exceed ten percent cover in either zone. Invasive plants found in both zones included Phragmites australis (common reed) and Persicaria perfoliata (Asiatic tearthumb), while Microstegium vimineum (Nepalese browntop) was restricted to the PSS zone and Arthraxon hispidus (small carpgrass) was found only in the PEM zone. Hydric soils were present throughout the created wetland at the time of the site visit. Redoximorphic features occupied ten percent of the matrix in the soil samples taken from the PEM zone, while soils from the PSS zone did not exhibit redox. A clay layer was found at a depth of 12 inches in the wetter PEM zone, which likely serves as a confining layer. The presence of surface water over much of the year combined with accumulated inputs of decomposing vegetation should lead to continued hydric soil development site-wide. These factors led to a soils score of 20 out of a possible 20 in both of the assessed zones.

3.2-15
Figure 3.2.13 – Tanglewood I Stormwater Pond Vegetation Zones As Assessed in 2009

3.2-16
The site was monitored in early October 2009, after above-average rainfall occurred during the earlier part of the growing season. Thirty percent of the PEM zone was inundated by up to six inches of standing water, while only one percent of the PSS zone was inundated. Saturation within the upper 12 inches of the soil profile was present within approximately 70 percent of the PEM zone and 99 percent of the PSS zone. Other indicators of wetland hydrology evident during the site visit included drainage patterns, drift lines, silt deposition, and water marks. Sources of hydrology to the pond include a perennial watercourse (the pond is hyrdrologically connected to the Little Paint Branch), floodwaters, pond waters, surface runoff, and a perched water table. Hydrology is currently appropriate for the continued success of the PSS zone, but the abundance of surface water in the PEM zone may constitute a limiting factor for the existing vegetation. Therefore, the PSS zone of the wetland received a score of 30 out of 30 points and the PEM zone 25 out of 30, or 83 percent. The wetland complex was determined to provide several biological, hydrologic, and water quality functions, including 1) providing habitat for fish, reptiles, amphibians, and other wetland dependent and non-dependent wildlife, 2) furnishing organic material to aquatic food webs, 3) filtering sediments, pollutants, and excess nutrients, 4) storing, slowing, or reducing stormwater flow, and 5) providing a natural setting for residents to enjoy. Overall, this restoration site appears to support highly functioning wetlands, based on a functional score of 17 out of a possible 20 points for both vegetation zones. Field data sheets for this task are included in Appendix D.
3.2.5 Discussion Table 3.2.6 below provides a summary of project goals, the results of post-restoration monitoring, and whether each project goal was met by the restoration actions in its fifth year of monitoring. One project goal was unsuccessful and one was successfully met by the Tanglewood I Regional stormwater pond retrofit.
Table 3.2.6 - Summary of Project Goal Results Goal Result
Avoiding introduction of new thermal impacts
Unsuccessful – Temperatures below the stormwater pond were consistently higher than above. However, it is impossible to know if the thermal impacts are new without pre-retrofit temperature data
Creating wetlands and amphibian habitat
Successful – PEM, PSS, and POW wetland habitats were documented on the site and amphibian and reptile species were observed at the restoration site
Unsuccessful – Avoiding introduction of new thermal impacts
The Tanglewood I stormwater pond is contributing thermal impacts to downstream waters. Without pre-retrofit temperature data, it is not possible to know if these thermal impacts are new. In all three post-construction monitoring years, stream temperatures measured downstream of the pond were higher than those measured upstream of the pond. In 2009, summer temperatures downstream of the pond were significantly higher (p value <0.0001), than upstream

3.2-17
temperatures. However, none of the readings in any year post-retrofit exceeded the Use I standard of 90°F. Average stream temperatures fluctuated between years and were highest in years with the least amount of rainfall. During dry periods, it appears that water is warming in the pond and being released downstream where it contributes to elevated downstream temperatures. However, during larger rain events, average stream temperatures downstream were more similar to upstream temperatures than on dry days when they were at least 7 degrees higher. This may suggest that during rain events the stormwater pond, while still contributing heated water downstream, may assimilate some of the thermal impacts from the surrounding residential neighborhood. Alternatively, the cooler rain could be mixing with the warmer pond water, decreasing the overall temperature in the pool and decreasing the temperature of the water being released.
Successful – Wetland Creation
Prior to its retrofit, the Tanglewood I stormwater pond was primarily dry, except for immediately after a storm, and excluding the perennial stream flowing through the bottom. Following the retrofit, monitoring results indicate the successful creation of a hydrophytic plant community, the presence of hydric soils, and sufficient hydrology to support a wetland (Figure 3.2.14). Additionally, in 2009, the Tanglewood I stormwater pond was assessed as providing several biological, hydrologic, and water quality functions including: 1) providing habitat for fish, reptiles, amphibians, and other wetland dependent and non-dependent wildlife, 2) furnishing organic material to aquatic food webs, 3) filtering sediments, pollutants, and excess nutrients, 4) storing, slowing, or reducing high flows, 5) and providing a natural setting for residents to enjoy. Additionally, unknown turtles and frogs were observed in the pool on the day of the 2009 site visit, indicating that the pond does, in fact, support herpetofauna species. Overall, the restoration at the Tanglewood I project has met the goal of creating and enhancing wetlands and amphibian habitat.
Figure 3.2.14 – Tanglewood I Stormwater Pond and PEM (2009, post-restoration)

3.2-18
3.2.6 Conclusions Overall, the Tanglewood I stormwater pond restoration has met half of the intended project goals. It has created successfully functioning open water, palustrine emergent, and palustrine scrub-shrub wetlands. Turtle and frog species were observed in the pond during the 2009 monitoring which indicates that this habitat supports amphibian and reptile species. It is unclear whether the retrofit is the cause of new thermal impacts due to lack of pre-retrofit temperature data, but it is evident that the pond is contributing post-retrofit thermal inputs to the stream. Mitigation of this thermal impact may be achieved by reducing mowing and trimming around the pond and allowing trees, shrubs, and pond-side vegetation to grow uninhibited to provide better pond shading. The lack of vegetation and shading for the pond is evident by the post-construction photos, Figures 3.2.2 and 3.2.14, in 2009. Concerns have been raised about greater plant growth potentially causing blockage of the pond outlet and riser with debris from the vegetation. However, without greater shading, it is unlikely that thermal impacts can be easily remediated. Another feasible action to avoid future thermal impacts would be to reduce detention time to reduce warming, even though it could increase downstream discharges, erosion, and reduce the pond water quality capacity. Additionally, increasing the depth of the pond to below the ground water level may help maintain cooler pond water temperatures and prevent the release of heated water downstream. This site should receive continual monitoring of thermal loadings and additional remediation measures to reduce thermal impacts.